DB Corp Q4FY15: Buy for a medium to long term investment
•
1 like•200 views

DB Corp clocks Q4FY15 net profit of INR644.42m, Firstcall recommends for mid- to long-term

Recommended
Recommended
More Related Content
What's hot
What's hot (18)
Viewers also liked
Similar to DB Corp Q4FY15: Buy for a medium to long term investment
Similar to DB Corp Q4FY15: Buy for a medium to long term investment (20)
More from IndiaNotes.com
More from IndiaNotes.com (20)
Recently uploaded
Recently uploaded (20)
DB Corp Q4FY15: Buy for a medium to long term investment
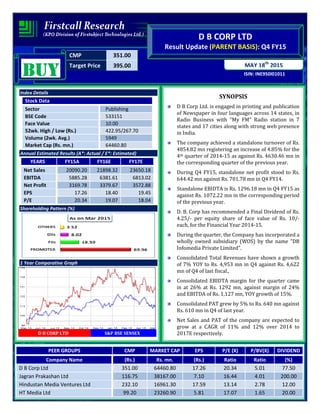
- 1. CMP 351.00 Target Price 395.00 ISIN: INE950I01011 MAY 18th 2015 D B CORP LTD Result Update (PARENT BASIS): Q4 FY15 BUYBUYBUYBUY Index Details Stock Data Sector Publishing BSE Code 533151 Face Value 10.00 52wk. High / Low (Rs.) 422.95/267.70 Volume (2wk. Avg.) 5949 Market Cap (Rs. mn.) 64460.80 Annual Estimated Results (A*: Actual / E*: Estimated) YEARS FY15A FY16E FY17E Net Sales 20090.20 21898.32 23650.18 EBITDA 5885.28 6381.61 6813.02 Net Profit 3169.78 3379.67 3572.88 EPS 17.26 18.40 19.45 P/E 20.34 19.07 18.04 Shareholding Pattern (%) 1 Year Comparative Graph D B CORP LTD S&P BSE SENSEX SYNOPSIS D B Corp Ltd. is engaged in printing and publication of Newspaper in four languages across 14 states, in Radio Business with "My FM" Radio station in 7 states and 17 cities along with strong web presence in India. The company achieved a standalone turnover of Rs. 4854.82 mn registering an increase of 4.85% for the 4th quarter of 2014-15 as against Rs. 4630.46 mn in the corresponding quarter of the previous year. During Q4 FY15, standalone net profit stood to Rs. 644.42 mn against Rs. 701.78 mn in Q4 FY14. Standalone EBIDTA is Rs. 1296.18 mn in Q4 FY15 as against Rs. 1072.22 mn in the corresponding period of the previous year. D. B. Corp has recommended a Final Dividend of Rs. 4.25/- per equity share of face value of Rs. 10/- each, for the Financial Year 2014-15. During the quarter, the Company has incorporated a wholly owned subsidiary (WOS) by the name "DB Infomedia Private Limited". Consolidated Total Revenues have shown a growth of 7% YOY to Rs. 4,953 mn in Q4 against Rs. 4,622 mn of Q4 of last fiscal., Consolidated EBIDTA margin for the quarter came in at 26% at Rs. 1292 mn, against margin of 24% and EBITDA of Rs. 1,127 mn, YOY growth of 15%. Consolidated PAT grew by 5% to Rs. 640 mn against Rs. 610 mn in Q4 of last year. Net Sales and PAT of the company are expected to grow at a CAGR of 11% and 12% over 2014 to 2017E respectively. PEER GROUPS CMP MARKET CAP EPS P/E (X) P/BV(X) DIVIDEND Company Name (Rs.) Rs. mn. (Rs.) Ratio Ratio (%) D B Corp Ltd 351.00 64460.80 17.26 20.34 5.01 77.50 Jagran Prakashan Ltd 116.75 38167.00 7.10 16.44 4.01 200.00 Hindustan Media Ventures Ltd 232.10 16961.30 17.59 13.14 2.78 12.00 HT Media Ltd 99.20 23260.90 5.81 17.07 1.65 20.00
- 2. QUARTERLY HIGHLIGHTS (PARENT BASIS) Results updates- Q4 FY15, Months MAR-15 MAR-14 % Change Net Sales 4854.82 4630.46 4.85 PAT 644.42 701.78 (8.17) EPS 3.51 3.82 (8.26) EBITDA 1296.18 1072.22 20.89 The company net profit stood to Rs. 644.42 million against Rs. 701.78 million in the corresponding quarter ending of previous year, a decrease of 8.17%. The company achieved a turnover of Rs. 4854.82 million registering an increase of 4.85% for the 4th quarter of the current year 2014-15 as against Rs. 4630.46 million in the corresponding quarter of the previous year. Reported earnings per share of the company stood at Rs. 3.51 a share during the quarter as against Rs. 3.82 over previous year period. Profit before interest, depreciation and tax is Rs. 1296.18 million as against Rs. 1072.22 million in the corresponding period of the previous year. Break up of Expenditure Particulars Rs. Millions Q4 FY15 Q4 FY14 % Change Raw Materials consumed 1516.97 1665.93 -9% Depreciation 246.04 169.42 45% Employees Benefit Expenses 902.92 867.64 4% Other Expenditure 1233.34 1097.35 12%
- 3. Latest Updates D. B. Corp Ltd has recommended a Final Dividend @ 42.5% (i.e. Rs. 4.25 per equity share of face value of Rs. 10/- each) for the Financial Year 2014-15. The Company has incorporated a wholly owned subsidiary (WOS) by the name "DB Infomedia Private Limited". The registered office of the WOS is situated at Bhopal, Madhya Pradesh. DB Corp Ltd. remains the highly respected regional news daily by 19.8 million readers across India’s fastest growing markets. Highlights Q4 FY15 (Consolidated) Total Revenues have shown a growth of 7% YOY to Rs. 4,953 million in Q4 against Rs. 4,622 million of Q4 of last fiscal. EBIDTA margin for the quarter came in at 26% at Rs. 1,292 million, against margin of 24% and EBITDA of Rs. 1,127 million, YOY growth of 15%. PAT grew by 5% to Rs. 640 million (PAT Margin 13%) against Rs. 610 million (PAT Margin 13%), in Q4 of last year. COMPANY PROFILE DB Corp Ltd. is India’s largest print media company that publishes 7 newspapers with Dainik Bhaskar 37 editions, Divya Bhaskar 7 editions, & Divya Marathi 7 editions with 199 sub-editions in 4 multiple languages (Hindi, Gujarati, English and Marathi) across 14 states in India. The Company flagship newspapers Dainik Bhaskar (in Hindi) established in 1958, Divya Bhaskar and Saurashtra Samachar (in Gujarati) have a combined average daily readership of 19.8 million, making us one of the most widely read newspaper groups in India with presence in Madhya Pradesh, Chhattisgarh, Rajasthan, Haryana, Punjab, Chandigarh, Himachal Pradesh, Uttrakhand, Delhi, Gujarat, Maharashtra, Jharkhand and Jammu. Other noteworthy newspaper brands are Dainik Divya Marathi, DB Star and, DNA (in Gujarat & Rajasthan) on a franchisee basis. DBCL is the only media conglomerate that enjoys a leadership position in multiple states, in multiple languages and is a dominant player in its all major markets. The company’s other business interests also span the radio segment through the brand "My FM" Radio station in 7 states and 17 cities, and a strong online presence in internet portals. Newspaper and Magazines Brands Dainik Bhaskar 'Dainik Bhaskar', the flagship Newspaper brand is established since 1958. This newspaper spreads in 12 states with 37 editions and 163 district editions.
- 4. Divya Bhaskar Divya Bhaskar became No.1 from Day 1 of it’s launch in June 2003, out placing more than 50 year old local Gujarati newspaper in Ahmedabad city and became a case study at IIM Ahmedabad. This newspaper has its presence in Gujarat and Mumbai with 7 editions and 28 district editions. Dainik Divya Marathi D B Corp Ltd has begun its journey in Maharashtra with the launch of Marathi language newspaper Dainik Divya Marathi newspaper in Amravati, Maharashtra on 11th August, 2013. The newspaper has emerged as the most popular paper in the city from day 1 of its launch. This newspaper has its presence in 1 state with 7 editions, Aurangabad, Nashik, Jalgaon , Ahmednagar, Solapur, Akola and Amravati. MYFM MYFM launched in 2006 and has span the radio segment through the brand "My FM" Radio station with presence in 7 states and 17stations, and a strong online presence in internet portals. DB DIGITAL DB Digital- present in Hindi, Gujarati, Marathi and English language. The Web Portals- are www.dainikbhaskar.com, www.divyabhaskar.com, www.divyamarathi.com,www.dailybhaskar.com. Page Views & Unique Visitors: Total of 500 million Page Views and 15 million Unique Visitors. Magazines Aha Zindagi! Bal Bhaskar Lakshya Young Bhaskar
- 5. FINANCIAL HIGHLIGHT (PARENT BASIS) (A*- Actual, E* -Estimations & Rs. In Millions) Balance Sheet as at March 31, 2014 -2017E FY14A FY15A FY16E FY17E I EQUITY AND LIABILITIES A) Shareholder's Funds a) Share Capital 1834.86 1836.49 1836.49 1836.49 b) Reserves and Surplus 9609.18 11028.32 12572.28 14206.68 Sub-Total- Total Net worth 11444.04 12864.81 14408.77 16043.17 B) Non Current Liabilities a) Long-term borrowings 726.81 505.44 424.57 369.38 b) Deferred Tax Liabilities 885.13 831.97 790.37 750.85 c) Other Long Term Liabilities 346.38 377.48 400.13 416.13 Total Non Current liabilities 1958.32 1714.89 1615.07 1536.36 C) Current Liabilities a) Short-term borrowings 536.93 477.38 439.19 408.45 b) Trade payables 1116.83 1214.29 1299.29 1377.25 c) Other Current liabilities 1558.62 1547.86 1578.82 1610.39 d) Short term Provisions 1048.35 1205.57 1314.07 1392.92 Sub-Total- Current Liabilities 4260.73 4445.10 4631.37 4789.00 TOTAL EQUITY AND LIABILITIES (A + B + C) 17663.09 19024.80 20655.21 22368.54 II APPLICATION OF FUNDS D) Non-Current Assets a) Fixed Assets 8505.88 8180.68 8507.91 8933.30 b) Non-current investments 735.16 697.40 753.19 798.38 c) Long Term loans and advances 1855.19 3074.36 3535.51 3995.13 d) Other non-current assets 48.50 32.46 36.36 39.63 Sub-Total-Non-Current Assets 11144.73 11984.90 12832.97 13766.44 E) Current Assets a) Inventories 1732.34 1401.96 1598.23 1790.02 b) Trade receivables 3274.17 3449.86 3725.85 3949.40 c) Cash and Bank Balances 1120.44 1760.74 2036.63 2369.03 d) Short-terms loans & advances 375.54 409.17 441.90 472.84 e) Other Current Assets 15.87 18.17 19.62 20.80 Sub-Total-Total Current Assets 6518.36 7039.90 7822.24 8602.09 TOTAL ASSETS (D+E) 17663.09 19024.80 20655.21 22368.54
- 6. Annual Profit & Loss Statement for the period of 2014 to 2017E Value(Rs. mn) FY14A FY15A FY16E FY17E Description 12m 12m 12m 12m Net Sales 18562.09 20090.20 21898.32 23650.18 Other Income 238.62 256.58 271.97 285.57 Total Income 18800.71 20346.78 22170.29 23935.76 Expenditure -13565.46 -14461.50 -15788.69 -17122.73 Operating Profit 5235.25 5885.28 6381.61 6813.02 Interest -75.34 -75.57 -78.59 -83.31 Gross profit 5159.91 5809.71 6303.01 6729.72 Depreciation -641.54 -880.78 -1030.51 -1164.48 Profit Before Tax 4518.37 4928.93 5272.50 5565.24 Tax -1455.52 -1759.15 -1892.83 -1992.35 Net Profit 3062.85 3169.78 3379.67 3572.88 Equity capital 1834.86 1836.49 1836.49 1836.49 Reserves 9609.18 11028.32 12572.28 14206.68 Face value 10.00 10.00 10.00 10.00 EPS 16.69 17.26 18.40 19.45 Quarterly Profit & Loss Statement for the period of 30th Sep, 2014 to 30th Jun, 2015E Value(Rs. mn) 30-Sep-14 31-Dec-14 31-Mar-15 30-Jun-15E Description 3m 3m 3m 3m Net sales 4799.60 5544.27 4854.82 5097.56 Other income 36.14 28.41 97.05 79.58 Total Income 4835.74 5572.68 4951.87 5177.14 Expenditure -3564.66 -3696.57 -3655.69 -3680.44 Operating profit 1271.08 1876.11 1296.18 1496.70 Interest -14.52 -31.82 -13.51 -15.27 Gross profit 1256.56 1844.29 1282.67 1481.44 Depreciation -207.87 -223.27 -246.04 -270.64 Profit Before Tax 1048.69 1621.02 1036.63 1210.79 Tax -367.42 -569.45 -392.21 -433.46 Net Profit 681.27 1051.57 644.42 777.33 Equity capital 1835.98 1836.31 1836.49 1836.49 Face value 10.00 10.00 10.00 10.00 EPS 3.71 5.73 3.51 4.23
- 7. Ratio Analysis Particulars FY14A FY15A FY16E FY17E EPS (Rs.) 16.69 17.26 18.40 19.45 EBITDA Margin (%) 28.20 29.29 29.14 28.81 PBT Margin (%) 24.34 24.53 24.08 23.53 PAT Margin (%) 16.50 15.78 15.43 15.11 P/E Ratio (x) 21.03 20.34 19.07 18.04 ROE (%) 26.76 24.64 23.46 22.27 ROCE (%) 46.25 48.86 48.53 47.43 Debt Equity Ratio 0.11 0.08 0.06 0.05 EV/EBITDA (x) 12.33 10.82 9.92 9.23 Book Value (Rs.) 62.37 70.05 78.46 87.36 P/BV 5.63 5.01 4.47 4.02 Charts
- 8. OUTLOOK AND CONCLUSION At the current market price of Rs. 351.00, the stock P/E ratio is at 19.07 x FY16E and 18.04 x FY17E respectively. Earning per share (EPS) of the company for the earnings for FY16E and FY17E is seen at Rs. 18.40 and Rs. 19.45 respectively. Net Sales and PAT of the company are expected to grow at a CAGR of 11% and 12% over 2014 to 2017E respectively. On the basis of EV/EBITDA, the stock trades at 9.92 x for FY16E and 9.23 x for FY17E. Price to Book Value of the stock is expected to be at 4.47 x and 4.02 x for FY16E and FY17E respectively. We expect that the company surplus scenario is likely to continue for the next three years, will keep its growth story in the coming quarters also. We recommend ‘BUY’ in this particular scrip with a target price of Rs. 395.00 for Medium to Long term investment. INDUSTRY OVERVIEW The Indian Media and Entertainment (M&E) industry is a sunrise sector for the economy and is making high growth strides. Proving its resilience to the world, the Indian M&E sector is on the cusp of a strong phase of growth, backed by rising consumer payments and advertising revenues across all sectors. The industry has been largely driven by increasing digitisation and higher internet usage over the last decade. Internet has almost become a mainstream media for entertainment for most of the people. Recent statistics and developments pertaining to the sector are discussed hereafter.
- 9. India’s entertainment and media sector is expected to grow steadily over the next five years as per CII-PwC’s report, titled ‘India Entertainment & Media Outlook 2014’. The industry is expected to exceed Rs 227,000 crore (US$ 36.49 billion) by 2018, growing at compound annual growth rate (CAGR) of 15 per cent between 2013 and 2018. Road Ahead The Indian M&E industry is on an impressive growth path. According to the CII-PwC study, the revenue from advertising is expected to grow at a CAGR of 13 per cent and will exceed Rs 60,000 crore (US$ 9.64 billion) in 2018 from Rs 35,000 crore (US$ 5.62 billion) in 2013. Internet access has surpassed the print segment as the second-largest segment contributing to the overall pie of M&E sector revenues. Television and print are expected to remain the largest contributors to the advertising pie in 2018 as well. Internet advertising will emerge as the third-largest segment, with a share of about 16 per cent in the total M&E advertising pie. The film segment estimated at Rs 12,600 crore (US$ 2.02 billion) in 2013 is projected to grow steadily at a CAGR of 12 per cent on the back of higher domestic and overseas box-office collections as well as cable and satellite rights Disclaimer: This document is prepared by our research analysts and it does not constitute an offer or solicitation for the purchase or sale of any financial instrument or as an official confirmation of any transaction. The information contained herein is from publicly available data or other sources believed to be reliable but we do not represent that it is accurate or complete and it should not be relied on as such. Firstcall Research or any of its affiliates shall not be in any way responsible for any loss or damage that may arise to any person from any inadvertent error in the information contained in this report. Firstcall Research and/ or its affiliates and/or employees will not be liable for the recipients’ investment decision based on this document.
- 10. Firstcall India Equity Research: Email – info@firstobjectindia.com C.V.S.L.Kameswari Pharma & Diversified U. Janaki Rao Capital Goods B. Anil Kumar Auto, IT & FMCG M. Vinayak Rao Diversified G. Amarender Diversified Firstcall Research Provides Industry Research on all the Sectors and Equity Research on Major Companies forming part of Listed and Unlisted Segments For Further Details Contact: Tel.: 022-2527 2510/2527 6077 / 25276089 Telefax: 022-25276089 040-20000235 /20000233 E-mail: info@firstobjectindia.com www.firstcallresearch.com