hyundai wia 011210 Algorithm Investment Report
•
0 likes•39 views

hyundai wia 011210 Algorithm Investment Report
![[Price for scheduled purchasing]
Arbitrarily made
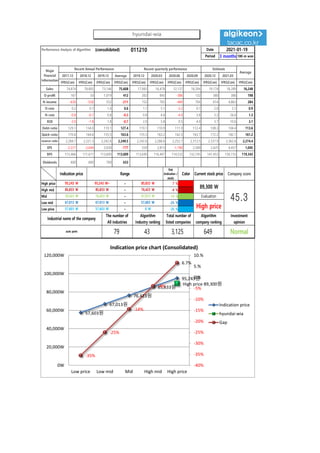
Algorithm stocks Trading Strategies (consolidated) 011210 Date
Period
Gap
(Indication /
stock)
Color
2021-01-19
3 months
Current stock price Evaluation
Stock price rise
probability score
Investment opinion Prospective purchase amount
89,300 W High price 49.6 Normal 3,000,000 W
Suggested Purchase
Amount 1,015,412 W
Number of stocks
purchased 11
Indication price Range Buying / Selling Buying / Selling [Stocks]
High price 95,243 W 95,243 W~ ~ 85,833 W 7 % -67,576 W -1
High mid 85,833 W 85,833 W ~ 76,423 W -4 % 39,423 W 0
Mid 76,423 W 76,423 W ~ 67,013 W -14 % 146,422 W 2
Low mid 67,013 W 67,013 W ~ 57,603 W -25 % 253,421 W 4
low price 57,603 W 57,603 W ~ 0 W -35 % 360,420 W 6
Stock price rise
probability score
A Sector 49.3 46.1 48.2 46.9 48.4 50.5
49.6B Sector 45.4 35.8 12.5 46.9 30.0 39.6
Total average
2020.08.20 2020.09.17 2020.10.21 2020.11.18 2020.12.16 2021.01.18
47.4 41.0 30.3 20.4 39.2 45.1
48 % 13 %
2020.09.17 2020.10.21 2020.11.18 2020.12.16 2021.01.18
Total of
increase rate
Total score
A Sector -7 % 4 % -3 % 3 % 4 %
-8 % 41.3B Sector -27 % -187 % 73 % -56 % 24 %
Total average -16 % -35 % -49 %
49
46 48 47 48 51
45
36
13
47
30
40
47
41
30
20
39
45
0
10
20
30
40
50
60
2020.08.20 2020.09.17 2020.10.21 2020.11.18 2020.12.16 2021.01.18
Stock price rise probability score
A sector
B sector
Total average
-7% 4% -3% 3% 4%
-27%
-187%
73%
-56%
24%
-16%
-35%
-49%
48%
13%
-200%
-150%
-100%
-50%
0%
50%
100%
2020.09.17 2020.10.21 2020.11.18 2020.12.16 2021.01.18
Increase rate of stock price rise
A sector
B sector
Total average
hyundai-wia](data:image/gif;base64,R0lGODlhAQABAIAAAAAAAP///yH5BAEAAAAALAAAAAABAAEAAAIBRAA7)
Recommended
Recommended
More Related Content
What's hot
What's hot (20)
Similar to hyundai wia 011210 Algorithm Investment Report
Similar to hyundai wia 011210 Algorithm Investment Report (20)
More from 알고리즘 기업분석 컨설팅-알기컨,algikeon
More from 알고리즘 기업분석 컨설팅-알기컨,algikeon (20)
Recently uploaded
Recently uploaded (8)
hyundai wia 011210 Algorithm Investment Report
- 1. Performance Analysis of Algorithm (consolidated) 011210 Date Period 3 months 100-m won 2017.12 2018.12 2019.12 Average 2019.12 2020.03 2020.06 2020.09 2020.12 2021.03 IFRS(Con) IFRS(Con) IFRS(Con) IFRS(Con) IFRS(Con) IFRS(Con) IFRS(Con) IFRS(Con) IFRS(Con) IFRS(Con) IFRS(Con) Sales 74,874 78,805 73,146 75,608 17,983 16,478 12,137 18,394 19,174 18,289 16,248 O-profit 167 50 1,019 412 202 845 -386 132 380 386 198 N-income -630 -556 552 -211 152 765 -484 704 614 4,863 284 O-rate 0.2 0.1 1.4 0.6 1.1 5.1 -3.2 0.7 2.0 2.1 0.9 N-rate -0.8 -0.7 0.8 -0.3 0.8 4.6 -4.0 3.8 3.2 26.6 1.3 ROE -2.0 -1.8 1.8 -0.7 2.0 5.8 0.5 4.0 3.7 10.6 3.1 Debt-ratio 129.1 134.0 119.1 127.4 119.1 110.9 111.9 112.4 108.3 104.4 113.6 Quick-ratio 170.6 164.6 155.5 163.6 155.5 163.2 162.5 163.7 172.2 182.1 161.2 reserve-ratio 2,284.7 2,221.3 2,242.6 2,249.5 2,242.6 2,288.6 2,252.7 2,313.5 2,337.9 2,362.6 2,274.4 EPS -2,317 -2,044 2,030 -777 559 2,813 -1,780 2,589 2,425 4,457 1,045 BPS 115,466 111,671 113,690 113,609 113,690 116,407 114,532 132,745 141,453 150,733 119,343 Dividends 600 600 700 633 2021-01-19 Major Financial Information Recent Annual Performance Recent quarterly performance Estimate Average Gap (Indication / stock) Color High price ~ 7 % High mid ~ -4 % Mid ~ -14 % Low mid ~ -25 % Low price ~ -35 % Indication price Range Current stock price Company score 85,833 W 85,833 W 76,423 W 76,423 W 76,423 W 67,013 W Evaluation 95,243 W 95,243 W~ 85,833 W 89,300 W 45.367,013 W 67,013 W 57,603 W High price Normal 57,603 W 57,603 W 0 W Industrial name of the company The number of All industries Algorithm Industry ranking Total number of listed companies Algorithm company ranking Investment opinion auto parts 79 43 3,125 649 57,603원 67,013원 76,423원 85,833원 95,243원 High price 89,300원 -35% -25% -14% -4% 6.7% -40% -35% -30% -25% -20% -15% -10% -5% 0.% 5.% 10.% 0W 20,000W 40,000W 60,000W 80,000W 100,000W 120,000W Low price Low mid Mid High mid High price Indication price chart (Consolidated) Indication price hyundai-wia Gap hyundai-wia
- 2. [Price for scheduled purchasing] Arbitrarily made Algorithm stocks Trading Strategies (consolidated) 011210 Date Period Gap (Indication / stock) Color 2021-01-19 3 months Current stock price Evaluation Stock price rise probability score Investment opinion Prospective purchase amount 89,300 W High price 49.6 Normal 3,000,000 W Suggested Purchase Amount 1,015,412 W Number of stocks purchased 11 Indication price Range Buying / Selling Buying / Selling [Stocks] High price 95,243 W 95,243 W~ ~ 85,833 W 7 % -67,576 W -1 High mid 85,833 W 85,833 W ~ 76,423 W -4 % 39,423 W 0 Mid 76,423 W 76,423 W ~ 67,013 W -14 % 146,422 W 2 Low mid 67,013 W 67,013 W ~ 57,603 W -25 % 253,421 W 4 low price 57,603 W 57,603 W ~ 0 W -35 % 360,420 W 6 Stock price rise probability score A Sector 49.3 46.1 48.2 46.9 48.4 50.5 49.6B Sector 45.4 35.8 12.5 46.9 30.0 39.6 Total average 2020.08.20 2020.09.17 2020.10.21 2020.11.18 2020.12.16 2021.01.18 47.4 41.0 30.3 20.4 39.2 45.1 48 % 13 % 2020.09.17 2020.10.21 2020.11.18 2020.12.16 2021.01.18 Total of increase rate Total score A Sector -7 % 4 % -3 % 3 % 4 % -8 % 41.3B Sector -27 % -187 % 73 % -56 % 24 % Total average -16 % -35 % -49 % 49 46 48 47 48 51 45 36 13 47 30 40 47 41 30 20 39 45 0 10 20 30 40 50 60 2020.08.20 2020.09.17 2020.10.21 2020.11.18 2020.12.16 2021.01.18 Stock price rise probability score A sector B sector Total average -7% 4% -3% 3% 4% -27% -187% 73% -56% 24% -16% -35% -49% 48% 13% -200% -150% -100% -50% 0% 50% 100% 2020.09.17 2020.10.21 2020.11.18 2020.12.16 2021.01.18 Increase rate of stock price rise A sector B sector Total average hyundai-wia
- 3. 정보와 완전 정보 결 투자판단 있습니 위배 무단으 숙지하 Compliance notice ① The information provided by The Algorithm Company Analysis Consulting is obtained through reliable data and information and The Algorithm Company Analysis Program (TACAP), but its accuracy or completeness are not guaranteed. Furthermore, it may change over time.Therefore, we are not legally responsible for the results of the data provided by The Algorithm Company Analysis Consulting because of information errors or omissions. ② The Algorithm Company Analysis Consulting and all the information provided on it site are reference materials for investment decisions and the final responsibility of investment is up to users utilizing this information. ③ The Algorithm Company Analysis Consulting and its site do not do anything that violates the related laws such as discretionary transaction. ④ Users can not reallocate and recycle the information provided by The Algorithm Company Analysis Consulting firm let alone the information provided by its Site. ⑤ Be sure to know about application period of this algorithm analysis report in order to improve its accuracy. Tel : 070 - 4667 - 5009 Email : tacac@tacac.co.kr Homepage : tacac.co.kr Blog : tacac.blog.me SERVICES M&A, IPO, RECOVER, CORPORATE RESTRUCTURING, MANAGEMENT OF TECHNOLOGY, BUSINESS STRATEGY, FAMILY BUSINESS Request : http://tacac.co.kr/?page_id=1374 ① Consulting is o The Algorithm accuracy or com change over tim results of the d Consulting bec ② information pr investment dec up ③ do anything th transaction. ④ The Algorithm information pr ⑤ analysis report