SlideShare a Scribd company logo
1 of 5
Download to read offline
Articles
https://doi.org/10.1038/s41550-019-0929-2
1
Kavli Institute for Astrophysics and Space Research and Department of Physics, Massachusetts Institute of Technology, Cambridge, MA, USA. 2
Institute
of Physics, École Polytechnique Fédérale de Lausanne, Lausanne, Switzerland. 3
University of Maryland, Baltimore County, Baltimore, MD, USA.
*e-mail: jdr@space.mit.edu
T
he heliopause (HP), where the heliosphere and solar wind
end and the very local interstellar medium (VLISM) begins,
was first crossed by Voyager 1 (V1) at 121.7 au on 25 August
20121–4
. Voyager 2 (V2) crossed the HP at 119.0 au on 5 November
20185–8
. The V2 crossing is important scientifically because the V2
HP crossing occurred in a flow regime very different from that at
V1, and the bulk of the plasma particles were not observed by V1
as the plasma instrument on V1 is not working. V1 provided a very
surprising view of the heliosheath, with an extended 8 au stagna-
tion region with little plasma flow. V2 provides another view of this
region at a different location and time. The plasma and magnetic
field pressure in the VLISM combine to confine the solar wind
inside the heliosphere; these measurements help define the roles
each plays in this process. This paper describes and discusses the
first plasma observations upstream of the HP, at the HP, and in the
VLISM beyond the HP.
The Voyager Plasma Science (PLS) experiment measures ion and
electron currents with energy/charge 10–5,950 eV q−1
(ref. 9
). Three
Faraday cups (A, B and C) look at small angles to the sunward direc-
tion and a fourth (D) looks at right angles to this direction. These
cups can detect flows up to 60° from the cup normal. The space-
craft is oriented so that the D cup points as close as possible (55°)
to the direction of VLISM flow. Sets of ion spectra are obtained
every 192 s from both the lower-energy-resolution L mode and the
higher-energy-resolution M mode. In the heliosheath, the region of
shocked solar wind between the termination shock and HP, data are
often observed in three or four of the cups. These spectra are fitted
with convected isotropic proton Maxwellian distributions to deter-
mine the plasma velocity, density and temperature10
. In the VLISM,
currents are detected in only the sideways-looking D cup.
Heliospheric asymmetries
Figure 1 shows the V2 crossing of the HP. The L mode currents
from the three sunward-looking detectors are shown, from the low-
est energy channel (10–30 eV) for the A and C cups and the lowest
two energy channels (10–57 eV) for the B cup. The B cup points
closest to the heliosheath flow direction, followed by the C and A
cups, respectively. A boundary layer with enhanced currents signals
the approach to the HP starting on day 150, about 1.5 au ahead of
the HP. The currents in all three sunward-looking detectors started
decreasing near day 300 of 2018 and then fell to background levels
at the HP on day 309 (5 November). After this time V2 was no lon-
ger in the solar wind; it had entered the VLISM. The first crossing
of the HP by V1 at 121.7 au defined the scale size of the heliosphere;
the second crossing by V2 at 119.0 au shows that the HP distance
is similar in both the V1 and V2 directions despite the termination
shock being 10 au closer at V1 than V210
.
The Voyager HP crossings are both preceded by increases in
the Galactic cosmic ray (GCR) intensities4,5
and decreases in helio-
spheric electron and higher-energy ion intensities3,6
. The radial
speed of the solar wind at V1 went to near zero 8 au before the HP
crossing11
. Figure 2 shows the first observations of plasma in the
boundary region inside the HP. The plasma speed starts to decrease
and the density and temperature start to increase on day 150, about
1.5 au before the HP (blue dashed line). By day 200, the speed had
decreased from 130 to 100 km s−1
, the density increased by almost
a factor of two, and the temperature increased by 50%. This region
from day 200 to the HP contains the largest densities and lowest
speeds observed by V2 in the heliosheath. Near day 150, when the
plasma boundary region begins, the slope of the GCR intensities
increases slightly. V2 enters a region of enhanced magnetic field
called a magnetic barrier starting at day 229, 0.6 au ahead of the HP,
when the magnetic field and the GCR intensity start to increase5,7
.
This transition is not apparent in the plasma data. V2 previously
observed density increases associated with merged interaction
regions driven by solar transients, but unlike the density increases
in front of the HP, they were associated with speed and magnetic
field increases12,13
.
Figure3showsthevelocitycomponentsintheheliosheathderived
from the V2 PLS instrument at V2 and from the LECP11,14
and CRS15
instruments at V1. V1 and V2 are on opposite sides of the nose of
heliosphere in both the T and N directions, so V1 (V2) observed
Voyager 2 plasma observations of the heliopause
and interstellar medium
John D. Richardson   1
*, John W. Belcher1
, Paula Garcia-Galindo2
and Leonard F. Burlaga   3
The solar wind blows outwards from the Sun and forms a bubble of solar material in the interstellar medium. The heliopause
(HP) is the boundary that divides the hot tenuous solar wind plasma in the heliosheath from the colder, denser very local inter-
stellar medium (VLISM). The Voyager 2 plasma experiment observed the HP crossing from the solar wind into the VLISM on 5
November 2018 at 119 au. Here we present the first measurements of plasma at and near the HP and in the VLISM. A plasma
boundary region with a width of 1.5 au is observed before the HP. The plasma in the boundary region slows, heats up and is twice
as dense as typical heliosheath plasma. A much thinner boundary layer begins about 0.06 au inside the HP where the radial
speed decreases and the density and magnetic field increase. The HP transition occurs in less than one day. The VLISM is vari-
able near the HP and hotter than expected. Voyager 2 observations show that the temperature is 30,000–50,000 K, whereas
models and observations predicted a VLISM temperature of 15,000–30,000 K.
Nature Astronomy | www.nature.com/natureastronomy
Articles Nature Astronomy
negative (positive) T and positive (negative) N flow. To compare the
magnitudes of VT and VN at V1 and V2, the signs of VT and VN for
V1 are reversed in the plot. The data are plotted so that the termina-
tion shock and HP are at the same location for each spacecraft. The
difference between the V1 and V2 profiles is striking. The V1 VR is
much lower than that at V2 throughout the heliosheath and goes to
zero about 8 au before the HP. At V2, VR slowly decreases across the
heliosheath, then drops sharply just before the HP. The magnitude
of VT is also much larger at V2 than V1, whereas the magnitude of
VN decreases at both spacecraft before the HP. The differences in the
speed profiles at V1 and V2 are not understood.
HP boundary layer
Figure 4 in an enlargement of the region near the HP to show
the plasma density, velocity components and magnetic field BT.
These data show that a boundary layer is present in front of the HP
starting near day 302, about 0.06 au before the HP. In this bound-
ary layer, the density increases by a factor of two, the magnitudes
of VR and VN decrease, the flow angle in the RT plane increases,
and the magnitude of BT increases by 30%. The magnetic barrier is
an increase in magnetic field that extends 0.6 au ahead of the HP7
.
This region contains solar wind plasma that is modified near the
HP boundary.
Plasma in the VLISM
The PLS instrument observes currents from the VLISM plasma in
the D cup, but these measurements are difficult to conduct as the
average proton energies are comparable to the PLS energy threshold
of 10 eV, the expected flow is at the edge of the cup’s acceptance angle
and the data (especially in the D cup) are often contaminated by
noise. For the L mode, data are observed only in the lowest-energy
(10–30 eV) channel of the D cup. The M mode spectra have under-
lying systematic noise that varies and is larger than the expected
currents. Figure 5 shows 15-point running averages of the current in
the 10–30 eV channel of the D cup from spectra with minimal noise.
The dashed vertical line is the HP, where the currents drop. The cur-
rents in the VLISM vary from 30–70 fA (10−15
 A), which could be
due to changes in speed, flow direction, density or temperature. The
region of increased currents from day 418–435 (22 February to 11
March 2019) starts at about the same time as the plasma oscillations
observed by the Plasma Wave (PWS) experiment cease8
, consistent
with a shock passing V2, as these oscillations are generated by elec-
tron beams upstream of a shock2
. The currents increase after day
430, which suggests that the density increases away from the HP, as
observed by V116
.
We want to determine the VLISM speed, density and tempera-
ture, but with one data point in each spectrum we cannot derive
these three quantities. However, in January 2019, the PWS experi-
ment observed plasma oscillations in the 1.78 kHz band8
, giving an
electron density of 0.039 ± 30% cm−3
. These oscillations persisted
from day 394 (29 January 2019) to roughly the time of the increase
in current at day 418 (22 February 2019). The observed PLS cur-
rents in the D cup during that period were 35–50 fA. We assume
that the electron and proton densities are roughly equal and use the
PWS-derived density to constrain VT, the flow towards the D cup
and the thermal speed or temperature of the protons. Figure 6 shows
contours of simulated proton currents in the D cup for a density of
0.04 cm−3
and a range VT values and temperatures. The speed of the
unperturbed LISM is about 26 km s−1
(ref. 17
); this flow is slowed
and deflected near the HP. The temperature far from the HP in the
VLISM is about 7,500 K (ref. 17
); models predict that this plasma is
compressed and heated by a factor of 2–4 near the HP18
, or more if
200
150
B cup
channels 1 + 2
HP
C cup, channel 1
A cup, channel 1
100 150 200
Day of 2018
250 300 350
100
Current(fA)
50
0
Fig. 1 | Current observed by the V2 PLS experiment in the three Faraday
cups that look sunwards. Energies from 10–57 eV are shown for the B cup,
which looks most closely towards the flow direction. For the A and C cups
the energy range 10–30 eV is shown. On day 150, V2 enters the plasma
boundary layer where the currents increase. At the HP (vertical dashed
line), the observed currents in all three cups fall to background levels as V2
leaves the solar wind and enters the VLISM.
HP
Plasma boundary
region
Magnetic
barrier
∣V∣(kms–1
)∣B∣(nT)
N(cm–3
)GCRintensities
(countss–1
)
T(K)
50
100
150
0
0.008
0.006
0.004
0.002
0
1 × 10⁵
8 × 10⁴
6 × 10⁴
4 × 10⁴
2 × 10⁴
0
0.6
0.4
0.2
0
2.4
2.2
2.0
1.8
1.6
0 50 100 150
Day of 2018
200 250 300
Fig. 2 | Daily averages of solar wind speed, density, temperature,
magnetic field magnitude and GCR count rates. The plasma boundary
layer (dashed blue lines) extends 1.5 au from day 150 to the HP, with a
decrease in speed and increase in density and temperature. The GCR slope
increases slightly at the start of this region.
Nature Astronomy | www.nature.com/natureastronomy
ArticlesNature Astronomy
it is also heated by reconnection in a plasma depletion layer19
. For
currents of 35–50 fA, the values of VT and temperature (T) are con-
strained to lie within the shaded region of Fig. 6. The range of VT
can be further constrained; the flow should slow near the HP and
only a component of the flow is in the VT plane. A reasonable upper
limit for VT is 15 km s−1
, which corresponds to T > 30,000 K, near the
upper limit predicted for T by models18
.
V2 occasionally rolls around the axis pointed towards Earth.
Three 360° rolls have occurred since the HP crossing, each last-
ing 2,000 s; the PLS instrument makes a measurement every 192 s,
so a roll provides about 10 measurements at different look direc-
tions, which (in principal) allows the determination of VT, T and
N. Figure 7 shows M mode currents measured in the D cup in two
energy channels from spacecraft rolls on days 22 and 164 of 2019.
The simulated currents show that when a roll begins, the D cup first
moves away from the plasma flow direction and the predicted cur-
rents decrease, then near the end of the roll the cup points closer
to the expected flow and currents increase, before the cup returns
to the original orientation. The currents in the D cup channels are
scaled to highlight the roll variations and are in qualitative agree-
ment with expectations. This signal is convincing evidence that PLS
is measuring the VLISM plasma. Removal of the noise affecting
these currents and fitting the VLISM plasma parameters are sub-
jects of future work.
Summary
V2crossedtheHPat119.0 au,similartothe121.7 audistancefromV1,
and is making the first plasma measurements in the VLISM. A 1.5-au-
thick plasma boundary region was discovered ahead of the HP with
lower speeds and enhanced densities and temperatures. The plasma
flow speed at V2 remained high just before the HP, in sharp contrast
to V1, for which a flow stagnation region was observed for 2 years
before the HP crossing. This difference suggests that V1 observations
may be anomalous, perhaps due to instabilities of the HP boundary.
The HP boundary was sharp, occurring over less than a day, with a
boundary layer observed to start about 8 days before the crossing. The
sharpness of the HP itself was expected, but accompanied by a more
95 100 105
V1 distance (au)
V2 PLS
V1 LECP
–V1 LECP
–V1 CRS
V2 PLS
V2 PLS
HP
TS
110 115 120
VR(kms–1
)VT(kms–1
)VN(kms–1
)
100
50
0
40
20
0
–20
–40
–60
–80
–100
80 90 100
V2 distance (au)
110 120
150
200
100
50
0
Fig. 3 | Plasma velocity components observed by V1 and V2 in the
heliosheath in the RTN coordinate system. In the RTN system, R is radially
outwards, T is parallel to the plane of the solar equator and positive in the
direction of the Sun’s rotation and N completes a right-handed system. The
vertical lines show the termination shock (TS) and HP crossings. V2 speeds
are from the plasma instrument and V1 speeds are derived from LECP
(VR and VT) and CRS (VN) data using the Compton–Getting effect. The signs
of VT and VN are reversed for the V1 data. The magnitudes of VR and VT are
much lower at V1 than V2 across the entire heliosheath. The stagnation
region observed at V1 where the speed approached zero for 8 au before the
HP was not observed at V2.
118.85 118.90 118.95
Distance from sun (au)
HP
VT
119.00
0.008
0.010
0.006
0.004
N(cm–3
)
VR,VT,VN(kms–1
)
BT(nT)
0.002
0
80
60
40
VR
VN
20
0
–20
–0.65
–0.60
–0.55
–0.50
–0.45
–0.40
290 295 300
Day of 2018
305 310
Fig. 4 | The HP boundary layer extends from day 302 to the HP. In this
boundary layer the density N increases, VR decreases (and since VT is
constant, the flow angle in the RT plane increases), and the magnetic field
BT increases. This layer has a width of 0.06 au. V1 VT and VN flow directions
are opposite those at V2; the plot shows negative values to facilitate
comparison of flow magnitudes. Error bars are the standard errors of the
mean for the daily averaged plasma parameters.
100
HP
80
60
40
Dcupcurrents(fA)
20
0
250 300 350 400
Day of 2018
450 500
Fig. 5 | Currents observed in the PLS D cup, which looks closest to the
VLISM flow. These are 15-point running averages from the spectra least
contaminated by noise. The currents decrease at the HP but do not go to
background levels, with a possible shock at day 418 and an increase in the
current level after day 435.
Nature Astronomy | www.nature.com/natureastronomy
Articles Nature Astronomy
gradual decrease in VR. We note that Krimigis et al.6
suggest a larger
region of decreased VR than the PLS measurements; why these differ-
ent instruments give different velocities is not yet understood.
The VLISM currents are variable with a possible shock observed
near Feb 22, 2019. The temperature of the VLISM is at the high end
of that expected, of order 30,000–50,000 K. This higher T suggests
either more compression of the plasma than predicted or heating by
reconnection. Variations of the currents observed during spacecraft
rolls provide convincing evidence that the PLS observes the VLISM
and may allow future determinations of the VLISM speed, density,
and temperature.
Methods
The Voyager PLS measures ion and electron currents with energy/charge of
10–5950 eV q−1
and is fully described by Bridge et al.9
. In the heliosheath, the
region of shocked solar wind between the termination shock and HP, data are
often observed in three or four of the cups. These spectra are fitted with convected
isotropic proton Maxwellian distributions using the full response function of the
instrument to determine the thermal proton velocity, density and temperature20
.
The average 1σ errors in the heliosheath are about 8% for radial speed, 25% for
density and 31% for the thermal speed21
. In the VLISM currents are only detected
in the sideways-looking D cup.
Data availability
Data from the Voyager Plasma experiment are available at http://web.mit.edu/
space/www/voyager.html
Received: 12 July 2019; Accepted: 27 September 2019;
Published: xx xx xxxx
References
	1.	 Burlaga, L. F. et al. Magnetic field observations as Voyager 1 entered the
heliosheath depletion region. Science 341, 147–150 (2013).
	2.	 Gurnett, D. A., Kurth, W. S., Burlaga, L. F. & Ness, N. F. In situ observations
of interstellar plasma with Voyager 1. Science 341, 1489–1492 (2013).
	3.	 Krimigis, S. M. et al. Search for the exit: Voyager 1 at heliosphere’s border
with the galaxy. Science 341, 144–147 (2013).
	4.	 Stone, E. C. et al. Voyager 1 observes low-energy galactic cosmic rays in a
region depleted of heliospheric ions. Science 341, 150–153 (2013).
	5.	 Stone, E. C., Cummings, A. C., Heikkila, B. C. & Lal, N. Cosmic ray
measurements from Voyager 2 as it crossed into interstellar space.
Nat. Astron. https://doi.org/10.1038/s41550-019-0928-3 (2019).
	6.	 Krimigis, S. M. et al. Energetic charged particle measurements from Voyager
2 at the heliopause and beyond. Nat. Astron. https://doi.org/10.1038/
s41550-019-0927-4 (2019).
	7.	 Burlaga, L. F. et al. Magnetic field and particle measurements made by
Voyager 2 at and near the heliopause. Nat. Astron. https://doi.org/10.1038/
s41550-019-0920-y (2019).
	8.	 Gurnett, D. A. & Kurth, W. S. Plasma densities near and beyond the
heliopause from the Voyager 1 and 2 plasma wave instruments. Nat. Astron.
https://doi.org/10.1038/s41550-019-0918-5 (2019).
	9.	 Bridge, H. S. et al. The plasma experiment on the 1977 Voyager mission.
Space Sci. Rev. 21, 259–287 (1977).
	10.	Richardson, J. D. et al. Cool heliosheath plasma and deceleration
of the upstream solar wind at the termination shock. Nature 464,
63–65 (2008).
	11.	Krimigis, S. M., Roelof, E. C., Decker, R. B. & Hill, M. E. Zero outward
flow velocity for plasma in a heliosheath transition layer. Nature 474,
359–361 (2011).
	12.	Burlaga, L. F., Ness, N. F. & Richardson, J. D. Transition from the unipolar
region to the sector zone: Voyager 2, 2013 and 2014. Astrophys J. 841,
47–59 (2017).
	13.	Richardson, J. D. et al. Pressure pulses at Voyager 2: drivers of interstellar
transients? Astrophys. J. 834, 190–195 (2017).
	14.	Decker, R. B., Krimigis, S. M., Roelof, R. B. & Hill, M. E. No meridional
plasma flow in the heliosheath transition region. Nature 489,
124–127 (2012).
	15.	Stone, E. C. & Cummings, A. C. Cosmic rays in the heliosheath. Proc. Int.
Cosmic Ray Conf. Beijing 12, 29–32 (2012).
	16.	Gurnett, D. A. et al. Precursors to interstellar shocks of solar origin. Astrophys. J.
809, 121–130 (2015).
	17.	McComas, D. J. et al. Local interstellar medium: Six years of direct sampling
by IBEX. Astrophys. J. Suppl. Ser. 220, 22–32 (2015).
	18.	Zank, G. Interaction of the solar wind with the local interstellar medium: a
theoretical perspective. Space Sci. Rev. 89, 413–688 (1999).
	19.	Fuselier, S. A. & Cairns, I. H. Reconnection at the heliopause: predictions for
Voyager 2. J. Phys.Conf. Ser. 900, 012007 (2017).
	20.	Barnett, A. & Olbert, S. Response function of modulated grid Faraday cup
plasma instruments. Rev. Sci. Instrum. 57, 2432–2440 (1986).
25
1
40
100
80
60
50
40
20
10
5
30
30
20
10
5
Currents (fA)
15 20
Wth (km s–1
)
25 30
2
T (× 104
K)
3 5
20
15
VT(kms–1
)
10
5
Fig. 6 | Contours of currents in the 10–30 eV channel of the D cup. Data
are for the density 0.04 cm−3
measured by PWS as a function of VT and
the proton thermal speed (Wth) and T. The PLS currents at the times of the
PWS measurements varied from 35–50 fA, constraining the values of VT
and T to the shaded red and blue region. VT is probably under 15 km s−1
, so
the red region shows the preferred portion of VT and T parameter space.
Simulation
Simulation
12.2–14.5
12.2–14.5 eV
16.8–19.3 eV
10–12.2 eV
eV
40
50
30
20
Current(fA)
10
0
40
50
30
20
Current(fA)
10
0
0 10 20 30 40
Minute
Minute
50 60 70
0 20 40 60 80
Fig. 7 | Observations of plasma currents in selected high-energy
resolution M mode channels during the V2 rolls in 2019. Top: day 21.
Bottom: day 164. The simulated variation for the 12.2–14.5 eV channel for
VR, VT, VN = (0, 15, −10) km s−1
, N = 0.06 cm3
and T = 54,000 K is shown
by the dashed red line; simulations for other channels are qualitatively
similar. The two energy channels with the clearest response in each roll
are shown. The measured currents have noise; the variation shown is real,
but qualitative. The response of the cup during these rolls confirms that it
observes VLISM plasma; with more work on noise removal these data may
be used to determine the VLISM N, T and V.
Nature Astronomy | www.nature.com/natureastronomy
ArticlesNature Astronomy
	21.	Richardson, J. D. & Decker, R. B. Voyager 2 observations of plasmas and
flows out to 104 AU. Astrophys. J. 792, 126–130 (2014).
Acknowledgements
The work at MIT is supported by NASA. Magnetic field and GCR data are shown
courtesy of the Voyager Magnetometer (N. Ness, P.I.) and Cosmic Ray Subsystem
(E. Stone, P.I.) teams. We thank G. S. Gordon Jr and L. A. Finck for development of,
and assistance with, the plasma analysis.
Author contributions
J.D.R. analysed the plasma data and wrote the paper. J.W.B. developed the data analysis
routines and participated in the design of the instrument. P.G.-G. assisted with the
simulations of the currents. L.F.B. analysed the magnetic field data.
Competing interests
The authors declare no competing interests.
Additional information
Correspondence and requests for materials should be addressed to J.D.R.
Peer review information Nature Astronomy thanks George Livadiotis, Brian Wood and
the other, anonymous, reviewer(s) for their contribution to the peer review of this work.
Reprints and permissions information is available at www.nature.com/reprints.
Publisher’s note Springer Nature remains neutral with regard to jurisdictional claims in
published maps and institutional affiliations.
© The Author(s), under exclusive licence to Springer Nature Limited 2019
Nature Astronomy | www.nature.com/natureastronomy

More Related Content

What's hot

Physical significance of non dimensional numbers
Physical significance of non dimensional numbersPhysical significance of non dimensional numbers
Physical significance of non dimensional numbersvaibhav tailor
 
MET 214 Heat exchanger module-1
MET 214 Heat exchanger module-1MET 214 Heat exchanger module-1
MET 214 Heat exchanger module-1Ibrahim AboKhalil
 
Wind Energy Lecture slides
Wind Energy Lecture slidesWind Energy Lecture slides
Wind Energy Lecture slidesKeith Vaugh
 
Reconfinement and loss of stability in jets from active galactic nuclei
Reconfinement and loss of stability in jets from active galactic nucleiReconfinement and loss of stability in jets from active galactic nuclei
Reconfinement and loss of stability in jets from active galactic nucleiSérgio Sacani
 
Flood routing by kinematic wave model
Flood routing by kinematic wave modelFlood routing by kinematic wave model
Flood routing by kinematic wave modelIOSR Journals
 
Research Poster 2015
Research Poster 2015Research Poster 2015
Research Poster 2015Tao Xiang,EIT
 
Transverse relaxation time fractal dimension of nuclear magnetic resonance fo...
Transverse relaxation time fractal dimension of nuclear magnetic resonance fo...Transverse relaxation time fractal dimension of nuclear magnetic resonance fo...
Transverse relaxation time fractal dimension of nuclear magnetic resonance fo...Khalid Al-Khidir
 
Open Channel VS Pipe Flow
Open Channel VS Pipe FlowOpen Channel VS Pipe Flow
Open Channel VS Pipe FlowFatma Abdalla
 
Wind from the_black_hole_accretion_disk_driving_a_molecular_outflow_in_an_act...
Wind from the_black_hole_accretion_disk_driving_a_molecular_outflow_in_an_act...Wind from the_black_hole_accretion_disk_driving_a_molecular_outflow_in_an_act...
Wind from the_black_hole_accretion_disk_driving_a_molecular_outflow_in_an_act...Sérgio Sacani
 
Drainage Engineering (Hydraulic boundary conditions)
Drainage Engineering (Hydraulic boundary conditions)Drainage Engineering (Hydraulic boundary conditions)
Drainage Engineering (Hydraulic boundary conditions)Latif Hyder Wadho
 
Hidraulika
HidraulikaHidraulika
HidraulikaNanang s
 
Types of flow in open channel
Types of flow in open channelTypes of flow in open channel
Types of flow in open channelMir Zafarullah
 

What's hot (20)

Physical significance of non dimensional numbers
Physical significance of non dimensional numbersPhysical significance of non dimensional numbers
Physical significance of non dimensional numbers
 
MET 214 Heat exchanger module-1
MET 214 Heat exchanger module-1MET 214 Heat exchanger module-1
MET 214 Heat exchanger module-1
 
Wind Energy Lecture slides
Wind Energy Lecture slidesWind Energy Lecture slides
Wind Energy Lecture slides
 
Reconfinement and loss of stability in jets from active galactic nuclei
Reconfinement and loss of stability in jets from active galactic nucleiReconfinement and loss of stability in jets from active galactic nuclei
Reconfinement and loss of stability in jets from active galactic nuclei
 
Flood routing by kinematic wave model
Flood routing by kinematic wave modelFlood routing by kinematic wave model
Flood routing by kinematic wave model
 
Research Poster 2015
Research Poster 2015Research Poster 2015
Research Poster 2015
 
Transverse relaxation time fractal dimension of nuclear magnetic resonance fo...
Transverse relaxation time fractal dimension of nuclear magnetic resonance fo...Transverse relaxation time fractal dimension of nuclear magnetic resonance fo...
Transverse relaxation time fractal dimension of nuclear magnetic resonance fo...
 
Open Channel VS Pipe Flow
Open Channel VS Pipe FlowOpen Channel VS Pipe Flow
Open Channel VS Pipe Flow
 
Transfer of heat
Transfer of heatTransfer of heat
Transfer of heat
 
Wind from the_black_hole_accretion_disk_driving_a_molecular_outflow_in_an_act...
Wind from the_black_hole_accretion_disk_driving_a_molecular_outflow_in_an_act...Wind from the_black_hole_accretion_disk_driving_a_molecular_outflow_in_an_act...
Wind from the_black_hole_accretion_disk_driving_a_molecular_outflow_in_an_act...
 
Poirel1997
Poirel1997Poirel1997
Poirel1997
 
Open channel flow
Open channel flowOpen channel flow
Open channel flow
 
Drainage Engineering (Hydraulic boundary conditions)
Drainage Engineering (Hydraulic boundary conditions)Drainage Engineering (Hydraulic boundary conditions)
Drainage Engineering (Hydraulic boundary conditions)
 
Hidraulika
HidraulikaHidraulika
Hidraulika
 
Fluid kinematics
Fluid kinematics Fluid kinematics
Fluid kinematics
 
Shock Tube Background
Shock Tube BackgroundShock Tube Background
Shock Tube Background
 
Fluid discharge
Fluid dischargeFluid discharge
Fluid discharge
 
Types of flow in open channel
Types of flow in open channelTypes of flow in open channel
Types of flow in open channel
 
Surface runoff
Surface runoffSurface runoff
Surface runoff
 
L6 Wind Energy
L6  Wind EnergyL6  Wind Energy
L6 Wind Energy
 

Similar to Voyager 2 plasma observations of the heliopause

In situ observations_of_interstellar_plasma_with_voyager_1
In situ observations_of_interstellar_plasma_with_voyager_1In situ observations_of_interstellar_plasma_with_voyager_1
In situ observations_of_interstellar_plasma_with_voyager_1Sérgio Sacani
 
Evidence of a plume on Europa from Galileo magnetic and plasma wave signatures
Evidence of a plume on Europa from Galileo magnetic and plasma wave signaturesEvidence of a plume on Europa from Galileo magnetic and plasma wave signatures
Evidence of a plume on Europa from Galileo magnetic and plasma wave signaturesSérgio Sacani
 
Voyager 1 Observes Low-Energy Galactic Cosmic Rays in a Region Depleted of He...
Voyager 1 Observes Low-Energy Galactic Cosmic Rays in a Region Depleted of He...Voyager 1 Observes Low-Energy Galactic Cosmic Rays in a Region Depleted of He...
Voyager 1 Observes Low-Energy Galactic Cosmic Rays in a Region Depleted of He...Carlos Bella
 
Voyager1 observes low_energy_galactic_cosmic_rays_in_a_region_depleted_of_hel...
Voyager1 observes low_energy_galactic_cosmic_rays_in_a_region_depleted_of_hel...Voyager1 observes low_energy_galactic_cosmic_rays_in_a_region_depleted_of_hel...
Voyager1 observes low_energy_galactic_cosmic_rays_in_a_region_depleted_of_hel...Sérgio Sacani
 
Search for the Exit: Voyager 1 at Heliosphere’s Border with the Galaxy.
Search for the Exit: Voyager 1 at Heliosphere’s Border with the Galaxy.Search for the Exit: Voyager 1 at Heliosphere’s Border with the Galaxy.
Search for the Exit: Voyager 1 at Heliosphere’s Border with the Galaxy.Carlos Bella
 
Search for the_exit_voyager1_at_heliosphere_border_with_the_galaxy
Search for the_exit_voyager1_at_heliosphere_border_with_the_galaxySearch for the_exit_voyager1_at_heliosphere_border_with_the_galaxy
Search for the_exit_voyager1_at_heliosphere_border_with_the_galaxySérgio Sacani
 
Role of Magnetic Reconnection in Coronal Heating
Role of Magnetic Reconnection in Coronal HeatingRole of Magnetic Reconnection in Coronal Heating
Role of Magnetic Reconnection in Coronal Heatingijtsrd
 
Discovery of rapid whistlers close to Jupiter implying lightning rates simila...
Discovery of rapid whistlers close to Jupiter implying lightning rates simila...Discovery of rapid whistlers close to Jupiter implying lightning rates simila...
Discovery of rapid whistlers close to Jupiter implying lightning rates simila...Sérgio Sacani
 
H-mode-like confinement formation in the RF discharge plasma in the Uragan-3M...
H-mode-like confinement formation in the RF discharge plasma in the Uragan-3M...H-mode-like confinement formation in the RF discharge plasma in the Uragan-3M...
H-mode-like confinement formation in the RF discharge plasma in the Uragan-3M...Aleksey Beletskii
 
Electrostatic Edge Plasma Turbulence in the Uragan-3M torsatron
Electrostatic Edge Plasma Turbulence in the Uragan-3M torsatronElectrostatic Edge Plasma Turbulence in the Uragan-3M torsatron
Electrostatic Edge Plasma Turbulence in the Uragan-3M torsatronAleksey Beletskii
 
Radioastron observations of_the_quasar_3_c273_a_challenge_to_the_brightness_t...
Radioastron observations of_the_quasar_3_c273_a_challenge_to_the_brightness_t...Radioastron observations of_the_quasar_3_c273_a_challenge_to_the_brightness_t...
Radioastron observations of_the_quasar_3_c273_a_challenge_to_the_brightness_t...Sérgio Sacani
 
Turbulent heating in_galaxy_clusters_brightest_in_x_rays
Turbulent heating in_galaxy_clusters_brightest_in_x_raysTurbulent heating in_galaxy_clusters_brightest_in_x_rays
Turbulent heating in_galaxy_clusters_brightest_in_x_raysSérgio Sacani
 
Relativistic boost as_the_cause_of_periodicity_in_a_massive_black_hole_binary...
Relativistic boost as_the_cause_of_periodicity_in_a_massive_black_hole_binary...Relativistic boost as_the_cause_of_periodicity_in_a_massive_black_hole_binary...
Relativistic boost as_the_cause_of_periodicity_in_a_massive_black_hole_binary...Sérgio Sacani
 
Pulsar emission amplified and resolved by plasma lensing in an eclipsing binary
Pulsar emission amplified and resolved by plasma lensing in an eclipsing binaryPulsar emission amplified and resolved by plasma lensing in an eclipsing binary
Pulsar emission amplified and resolved by plasma lensing in an eclipsing binarySérgio Sacani
 
Interchange reconnection as the source of the fast solar wind within coronal ...
Interchange reconnection as the source of the fast solar wind within coronal ...Interchange reconnection as the source of the fast solar wind within coronal ...
Interchange reconnection as the source of the fast solar wind within coronal ...Sérgio Sacani
 
AY121 Lab4 (Jonathan Kao) Final
AY121 Lab4 (Jonathan Kao) FinalAY121 Lab4 (Jonathan Kao) Final
AY121 Lab4 (Jonathan Kao) FinalJonathan Kao
 
Propagation of ELF Radiation from RS-LC System and Red Sprites in Earth- Iono...
Propagation of ELF Radiation from RS-LC System and Red Sprites in Earth- Iono...Propagation of ELF Radiation from RS-LC System and Red Sprites in Earth- Iono...
Propagation of ELF Radiation from RS-LC System and Red Sprites in Earth- Iono...degarden
 

Similar to Voyager 2 plasma observations of the heliopause (20)

In situ observations_of_interstellar_plasma_with_voyager_1
In situ observations_of_interstellar_plasma_with_voyager_1In situ observations_of_interstellar_plasma_with_voyager_1
In situ observations_of_interstellar_plasma_with_voyager_1
 
Evidence of a plume on Europa from Galileo magnetic and plasma wave signatures
Evidence of a plume on Europa from Galileo magnetic and plasma wave signaturesEvidence of a plume on Europa from Galileo magnetic and plasma wave signatures
Evidence of a plume on Europa from Galileo magnetic and plasma wave signatures
 
Voyager 1 Observes Low-Energy Galactic Cosmic Rays in a Region Depleted of He...
Voyager 1 Observes Low-Energy Galactic Cosmic Rays in a Region Depleted of He...Voyager 1 Observes Low-Energy Galactic Cosmic Rays in a Region Depleted of He...
Voyager 1 Observes Low-Energy Galactic Cosmic Rays in a Region Depleted of He...
 
Voyager1 observes low_energy_galactic_cosmic_rays_in_a_region_depleted_of_hel...
Voyager1 observes low_energy_galactic_cosmic_rays_in_a_region_depleted_of_hel...Voyager1 observes low_energy_galactic_cosmic_rays_in_a_region_depleted_of_hel...
Voyager1 observes low_energy_galactic_cosmic_rays_in_a_region_depleted_of_hel...
 
Search for the Exit: Voyager 1 at Heliosphere’s Border with the Galaxy.
Search for the Exit: Voyager 1 at Heliosphere’s Border with the Galaxy.Search for the Exit: Voyager 1 at Heliosphere’s Border with the Galaxy.
Search for the Exit: Voyager 1 at Heliosphere’s Border with the Galaxy.
 
Search for the_exit_voyager1_at_heliosphere_border_with_the_galaxy
Search for the_exit_voyager1_at_heliosphere_border_with_the_galaxySearch for the_exit_voyager1_at_heliosphere_border_with_the_galaxy
Search for the_exit_voyager1_at_heliosphere_border_with_the_galaxy
 
Role of Magnetic Reconnection in Coronal Heating
Role of Magnetic Reconnection in Coronal HeatingRole of Magnetic Reconnection in Coronal Heating
Role of Magnetic Reconnection in Coronal Heating
 
Streamer theory
Streamer theoryStreamer theory
Streamer theory
 
Discovery of rapid whistlers close to Jupiter implying lightning rates simila...
Discovery of rapid whistlers close to Jupiter implying lightning rates simila...Discovery of rapid whistlers close to Jupiter implying lightning rates simila...
Discovery of rapid whistlers close to Jupiter implying lightning rates simila...
 
Streamer theory
Streamer theoryStreamer theory
Streamer theory
 
H-mode-like confinement formation in the RF discharge plasma in the Uragan-3M...
H-mode-like confinement formation in the RF discharge plasma in the Uragan-3M...H-mode-like confinement formation in the RF discharge plasma in the Uragan-3M...
H-mode-like confinement formation in the RF discharge plasma in the Uragan-3M...
 
Electrostatic Edge Plasma Turbulence in the Uragan-3M torsatron
Electrostatic Edge Plasma Turbulence in the Uragan-3M torsatronElectrostatic Edge Plasma Turbulence in the Uragan-3M torsatron
Electrostatic Edge Plasma Turbulence in the Uragan-3M torsatron
 
Radioastron observations of_the_quasar_3_c273_a_challenge_to_the_brightness_t...
Radioastron observations of_the_quasar_3_c273_a_challenge_to_the_brightness_t...Radioastron observations of_the_quasar_3_c273_a_challenge_to_the_brightness_t...
Radioastron observations of_the_quasar_3_c273_a_challenge_to_the_brightness_t...
 
Newest_REUposter
Newest_REUposterNewest_REUposter
Newest_REUposter
 
Turbulent heating in_galaxy_clusters_brightest_in_x_rays
Turbulent heating in_galaxy_clusters_brightest_in_x_raysTurbulent heating in_galaxy_clusters_brightest_in_x_rays
Turbulent heating in_galaxy_clusters_brightest_in_x_rays
 
Relativistic boost as_the_cause_of_periodicity_in_a_massive_black_hole_binary...
Relativistic boost as_the_cause_of_periodicity_in_a_massive_black_hole_binary...Relativistic boost as_the_cause_of_periodicity_in_a_massive_black_hole_binary...
Relativistic boost as_the_cause_of_periodicity_in_a_massive_black_hole_binary...
 
Pulsar emission amplified and resolved by plasma lensing in an eclipsing binary
Pulsar emission amplified and resolved by plasma lensing in an eclipsing binaryPulsar emission amplified and resolved by plasma lensing in an eclipsing binary
Pulsar emission amplified and resolved by plasma lensing in an eclipsing binary
 
Interchange reconnection as the source of the fast solar wind within coronal ...
Interchange reconnection as the source of the fast solar wind within coronal ...Interchange reconnection as the source of the fast solar wind within coronal ...
Interchange reconnection as the source of the fast solar wind within coronal ...
 
AY121 Lab4 (Jonathan Kao) Final
AY121 Lab4 (Jonathan Kao) FinalAY121 Lab4 (Jonathan Kao) Final
AY121 Lab4 (Jonathan Kao) Final
 
Propagation of ELF Radiation from RS-LC System and Red Sprites in Earth- Iono...
Propagation of ELF Radiation from RS-LC System and Red Sprites in Earth- Iono...Propagation of ELF Radiation from RS-LC System and Red Sprites in Earth- Iono...
Propagation of ELF Radiation from RS-LC System and Red Sprites in Earth- Iono...
 

More from Felipe Hime

The Enchantment of the Alien: Metaphysics and Marginality in Late Medieval an...
The Enchantment of the Alien: Metaphysics and Marginality in Late Medieval an...The Enchantment of the Alien: Metaphysics and Marginality in Late Medieval an...
The Enchantment of the Alien: Metaphysics and Marginality in Late Medieval an...Felipe Hime
 
Improved Monitoring of Rainforests Helps Pierce Haze of Deforestation
Improved Monitoring of Rainforests Helps Pierce Haze of DeforestationImproved Monitoring of Rainforests Helps Pierce Haze of Deforestation
Improved Monitoring of Rainforests Helps Pierce Haze of DeforestationFelipe Hime
 
Vls 1 v03-relatorio_final
Vls 1 v03-relatorio_finalVls 1 v03-relatorio_final
Vls 1 v03-relatorio_finalFelipe Hime
 
Search for Interstellar Communication 1959
Search for Interstellar Communication 1959Search for Interstellar Communication 1959
Search for Interstellar Communication 1959Felipe Hime
 
Review of-space-activities-in-south-america
Review of-space-activities-in-south-americaReview of-space-activities-in-south-america
Review of-space-activities-in-south-americaFelipe Hime
 
Alfvenic velocity spikes and rotational flows
Alfvenic velocity spikes and rotational flowsAlfvenic velocity spikes and rotational flows
Alfvenic velocity spikes and rotational flowsFelipe Hime
 
A measurement of water vapour amid a largely
A measurement of water vapour amid a largelyA measurement of water vapour amid a largely
A measurement of water vapour amid a largelyFelipe Hime
 

More from Felipe Hime (7)

The Enchantment of the Alien: Metaphysics and Marginality in Late Medieval an...
The Enchantment of the Alien: Metaphysics and Marginality in Late Medieval an...The Enchantment of the Alien: Metaphysics and Marginality in Late Medieval an...
The Enchantment of the Alien: Metaphysics and Marginality in Late Medieval an...
 
Improved Monitoring of Rainforests Helps Pierce Haze of Deforestation
Improved Monitoring of Rainforests Helps Pierce Haze of DeforestationImproved Monitoring of Rainforests Helps Pierce Haze of Deforestation
Improved Monitoring of Rainforests Helps Pierce Haze of Deforestation
 
Vls 1 v03-relatorio_final
Vls 1 v03-relatorio_finalVls 1 v03-relatorio_final
Vls 1 v03-relatorio_final
 
Search for Interstellar Communication 1959
Search for Interstellar Communication 1959Search for Interstellar Communication 1959
Search for Interstellar Communication 1959
 
Review of-space-activities-in-south-america
Review of-space-activities-in-south-americaReview of-space-activities-in-south-america
Review of-space-activities-in-south-america
 
Alfvenic velocity spikes and rotational flows
Alfvenic velocity spikes and rotational flowsAlfvenic velocity spikes and rotational flows
Alfvenic velocity spikes and rotational flows
 
A measurement of water vapour amid a largely
A measurement of water vapour amid a largelyA measurement of water vapour amid a largely
A measurement of water vapour amid a largely
 

Recently uploaded

zoogeography of pakistan.pptx fauna of Pakistan
zoogeography of pakistan.pptx fauna of Pakistanzoogeography of pakistan.pptx fauna of Pakistan
zoogeography of pakistan.pptx fauna of Pakistanzohaibmir069
 
Evidences of Evolution General Biology 2
Evidences of Evolution General Biology 2Evidences of Evolution General Biology 2
Evidences of Evolution General Biology 2John Carlo Rollon
 
Is RISC-V ready for HPC workload? Maybe?
Is RISC-V ready for HPC workload? Maybe?Is RISC-V ready for HPC workload? Maybe?
Is RISC-V ready for HPC workload? Maybe?Patrick Diehl
 
Solution chemistry, Moral and Normal solutions
Solution chemistry, Moral and Normal solutionsSolution chemistry, Moral and Normal solutions
Solution chemistry, Moral and Normal solutionsHajira Mahmood
 
Heredity: Inheritance and Variation of Traits
Heredity: Inheritance and Variation of TraitsHeredity: Inheritance and Variation of Traits
Heredity: Inheritance and Variation of TraitsCharlene Llagas
 
Dashanga agada a formulation of Agada tantra dealt in 3 Rd year bams agada tanta
Dashanga agada a formulation of Agada tantra dealt in 3 Rd year bams agada tantaDashanga agada a formulation of Agada tantra dealt in 3 Rd year bams agada tanta
Dashanga agada a formulation of Agada tantra dealt in 3 Rd year bams agada tantaPraksha3
 
Neurodevelopmental disorders according to the dsm 5 tr
Neurodevelopmental disorders according to the dsm 5 trNeurodevelopmental disorders according to the dsm 5 tr
Neurodevelopmental disorders according to the dsm 5 trssuser06f238
 
Call Us ≽ 9953322196 ≼ Call Girls In Lajpat Nagar (Delhi) |
Call Us ≽ 9953322196 ≼ Call Girls In Lajpat Nagar (Delhi) |Call Us ≽ 9953322196 ≼ Call Girls In Lajpat Nagar (Delhi) |
Call Us ≽ 9953322196 ≼ Call Girls In Lajpat Nagar (Delhi) |aasikanpl
 
TOPIC 8 Temperature and Heat.pdf physics
TOPIC 8 Temperature and Heat.pdf physicsTOPIC 8 Temperature and Heat.pdf physics
TOPIC 8 Temperature and Heat.pdf physicsssuserddc89b
 
Module 4: Mendelian Genetics and Punnett Square
Module 4:  Mendelian Genetics and Punnett SquareModule 4:  Mendelian Genetics and Punnett Square
Module 4: Mendelian Genetics and Punnett SquareIsiahStephanRadaza
 
Transposable elements in prokaryotes.ppt
Transposable elements in prokaryotes.pptTransposable elements in prokaryotes.ppt
Transposable elements in prokaryotes.pptArshadWarsi13
 
Speech, hearing, noise, intelligibility.pptx
Speech, hearing, noise, intelligibility.pptxSpeech, hearing, noise, intelligibility.pptx
Speech, hearing, noise, intelligibility.pptxpriyankatabhane
 
‏‏VIRUS - 123455555555555555555555555555555555555555
‏‏VIRUS -  123455555555555555555555555555555555555555‏‏VIRUS -  123455555555555555555555555555555555555555
‏‏VIRUS - 123455555555555555555555555555555555555555kikilily0909
 
Call Girls in Aiims Metro Delhi 💯Call Us 🔝9953322196🔝 💯Escort.
Call Girls in Aiims Metro Delhi 💯Call Us 🔝9953322196🔝 💯Escort.Call Girls in Aiims Metro Delhi 💯Call Us 🔝9953322196🔝 💯Escort.
Call Girls in Aiims Metro Delhi 💯Call Us 🔝9953322196🔝 💯Escort.aasikanpl
 
LIGHT-PHENOMENA-BY-CABUALDIONALDOPANOGANCADIENTE-CONDEZA (1).pptx
LIGHT-PHENOMENA-BY-CABUALDIONALDOPANOGANCADIENTE-CONDEZA (1).pptxLIGHT-PHENOMENA-BY-CABUALDIONALDOPANOGANCADIENTE-CONDEZA (1).pptx
LIGHT-PHENOMENA-BY-CABUALDIONALDOPANOGANCADIENTE-CONDEZA (1).pptxmalonesandreagweneth
 
Best Call Girls In Sector 29 Gurgaon❤️8860477959 EscorTs Service In 24/7 Delh...
Best Call Girls In Sector 29 Gurgaon❤️8860477959 EscorTs Service In 24/7 Delh...Best Call Girls In Sector 29 Gurgaon❤️8860477959 EscorTs Service In 24/7 Delh...
Best Call Girls In Sector 29 Gurgaon❤️8860477959 EscorTs Service In 24/7 Delh...lizamodels9
 
Cytokinin, mechanism and its application.pptx
Cytokinin, mechanism and its application.pptxCytokinin, mechanism and its application.pptx
Cytokinin, mechanism and its application.pptxVarshiniMK
 
Twin's paradox experiment is a meassurement of the extra dimensions.pptx
Twin's paradox experiment is a meassurement of the extra dimensions.pptxTwin's paradox experiment is a meassurement of the extra dimensions.pptx
Twin's paradox experiment is a meassurement of the extra dimensions.pptxEran Akiva Sinbar
 
Call Girls in Hauz Khas Delhi 💯Call Us 🔝9953322196🔝 💯Escort.
Call Girls in Hauz Khas Delhi 💯Call Us 🔝9953322196🔝 💯Escort.Call Girls in Hauz Khas Delhi 💯Call Us 🔝9953322196🔝 💯Escort.
Call Girls in Hauz Khas Delhi 💯Call Us 🔝9953322196🔝 💯Escort.aasikanpl
 

Recently uploaded (20)

zoogeography of pakistan.pptx fauna of Pakistan
zoogeography of pakistan.pptx fauna of Pakistanzoogeography of pakistan.pptx fauna of Pakistan
zoogeography of pakistan.pptx fauna of Pakistan
 
Evidences of Evolution General Biology 2
Evidences of Evolution General Biology 2Evidences of Evolution General Biology 2
Evidences of Evolution General Biology 2
 
Is RISC-V ready for HPC workload? Maybe?
Is RISC-V ready for HPC workload? Maybe?Is RISC-V ready for HPC workload? Maybe?
Is RISC-V ready for HPC workload? Maybe?
 
Solution chemistry, Moral and Normal solutions
Solution chemistry, Moral and Normal solutionsSolution chemistry, Moral and Normal solutions
Solution chemistry, Moral and Normal solutions
 
Heredity: Inheritance and Variation of Traits
Heredity: Inheritance and Variation of TraitsHeredity: Inheritance and Variation of Traits
Heredity: Inheritance and Variation of Traits
 
Dashanga agada a formulation of Agada tantra dealt in 3 Rd year bams agada tanta
Dashanga agada a formulation of Agada tantra dealt in 3 Rd year bams agada tantaDashanga agada a formulation of Agada tantra dealt in 3 Rd year bams agada tanta
Dashanga agada a formulation of Agada tantra dealt in 3 Rd year bams agada tanta
 
Neurodevelopmental disorders according to the dsm 5 tr
Neurodevelopmental disorders according to the dsm 5 trNeurodevelopmental disorders according to the dsm 5 tr
Neurodevelopmental disorders according to the dsm 5 tr
 
Call Us ≽ 9953322196 ≼ Call Girls In Lajpat Nagar (Delhi) |
Call Us ≽ 9953322196 ≼ Call Girls In Lajpat Nagar (Delhi) |Call Us ≽ 9953322196 ≼ Call Girls In Lajpat Nagar (Delhi) |
Call Us ≽ 9953322196 ≼ Call Girls In Lajpat Nagar (Delhi) |
 
TOPIC 8 Temperature and Heat.pdf physics
TOPIC 8 Temperature and Heat.pdf physicsTOPIC 8 Temperature and Heat.pdf physics
TOPIC 8 Temperature and Heat.pdf physics
 
Module 4: Mendelian Genetics and Punnett Square
Module 4:  Mendelian Genetics and Punnett SquareModule 4:  Mendelian Genetics and Punnett Square
Module 4: Mendelian Genetics and Punnett Square
 
Transposable elements in prokaryotes.ppt
Transposable elements in prokaryotes.pptTransposable elements in prokaryotes.ppt
Transposable elements in prokaryotes.ppt
 
Speech, hearing, noise, intelligibility.pptx
Speech, hearing, noise, intelligibility.pptxSpeech, hearing, noise, intelligibility.pptx
Speech, hearing, noise, intelligibility.pptx
 
‏‏VIRUS - 123455555555555555555555555555555555555555
‏‏VIRUS -  123455555555555555555555555555555555555555‏‏VIRUS -  123455555555555555555555555555555555555555
‏‏VIRUS - 123455555555555555555555555555555555555555
 
Call Girls in Aiims Metro Delhi 💯Call Us 🔝9953322196🔝 💯Escort.
Call Girls in Aiims Metro Delhi 💯Call Us 🔝9953322196🔝 💯Escort.Call Girls in Aiims Metro Delhi 💯Call Us 🔝9953322196🔝 💯Escort.
Call Girls in Aiims Metro Delhi 💯Call Us 🔝9953322196🔝 💯Escort.
 
LIGHT-PHENOMENA-BY-CABUALDIONALDOPANOGANCADIENTE-CONDEZA (1).pptx
LIGHT-PHENOMENA-BY-CABUALDIONALDOPANOGANCADIENTE-CONDEZA (1).pptxLIGHT-PHENOMENA-BY-CABUALDIONALDOPANOGANCADIENTE-CONDEZA (1).pptx
LIGHT-PHENOMENA-BY-CABUALDIONALDOPANOGANCADIENTE-CONDEZA (1).pptx
 
Best Call Girls In Sector 29 Gurgaon❤️8860477959 EscorTs Service In 24/7 Delh...
Best Call Girls In Sector 29 Gurgaon❤️8860477959 EscorTs Service In 24/7 Delh...Best Call Girls In Sector 29 Gurgaon❤️8860477959 EscorTs Service In 24/7 Delh...
Best Call Girls In Sector 29 Gurgaon❤️8860477959 EscorTs Service In 24/7 Delh...
 
Cytokinin, mechanism and its application.pptx
Cytokinin, mechanism and its application.pptxCytokinin, mechanism and its application.pptx
Cytokinin, mechanism and its application.pptx
 
Volatile Oils Pharmacognosy And Phytochemistry -I
Volatile Oils Pharmacognosy And Phytochemistry -IVolatile Oils Pharmacognosy And Phytochemistry -I
Volatile Oils Pharmacognosy And Phytochemistry -I
 
Twin's paradox experiment is a meassurement of the extra dimensions.pptx
Twin's paradox experiment is a meassurement of the extra dimensions.pptxTwin's paradox experiment is a meassurement of the extra dimensions.pptx
Twin's paradox experiment is a meassurement of the extra dimensions.pptx
 
Call Girls in Hauz Khas Delhi 💯Call Us 🔝9953322196🔝 💯Escort.
Call Girls in Hauz Khas Delhi 💯Call Us 🔝9953322196🔝 💯Escort.Call Girls in Hauz Khas Delhi 💯Call Us 🔝9953322196🔝 💯Escort.
Call Girls in Hauz Khas Delhi 💯Call Us 🔝9953322196🔝 💯Escort.
 

Voyager 2 plasma observations of the heliopause

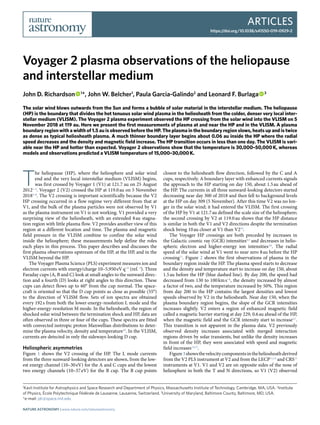
  • 1. Articles https://doi.org/10.1038/s41550-019-0929-2 1 Kavli Institute for Astrophysics and Space Research and Department of Physics, Massachusetts Institute of Technology, Cambridge, MA, USA. 2 Institute of Physics, École Polytechnique Fédérale de Lausanne, Lausanne, Switzerland. 3 University of Maryland, Baltimore County, Baltimore, MD, USA. *e-mail: jdr@space.mit.edu T he heliopause (HP), where the heliosphere and solar wind end and the very local interstellar medium (VLISM) begins, was first crossed by Voyager 1 (V1) at 121.7 au on 25 August 20121–4 . Voyager 2 (V2) crossed the HP at 119.0 au on 5 November 20185–8 . The V2 crossing is important scientifically because the V2 HP crossing occurred in a flow regime very different from that at V1, and the bulk of the plasma particles were not observed by V1 as the plasma instrument on V1 is not working. V1 provided a very surprising view of the heliosheath, with an extended 8 au stagna- tion region with little plasma flow. V2 provides another view of this region at a different location and time. The plasma and magnetic field pressure in the VLISM combine to confine the solar wind inside the heliosphere; these measurements help define the roles each plays in this process. This paper describes and discusses the first plasma observations upstream of the HP, at the HP, and in the VLISM beyond the HP. The Voyager Plasma Science (PLS) experiment measures ion and electron currents with energy/charge 10–5,950 eV q−1 (ref. 9 ). Three Faraday cups (A, B and C) look at small angles to the sunward direc- tion and a fourth (D) looks at right angles to this direction. These cups can detect flows up to 60° from the cup normal. The space- craft is oriented so that the D cup points as close as possible (55°) to the direction of VLISM flow. Sets of ion spectra are obtained every 192 s from both the lower-energy-resolution L mode and the higher-energy-resolution M mode. In the heliosheath, the region of shocked solar wind between the termination shock and HP, data are often observed in three or four of the cups. These spectra are fitted with convected isotropic proton Maxwellian distributions to deter- mine the plasma velocity, density and temperature10 . In the VLISM, currents are detected in only the sideways-looking D cup. Heliospheric asymmetries Figure 1 shows the V2 crossing of the HP. The L mode currents from the three sunward-looking detectors are shown, from the low- est energy channel (10–30 eV) for the A and C cups and the lowest two energy channels (10–57 eV) for the B cup. The B cup points closest to the heliosheath flow direction, followed by the C and A cups, respectively. A boundary layer with enhanced currents signals the approach to the HP starting on day 150, about 1.5 au ahead of the HP. The currents in all three sunward-looking detectors started decreasing near day 300 of 2018 and then fell to background levels at the HP on day 309 (5 November). After this time V2 was no lon- ger in the solar wind; it had entered the VLISM. The first crossing of the HP by V1 at 121.7 au defined the scale size of the heliosphere; the second crossing by V2 at 119.0 au shows that the HP distance is similar in both the V1 and V2 directions despite the termination shock being 10 au closer at V1 than V210 . The Voyager HP crossings are both preceded by increases in the Galactic cosmic ray (GCR) intensities4,5 and decreases in helio- spheric electron and higher-energy ion intensities3,6 . The radial speed of the solar wind at V1 went to near zero 8 au before the HP crossing11 . Figure 2 shows the first observations of plasma in the boundary region inside the HP. The plasma speed starts to decrease and the density and temperature start to increase on day 150, about 1.5 au before the HP (blue dashed line). By day 200, the speed had decreased from 130 to 100 km s−1 , the density increased by almost a factor of two, and the temperature increased by 50%. This region from day 200 to the HP contains the largest densities and lowest speeds observed by V2 in the heliosheath. Near day 150, when the plasma boundary region begins, the slope of the GCR intensities increases slightly. V2 enters a region of enhanced magnetic field called a magnetic barrier starting at day 229, 0.6 au ahead of the HP, when the magnetic field and the GCR intensity start to increase5,7 . This transition is not apparent in the plasma data. V2 previously observed density increases associated with merged interaction regions driven by solar transients, but unlike the density increases in front of the HP, they were associated with speed and magnetic field increases12,13 . Figure3showsthevelocitycomponentsintheheliosheathderived from the V2 PLS instrument at V2 and from the LECP11,14 and CRS15 instruments at V1. V1 and V2 are on opposite sides of the nose of heliosphere in both the T and N directions, so V1 (V2) observed Voyager 2 plasma observations of the heliopause and interstellar medium John D. Richardson   1 *, John W. Belcher1 , Paula Garcia-Galindo2 and Leonard F. Burlaga   3 The solar wind blows outwards from the Sun and forms a bubble of solar material in the interstellar medium. The heliopause (HP) is the boundary that divides the hot tenuous solar wind plasma in the heliosheath from the colder, denser very local inter- stellar medium (VLISM). The Voyager 2 plasma experiment observed the HP crossing from the solar wind into the VLISM on 5 November 2018 at 119 au. Here we present the first measurements of plasma at and near the HP and in the VLISM. A plasma boundary region with a width of 1.5 au is observed before the HP. The plasma in the boundary region slows, heats up and is twice as dense as typical heliosheath plasma. A much thinner boundary layer begins about 0.06 au inside the HP where the radial speed decreases and the density and magnetic field increase. The HP transition occurs in less than one day. The VLISM is vari- able near the HP and hotter than expected. Voyager 2 observations show that the temperature is 30,000–50,000 K, whereas models and observations predicted a VLISM temperature of 15,000–30,000 K. Nature Astronomy | www.nature.com/natureastronomy
  • 2. Articles Nature Astronomy negative (positive) T and positive (negative) N flow. To compare the magnitudes of VT and VN at V1 and V2, the signs of VT and VN for V1 are reversed in the plot. The data are plotted so that the termina- tion shock and HP are at the same location for each spacecraft. The difference between the V1 and V2 profiles is striking. The V1 VR is much lower than that at V2 throughout the heliosheath and goes to zero about 8 au before the HP. At V2, VR slowly decreases across the heliosheath, then drops sharply just before the HP. The magnitude of VT is also much larger at V2 than V1, whereas the magnitude of VN decreases at both spacecraft before the HP. The differences in the speed profiles at V1 and V2 are not understood. HP boundary layer Figure 4 in an enlargement of the region near the HP to show the plasma density, velocity components and magnetic field BT. These data show that a boundary layer is present in front of the HP starting near day 302, about 0.06 au before the HP. In this bound- ary layer, the density increases by a factor of two, the magnitudes of VR and VN decrease, the flow angle in the RT plane increases, and the magnitude of BT increases by 30%. The magnetic barrier is an increase in magnetic field that extends 0.6 au ahead of the HP7 . This region contains solar wind plasma that is modified near the HP boundary. Plasma in the VLISM The PLS instrument observes currents from the VLISM plasma in the D cup, but these measurements are difficult to conduct as the average proton energies are comparable to the PLS energy threshold of 10 eV, the expected flow is at the edge of the cup’s acceptance angle and the data (especially in the D cup) are often contaminated by noise. For the L mode, data are observed only in the lowest-energy (10–30 eV) channel of the D cup. The M mode spectra have under- lying systematic noise that varies and is larger than the expected currents. Figure 5 shows 15-point running averages of the current in the 10–30 eV channel of the D cup from spectra with minimal noise. The dashed vertical line is the HP, where the currents drop. The cur- rents in the VLISM vary from 30–70 fA (10−15  A), which could be due to changes in speed, flow direction, density or temperature. The region of increased currents from day 418–435 (22 February to 11 March 2019) starts at about the same time as the plasma oscillations observed by the Plasma Wave (PWS) experiment cease8 , consistent with a shock passing V2, as these oscillations are generated by elec- tron beams upstream of a shock2 . The currents increase after day 430, which suggests that the density increases away from the HP, as observed by V116 . We want to determine the VLISM speed, density and tempera- ture, but with one data point in each spectrum we cannot derive these three quantities. However, in January 2019, the PWS experi- ment observed plasma oscillations in the 1.78 kHz band8 , giving an electron density of 0.039 ± 30% cm−3 . These oscillations persisted from day 394 (29 January 2019) to roughly the time of the increase in current at day 418 (22 February 2019). The observed PLS cur- rents in the D cup during that period were 35–50 fA. We assume that the electron and proton densities are roughly equal and use the PWS-derived density to constrain VT, the flow towards the D cup and the thermal speed or temperature of the protons. Figure 6 shows contours of simulated proton currents in the D cup for a density of 0.04 cm−3 and a range VT values and temperatures. The speed of the unperturbed LISM is about 26 km s−1 (ref. 17 ); this flow is slowed and deflected near the HP. The temperature far from the HP in the VLISM is about 7,500 K (ref. 17 ); models predict that this plasma is compressed and heated by a factor of 2–4 near the HP18 , or more if 200 150 B cup channels 1 + 2 HP C cup, channel 1 A cup, channel 1 100 150 200 Day of 2018 250 300 350 100 Current(fA) 50 0 Fig. 1 | Current observed by the V2 PLS experiment in the three Faraday cups that look sunwards. Energies from 10–57 eV are shown for the B cup, which looks most closely towards the flow direction. For the A and C cups the energy range 10–30 eV is shown. On day 150, V2 enters the plasma boundary layer where the currents increase. At the HP (vertical dashed line), the observed currents in all three cups fall to background levels as V2 leaves the solar wind and enters the VLISM. HP Plasma boundary region Magnetic barrier ∣V∣(kms–1 )∣B∣(nT) N(cm–3 )GCRintensities (countss–1 ) T(K) 50 100 150 0 0.008 0.006 0.004 0.002 0 1 × 10⁵ 8 × 10⁴ 6 × 10⁴ 4 × 10⁴ 2 × 10⁴ 0 0.6 0.4 0.2 0 2.4 2.2 2.0 1.8 1.6 0 50 100 150 Day of 2018 200 250 300 Fig. 2 | Daily averages of solar wind speed, density, temperature, magnetic field magnitude and GCR count rates. The plasma boundary layer (dashed blue lines) extends 1.5 au from day 150 to the HP, with a decrease in speed and increase in density and temperature. The GCR slope increases slightly at the start of this region. Nature Astronomy | www.nature.com/natureastronomy
  • 3. ArticlesNature Astronomy it is also heated by reconnection in a plasma depletion layer19 . For currents of 35–50 fA, the values of VT and temperature (T) are con- strained to lie within the shaded region of Fig. 6. The range of VT can be further constrained; the flow should slow near the HP and only a component of the flow is in the VT plane. A reasonable upper limit for VT is 15 km s−1 , which corresponds to T > 30,000 K, near the upper limit predicted for T by models18 . V2 occasionally rolls around the axis pointed towards Earth. Three 360° rolls have occurred since the HP crossing, each last- ing 2,000 s; the PLS instrument makes a measurement every 192 s, so a roll provides about 10 measurements at different look direc- tions, which (in principal) allows the determination of VT, T and N. Figure 7 shows M mode currents measured in the D cup in two energy channels from spacecraft rolls on days 22 and 164 of 2019. The simulated currents show that when a roll begins, the D cup first moves away from the plasma flow direction and the predicted cur- rents decrease, then near the end of the roll the cup points closer to the expected flow and currents increase, before the cup returns to the original orientation. The currents in the D cup channels are scaled to highlight the roll variations and are in qualitative agree- ment with expectations. This signal is convincing evidence that PLS is measuring the VLISM plasma. Removal of the noise affecting these currents and fitting the VLISM plasma parameters are sub- jects of future work. Summary V2crossedtheHPat119.0 au,similartothe121.7 audistancefromV1, and is making the first plasma measurements in the VLISM. A 1.5-au- thick plasma boundary region was discovered ahead of the HP with lower speeds and enhanced densities and temperatures. The plasma flow speed at V2 remained high just before the HP, in sharp contrast to V1, for which a flow stagnation region was observed for 2 years before the HP crossing. This difference suggests that V1 observations may be anomalous, perhaps due to instabilities of the HP boundary. The HP boundary was sharp, occurring over less than a day, with a boundary layer observed to start about 8 days before the crossing. The sharpness of the HP itself was expected, but accompanied by a more 95 100 105 V1 distance (au) V2 PLS V1 LECP –V1 LECP –V1 CRS V2 PLS V2 PLS HP TS 110 115 120 VR(kms–1 )VT(kms–1 )VN(kms–1 ) 100 50 0 40 20 0 –20 –40 –60 –80 –100 80 90 100 V2 distance (au) 110 120 150 200 100 50 0 Fig. 3 | Plasma velocity components observed by V1 and V2 in the heliosheath in the RTN coordinate system. In the RTN system, R is radially outwards, T is parallel to the plane of the solar equator and positive in the direction of the Sun’s rotation and N completes a right-handed system. The vertical lines show the termination shock (TS) and HP crossings. V2 speeds are from the plasma instrument and V1 speeds are derived from LECP (VR and VT) and CRS (VN) data using the Compton–Getting effect. The signs of VT and VN are reversed for the V1 data. The magnitudes of VR and VT are much lower at V1 than V2 across the entire heliosheath. The stagnation region observed at V1 where the speed approached zero for 8 au before the HP was not observed at V2. 118.85 118.90 118.95 Distance from sun (au) HP VT 119.00 0.008 0.010 0.006 0.004 N(cm–3 ) VR,VT,VN(kms–1 ) BT(nT) 0.002 0 80 60 40 VR VN 20 0 –20 –0.65 –0.60 –0.55 –0.50 –0.45 –0.40 290 295 300 Day of 2018 305 310 Fig. 4 | The HP boundary layer extends from day 302 to the HP. In this boundary layer the density N increases, VR decreases (and since VT is constant, the flow angle in the RT plane increases), and the magnetic field BT increases. This layer has a width of 0.06 au. V1 VT and VN flow directions are opposite those at V2; the plot shows negative values to facilitate comparison of flow magnitudes. Error bars are the standard errors of the mean for the daily averaged plasma parameters. 100 HP 80 60 40 Dcupcurrents(fA) 20 0 250 300 350 400 Day of 2018 450 500 Fig. 5 | Currents observed in the PLS D cup, which looks closest to the VLISM flow. These are 15-point running averages from the spectra least contaminated by noise. The currents decrease at the HP but do not go to background levels, with a possible shock at day 418 and an increase in the current level after day 435. Nature Astronomy | www.nature.com/natureastronomy
  • 4. Articles Nature Astronomy gradual decrease in VR. We note that Krimigis et al.6 suggest a larger region of decreased VR than the PLS measurements; why these differ- ent instruments give different velocities is not yet understood. The VLISM currents are variable with a possible shock observed near Feb 22, 2019. The temperature of the VLISM is at the high end of that expected, of order 30,000–50,000 K. This higher T suggests either more compression of the plasma than predicted or heating by reconnection. Variations of the currents observed during spacecraft rolls provide convincing evidence that the PLS observes the VLISM and may allow future determinations of the VLISM speed, density, and temperature. Methods The Voyager PLS measures ion and electron currents with energy/charge of 10–5950 eV q−1 and is fully described by Bridge et al.9 . In the heliosheath, the region of shocked solar wind between the termination shock and HP, data are often observed in three or four of the cups. These spectra are fitted with convected isotropic proton Maxwellian distributions using the full response function of the instrument to determine the thermal proton velocity, density and temperature20 . The average 1σ errors in the heliosheath are about 8% for radial speed, 25% for density and 31% for the thermal speed21 . In the VLISM currents are only detected in the sideways-looking D cup. Data availability Data from the Voyager Plasma experiment are available at http://web.mit.edu/ space/www/voyager.html Received: 12 July 2019; Accepted: 27 September 2019; Published: xx xx xxxx References 1. Burlaga, L. F. et al. Magnetic field observations as Voyager 1 entered the heliosheath depletion region. Science 341, 147–150 (2013). 2. Gurnett, D. A., Kurth, W. S., Burlaga, L. F. & Ness, N. F. In situ observations of interstellar plasma with Voyager 1. Science 341, 1489–1492 (2013). 3. Krimigis, S. M. et al. Search for the exit: Voyager 1 at heliosphere’s border with the galaxy. Science 341, 144–147 (2013). 4. Stone, E. C. et al. Voyager 1 observes low-energy galactic cosmic rays in a region depleted of heliospheric ions. Science 341, 150–153 (2013). 5. Stone, E. C., Cummings, A. C., Heikkila, B. C. & Lal, N. Cosmic ray measurements from Voyager 2 as it crossed into interstellar space. Nat. Astron. https://doi.org/10.1038/s41550-019-0928-3 (2019). 6. Krimigis, S. M. et al. Energetic charged particle measurements from Voyager 2 at the heliopause and beyond. Nat. Astron. https://doi.org/10.1038/ s41550-019-0927-4 (2019). 7. Burlaga, L. F. et al. Magnetic field and particle measurements made by Voyager 2 at and near the heliopause. Nat. Astron. https://doi.org/10.1038/ s41550-019-0920-y (2019). 8. Gurnett, D. A. & Kurth, W. S. Plasma densities near and beyond the heliopause from the Voyager 1 and 2 plasma wave instruments. Nat. Astron. https://doi.org/10.1038/s41550-019-0918-5 (2019). 9. Bridge, H. S. et al. The plasma experiment on the 1977 Voyager mission. Space Sci. Rev. 21, 259–287 (1977). 10. Richardson, J. D. et al. Cool heliosheath plasma and deceleration of the upstream solar wind at the termination shock. Nature 464, 63–65 (2008). 11. Krimigis, S. M., Roelof, E. C., Decker, R. B. & Hill, M. E. Zero outward flow velocity for plasma in a heliosheath transition layer. Nature 474, 359–361 (2011). 12. Burlaga, L. F., Ness, N. F. & Richardson, J. D. Transition from the unipolar region to the sector zone: Voyager 2, 2013 and 2014. Astrophys J. 841, 47–59 (2017). 13. Richardson, J. D. et al. Pressure pulses at Voyager 2: drivers of interstellar transients? Astrophys. J. 834, 190–195 (2017). 14. Decker, R. B., Krimigis, S. M., Roelof, R. B. & Hill, M. E. No meridional plasma flow in the heliosheath transition region. Nature 489, 124–127 (2012). 15. Stone, E. C. & Cummings, A. C. Cosmic rays in the heliosheath. Proc. Int. Cosmic Ray Conf. Beijing 12, 29–32 (2012). 16. Gurnett, D. A. et al. Precursors to interstellar shocks of solar origin. Astrophys. J. 809, 121–130 (2015). 17. McComas, D. J. et al. Local interstellar medium: Six years of direct sampling by IBEX. Astrophys. J. Suppl. Ser. 220, 22–32 (2015). 18. Zank, G. Interaction of the solar wind with the local interstellar medium: a theoretical perspective. Space Sci. Rev. 89, 413–688 (1999). 19. Fuselier, S. A. & Cairns, I. H. Reconnection at the heliopause: predictions for Voyager 2. J. Phys.Conf. Ser. 900, 012007 (2017). 20. Barnett, A. & Olbert, S. Response function of modulated grid Faraday cup plasma instruments. Rev. Sci. Instrum. 57, 2432–2440 (1986). 25 1 40 100 80 60 50 40 20 10 5 30 30 20 10 5 Currents (fA) 15 20 Wth (km s–1 ) 25 30 2 T (× 104 K) 3 5 20 15 VT(kms–1 ) 10 5 Fig. 6 | Contours of currents in the 10–30 eV channel of the D cup. Data are for the density 0.04 cm−3 measured by PWS as a function of VT and the proton thermal speed (Wth) and T. The PLS currents at the times of the PWS measurements varied from 35–50 fA, constraining the values of VT and T to the shaded red and blue region. VT is probably under 15 km s−1 , so the red region shows the preferred portion of VT and T parameter space. Simulation Simulation 12.2–14.5 12.2–14.5 eV 16.8–19.3 eV 10–12.2 eV eV 40 50 30 20 Current(fA) 10 0 40 50 30 20 Current(fA) 10 0 0 10 20 30 40 Minute Minute 50 60 70 0 20 40 60 80 Fig. 7 | Observations of plasma currents in selected high-energy resolution M mode channels during the V2 rolls in 2019. Top: day 21. Bottom: day 164. The simulated variation for the 12.2–14.5 eV channel for VR, VT, VN = (0, 15, −10) km s−1 , N = 0.06 cm3 and T = 54,000 K is shown by the dashed red line; simulations for other channels are qualitatively similar. The two energy channels with the clearest response in each roll are shown. The measured currents have noise; the variation shown is real, but qualitative. The response of the cup during these rolls confirms that it observes VLISM plasma; with more work on noise removal these data may be used to determine the VLISM N, T and V. Nature Astronomy | www.nature.com/natureastronomy
  • 5. ArticlesNature Astronomy 21. Richardson, J. D. & Decker, R. B. Voyager 2 observations of plasmas and flows out to 104 AU. Astrophys. J. 792, 126–130 (2014). Acknowledgements The work at MIT is supported by NASA. Magnetic field and GCR data are shown courtesy of the Voyager Magnetometer (N. Ness, P.I.) and Cosmic Ray Subsystem (E. Stone, P.I.) teams. We thank G. S. Gordon Jr and L. A. Finck for development of, and assistance with, the plasma analysis. Author contributions J.D.R. analysed the plasma data and wrote the paper. J.W.B. developed the data analysis routines and participated in the design of the instrument. P.G.-G. assisted with the simulations of the currents. L.F.B. analysed the magnetic field data. Competing interests The authors declare no competing interests. Additional information Correspondence and requests for materials should be addressed to J.D.R. Peer review information Nature Astronomy thanks George Livadiotis, Brian Wood and the other, anonymous, reviewer(s) for their contribution to the peer review of this work. Reprints and permissions information is available at www.nature.com/reprints. Publisher’s note Springer Nature remains neutral with regard to jurisdictional claims in published maps and institutional affiliations. © The Author(s), under exclusive licence to Springer Nature Limited 2019 Nature Astronomy | www.nature.com/natureastronomy