Download to read offline


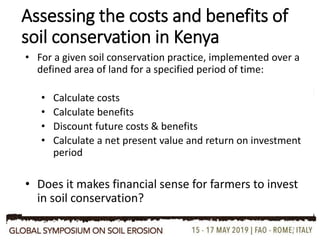

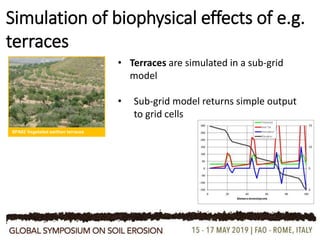
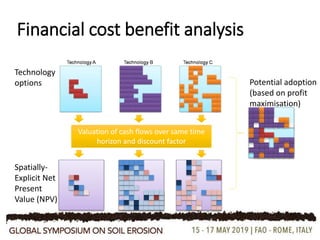
![[A – B – C + D] =
Annual cash flow series for
each technology and grid cell
Production
foregone
without case
X Value (€)
X Value (€)
Foregone
costs of:
- Production
Costs of:
- Production
- Maintenance
- Other (e.g.
area loss)
DC
BAProduction
with applied
technology
Cash flow series are constructed for
each grid cell](https://image.slidesharecdn.com/4gserstringerforromeclean-190524125905/85/Addressing-soil-erosion-through-policy-and-economic-assessments-16-320.jpg)


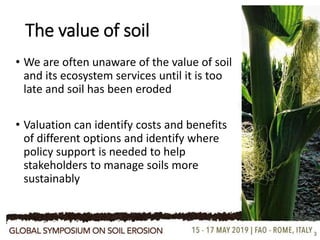
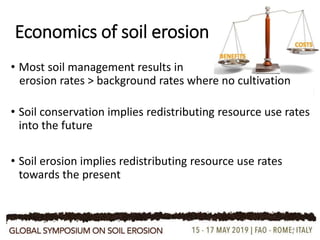
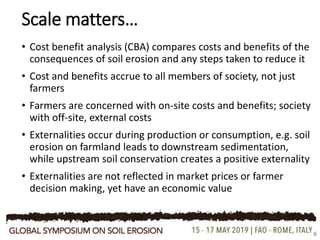
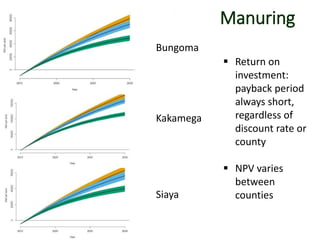
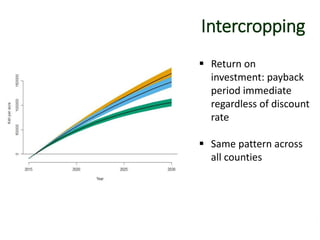
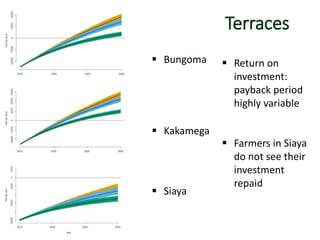
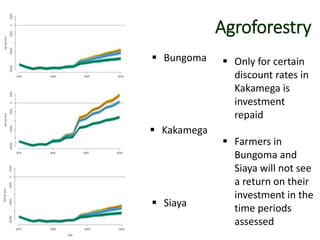
The document discusses the economic assessment of soil erosion and its management, emphasizing the importance of valuing soil ecosystem services and understanding the costs and benefits associated with soil conservation practices. It highlights the need for policies that recognize both individual farmer and societal gains while addressing externalities that are often overlooked in market prices. The case study in Kenya indicates variability in return on investment for different soil conservation practices and calls for targeted policy to support cost-effective soil management solutions.


