The generation of a stable master cell line requires the integration of the expression cassette into the host cell genome.
https://www.creativebiolabs.net/magic-mammalian-cell-expression-service.htm
1. The generation of a stable master cell line requires the integration of the expression cassette into
the host cell genome. Strong promoters like the immediate early cytomegalovirus (CMV) or the
cellular elongation factor (EF) 1-alpha promoter and polyadenylation sites from the simian virus (SV)
40 or the bovine growth hormone (BGH) for improved mRNA stability and translation efficiency are
usually implemented into the expression vector. Furthermore, there are different methods to
enhance antibody expression by increasing the number of antibody gene copies in the genome
through gene amplification. The generation of producer cell lines is still a time-consuming, laborious,
and quite expensive process, although the procedure has been dramatically improved and
accelerated. Therefore, transient expression is helpful, especially when a large number of different
antibodies have to be expressed at lower or medium yields or the product homogeneity is not critical,
for example, in research and development. Moreover, transient mammalian antibody production can
be scaled up by employing batch or fed-batch bioreactor processes to more than 150 L production
volumes. Therefore, transient antibody production is suitable for small-scale production in antibody
screening, but also capable to generate grams of antibodies.
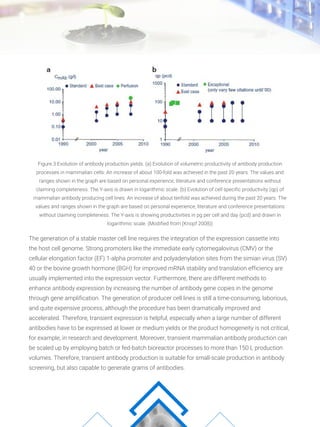
Figure.3 Evolution of antibody production yields. (a) Evolution of volumetric productivity of antibody production
processes in mammalian cells. An increase of about 100-fold was achieved in the past 20 years. The values and
ranges shown in the graph are based on personal experience, literature and conference presentations without
claiming completeness. The Y-axis is drawn in logarithmic scale. (b) Evolution of cell specific productivity (qp) of
mammalian antibody producing cell lines. An increase of about tenfold was achieved during the past 20 years. The
values and ranges shown in the graph are based on personal experience, literature and conference presentations
without claiming completeness. The Y-axis is showing productivities in pg per cell and day (pcd) and drawn in
logarithmic scale. (Modified from (Knopf 2008))