Download as PDF, PPTX

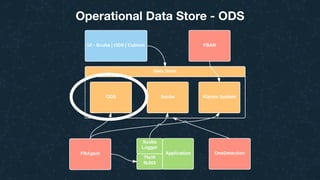
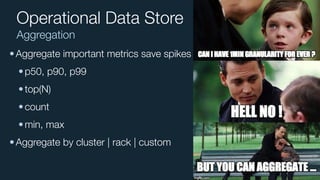

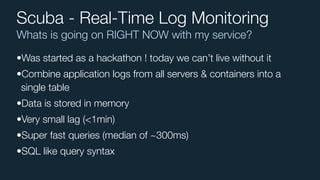
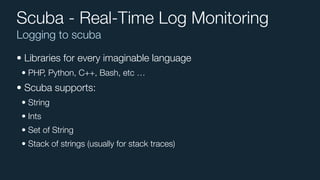
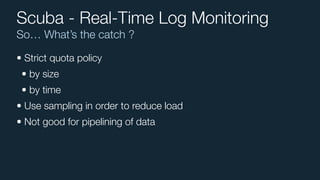
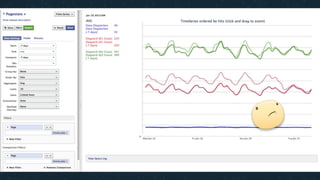
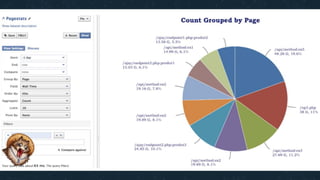
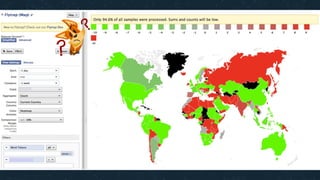

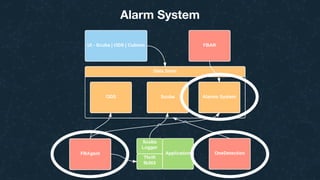
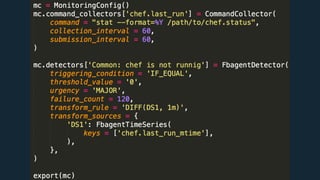
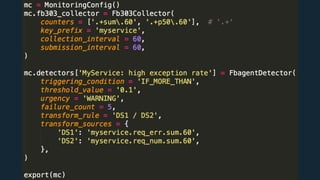
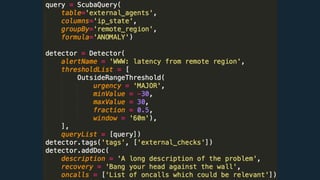
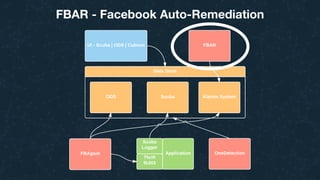
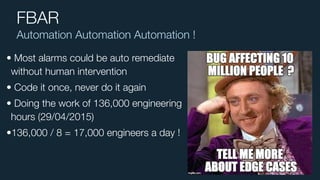
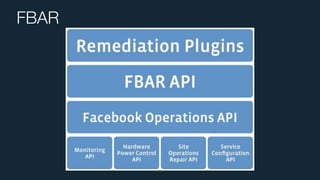
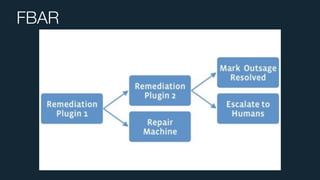
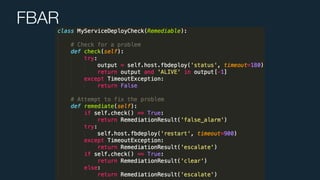
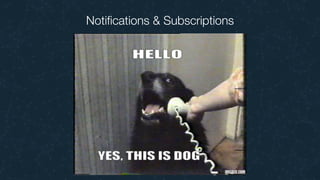
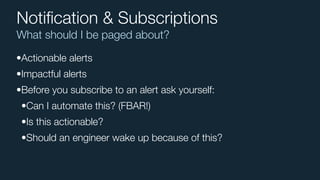

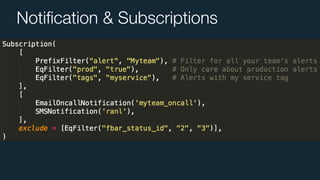
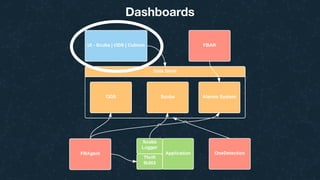
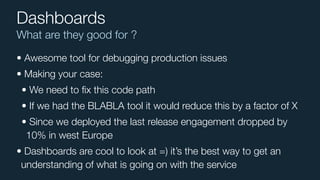
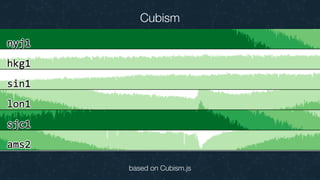
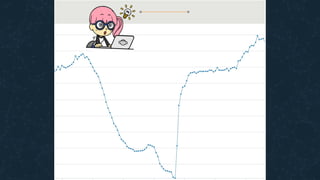


This document summarizes Ran Leibman's presentation on monitoring tools, components, and mentality at Facebook. It describes Facebook's monitoring architecture including the operational data store (ODS) for storing metrics, Scuba for real-time log monitoring, the alarm system for creating alerts, Facebook Auto-Remediation (FBAR) for automating issue resolution, notifications and subscriptions for alerting engineers, and dashboards for visualizing data. The presentation emphasizes treating metrics as important data, empowering developers to monitor, automating problem resolution, and using monitoring to surface previously unknown issues.