Monitorama PDX, June 29th 2016
Statistics for Engineers
Heinrich Hartmann, Circonus
@HeinrichHartman
Hi, I am Heinrich
· Lives in Munich, EU
· Refugee from Academia (Ph.D.)
· Analytics Lead at Circonus,
Monitoring and Analytics Platform
heinrich.hartmann@circonus.com
@HeinrichHartman(n)
@HeinrichHartman
#StatsForEngineers has been around for a while
[1] Statistics for Engineers @ ACM Queue
[2] Statistics for Engineers Workshop Material @ GitHub
[3] Spike Erosion @ circonus.com
[4] T. Schlossnagle - The Problem with Math @ circonus.com
[5] T. Schlossnagle - Percentages are not People @ circonus.com
[6] W. Vogels - Service Level Agreements in Amazon’s Dynamo/Sec. 2.2
[7] G. Schlossnagle - API Performance Monitoring @ Velocity Bejing 2015
Upcoming
[8] 3h workshop “Statistics for Engineers” @ SRECon 2016 in Dublin
@HeinrichHartman
A tale of API Monitoring
@HeinrichHartman
“Attic” - a furniture webstore
· Attic is a (fictional) furniture webstore
· Web API serving their catalog
· Loses money if requests take too long
Monitoring Goals
1. Measure user experience / quality of service
2. Determine (financial) implications of service degradation
3. Define sensible SLA-targets for the Dev- and Ops-teams
@HeinrichHartman
{1} External Monitoring
@HeinrichHartman
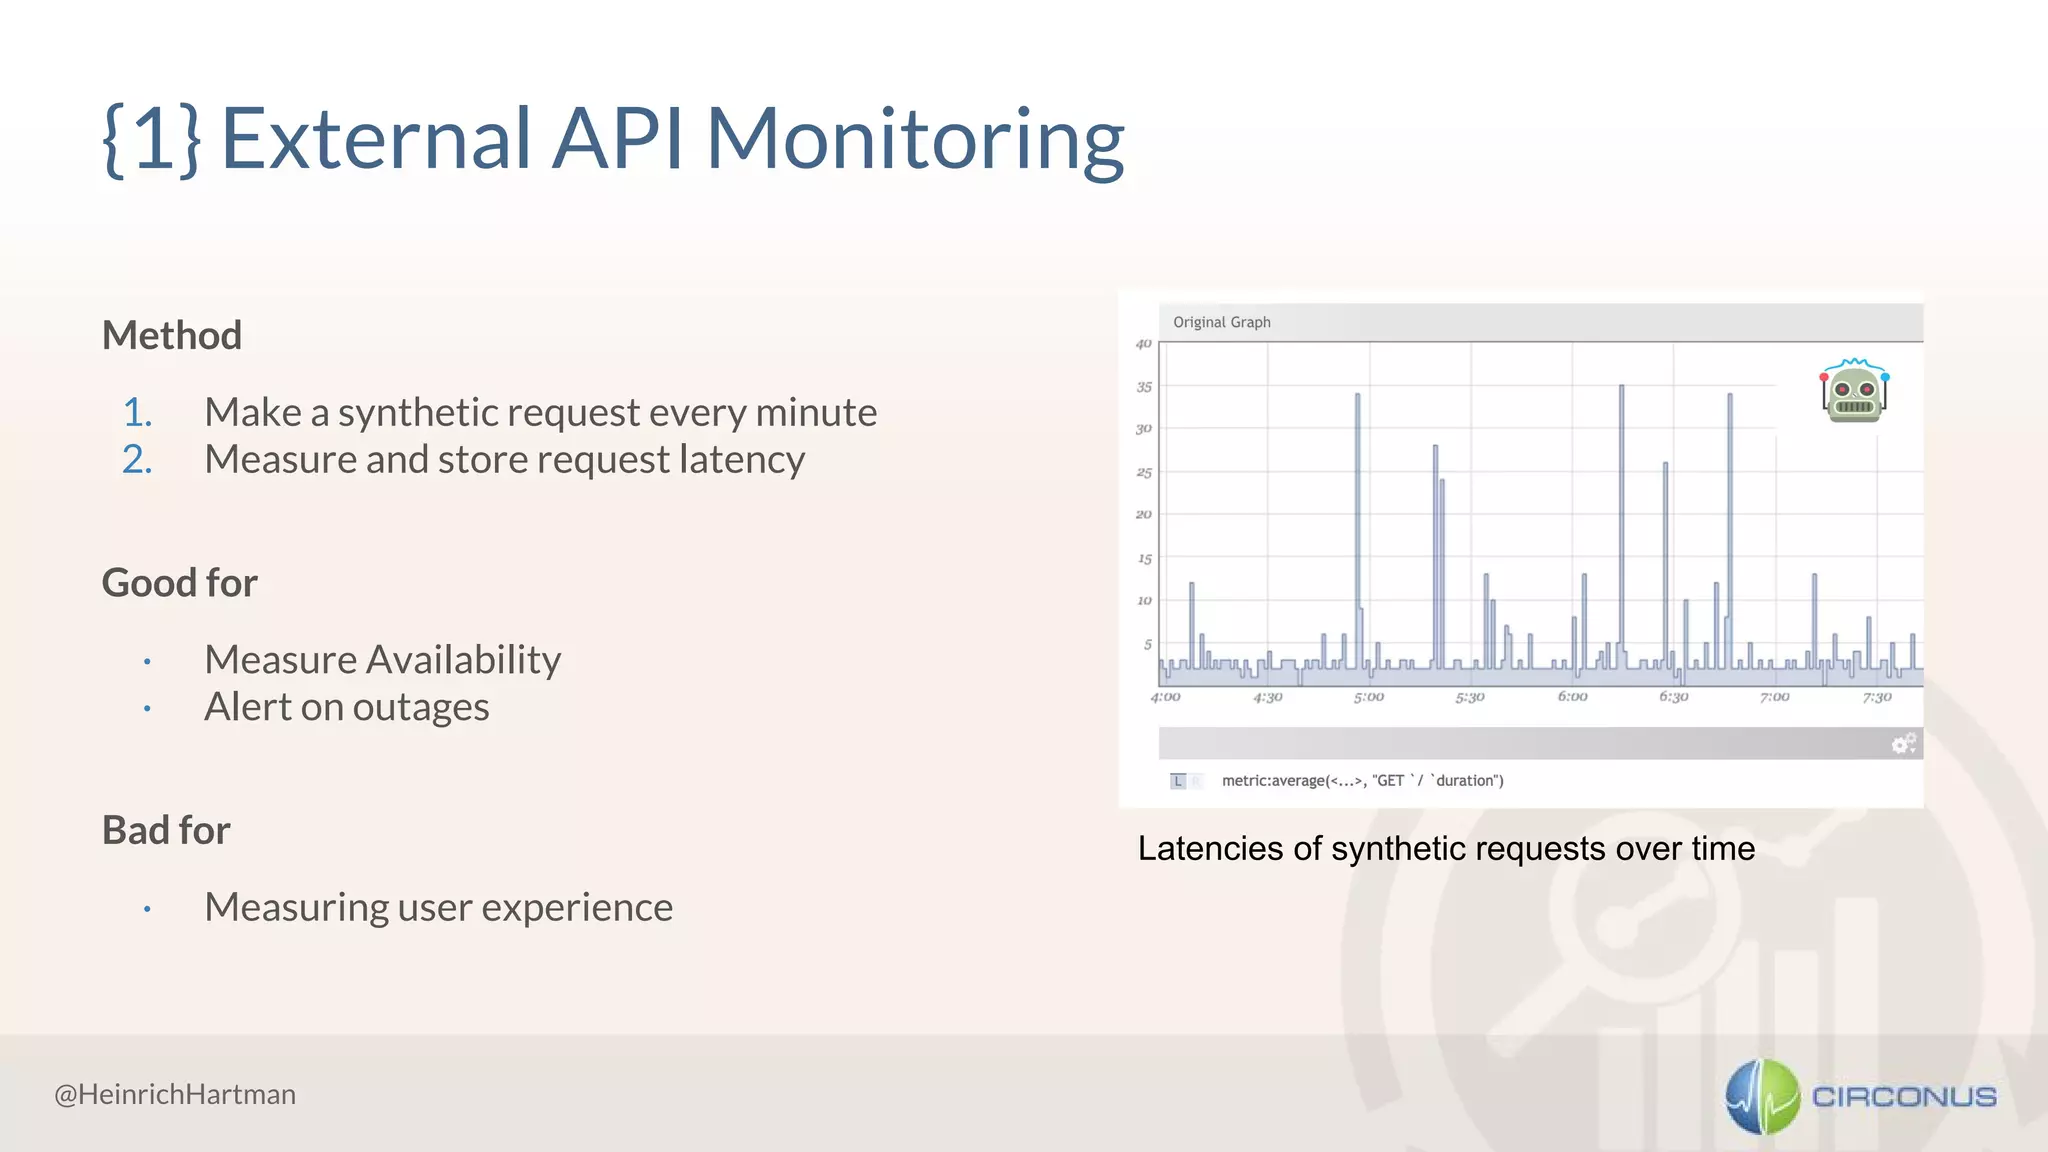
{1} External API Monitoring
Method
1. Make a synthetic request every minute
2. Measure and store request latency
Good for
· Measure Availability
· Alert on outages
Bad for
· Measuring user experience
Latencies of synthetic requests over time
@HeinrichHartman
<!> Spike Erosion </!>
· On long time ranges, aggregated / rolled-up data is commonly displayed
· This practice “erodes” latency spikes heavily!
· Store all data and use alternative aggregation methods (min/max) to get full picture, cf. [3].
1d max
all samples as
Heatmap / ‘dirt’
@HeinrichHartman
{2} Log Analysis
@HeinrichHartman
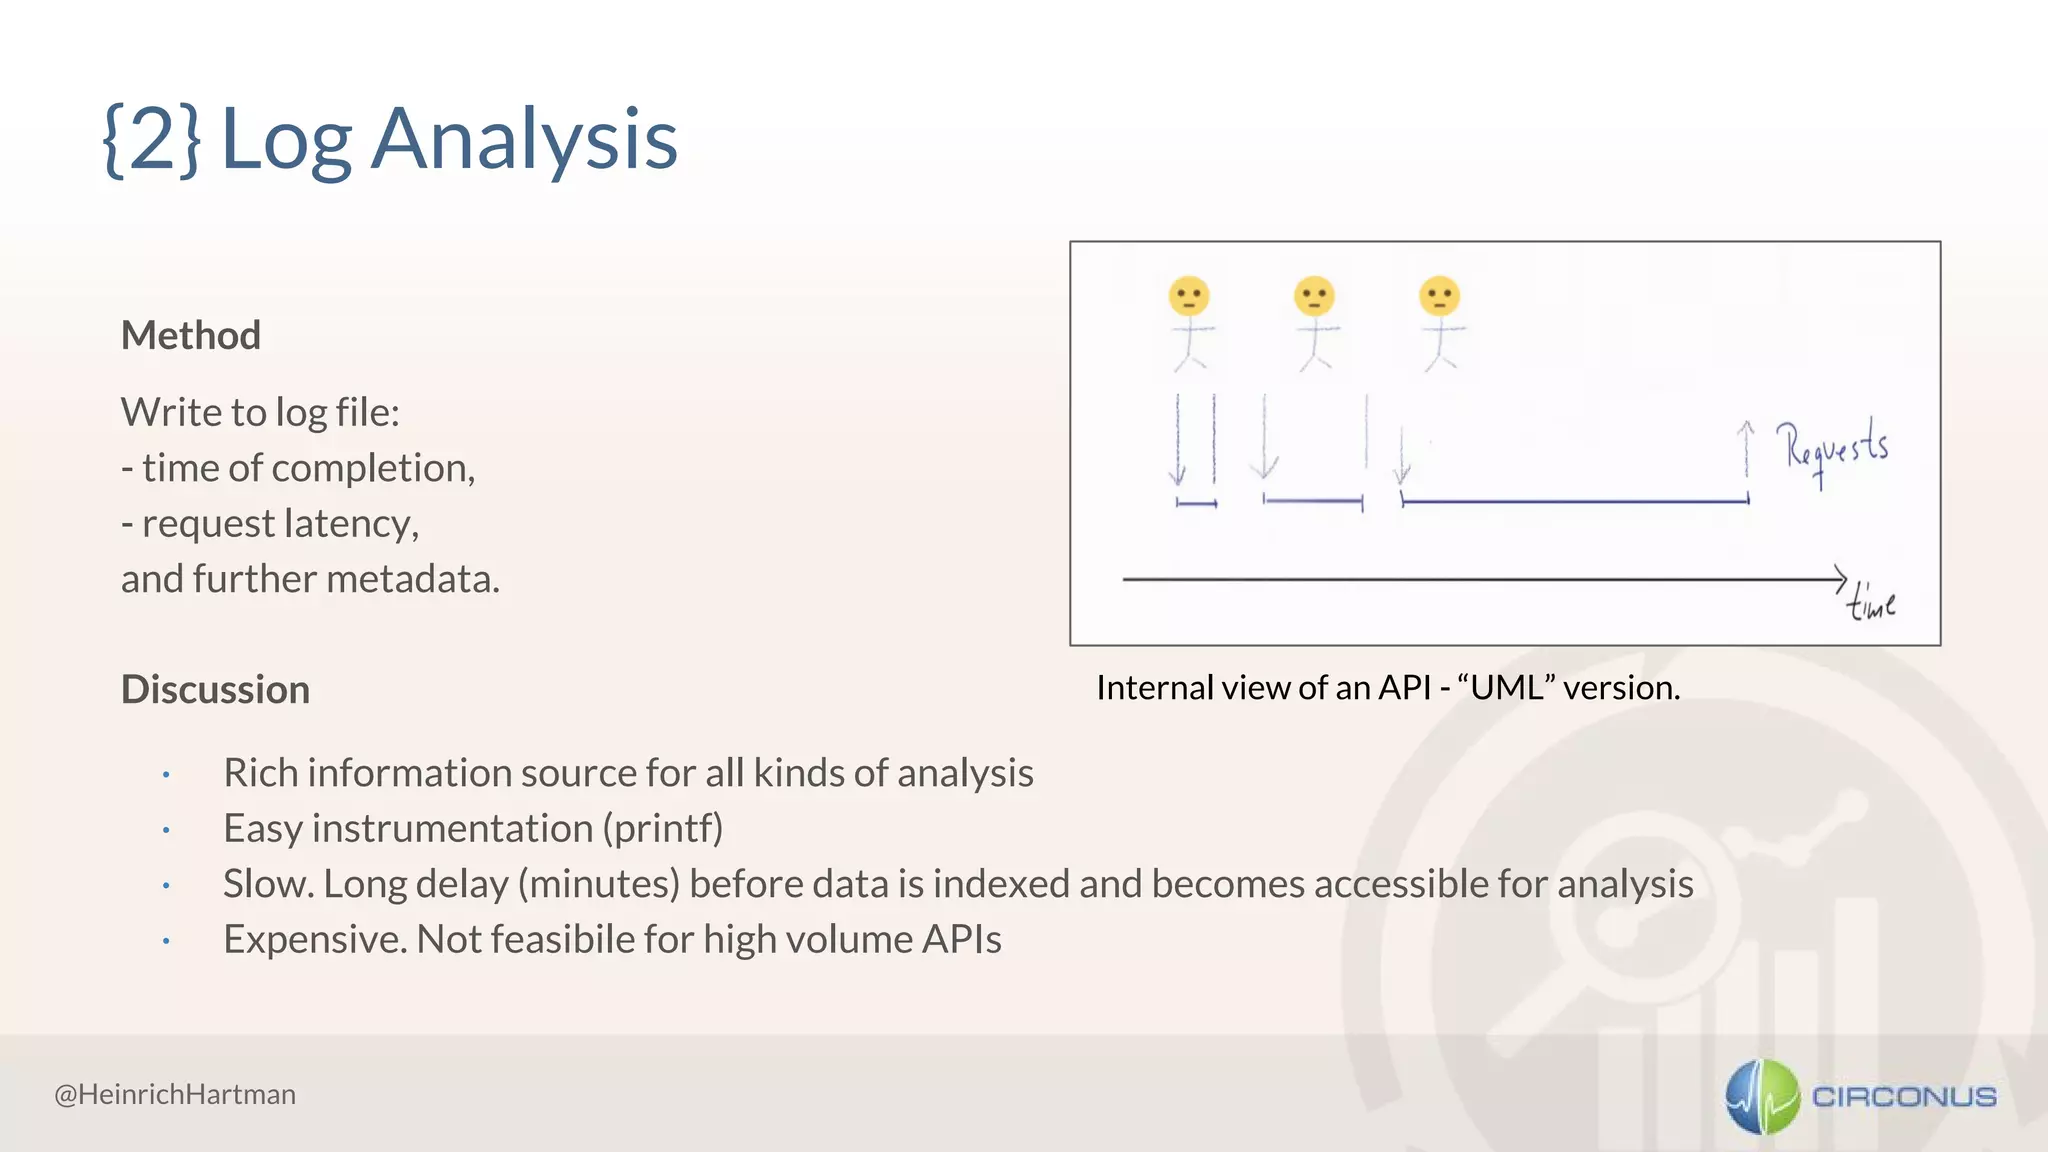
Method
Write to log file:
- time of completion,
- request latency,
and further metadata.
Discussion
· Rich information source for all kinds of analysis
· Easy instrumentation (printf)
· Slow. Long delay (minutes) before data is indexed and becomes accessible for analysis
· Expensive. Not feasibile for high volume APIs
{2} Log Analysis
Internal view of an API - “UML” version.
@HeinrichHartman
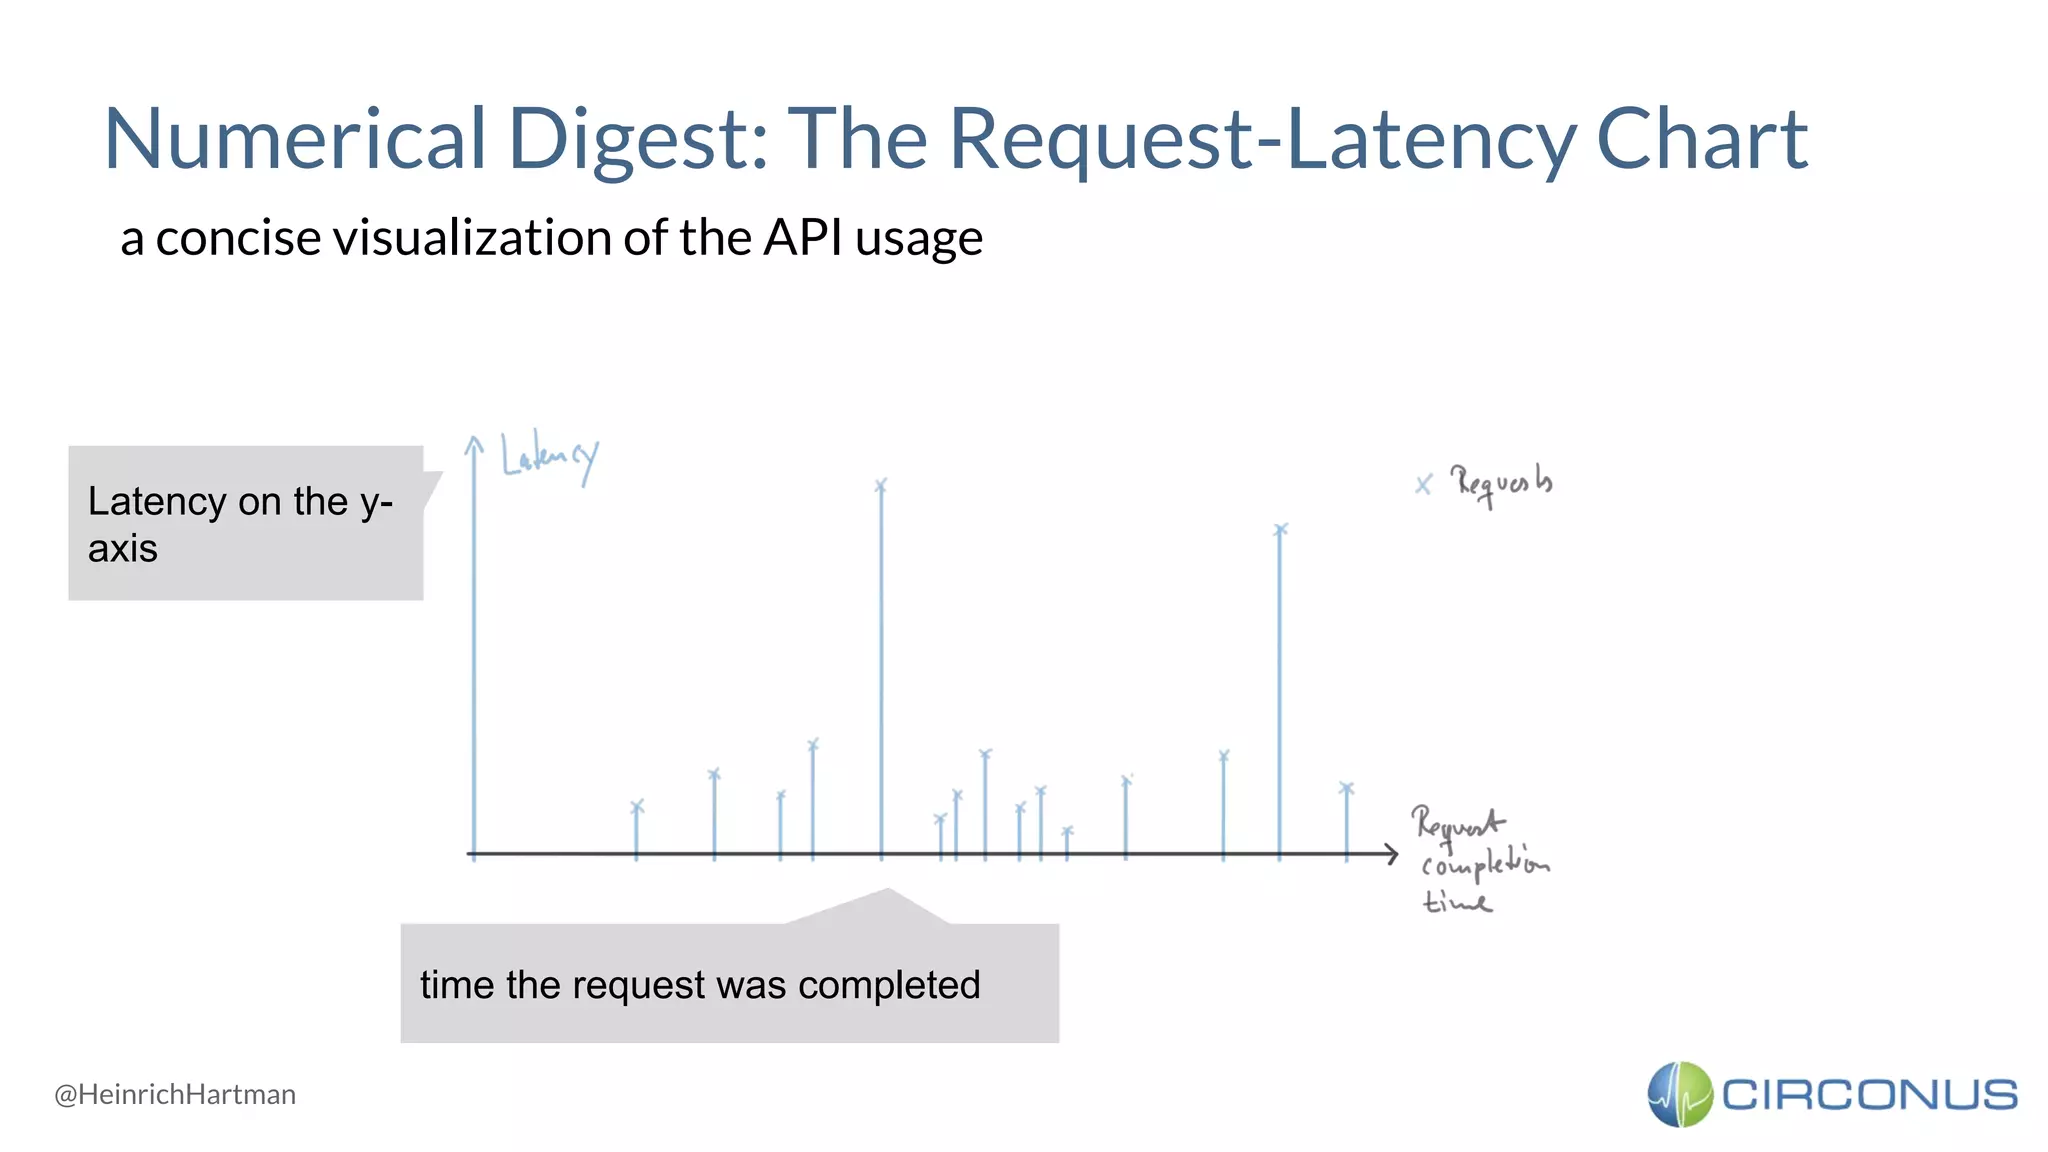
Numerical Digest: The Request-Latency Chart
a concise visualization of the API usage
Latency on the y-
axis
time the request was completed
@HeinrichHartman
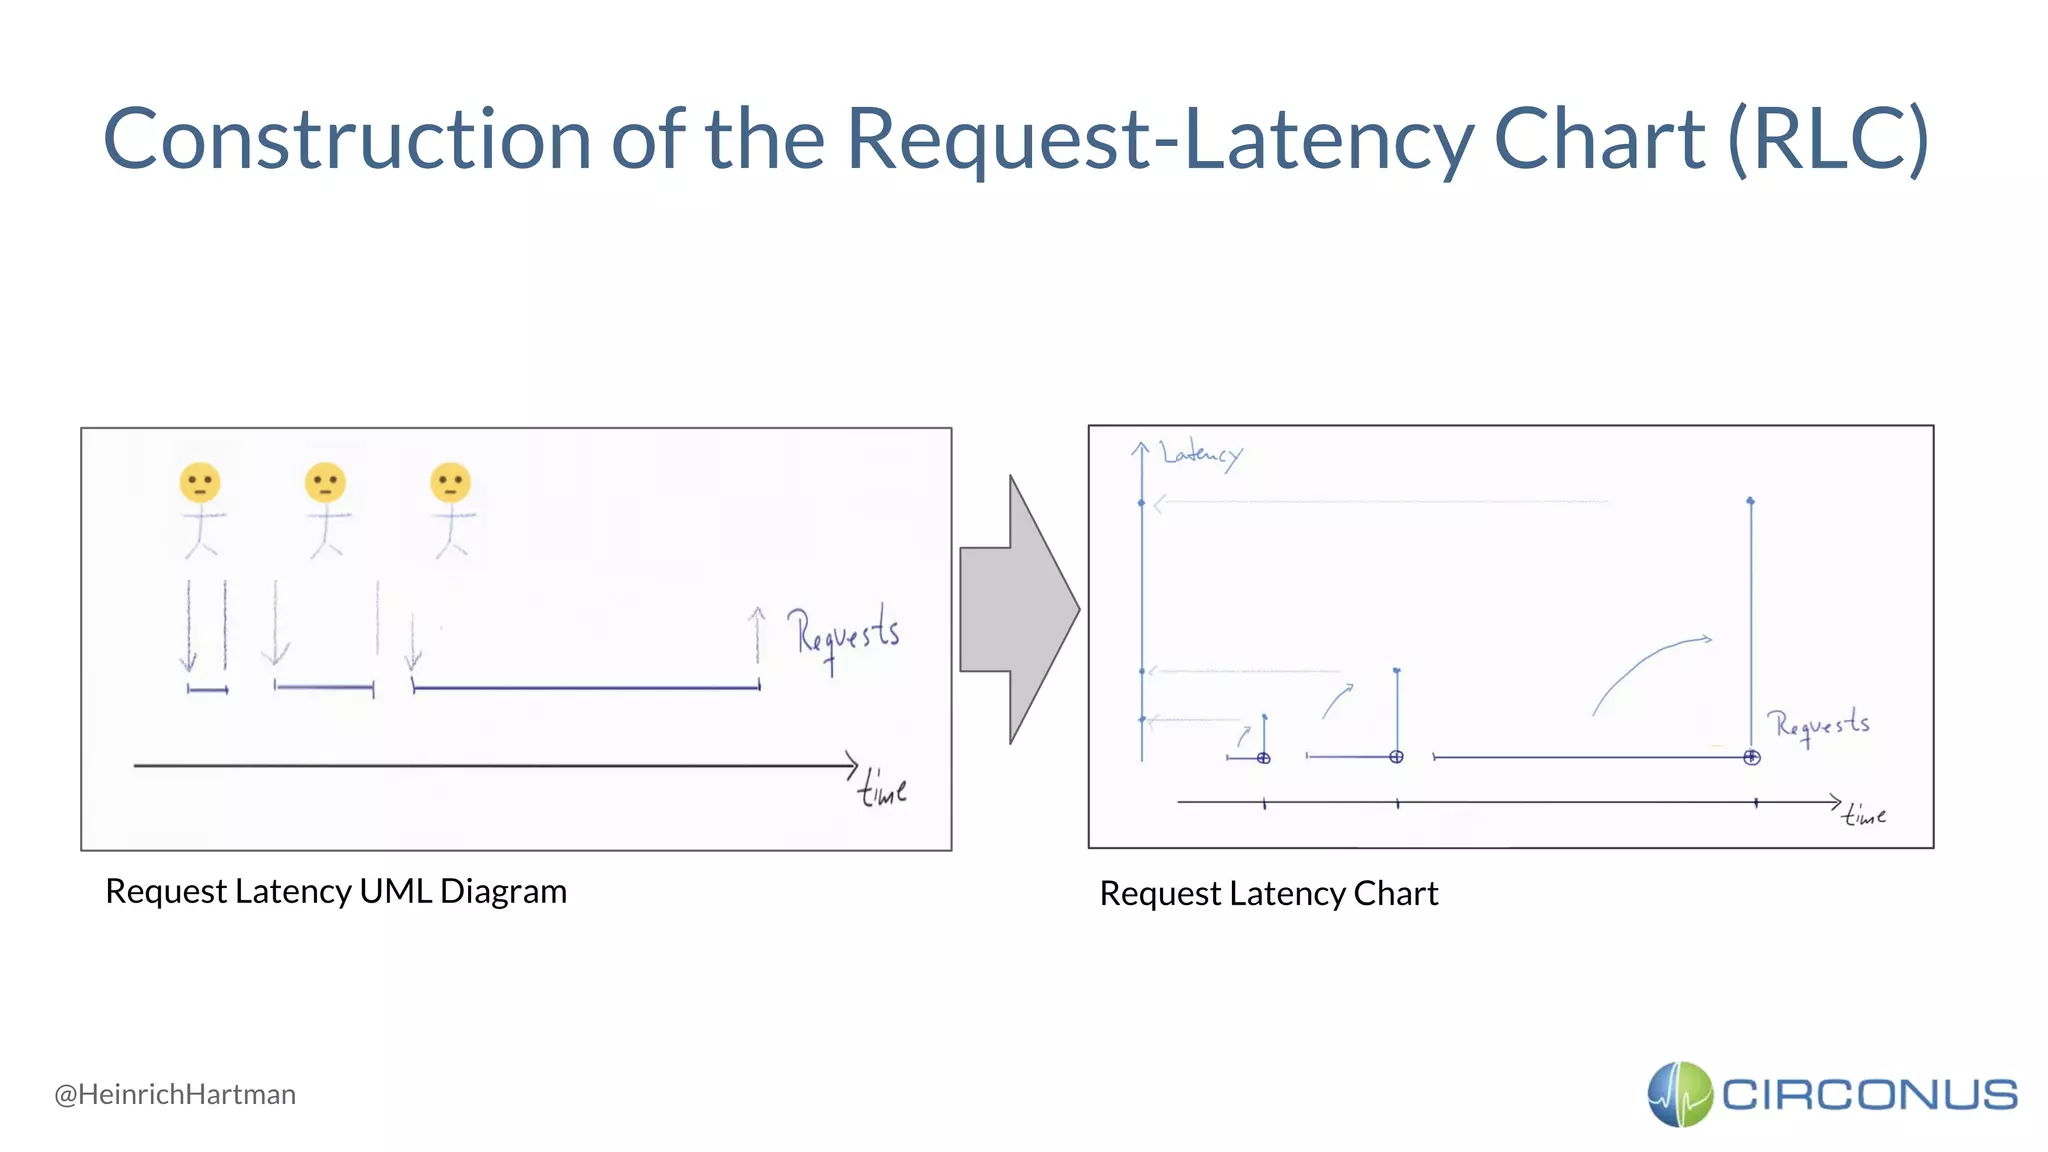
Construction of the Request-Latency Chart (RLC)
Request Latency UML Diagram Request Latency Chart
@HeinrichHartman
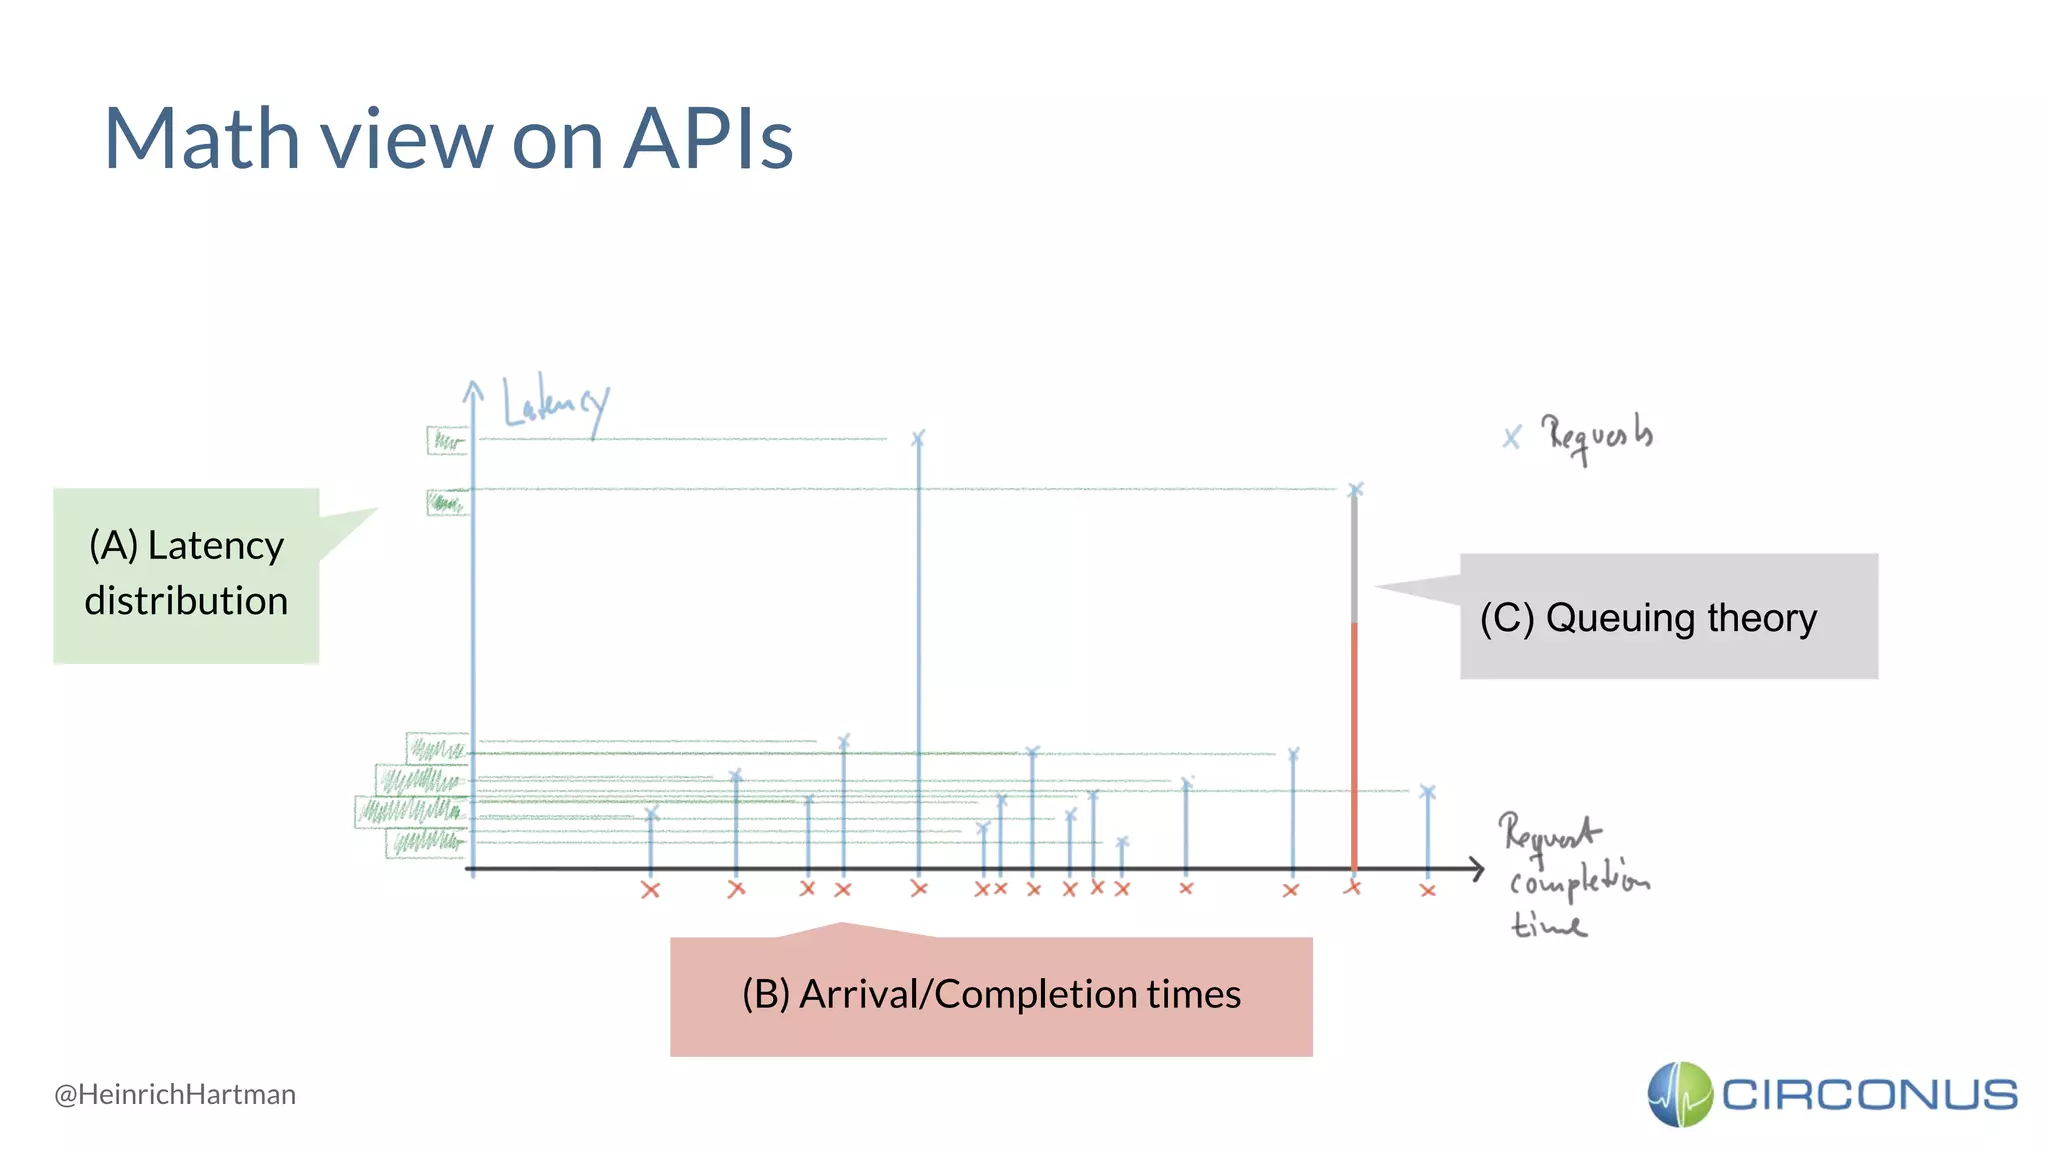
Math view on APIs
(A) Latency
distribution
(B) Arrival/Completion times
(C) Queuing theory
@HeinrichHartman
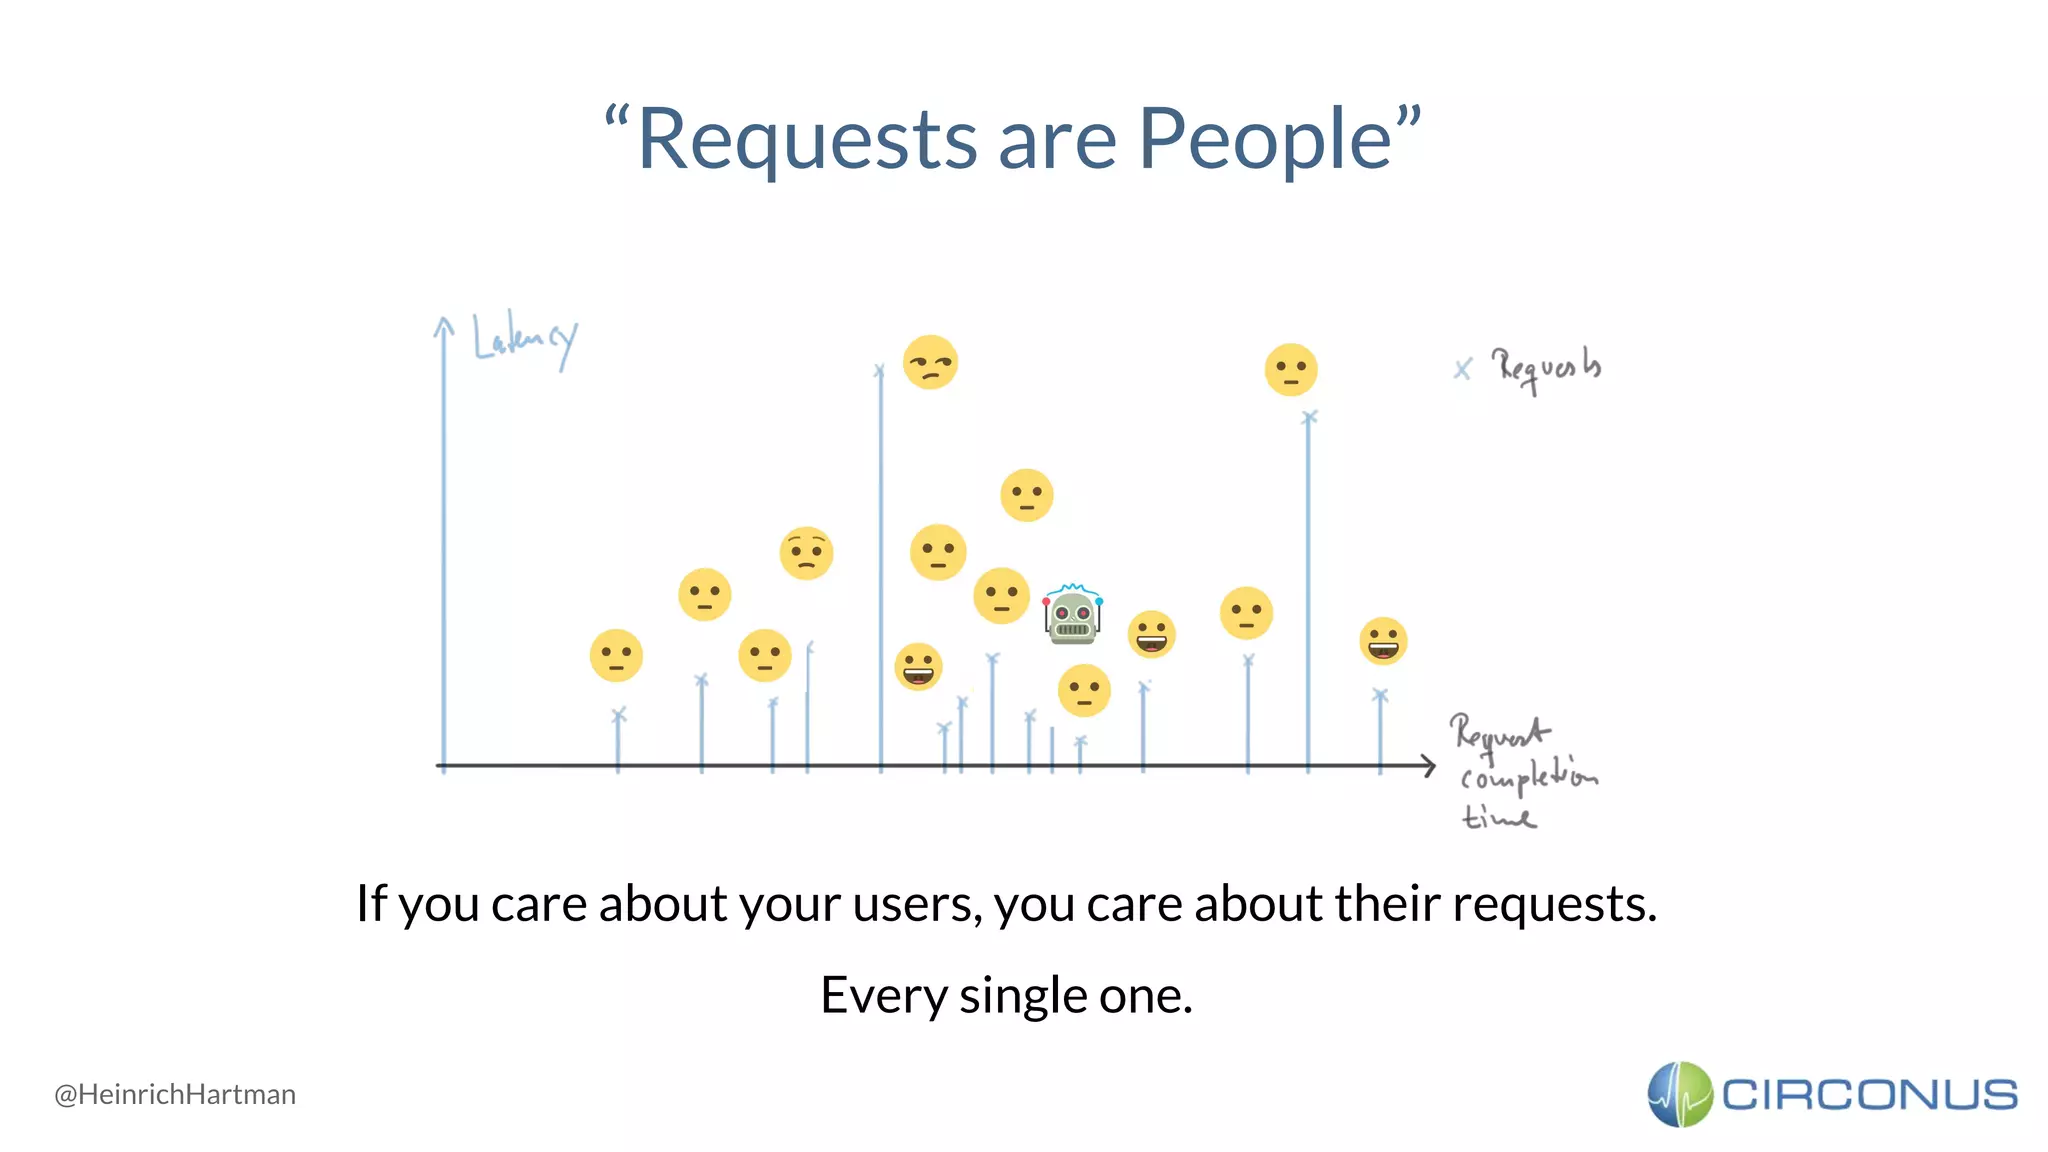
“Requests are People”
If you care about your users, you care about their requests.
Every single one.
@HeinrichHartman
{3} Monitoring Latency Averages
@HeinrichHartman
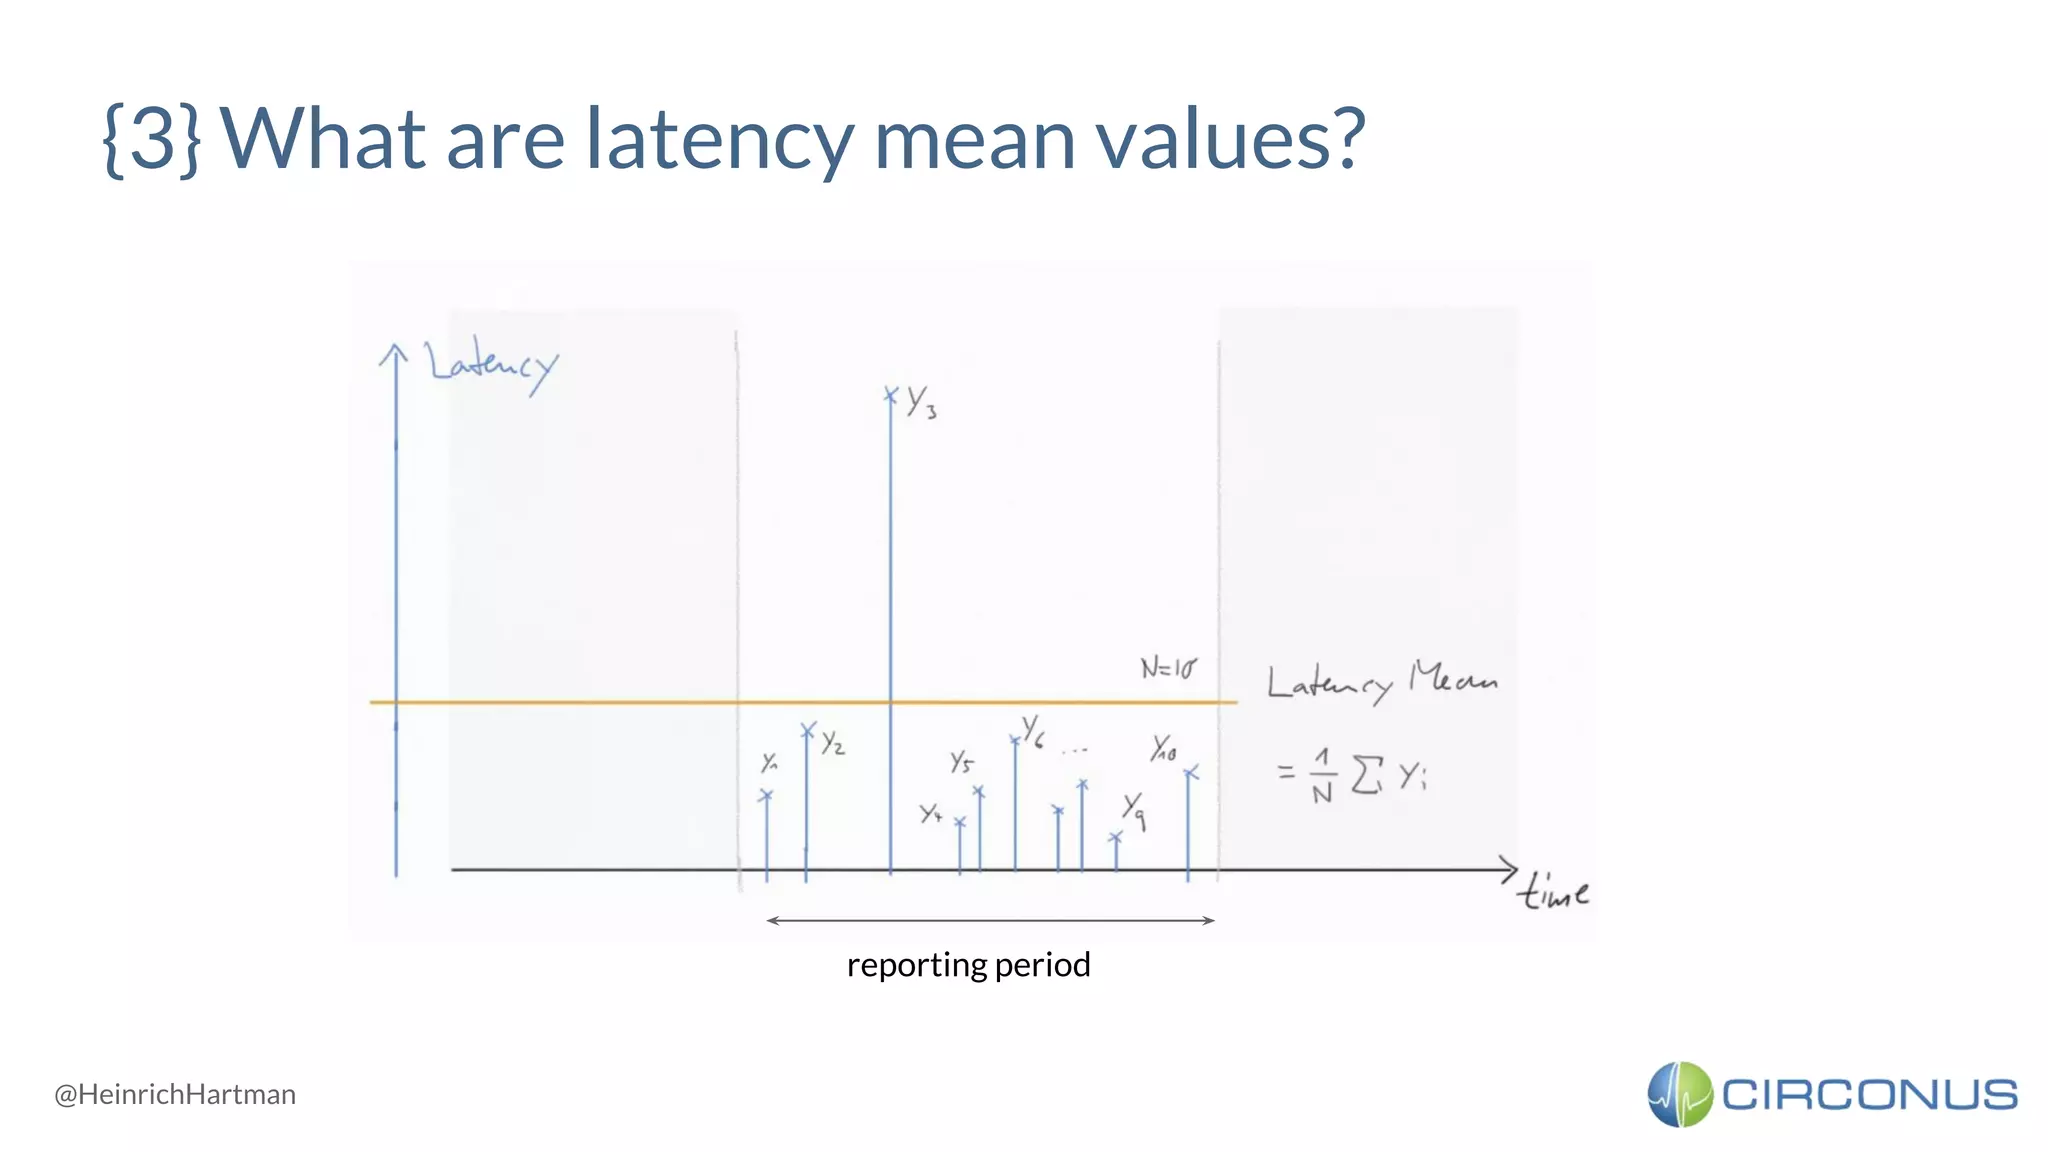
{3} What are latency mean values?
reporting period
@HeinrichHartman
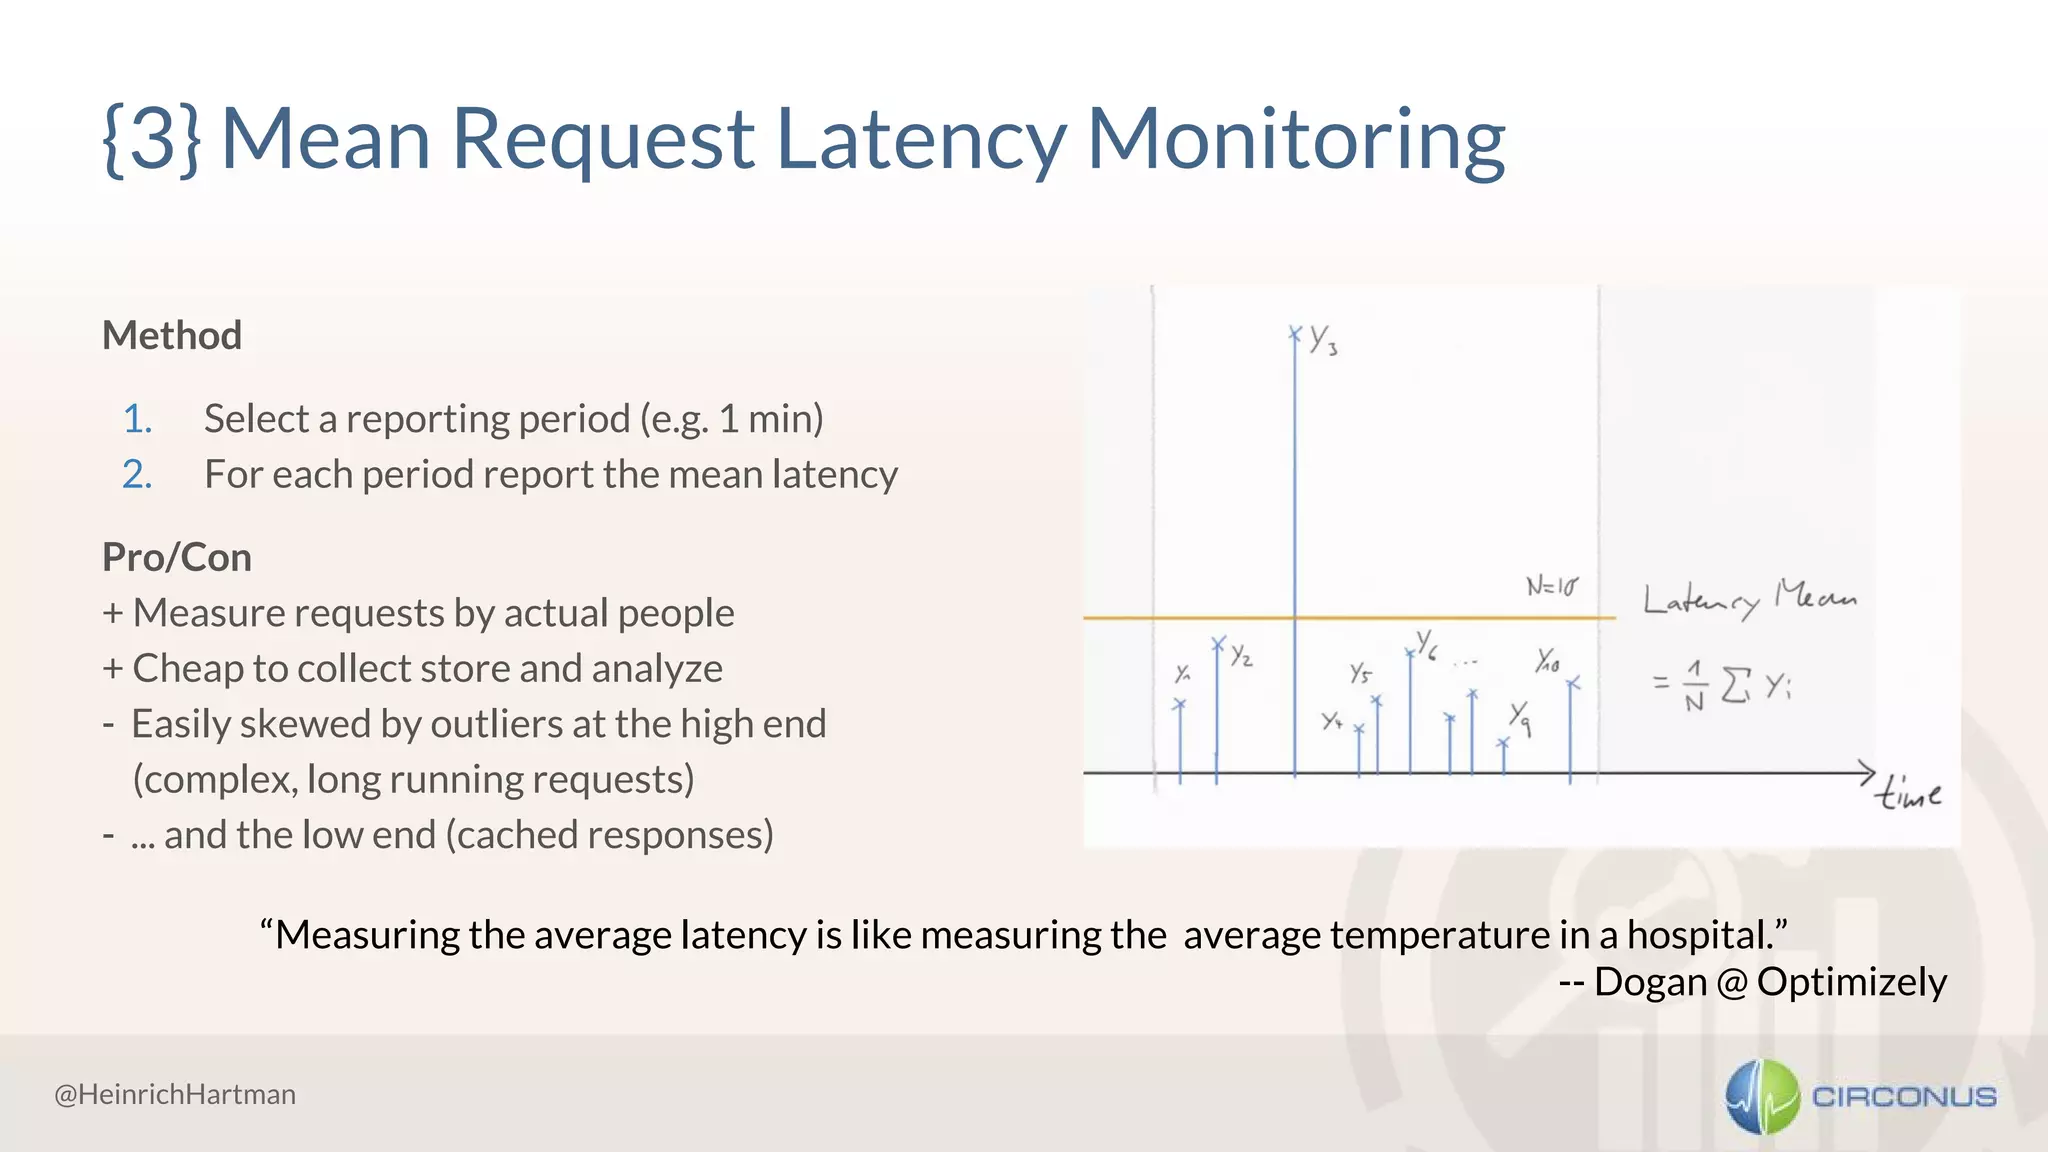
{3} Mean Request Latency Monitoring
Method
1. Select a reporting period (e.g. 1 min)
2. For each period report the mean latency
Pro/Con
+ Measure requests by actual people
+ Cheap to collect store and analyze
- Easily skewed by outliers at the high end
(complex, long running requests)
- ... and the low end (cached responses)
“Measuring the average latency is like measuring the average temperature in a hospital.”
-- Dogan @ Optimizely
@HeinrichHartman
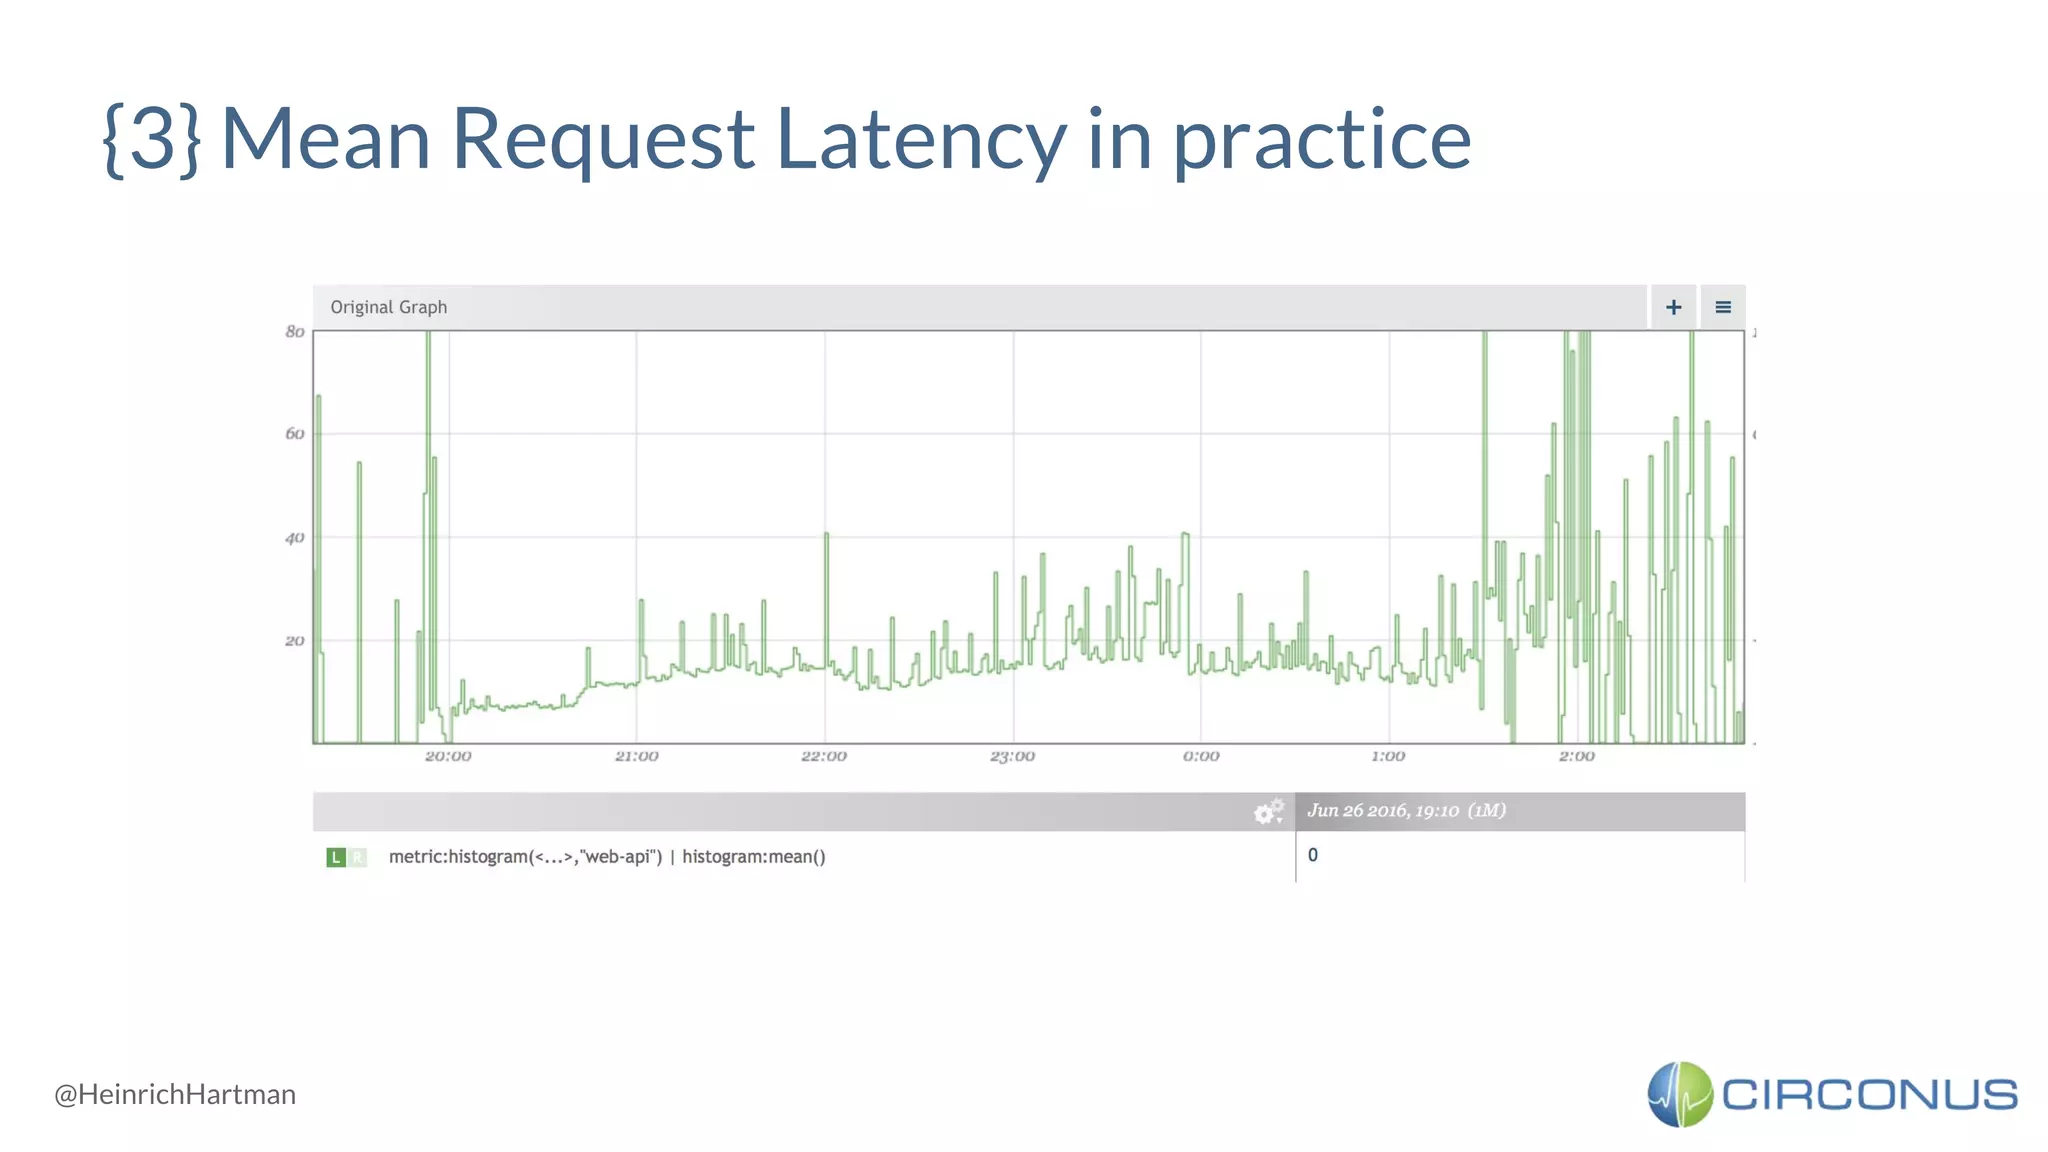
{3} Mean Request Latency in practice
@HeinrichHartman
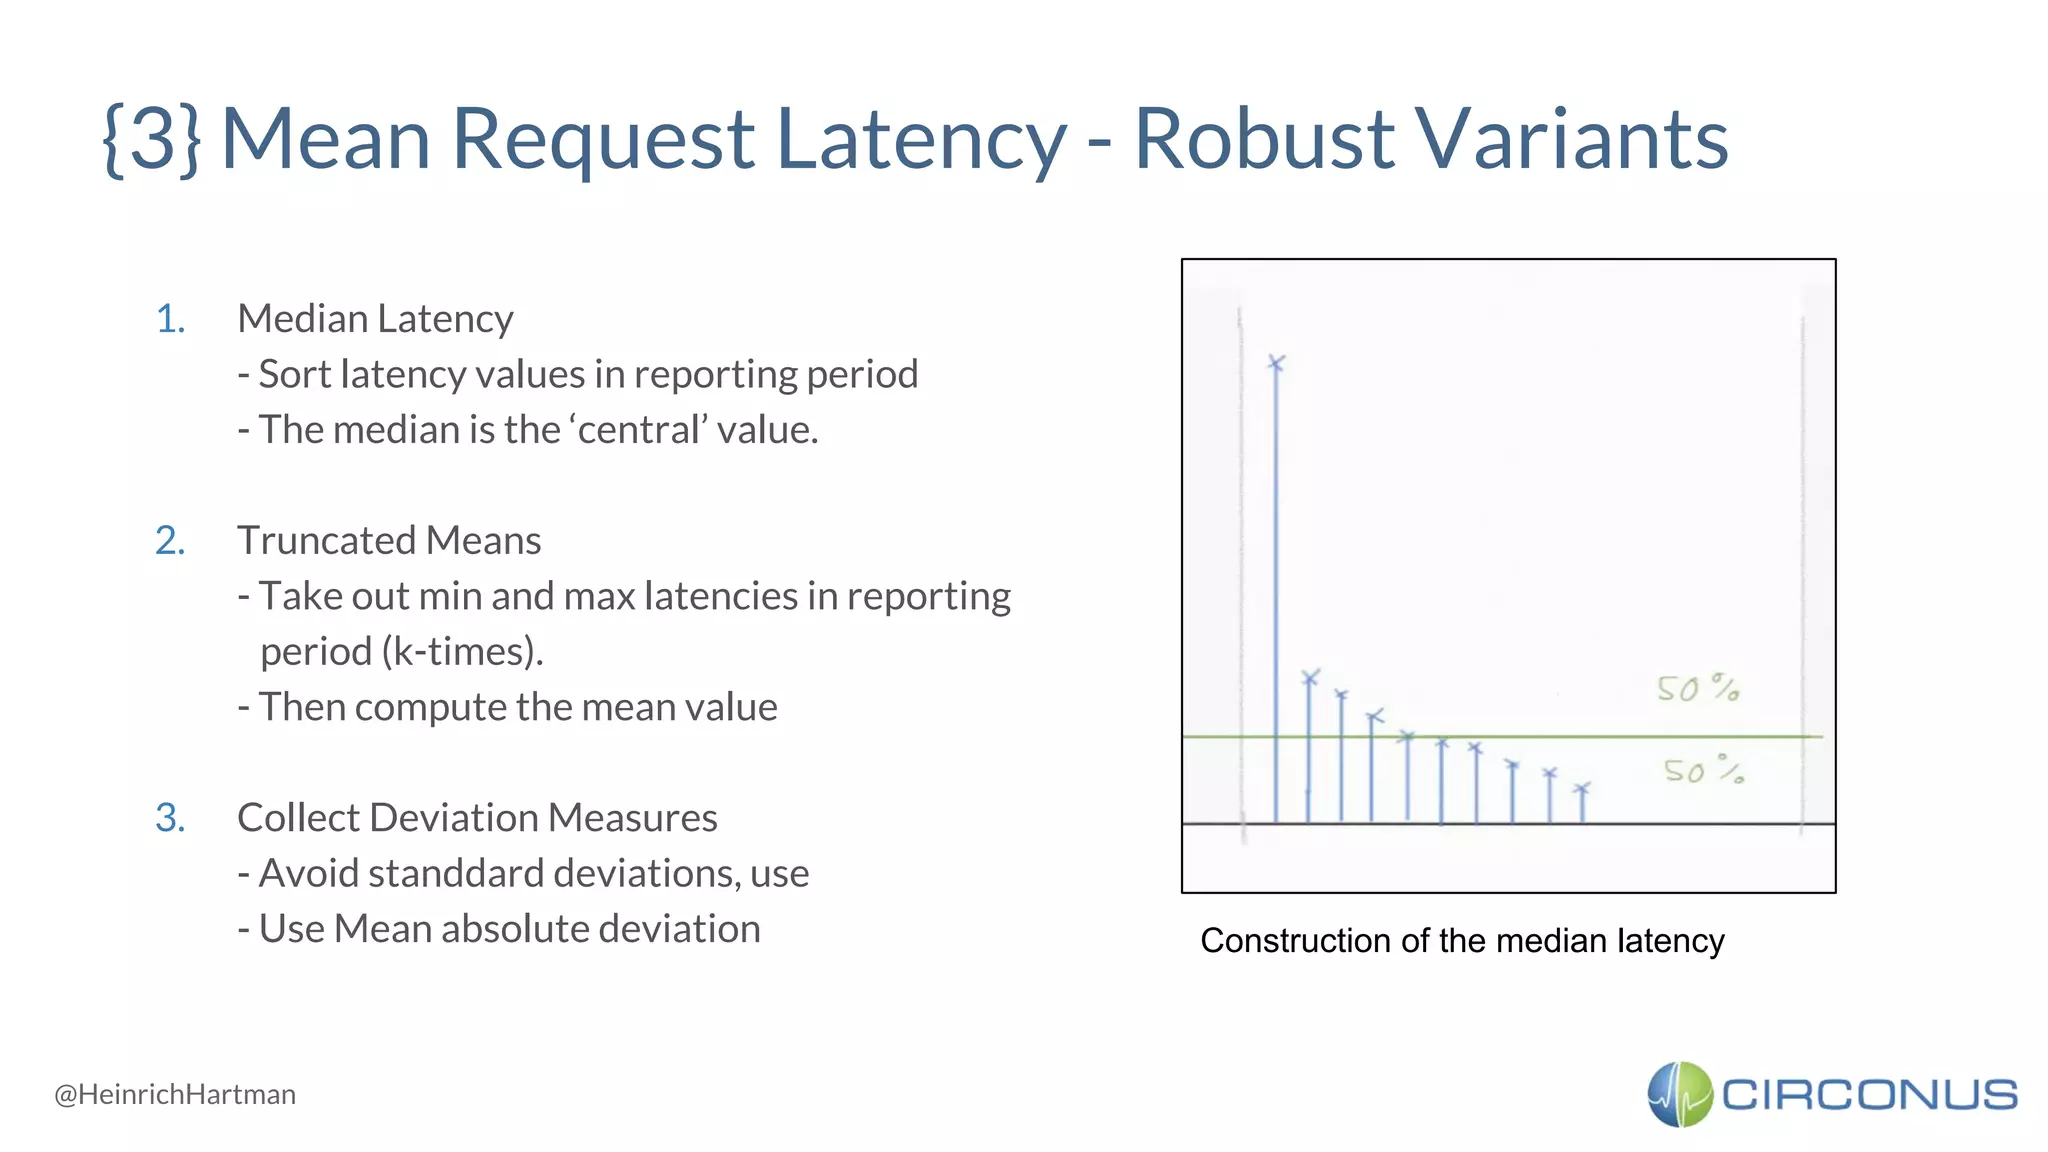
{3} Mean Request Latency - Robust Variants
1. Median Latency
- Sort latency values in reporting period
- The median is the ‘central’ value.
2. Truncated Means
- Take out min and max latencies in reporting
period (k-times).
- Then compute the mean value
3. Collect Deviation Measures
- Avoid standdard deviations, use
- Use Mean absolute deviation Construction of the median latency
@HeinrichHartman
{4} Percentile Monitoring
@HeinrichHartman
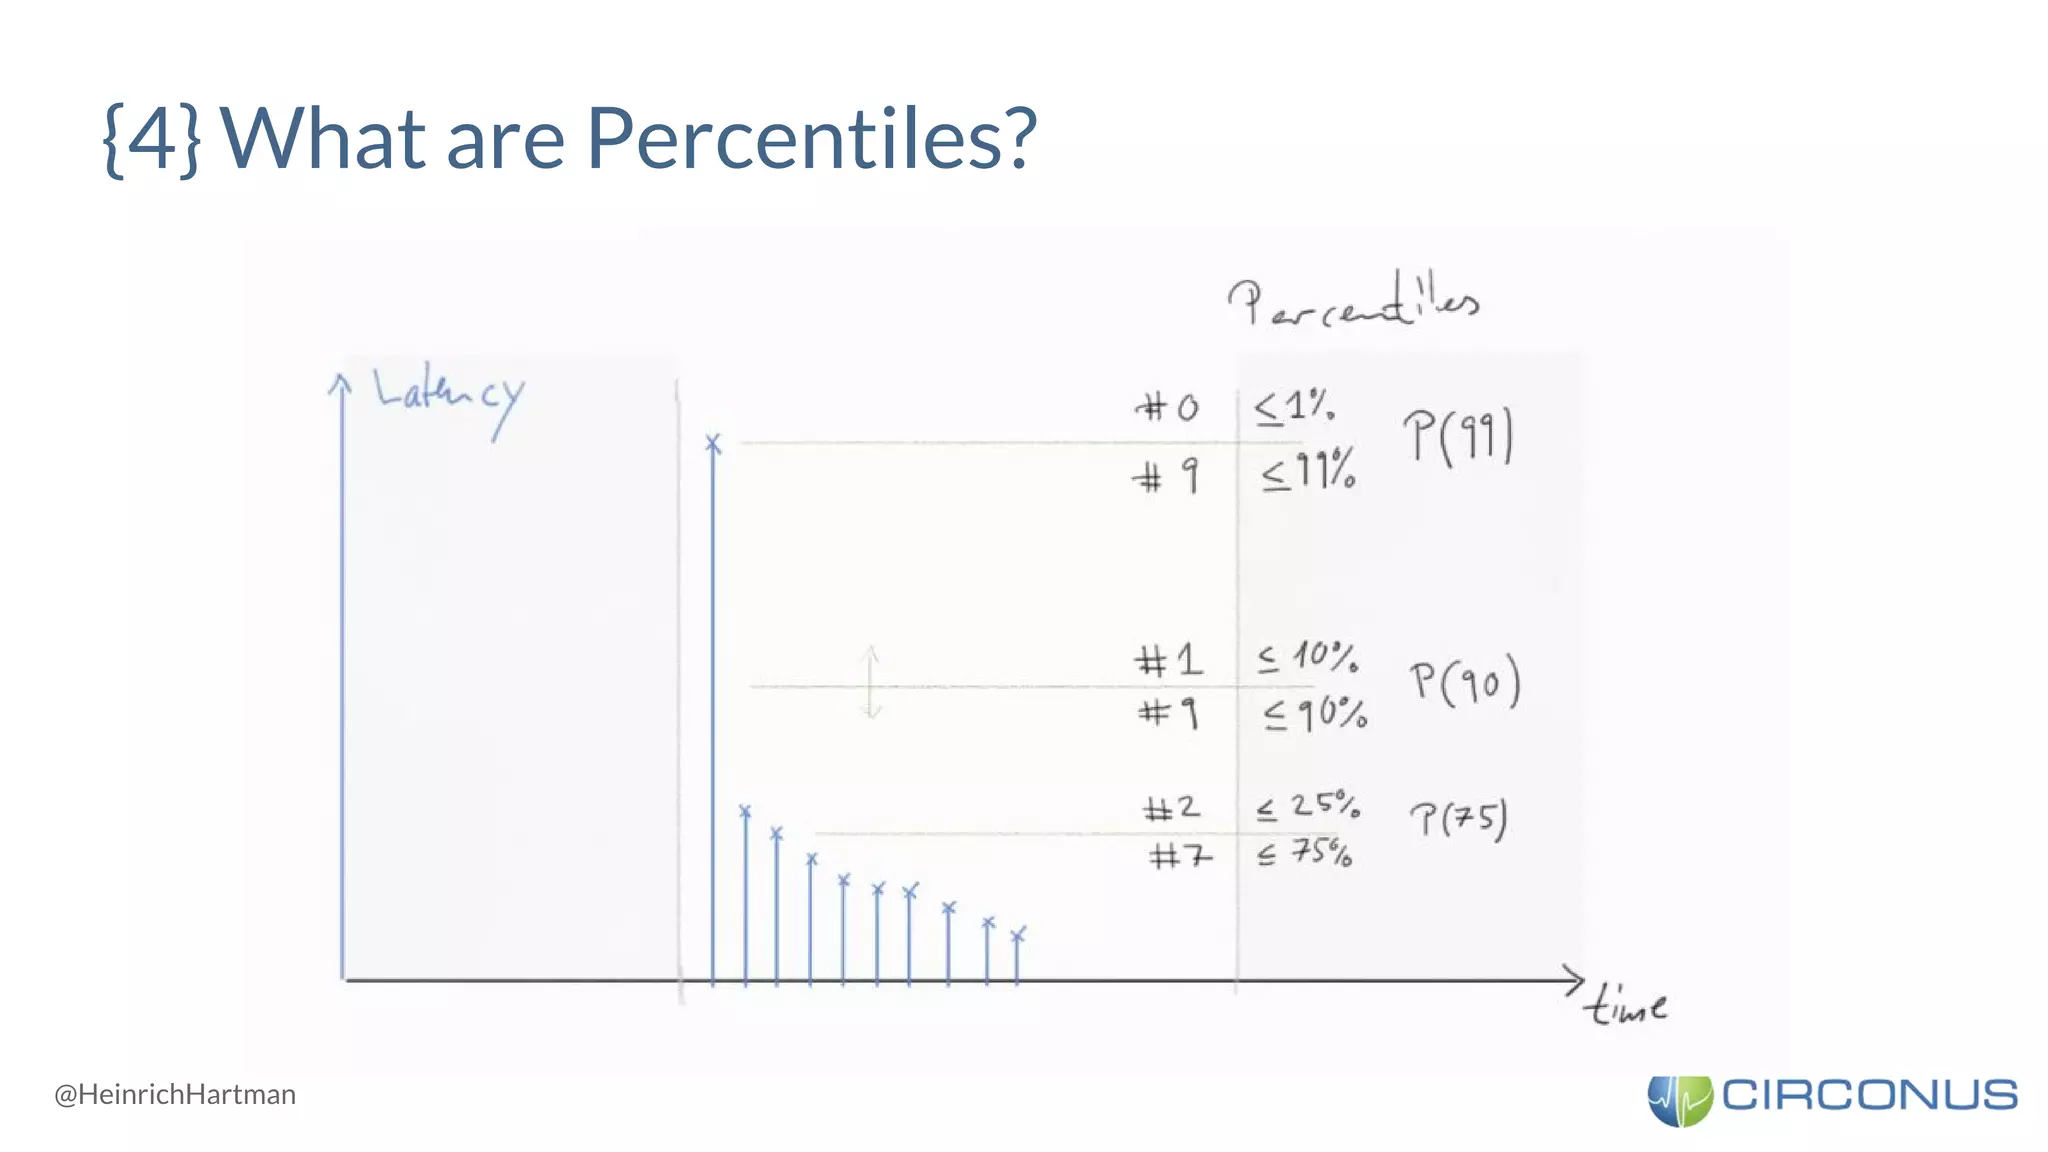
{4} What are Percentiles?
@HeinrichHartman
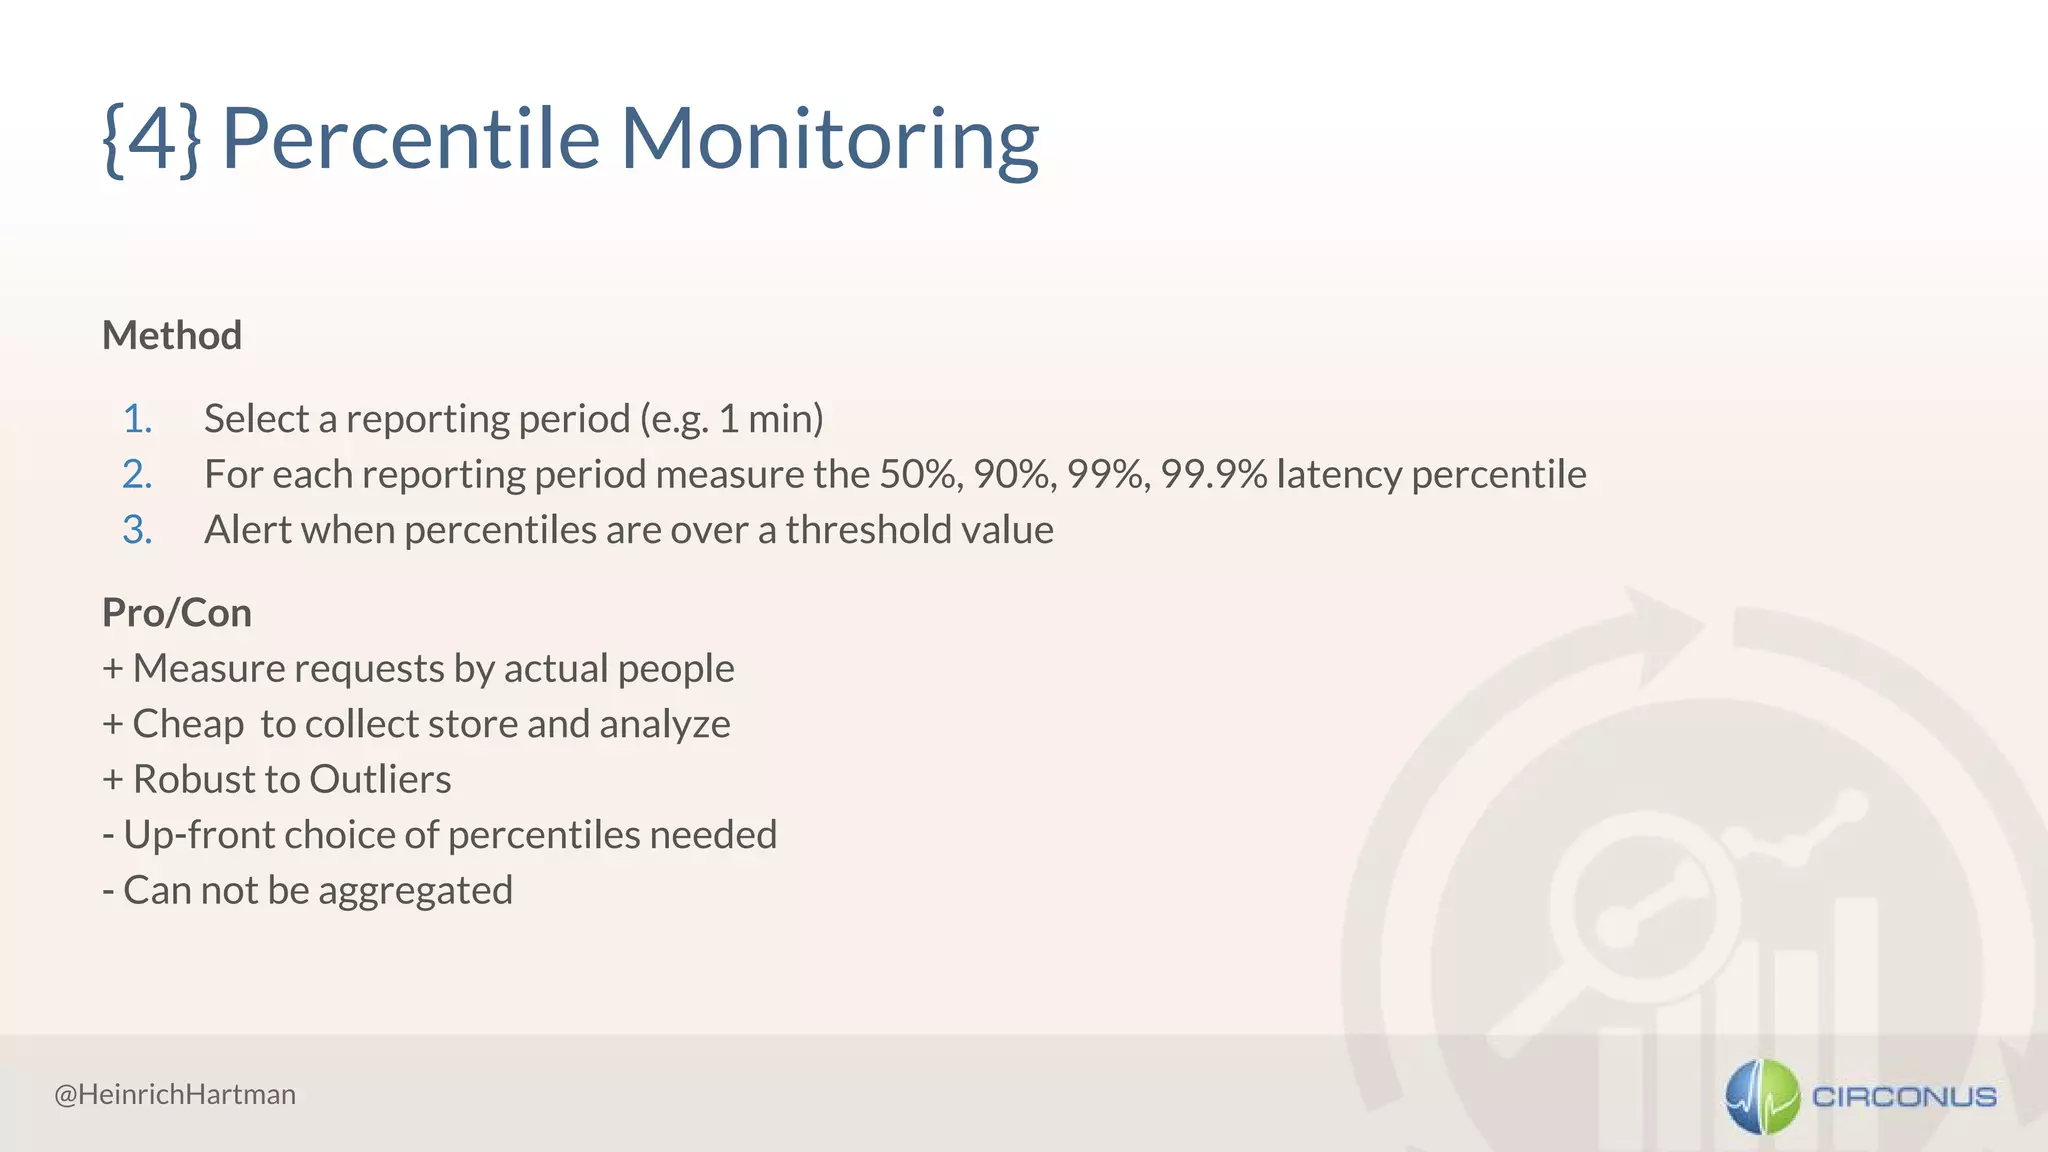
{4} Percentile Monitoring
Method
1. Select a reporting period (e.g. 1 min)
2. For each reporting period measure the 50%, 90%, 99%, 99.9% latency percentile
3. Alert when percentiles are over a threshold value
Pro/Con
+ Measure requests by actual people
+ Cheap to collect store and analyze
+ Robust to Outliers
- Up-front choice of percentiles needed
- Can not be aggregated
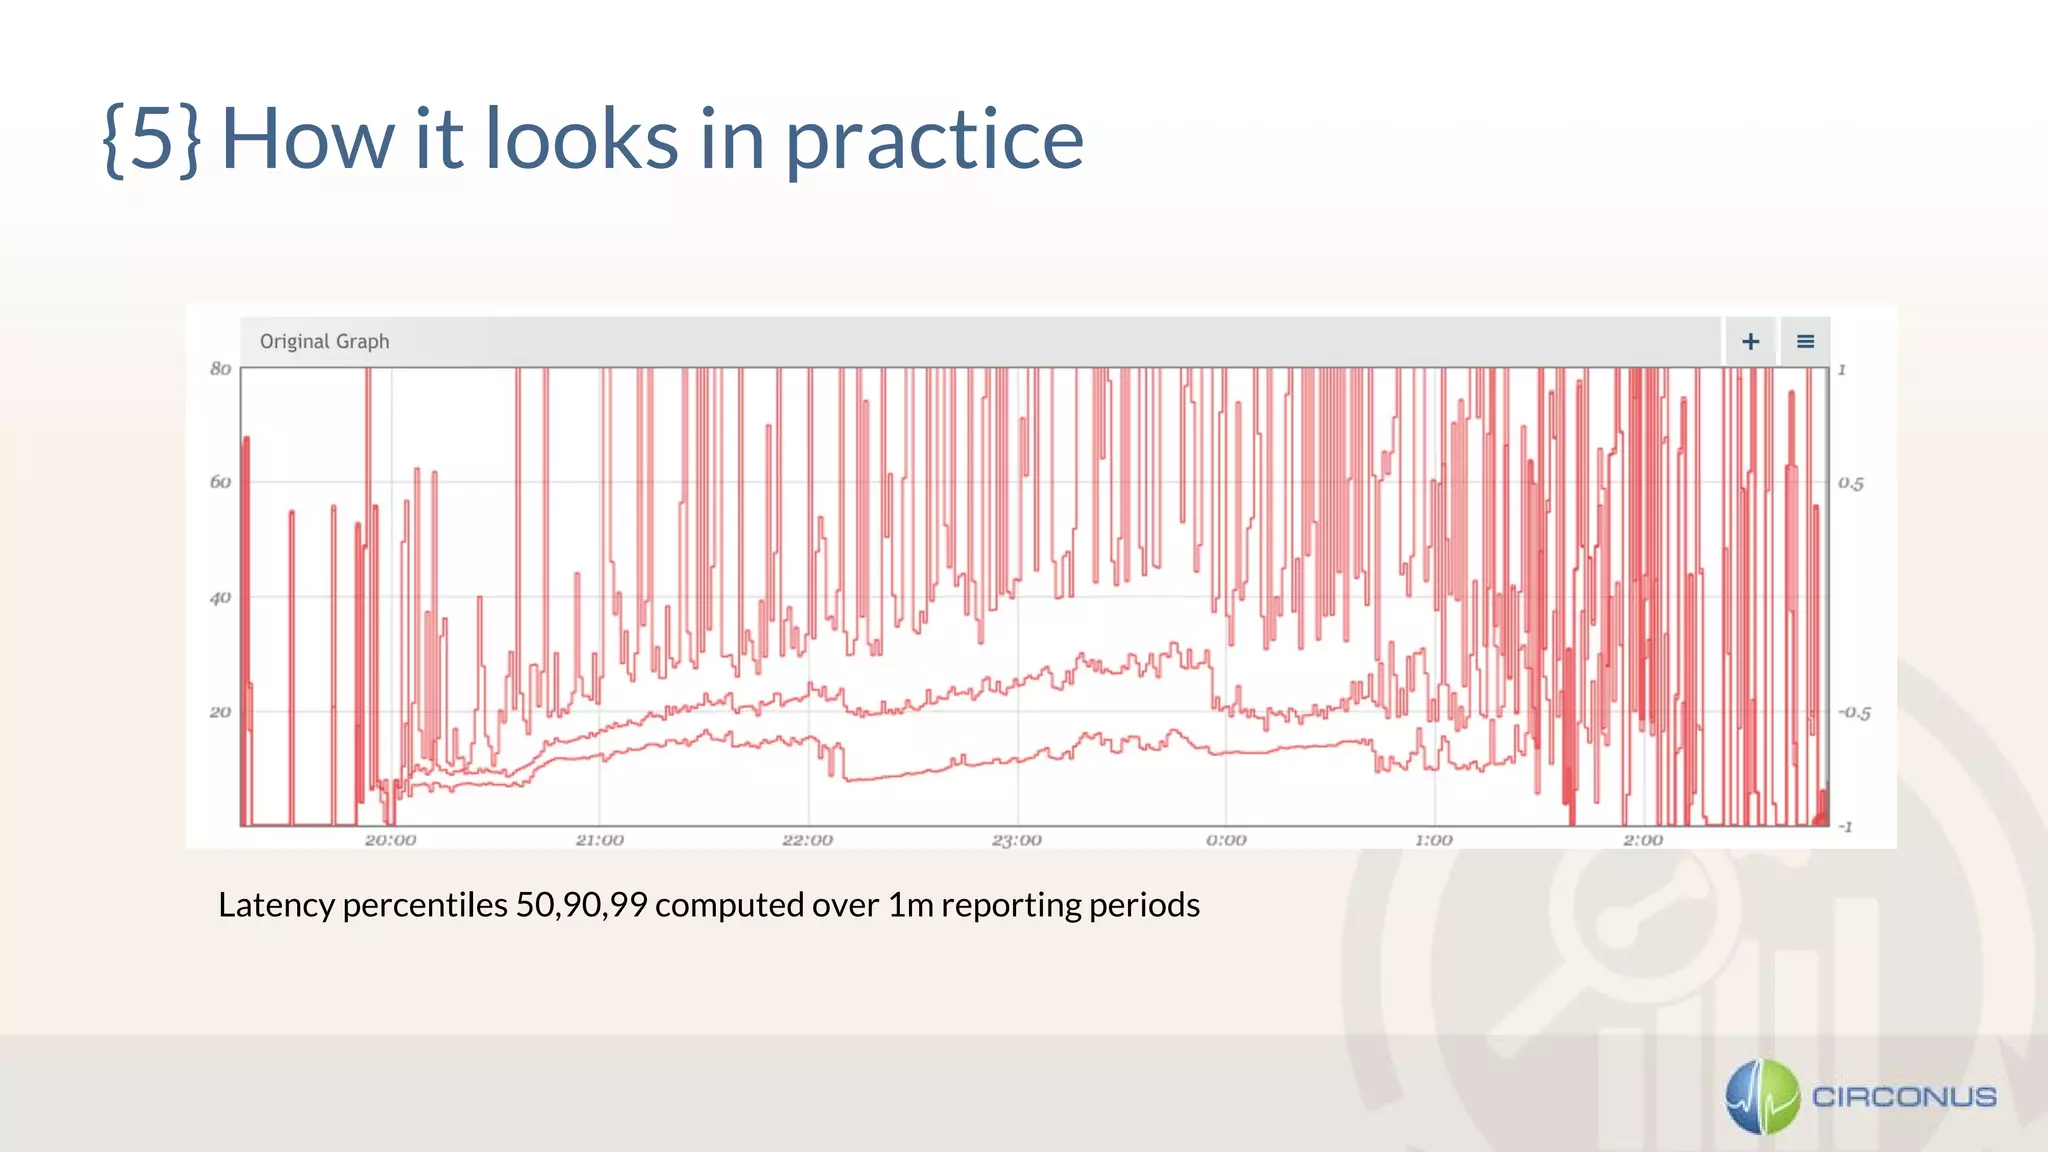
{5} How it looks in practice
Latency percentiles 50,90,99 computed over 1m reporting periods
<!> Percentiles can’t be aggregated </!>
The median of two medians is NOT the total median.
If you store percentiles you need to:
A. Keep all your data. Never take average rollups!
B. Store percentiles for all aggregation levels separately, e.g.
○ per Node / Rack / DC
○ per Endpoint / Service
C. Store percentiles for all reporting periods you are interested in, e.g. per min / h / day
D. Store all percentiles you will ever be interested in, e.g. 50, 75, 90, 99, 99.9
Further Reading: [4] T. Schlossnagle - The Problem with Math @ circonus.com
@HeinrichHartman
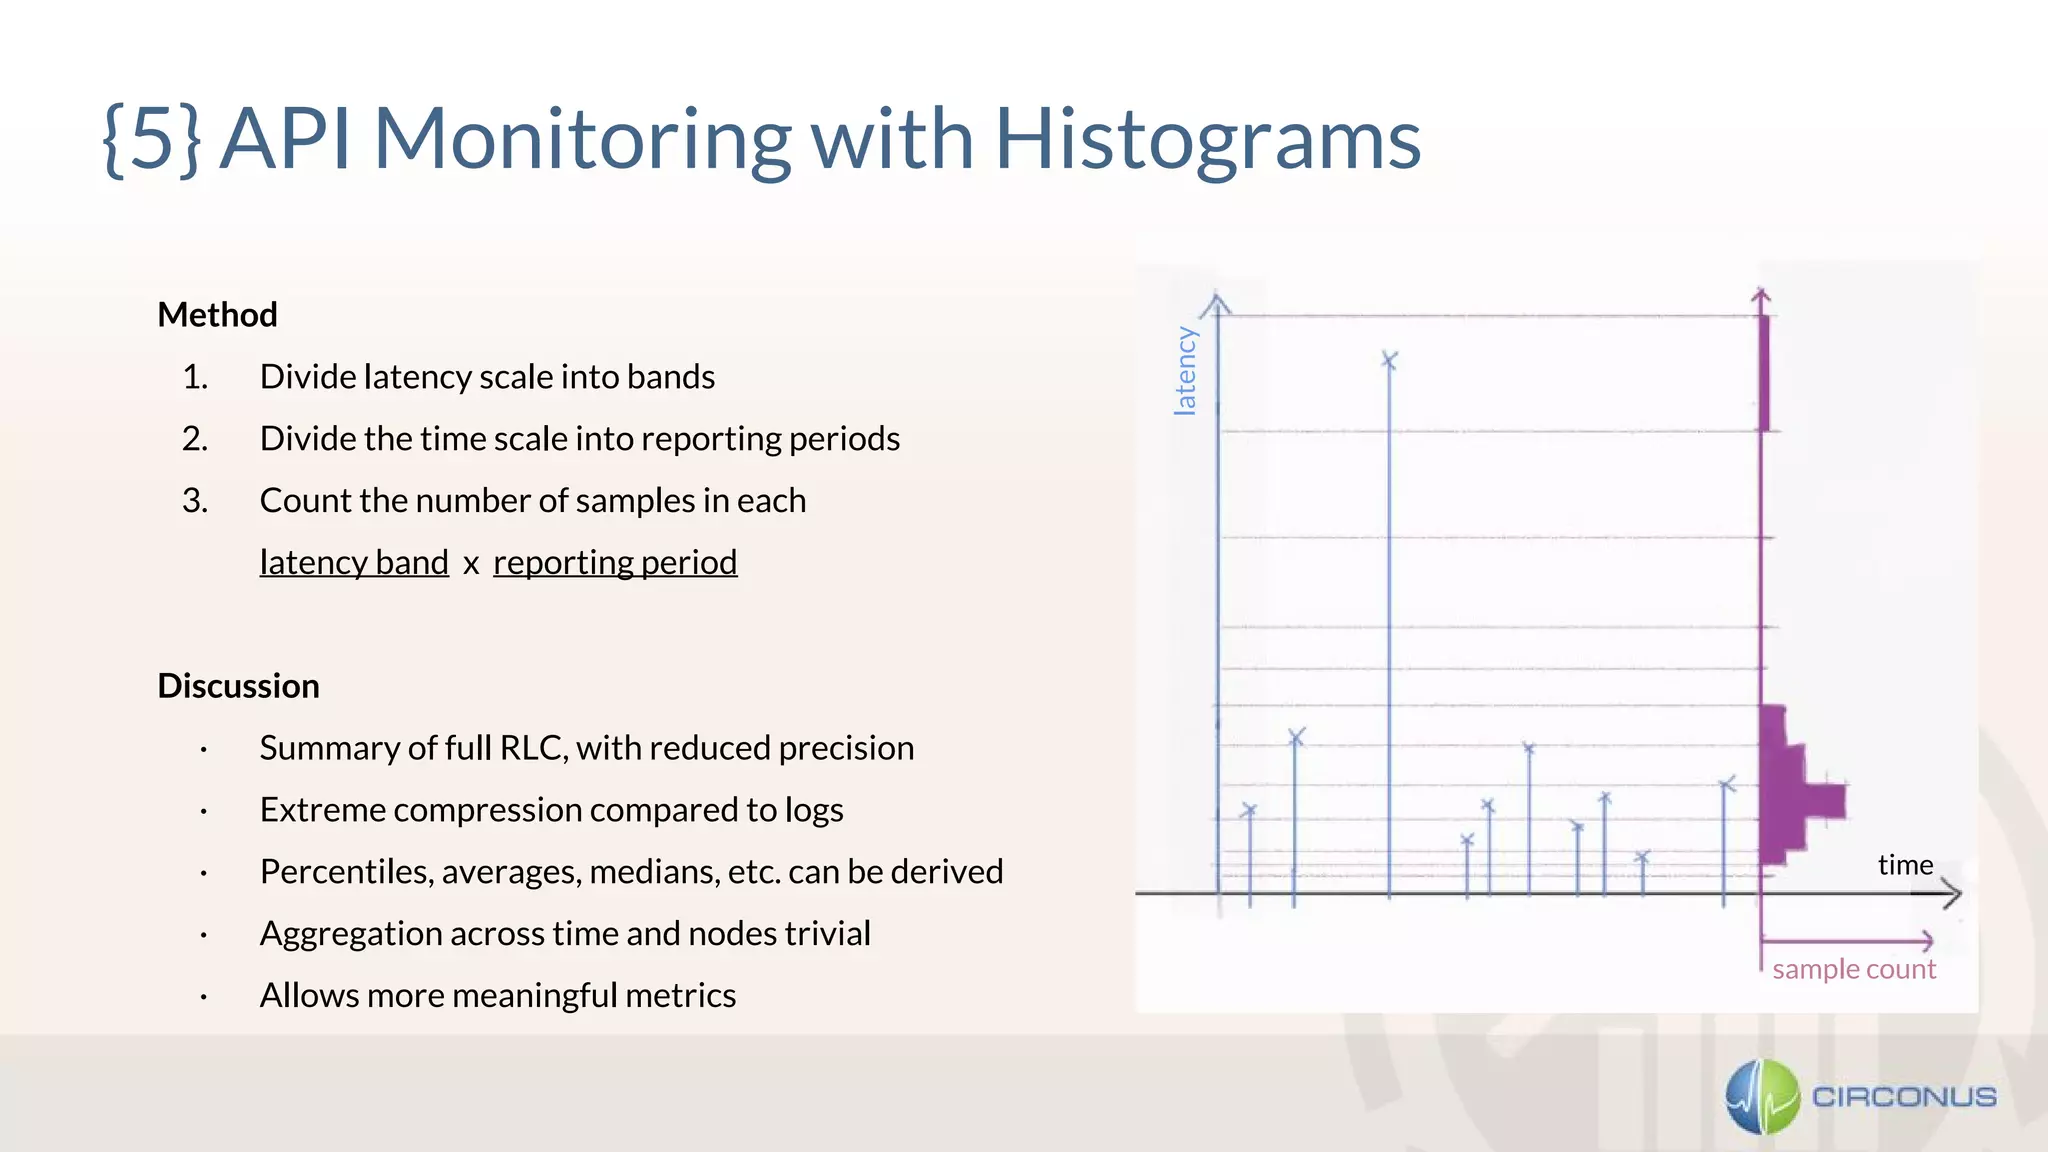
{5} API Monitoring with Histograms
Method
1. Divide latency scale into bands
2. Divide the time scale into reporting periods
3. Count the number of samples in each
latency band x reporting period
Discussion
· Summary of full RLC, with reduced precision
· Extreme compression compared to logs
· Percentiles, averages, medians, etc. can be derived
· Aggregation across time and nodes trivial
· Allows more meaningful metrics
latency
sample count
time
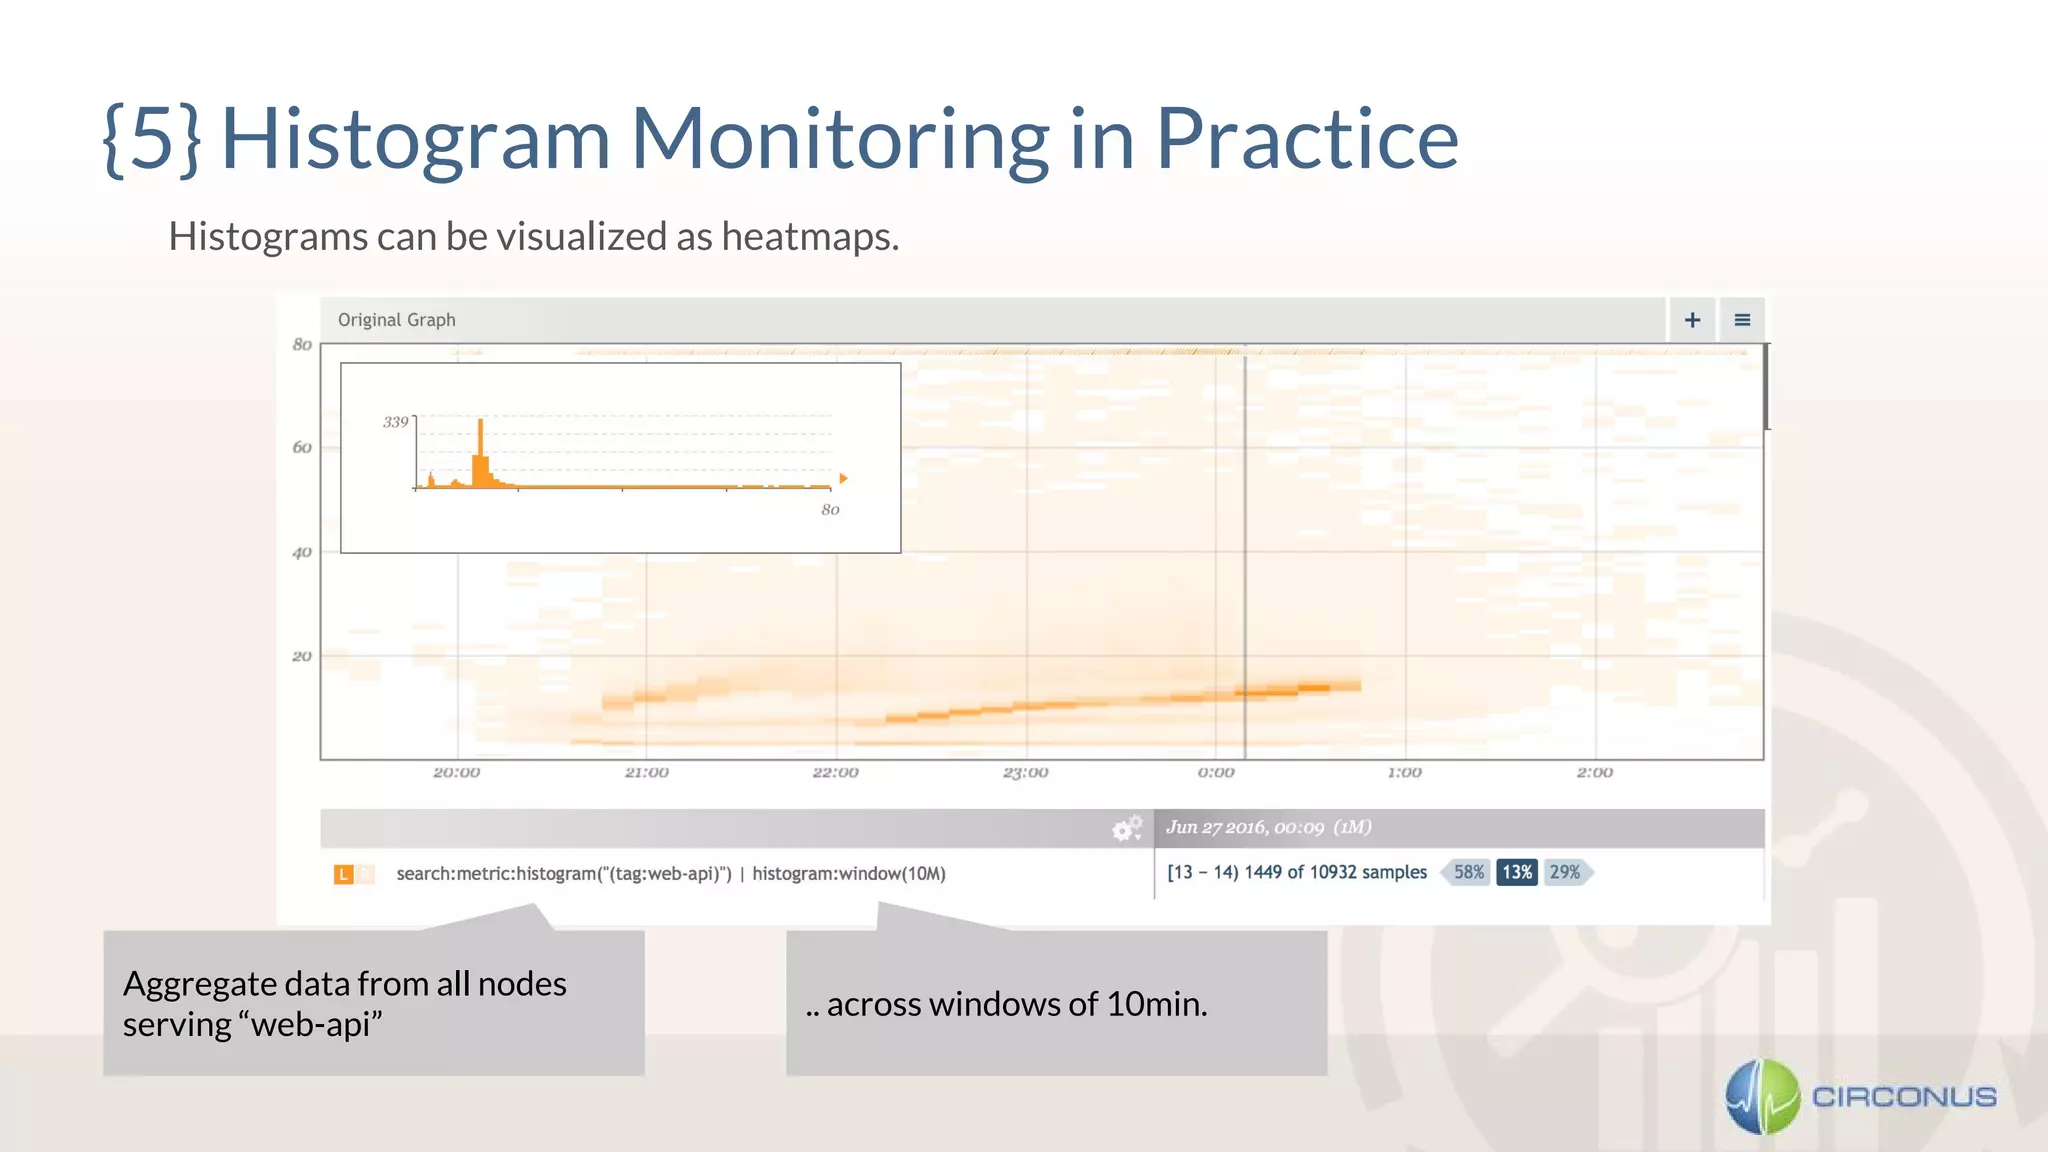
{5} Histogram Monitoring in Practice
Histograms can be visualized as heatmaps.
Aggregate data from all nodes
serving “web-api”
.. across windows of 10min.
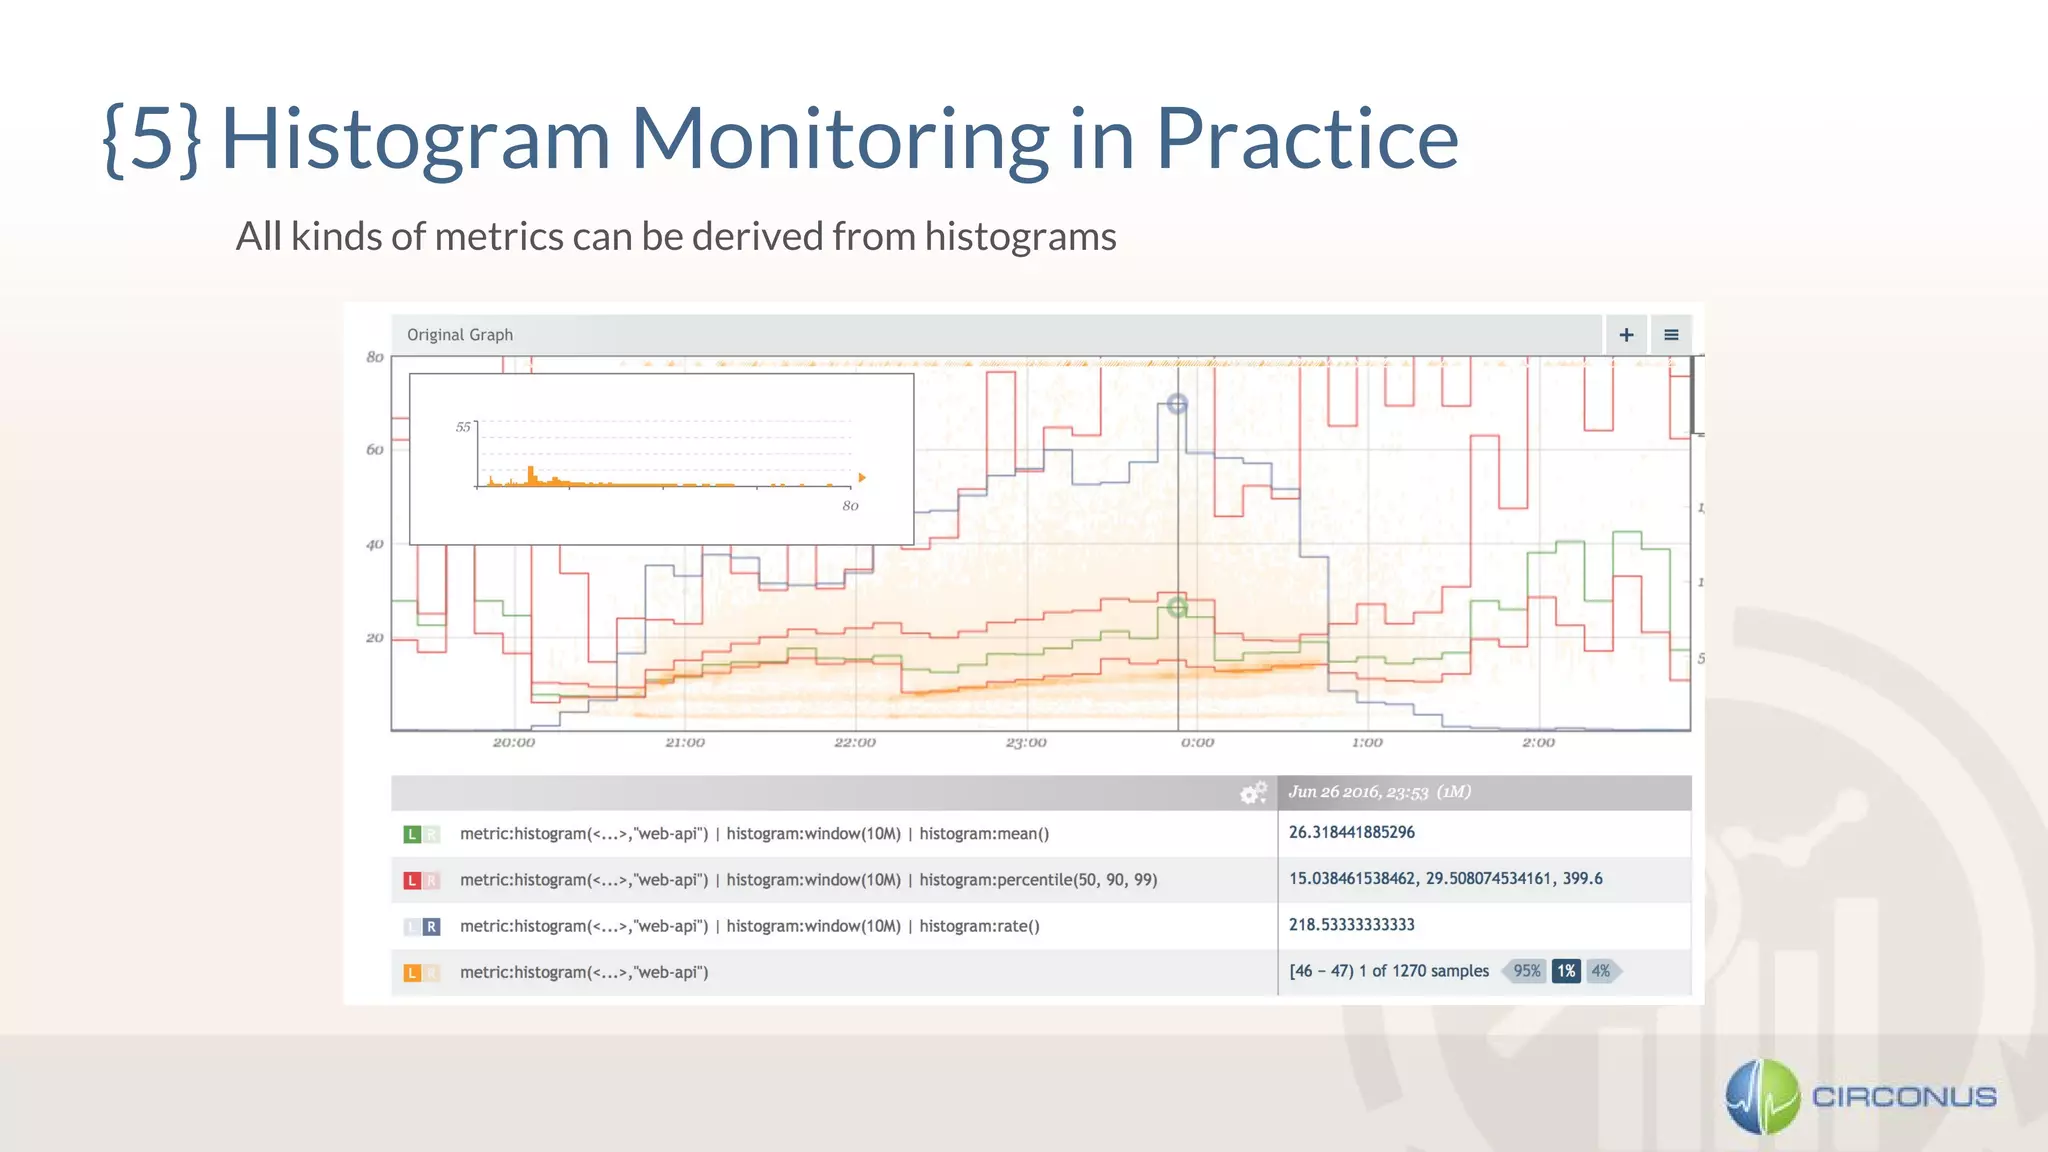
{5} Histogram Monitoring in Practice
All kinds of metrics can be derived from histograms
@HeinrichHartman
{6} The search for meaningful metrics
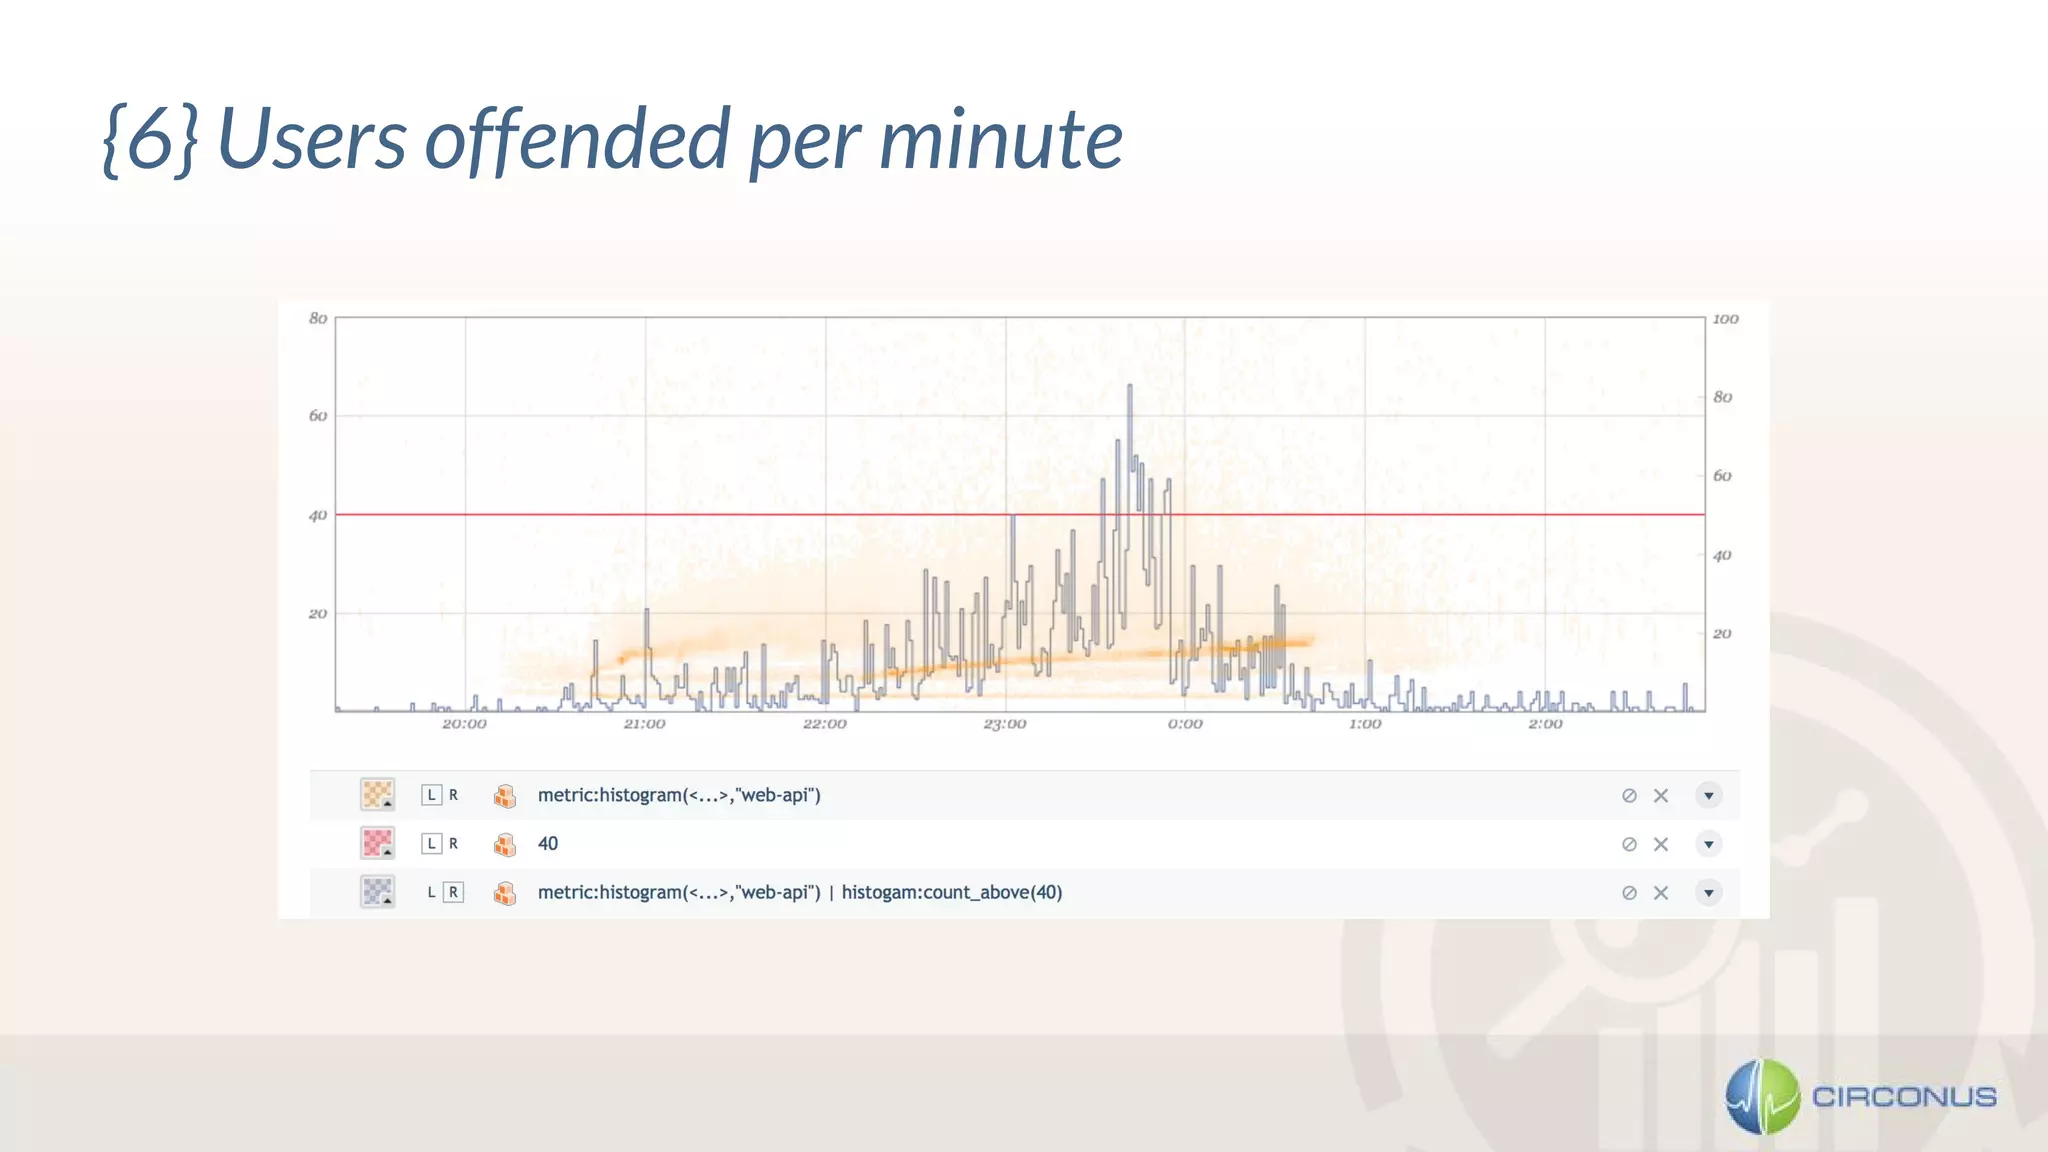
{6} Users offended per minute
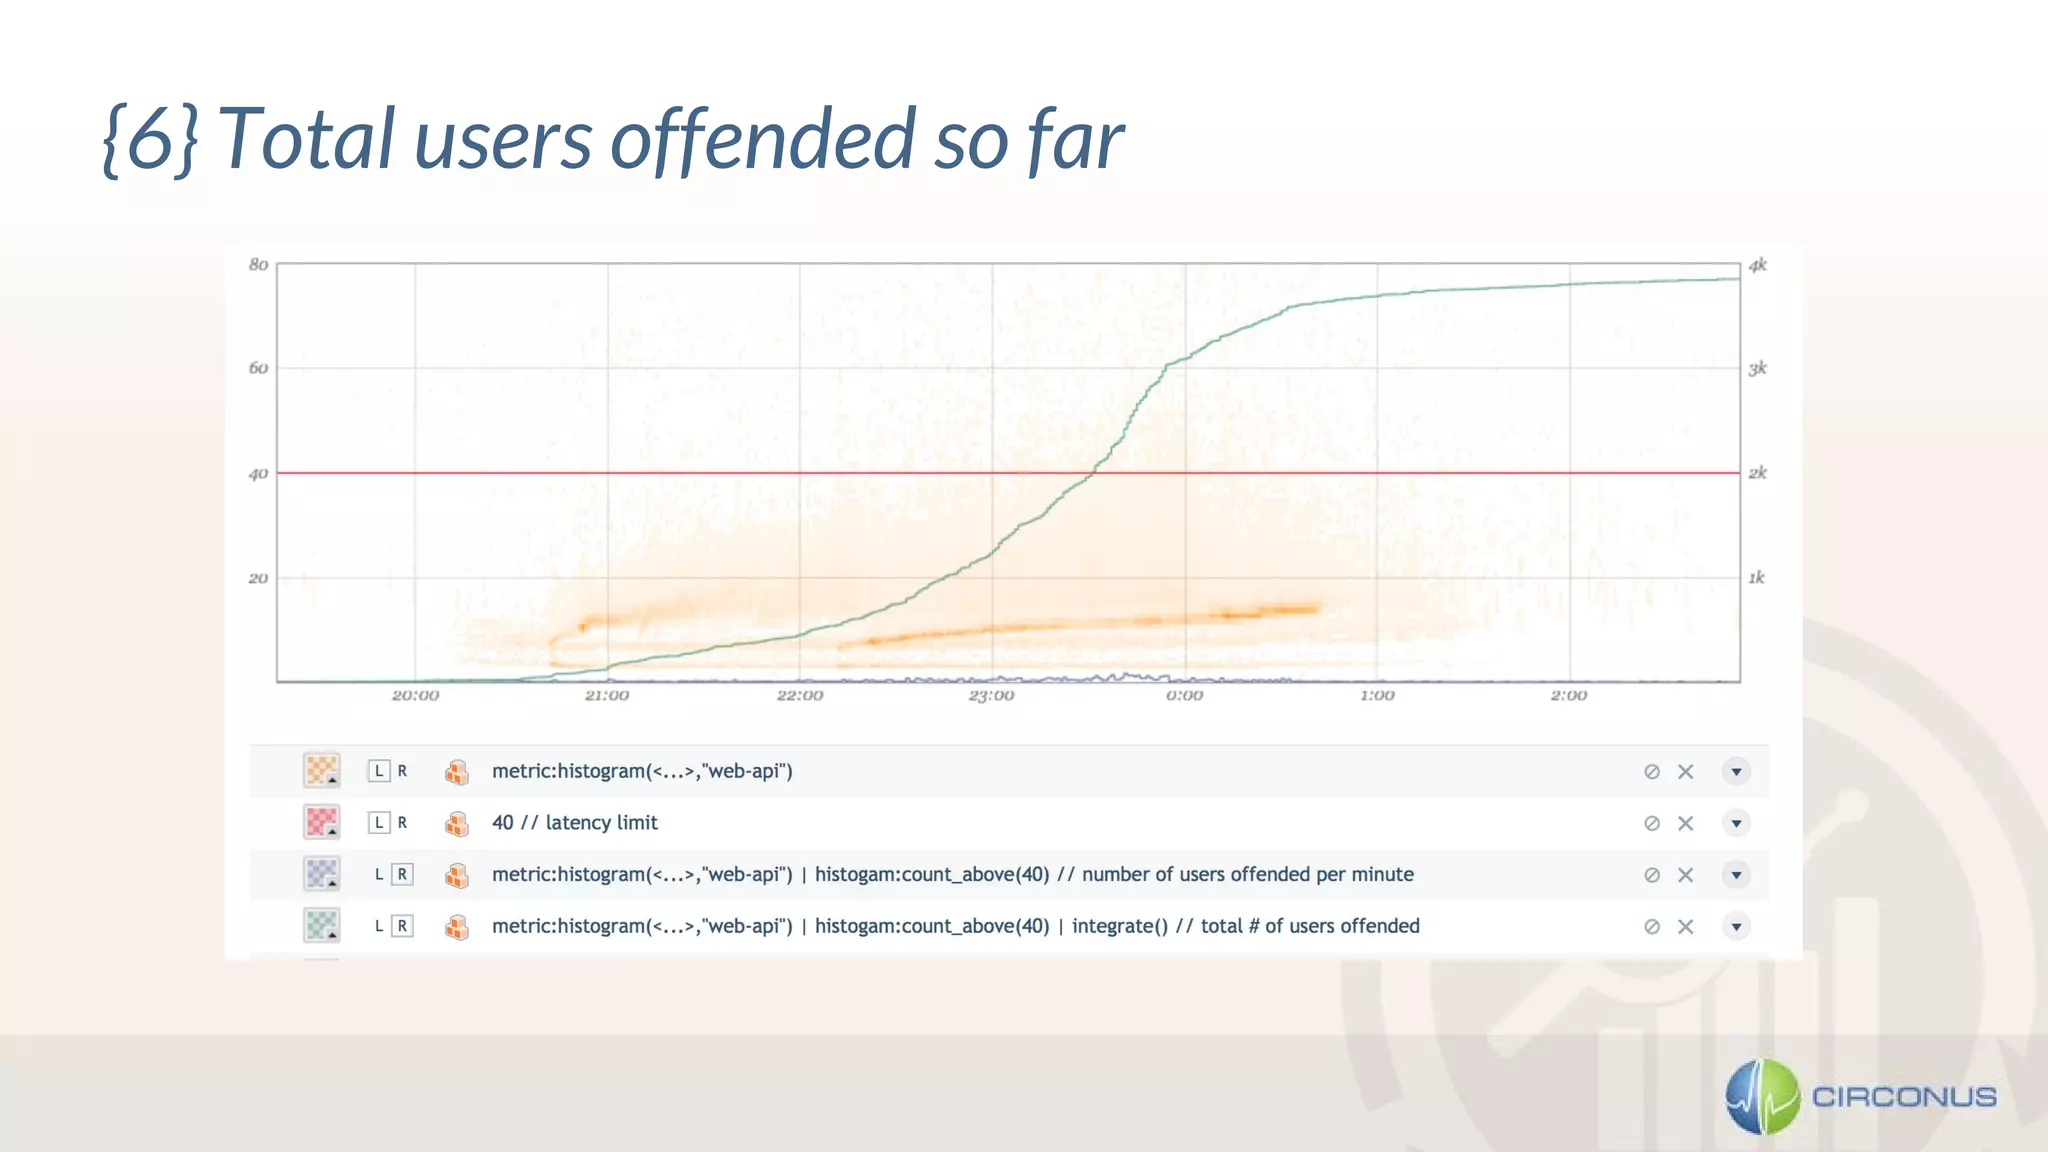
{6} Total users offended so far
@HeinrichHartman
Takeaways
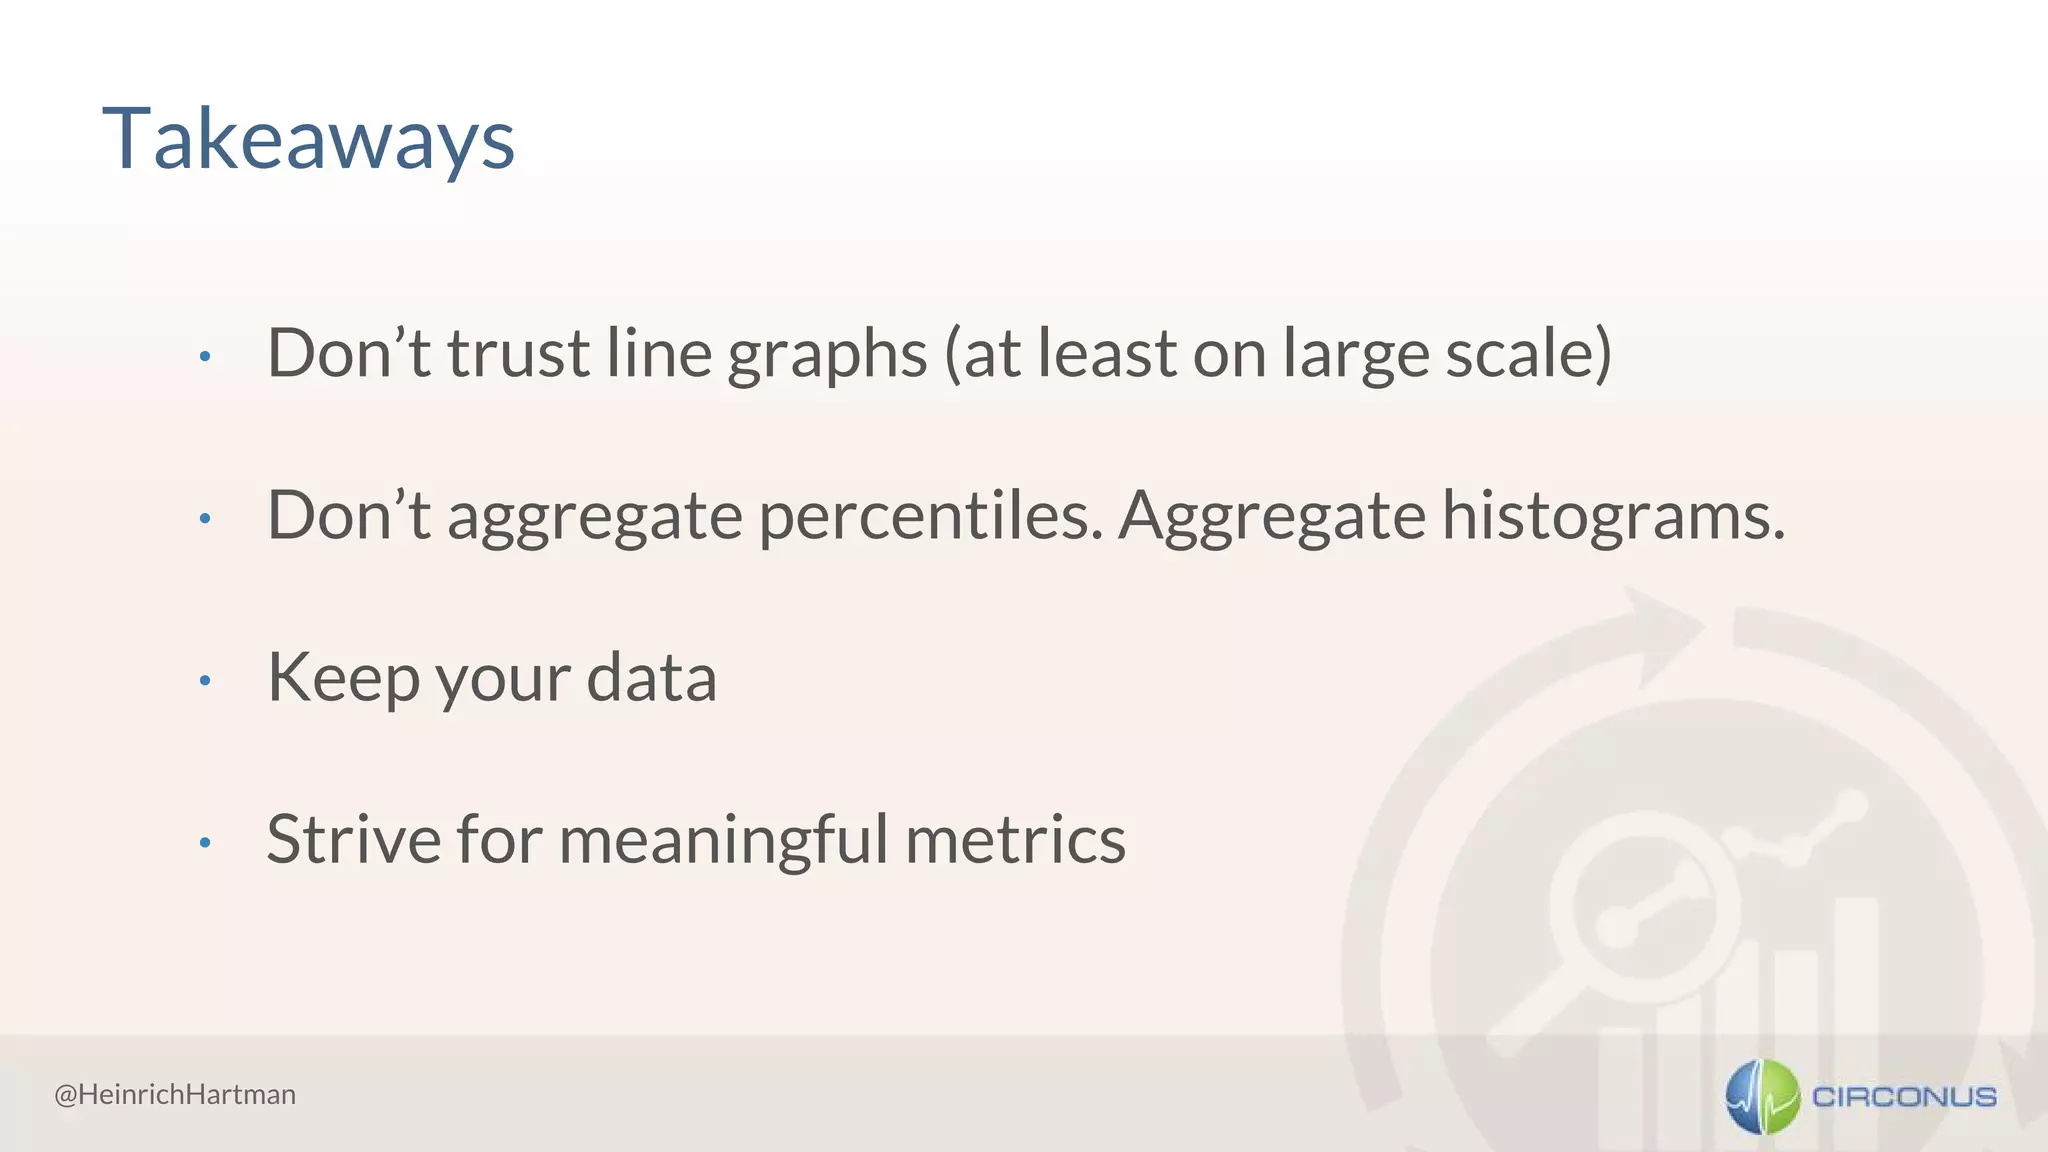
· Don’t trust line graphs (at least on large scale)
· Don’t aggregate percentiles. Aggregate histograms.
· Keep your data
· Strive for meaningful metrics

Statistics for Engineers

  • 1.
    Monitorama PDX, June29th 2016 Statistics for Engineers Heinrich Hartmann, Circonus
  • 2.
    @HeinrichHartman Hi, I amHeinrich · Lives in Munich, EU · Refugee from Academia (Ph.D.) · Analytics Lead at Circonus, Monitoring and Analytics Platform heinrich.hartmann@circonus.com @HeinrichHartman(n)
  • 3.
    @HeinrichHartman #StatsForEngineers has beenaround for a while [1] Statistics for Engineers @ ACM Queue [2] Statistics for Engineers Workshop Material @ GitHub [3] Spike Erosion @ circonus.com [4] T. Schlossnagle - The Problem with Math @ circonus.com [5] T. Schlossnagle - Percentages are not People @ circonus.com [6] W. Vogels - Service Level Agreements in Amazon’s Dynamo/Sec. 2.2 [7] G. Schlossnagle - API Performance Monitoring @ Velocity Bejing 2015 Upcoming [8] 3h workshop “Statistics for Engineers” @ SRECon 2016 in Dublin
  • 4.
  • 5.
    @HeinrichHartman “Attic” - afurniture webstore · Attic is a (fictional) furniture webstore · Web API serving their catalog · Loses money if requests take too long Monitoring Goals 1. Measure user experience / quality of service 2. Determine (financial) implications of service degradation 3. Define sensible SLA-targets for the Dev- and Ops-teams
  • 6.
  • 7.
    @HeinrichHartman {1} External APIMonitoring Method 1. Make a synthetic request every minute 2. Measure and store request latency Good for · Measure Availability · Alert on outages Bad for · Measuring user experience Latencies of synthetic requests over time
  • 8.
    @HeinrichHartman <!> Spike Erosion</!> · On long time ranges, aggregated / rolled-up data is commonly displayed · This practice “erodes” latency spikes heavily! · Store all data and use alternative aggregation methods (min/max) to get full picture, cf. [3]. 1d max all samples as Heatmap / ‘dirt’
  • 9.
  • 10.
    @HeinrichHartman Method Write to logfile: - time of completion, - request latency, and further metadata. Discussion · Rich information source for all kinds of analysis · Easy instrumentation (printf) · Slow. Long delay (minutes) before data is indexed and becomes accessible for analysis · Expensive. Not feasibile for high volume APIs {2} Log Analysis Internal view of an API - “UML” version.
  • 11.
    @HeinrichHartman Numerical Digest: TheRequest-Latency Chart a concise visualization of the API usage Latency on the y- axis time the request was completed
  • 12.
    @HeinrichHartman Construction of theRequest-Latency Chart (RLC) Request Latency UML Diagram Request Latency Chart
  • 13.
    @HeinrichHartman Math view onAPIs (A) Latency distribution (B) Arrival/Completion times (C) Queuing theory
  • 14.
    @HeinrichHartman “Requests are People” Ifyou care about your users, you care about their requests. Every single one.
  • 15.
  • 16.
    @HeinrichHartman {3} What arelatency mean values? reporting period
  • 17.
    @HeinrichHartman {3} Mean RequestLatency Monitoring Method 1. Select a reporting period (e.g. 1 min) 2. For each period report the mean latency Pro/Con + Measure requests by actual people + Cheap to collect store and analyze - Easily skewed by outliers at the high end (complex, long running requests) - ... and the low end (cached responses) “Measuring the average latency is like measuring the average temperature in a hospital.” -- Dogan @ Optimizely
  • 18.
  • 19.
    @HeinrichHartman {3} Mean RequestLatency - Robust Variants 1. Median Latency - Sort latency values in reporting period - The median is the ‘central’ value. 2. Truncated Means - Take out min and max latencies in reporting period (k-times). - Then compute the mean value 3. Collect Deviation Measures - Avoid standdard deviations, use - Use Mean absolute deviation Construction of the median latency
  • 20.
  • 21.
  • 22.
    @HeinrichHartman {4} Percentile Monitoring Method 1.Select a reporting period (e.g. 1 min) 2. For each reporting period measure the 50%, 90%, 99%, 99.9% latency percentile 3. Alert when percentiles are over a threshold value Pro/Con + Measure requests by actual people + Cheap to collect store and analyze + Robust to Outliers - Up-front choice of percentiles needed - Can not be aggregated
  • 23.
    {5} How itlooks in practice Latency percentiles 50,90,99 computed over 1m reporting periods
  • 24.
    <!> Percentiles can’tbe aggregated </!> The median of two medians is NOT the total median. If you store percentiles you need to: A. Keep all your data. Never take average rollups! B. Store percentiles for all aggregation levels separately, e.g. ○ per Node / Rack / DC ○ per Endpoint / Service C. Store percentiles for all reporting periods you are interested in, e.g. per min / h / day D. Store all percentiles you will ever be interested in, e.g. 50, 75, 90, 99, 99.9 Further Reading: [4] T. Schlossnagle - The Problem with Math @ circonus.com
  • 25.
  • 26.
    {5} API Monitoringwith Histograms Method 1. Divide latency scale into bands 2. Divide the time scale into reporting periods 3. Count the number of samples in each latency band x reporting period Discussion · Summary of full RLC, with reduced precision · Extreme compression compared to logs · Percentiles, averages, medians, etc. can be derived · Aggregation across time and nodes trivial · Allows more meaningful metrics latency sample count time
  • 27.
    {5} Histogram Monitoringin Practice Histograms can be visualized as heatmaps. Aggregate data from all nodes serving “web-api” .. across windows of 10min.
  • 28.
    {5} Histogram Monitoringin Practice All kinds of metrics can be derived from histograms
  • 29.
    @HeinrichHartman {6} The searchfor meaningful metrics
  • 30.
  • 31.
    {6} Total usersoffended so far
  • 32.
    @HeinrichHartman Takeaways · Don’t trustline graphs (at least on large scale) · Don’t aggregate percentiles. Aggregate histograms. · Keep your data · Strive for meaningful metrics