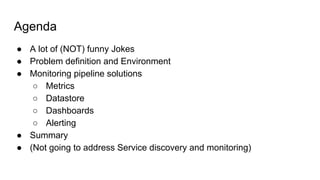
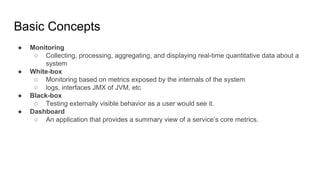
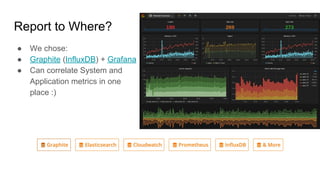
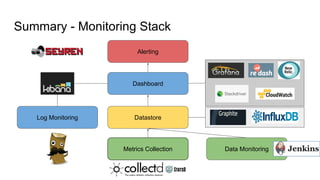
Monitoring Big Data Systems Done
"The Simple Way"
Demi Ben-Ari - CTO @ Panorays
About Me
Demi Ben-Ari, Co-Founder & CTO @ Panorays
● BS’c Computer Science – Academic College Tel-Aviv Yaffo
● Co-Founder “Big Things” Big Data Community
In the Past:
● Sr. Data Engineer - Windward
● Team Leader & Sr. Java Software Engineer,
Missile defense and Alert System - “Ofek” – IAF
Interested in almost every kind of technology – A True Geek
Agenda
● A lot of (NOT) funny Jokes
● Problem definition and Environment
● Monitoring pipeline solutions
○ Metrics
○ Datastore
○ Dashboards
○ Alerting
● Summary
● (Not going to address Service discovery and monitoring)
Say “Distributed”, Say “Big Data”,
Say….
What is Big Data (IMHO)? And What to Monitor?
● Systems involving the “3 Vs”:
What are the right questions we want to ask?
○ Volume - How much?
■ Amount per second / minute / hour / day….
■ Gigabytes, Terabytes, Petabytes…
○ Velocity - How fast?
■ Count per second / minute / hour / day….
○ Variety
■ What kind? (Difference)
■ Sensor Data, Logs, Data Streams, Financial Transactions, Geo Locations...
Monolith Structure
OS CPU Memory Disk
Processes Java
Application
Server
Database
Web Server
Load
Balancer
Users - Other Applications
Monitoring
System
UI
Distributed Microservices Architecture
Service A
Queue
DB
Service B
DBCache
Cache DBService C
Web
Server
DB
Analytics Cluster
Master
Slave Slave Slave
Monitoring System???
Some basic concepts
Basic Concepts
● Monitoring
○ Collecting, processing, aggregating, and displaying real-time quantitative data about a
system
● White-box
○ Monitoring based on metrics exposed by the internals of the system
○ logs, interfaces JMX of JVM, etc
● Black-box
○ Testing externally visible behavior as a user would see it.
● Dashboard
○ An application that provides a summary view of a service’s core metrics.
Basic Concepts
● Alert
○ A notification intended to be read by a human and that is pushed to a system such as a
bug or ticket queue, an email alias or a pager.
● Root cause
○ A defect in a software or human system that - if repaired, instills confidence that this
event won’t happen again in the same way.
● Node and machine
○ Used interchangeably to indicate a single instance (physical server, virtual machine or
container). There might be multiple services worth monitoring on a single machine.
● Push
○ Any change to a service’s running software or its configuration.
● KPI - Key Performance Indicator
Data flow and Environment
(Our Use Case)
Data Flow Diagram
External
Data
Source
Analytics
Layers
Data Pipeline
Parsed
Raw
Entity Resolution
Process
Building insights
on top of the entities
Data Output
Layer
Anomaly
Detection
Trends
UI for End Users
Environment Description
Cluster
Dev Testing
Live
Staging
ProductionEnv
OB1K
RESTful Java Services
Situations
MongoDB + Spark
Worker 1
Worker 2
….
….
…
…
Worker N
Spark
Cluster
Master
Write
Read
MasterSahrded
MongoDB
Replica Set
Cassandra + Spark
Worker 1
Worker 2
….
….
…
…
Worker N
Cassandra
Cluster
Spark
Cluster
Write
Read
Cassandra + Serving
Cassandra
Cluster
Write
Read
UI Client
UI Client
UI Client
UI Client
Web
ServiceWeb
ServiceWeb
ServiceWeb
Service
Problems
● Multiple physical servers
● Multiple logical services
● Want Scaling => More Servers
● Even if you had all of the metrics
○ You’ll have an overflow of the data
● Your monitoring becomes a “Big Data” problem itself
The what really “Distributed” Means
The DevOps Guy
(It might be you)
So...Let’s Start!
Report to Where?
● We chose:
● Graphite (InfluxDB) + Grafana
● Can correlate System and
Application metrics in one
place :)
Report to Where?
● Save DevOps efforts if you’re willing to Pay :)
● Hosted Graphite
○ https://www.hostedgraphite.com/
● Throwing the “Big Data” volume monitoring problem at someone else
Connections
Connections...
http://www.mememaker.net/meme/connections-connections-everywhere2/
Drivers to Datastores
● Actions they usually do:
○ Open connection
○ Apply actions
■ Select
■ Insert
■ Update
■ Delete
○ Close connection
● Do you monitor each?
○ Hint: Yes!!!! Hell Yes!!!
● Creating a wrapper in any programming language and reporting the metrics
○ Count, execution times, errors…
○ A bit of Infrastructure code that will give great visibility
Monitoring
Operation System
Monitoring Operation System Metrics
● What to measure:
○ CPU
○ Memory
○ Disk Space
● How to measure:
○ CollectD or StatsD reporting to Graphite
○ New Relic
■ Nice and easy UI
■ Even the free account gives great tool
■ Alerting of thresholds
Monitoring
Cassandra
Monitoring Cassandra
● OpsCenter - by DataStax
Monitoring Cassandra
● Is the enough?...
We can connect it to Graphite also (Blog: “Monitoring the hell out of
Cassandra”)
● Plug & Play the metrics to Graphite - Internal Cassandra mechanism
● Back to the basics: dstat, iostat, iotop, jstack
Monitoring Cassandra
Monitoring Cassandra - Alternative
Monitoring Cassandra - Some more :)
● Cyanite: http://cyanite.io/
Graphite with Cassandra backend as a datasource.
● Nodetool - Cassandra tool
● Back to the basics: dstat, iostat, iotop, jstack
Some help
from “the Cloud”
Monitoring via AWS’s CloudWatch
Google Stackdriver (GCP)
● Can integrate both GCP and Amazon accounts
Monitoring Spark
What to monitor in an Apache Spark Cluster
● Application execution
● Resource consumption and allocation
● Task Failures
● Environment and Amount of servers
● Physical OS metrics
● Infrastructure services
Ways to Monitoring Spark
● Sending Metrics: Spark → Graphite (Execution)
● http://spark.apache.org/docs/latest/monitoring.html
Ways to Monitoring Spark
● Sending Metrics: Spark → Graphite (JVM metrics)
● http://spark.apache.org/docs/latest/monitoring.html
Ways to Monitoring Spark
● Grafana-spark-dashboards
○ Blog: http://www.hammerlab.org/2015/02/27/monitoring-spark-with-graphite-and-grafana/
● Spark UI - Online on each application running
● Spark History Server - Offline (After application finishes)
● Spark REST API
○ Querying via inner tools to do ad-hoc monitoring
● Back to the basics: dstat, iostat, iotop, jstack
● Blog post by Tzach Zohar - “Tips from the Trenches”
Monitoring
Your Data
https://memegenerator.net/instance/53617544
Data Questions?
● Did all of the computation occur?
● Are there any data layers missing?
● How much data do we have? (Volume)
● Is all of the data in the Database?
Data Answers!
● KISS (Keep it simple stupid)
● Jenkins + Maven (JUnit) for the rescue
● Creating a maven “monitoring” project.
○ Running scheduled tasks, each for the relevant data source
■ Database data existence
■ S3 files existence
■ Data flow that keeps on coming from sensors
■ (Any other data source that you can imagine…)
○ Scheduled task that write amount metrics to Graphite -> Dashboards
○ Report task execution to Graphite
Data Answers!
● The method doesn’t really matter, as long as you:
○ Can follow the results over time
○ Know what your data flow and know where things might fail
○ It’s easy for anyone to add more monitoring
(For the ones that add the new data each time…)
○ It don’t trust others to add monitoring
(It will always end up the DevOps’s “fault” -> No monitoring will be
applied)
Logging?
Monitoring?
https://lh4.googleusercontent.com/DFVcH-E5XKj8cbhEtI0qabmf_wwVqWWvk0pK5H5rnC_kVxY2tXClKfzV-
LvAH61YRLJUEvtO9amjWfjcY4Z57VBYCuQ95_hdAVEHgLAuepJiArH0wJERWuzzmgnPysCiIA
● Elastic
● Architecture:
Server
Server
Server
ELK - Elasticsearch + Logstash + Kibana
Shippers
Queue
Indexer Web UIStorage
● (Simpler) Architecture:
○ The problem: Log42 only works with TCP :( => Log4J2 works with UDP too
Server
Server
Server
ELK - Elasticsearch + Logstash + Kibana
Indexer Web UIStorage
TCP / UDP
ELK - Elasticsearch + Logstash + Kibana
http://www.digitalgov.gov/2014/05/07/analyzing-search-data-in-real-time-to-drive-decisions/
ELK - Elasticsearch + Logstash + Kibana
http://blog.takipi.com/log-management-tools-face-off-splunk-vs-logstash-vs-sumo-logic/
Who else Logs?
● Graylog2
● ….
● Logging As a Service :)
○ Logz.io (http://logz.io/blog/deploy-elk-production)
○ Logly
○ sematext
How does it look in real life?
● http://www.digitalgov.gov/2015/01/07/elk/
● http://www.ragedsyscoder.com/monitoring-slides/file/img/tvs.jpg
Did someone say
“Dashboard”?
http://www.funpic.hu/_files/pictures/original/86/71/27186.jpg
Redash
● http://redash.io/
● Open Source: https://github.com/getredash/redash
● Came out as one of many Open source tool by Everything.me
● Created and Maintained by Arik Fraimovich (You rock!)
● Written in Python
● Has an on-premise and hosted solution
●‫רןאאקמ‬
Redash - Data Sources
Redash - Screenshots
Redash - the “Why?”
● Having multiple data sources in the organization
● Wanting to see all a combination of data sources in one place
● It’s open source and ready to use
● Why implement fancy UI and spend a lot of time?!?!?
● So...just use it!
Alerting
Alerting
● Syren - Open source
● Reporting to:
○ Email, Flowdock, HipChat, HTTP,
Hubot, IRCcat, PagerDuty,
Pushover, SLF4J, Slack,
SNMP, Twilio
ELK - And what about alerting???
● Elastalert
● http://engineeringblog.yelp.com/2015/10/elastalert-alerting-at-scale-with-elasticsearch.html
● http://engineeringblog.yelp.com/2016/03/elastalert-part-two.html
Some more alerting
● Cloudwatch and Stackdriver has their own alerting mechanism
● New Relic has it’s own alerting too
● Even with our Jenkins tests we’ve created alerting via emails
○ Beware of “Spam”
● Find which solution you would like as long as:
○ You can notice what is wrong => when it’s wrong
○ Be able to “Acknowledge” your errors
○ Do something you won’t be able to ignore :)
Summary - Monitoring Stack
Alerting
Metrics Collection
Datastore
Dashboard
Data Monitoring
Log Monitoring
Conclusions
● Correlating Application and System metrics!!!!
● Ask the right monitoring questions and answer them with Dashboards
● KISS - simple is key, what’s hard, we tend not to do at all
● Alert about what you can actually react to (And to the relevant person)
● Measure whatever you can - only way to know if you’re improving
● Monitor your business KPIs too.
● If all of the above is not enough,
Graphs are fricking cool!
http://www.rantlifestyle.com/2013/09/23/how-happy-this-baby-is-will-shock-you/
Questions?
Demi Ben-Ari
● LinkedIn
● Twitter: @demibenari
● Blog: http://progexc.blogspot.com/
● Email: demi.benari@gmail.com
● “Big Things” Community
Meetup, YouTube, Facebook, Twitter
● GDG Cloud
Thanks! my contact:
Resources
● Monitoring distributed systems - A case study in how Google monitors its
complex systems

Monitoring Big Data Systems - "The Simple Way"

  • 1.
    Monitoring Big DataSystems Done "The Simple Way" Demi Ben-Ari - CTO @ Panorays
  • 2.
    About Me Demi Ben-Ari,Co-Founder & CTO @ Panorays ● BS’c Computer Science – Academic College Tel-Aviv Yaffo ● Co-Founder “Big Things” Big Data Community In the Past: ● Sr. Data Engineer - Windward ● Team Leader & Sr. Java Software Engineer, Missile defense and Alert System - “Ofek” – IAF Interested in almost every kind of technology – A True Geek
  • 3.
    Agenda ● A lotof (NOT) funny Jokes ● Problem definition and Environment ● Monitoring pipeline solutions ○ Metrics ○ Datastore ○ Dashboards ○ Alerting ● Summary ● (Not going to address Service discovery and monitoring)
  • 4.
    Say “Distributed”, Say“Big Data”, Say….
  • 5.
    What is BigData (IMHO)? And What to Monitor? ● Systems involving the “3 Vs”: What are the right questions we want to ask? ○ Volume - How much? ■ Amount per second / minute / hour / day…. ■ Gigabytes, Terabytes, Petabytes… ○ Velocity - How fast? ■ Count per second / minute / hour / day…. ○ Variety ■ What kind? (Difference) ■ Sensor Data, Logs, Data Streams, Financial Transactions, Geo Locations...
  • 6.
    Monolith Structure OS CPUMemory Disk Processes Java Application Server Database Web Server Load Balancer Users - Other Applications Monitoring System UI
  • 7.
    Distributed Microservices Architecture ServiceA Queue DB Service B DBCache Cache DBService C Web Server DB Analytics Cluster Master Slave Slave Slave Monitoring System???
  • 8.
  • 9.
    Basic Concepts ● Monitoring ○Collecting, processing, aggregating, and displaying real-time quantitative data about a system ● White-box ○ Monitoring based on metrics exposed by the internals of the system ○ logs, interfaces JMX of JVM, etc ● Black-box ○ Testing externally visible behavior as a user would see it. ● Dashboard ○ An application that provides a summary view of a service’s core metrics.
  • 10.
    Basic Concepts ● Alert ○A notification intended to be read by a human and that is pushed to a system such as a bug or ticket queue, an email alias or a pager. ● Root cause ○ A defect in a software or human system that - if repaired, instills confidence that this event won’t happen again in the same way. ● Node and machine ○ Used interchangeably to indicate a single instance (physical server, virtual machine or container). There might be multiple services worth monitoring on a single machine. ● Push ○ Any change to a service’s running software or its configuration. ● KPI - Key Performance Indicator
  • 11.
    Data flow andEnvironment (Our Use Case)
  • 12.
    Data Flow Diagram External Data Source Analytics Layers DataPipeline Parsed Raw Entity Resolution Process Building insights on top of the entities Data Output Layer Anomaly Detection Trends UI for End Users
  • 13.
  • 14.
  • 15.
    MongoDB + Spark Worker1 Worker 2 …. …. … … Worker N Spark Cluster Master Write Read MasterSahrded MongoDB Replica Set
  • 16.
    Cassandra + Spark Worker1 Worker 2 …. …. … … Worker N Cassandra Cluster Spark Cluster Write Read
  • 17.
    Cassandra + Serving Cassandra Cluster Write Read UIClient UI Client UI Client UI Client Web ServiceWeb ServiceWeb ServiceWeb Service
  • 18.
    Problems ● Multiple physicalservers ● Multiple logical services ● Want Scaling => More Servers ● Even if you had all of the metrics ○ You’ll have an overflow of the data ● Your monitoring becomes a “Big Data” problem itself
  • 19.
    The what really“Distributed” Means The DevOps Guy (It might be you)
  • 20.
  • 21.
    Report to Where? ●We chose: ● Graphite (InfluxDB) + Grafana ● Can correlate System and Application metrics in one place :)
  • 22.
    Report to Where? ●Save DevOps efforts if you’re willing to Pay :) ● Hosted Graphite ○ https://www.hostedgraphite.com/ ● Throwing the “Big Data” volume monitoring problem at someone else
  • 23.
  • 24.
    Drivers to Datastores ●Actions they usually do: ○ Open connection ○ Apply actions ■ Select ■ Insert ■ Update ■ Delete ○ Close connection ● Do you monitor each? ○ Hint: Yes!!!! Hell Yes!!! ● Creating a wrapper in any programming language and reporting the metrics ○ Count, execution times, errors… ○ A bit of Infrastructure code that will give great visibility
  • 25.
  • 26.
    Monitoring Operation SystemMetrics ● What to measure: ○ CPU ○ Memory ○ Disk Space ● How to measure: ○ CollectD or StatsD reporting to Graphite ○ New Relic ■ Nice and easy UI ■ Even the free account gives great tool ■ Alerting of thresholds
  • 27.
  • 28.
  • 29.
    Monitoring Cassandra ● Isthe enough?... We can connect it to Graphite also (Blog: “Monitoring the hell out of Cassandra”) ● Plug & Play the metrics to Graphite - Internal Cassandra mechanism ● Back to the basics: dstat, iostat, iotop, jstack
  • 30.
  • 31.
  • 32.
    Monitoring Cassandra -Some more :) ● Cyanite: http://cyanite.io/ Graphite with Cassandra backend as a datasource. ● Nodetool - Cassandra tool ● Back to the basics: dstat, iostat, iotop, jstack
  • 33.
  • 34.
  • 35.
    Google Stackdriver (GCP) ●Can integrate both GCP and Amazon accounts
  • 36.
  • 37.
    What to monitorin an Apache Spark Cluster ● Application execution ● Resource consumption and allocation ● Task Failures ● Environment and Amount of servers ● Physical OS metrics ● Infrastructure services
  • 38.
    Ways to MonitoringSpark ● Sending Metrics: Spark → Graphite (Execution) ● http://spark.apache.org/docs/latest/monitoring.html
  • 39.
    Ways to MonitoringSpark ● Sending Metrics: Spark → Graphite (JVM metrics) ● http://spark.apache.org/docs/latest/monitoring.html
  • 40.
    Ways to MonitoringSpark ● Grafana-spark-dashboards ○ Blog: http://www.hammerlab.org/2015/02/27/monitoring-spark-with-graphite-and-grafana/ ● Spark UI - Online on each application running ● Spark History Server - Offline (After application finishes) ● Spark REST API ○ Querying via inner tools to do ad-hoc monitoring ● Back to the basics: dstat, iostat, iotop, jstack ● Blog post by Tzach Zohar - “Tips from the Trenches”
  • 41.
  • 42.
    Data Questions? ● Didall of the computation occur? ● Are there any data layers missing? ● How much data do we have? (Volume) ● Is all of the data in the Database?
  • 43.
    Data Answers! ● KISS(Keep it simple stupid) ● Jenkins + Maven (JUnit) for the rescue ● Creating a maven “monitoring” project. ○ Running scheduled tasks, each for the relevant data source ■ Database data existence ■ S3 files existence ■ Data flow that keeps on coming from sensors ■ (Any other data source that you can imagine…) ○ Scheduled task that write amount metrics to Graphite -> Dashboards ○ Report task execution to Graphite
  • 44.
    Data Answers! ● Themethod doesn’t really matter, as long as you: ○ Can follow the results over time ○ Know what your data flow and know where things might fail ○ It’s easy for anyone to add more monitoring (For the ones that add the new data each time…) ○ It don’t trust others to add monitoring (It will always end up the DevOps’s “fault” -> No monitoring will be applied)
  • 45.
  • 46.
    ● Elastic ● Architecture: Server Server Server ELK- Elasticsearch + Logstash + Kibana Shippers Queue Indexer Web UIStorage
  • 47.
    ● (Simpler) Architecture: ○The problem: Log42 only works with TCP :( => Log4J2 works with UDP too Server Server Server ELK - Elasticsearch + Logstash + Kibana Indexer Web UIStorage TCP / UDP
  • 48.
    ELK - Elasticsearch+ Logstash + Kibana http://www.digitalgov.gov/2014/05/07/analyzing-search-data-in-real-time-to-drive-decisions/
  • 49.
    ELK - Elasticsearch+ Logstash + Kibana http://blog.takipi.com/log-management-tools-face-off-splunk-vs-logstash-vs-sumo-logic/
  • 50.
    Who else Logs? ●Graylog2 ● …. ● Logging As a Service :) ○ Logz.io (http://logz.io/blog/deploy-elk-production) ○ Logly ○ sematext
  • 51.
    How does itlook in real life? ● http://www.digitalgov.gov/2015/01/07/elk/ ● http://www.ragedsyscoder.com/monitoring-slides/file/img/tvs.jpg
  • 52.
  • 53.
    Redash ● http://redash.io/ ● OpenSource: https://github.com/getredash/redash ● Came out as one of many Open source tool by Everything.me ● Created and Maintained by Arik Fraimovich (You rock!) ● Written in Python ● Has an on-premise and hosted solution ●‫רןאאקמ‬
  • 54.
  • 55.
  • 56.
  • 57.
    Redash - the“Why?” ● Having multiple data sources in the organization ● Wanting to see all a combination of data sources in one place ● It’s open source and ready to use ● Why implement fancy UI and spend a lot of time?!?!? ● So...just use it!
  • 58.
  • 59.
    Alerting ● Syren -Open source ● Reporting to: ○ Email, Flowdock, HipChat, HTTP, Hubot, IRCcat, PagerDuty, Pushover, SLF4J, Slack, SNMP, Twilio
  • 60.
    ELK - Andwhat about alerting??? ● Elastalert ● http://engineeringblog.yelp.com/2015/10/elastalert-alerting-at-scale-with-elasticsearch.html ● http://engineeringblog.yelp.com/2016/03/elastalert-part-two.html
  • 61.
    Some more alerting ●Cloudwatch and Stackdriver has their own alerting mechanism ● New Relic has it’s own alerting too ● Even with our Jenkins tests we’ve created alerting via emails ○ Beware of “Spam” ● Find which solution you would like as long as: ○ You can notice what is wrong => when it’s wrong ○ Be able to “Acknowledge” your errors ○ Do something you won’t be able to ignore :)
  • 62.
    Summary - MonitoringStack Alerting Metrics Collection Datastore Dashboard Data Monitoring Log Monitoring
  • 63.
    Conclusions ● Correlating Applicationand System metrics!!!! ● Ask the right monitoring questions and answer them with Dashboards ● KISS - simple is key, what’s hard, we tend not to do at all ● Alert about what you can actually react to (And to the relevant person) ● Measure whatever you can - only way to know if you’re improving ● Monitor your business KPIs too. ● If all of the above is not enough, Graphs are fricking cool! http://www.rantlifestyle.com/2013/09/23/how-happy-this-baby-is-will-shock-you/
  • 64.
  • 65.
    Demi Ben-Ari ● LinkedIn ●Twitter: @demibenari ● Blog: http://progexc.blogspot.com/ ● Email: demi.benari@gmail.com ● “Big Things” Community Meetup, YouTube, Facebook, Twitter ● GDG Cloud Thanks! my contact:
  • 66.
    Resources ● Monitoring distributedsystems - A case study in how Google monitors its complex systems