Download to read offline

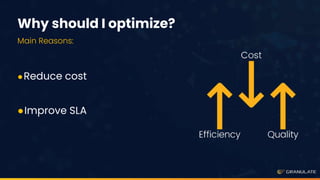

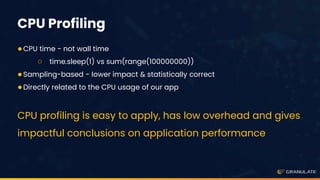


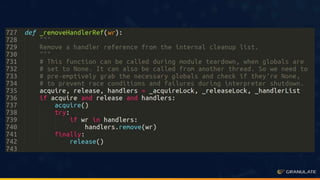


The document discusses performance optimization through continuous production profiling, highlighting the importance of reducing costs and improving service level agreements (SLA). It introduces various profiling types, particularly CPU profiling, which aids in optimizing application performance with low overhead. The author, Yonatan Goldschmidt, shares insights on utilizing gprofiler for ongoing performance analysis and implementation of code improvements.


![[ CNCF Q1 2024 ] Intro to Continuous Profiling and Grafana Pyroscope.pdf](https://cdn.slidesharecdn.com/ss_thumbnails/cncfq12024introtocontinuousprofilingandgrafanapyroscope-240407162420-9c15afb7-thumbnail.jpg?width=640&height=640&fit=bounds)