SlideShare a Scribd company logo
1 of 43
Download to read offline
Chapter 2
State of the Art in the Characterization of Nano- and Atomic-
Scale Catalysts
Devika Laishram, Divya Kumar, Unnati Gupta, R. Krishnapriya, and Rakesh K. Sharma*
Sustainable Materials and Catalysis Research Laboratory (SMCRL), Department of
Chemistry, Indian Institute of Technology Jodhpur, Jodhpur, India 342037
*Email: rks@iitj.ac.in
Nanometer and subnanometer particles and films are becoming an essential and
integral part of new technologies and inventions in different areas. Some of the
most common areas include the microelectronic industry, magnetic recordings,
photovoltaic applications, and optical coatings. Because of the ultrasmall size at
atomic levels, the effect of quantum size becomes prominent, and the sensitivity
of size is defined even by a difference of a single atom. Additionally, the effect
is of utmost importance as the single-atom catalysts are far more advantageous
than conventional catalysts as they tend to anchor easily because of their low
coordination. Also, the presence of a single-atom catalyst in reactions creates
efficient charge transfer as it forms a strong interaction with the support.
Furthermore, catalysts in the subnanometer regime exhibit different electronic
states and adsorption capabilities compared to traditional catalysts. Therefore, to
fully appreciate the subnanometer catalysis reactions, it is essential to study the
meansofcharacterizingthepreparedsubnanocatalysts,inordertocharacterizethe
materials in their as-synthesized form, to obtain a precise and accurate analysis;
these are some of the fundamental requirements for achieving an optimum
performance. The physical properties of many interesting materials for advanced
technological usage are highly governed by the distribution and placement of
atoms. Superior techniques such as high-resolution transmission electron
microscopy and high-angle annular dark-field scanning transmission electron
microscopy and infrared and X-ray absorption spectroscopic techniques provide
electronic and geometric configurations and also reveal the transformation of the
subnano catalysts on the support material. Modeling methods such as density
functional theory can successfully predict the electronic structure and geometric
configuration of the catalyst, which in turn influence the selectivity and activity of
the catalyst. Thus, understanding the characterization techniques gives the ability
to understand, identify, and measure the local environment of individual atoms
and the interaction with the surface support, which will give fundamental
knowledge and insights in the realms of nanoscience and technology, materials
science, chemistry, and physics. Therefore, detection and enhanced measurement
© 2020 American Chemical Society
Downloaded
via
UNIV
OF
CALGARY
on
September
25,
2022
at
15:51:41
(UTC).
See
https://pubs.acs.org/sharingguidelines
for
options
on
how
to
legitimately
share
published
articles.
Sudarsanam and Singh; Advanced Heterogeneous Catalysts Volume 1: Applications at the Nano-Scale
ACS Symposium Series; American Chemical Society: Washington, DC, 2020.
of individual atoms is inherently challenging and is a prerequisite to the
development of new technology and better performing materials. In this chapter,
we have discussed various important methods of characterization for
characterizing subnanometer and atomic catalysts.
Introduction
Nanomaterials and nanochemistry have evolved gigantically over the past few decades,
especially in terms of synthesis, fabrication, characterization, and application in devices. This is a
consequence of the extensive and exhaustive research that has been carried out, leading to a better
understanding of the properties that the materials exhibit in the nano regime. Thus, size influenced
the properties, and the occurrence of size-dependent phenomena such as quantum effects and
surface plasmons can rationally be understood. Materials that earlier existed in bulk form can now be
transformed into nanosized materials with enhanced properties, such as useful semiconductors (1),
single-atom catalysts (2), transition metals (3), and noble metals (4). Other examples include the use
of two-dimensional (2-D) materials such as graphene, which has revolutionized the world with its
properties (5). When materials start existing as a single atom, then it represents the smallest quantum
retaining the characteristics of the material via its local electronic environment (6).
In the field of heterogeneous catalysis, it is important to reduce the size of the catalyst and
disperse it finely over a larger area of the support such as metal to improve the performance (7).
Such a distribution impacts the use of its different active sites, affecting the selectivity. Thus, the
size becomes the critical determining factor. It is vital to describe active centers for effective catalytic
processes and high performance (8–10), and hence precision and control at the atomic level are
necessary (9). Conventional systems of characterization, because of their inherent limitations in
regards to accuracy and resolution, cannot be used to observe at the subnano level and other single-
atom catalysts (11).
Therefore, new sensitive techniques need to be implemented to characterize, analyze, and
understand these single and nano atom catalysts in order to effectively utilize them to their maximum
potential. Additionally, due to their distinctive characteristics and behavior at the atomic level, the
selectivity, activity, and stability change drastically. These single-atom catalysts offer more exposed
reactive sites for catalytic reactions, unlike conventional nanoparticles, which suffer from excessive
aggregation, leading to fewer exposed active sites.
The catalysts at the subnano level and single-atom catalysis have brought about high activity and
selectivity in the field of heterogeneous catalysts. To fully understand and analyze these materials,
many approaches have been established with the rapid advancement and development in
characterization methods. Some of the characterization techniques discussed in this chapter include
high-resolution scanning tunneling microscopy (STM), high-angle annular dark-field scanning
transmission electron microscopy (HAADF-STEM), extended X-ray absorption fine structure
(EXAFS), diffuse reflectance infrared Fourier transform spectroscopy (DRIFTS), X-ray
photoelectron spectroscopy (XPS), NMR spectroscopy, and density functional theory (DFT) as a
theoretical tool. The capacity to probe materials at the subnano level provides a huge understanding
of the electronic structure and important chemical information and interaction of the molecules and
the surface, which provide a deeper level of understanding of the atomic origins and their role in
material properties.
52
Sudarsanam and Singh; Advanced Heterogeneous Catalysts Volume 1: Applications at the Nano-Scale
ACS Symposium Series; American Chemical Society: Washington, DC, 2020.
Characterization Techniques
Electron Microscopy and Associated Techniques
Electron microscopy is instrumental for the characterization of a supported metal catalyst such
as noble metal catalysts. It is an important tool for identifying the presence of single-atom catalysts
from clusters or nanoparticles, especially for noble metals like Pt, Rh, and Pd. It is a powerful method
for determining the spatial distribution of the single-atom catalysts and identifying the location of a
single-atom catalyst in the support (6, 12). Furthermore, electron microscopy, along with associated
techniques, can provide information such as the electronic state within the area of interest and other
atomic-range information such as structure and morphology.
Qiao et al. (13) utilized aberration-corrected scanning transmission electron microscopy
(STEM), having a sub-angstrom resolution, to identify and locate Pt atoms on the surface of an
iron oxide (FeOx) catalyst. The atomic-resolution HAADF provides enhanced contrast at low atomic
numbers, unlike conventional TEM imaging, and also can identify the heavy atoms in the catalyst.
The electrons scattered by the nuclei of the atom are detected using HAADF. The electrons are
incoherent and quasi-elastic, mainly contributed by scattering at high angles of more than 80 mrad.
Stroppa et al. (14) analyzed the three-dimensional morphology of faceted, nanocrystalline CeO2
material using high-resolution scanning transmission electron microscopy (HAADF-HRSTEM).
They were able to achieve this by determining the atomic column via a Gaussian mixture model
(GMM), which is a parametric probability density function represented as a weighted sum of
Gaussian component densities. The parameters of GMM are estimated using the iterative
expectation-maximization algorithm or maximum a posteriori estimation from a well-trained prior
model (15). In this work for the estimation of atomic column thickness, the integrated intensities
wereclassifiedasahistogram,andthedata-fittingprocedurewascarriedoutbyusingmultiplenormal
distributions according to GMM (16). To optimize the model parameters, multiple runs of the
GMM algorithm were performed. Later, each atomic column thickness was assigned to a Gaussian
distribution (14), followed by identifying and assigning atomic positions using a crystallographic
symmetric operation to construct the morphological model representation in three-dimensional
(3-D) form. The HAADF-HRSTEM method of imaging is advantageous as it allows imaging of
atomic columns directly at up to 50 pm resolution (17). The atomic number and the thickness
of the atomic columns are measured from the intensity of the high-angle scattered electrons (18,
19). Thus, it allows reconstruction from an image or set of images of the nanocrystals by using
crystallographic symmetry in combination with the HAADF intensity profile (20). However, there
is still a limitation to the use of electron microscopy for determining 3-D structure, except for a few
selected systems such as lightweight atoms having thin layers and specific Au clusters. For example,
Figures 1a and 1b represent CeO2 HAADF-HRSTEM images in which the atomic Ce columns are
fairlydistinguishabletobepolyhedralandcubic-typenanocrystals.Thisisachievedbyacombination
oftheelectronimagingconfigurationandhigh-anglescatteringofelectrons,dependingontheatomic
weight. The Fourier transform (FT), inset of Figures 1a and 1b, establishes the atomic plane index
and the orientation of the zonal axis (14). Additionally, HAADF-STEM gives information about
the local chemistry and structure at the atomic level, which gives a comprehension of localization of
single atoms. Ni atoms located on nanoporous graphene by substituting a carbon site in the carbon
lattice provides stability of Ni atoms (21).
53
Sudarsanam and Singh; Advanced Heterogeneous Catalysts Volume 1: Applications at the Nano-Scale
ACS Symposium Series; American Chemical Society: Washington, DC, 2020.
Figure 1. HAADF-HRSTEM images of CeO2: (a) polyhedra and (b) cubic nanocrystals. The inset
represents the FT images defining the zonal axes and the corresponding crystallographic planes. Reproduced
with permission from ref. (14). Copyright 2013 Springer.
Li et al. (22) used HAADF STEM to locate the Pt atom distribution over a g-C3N4 support,
where Pt atoms are uniformly dispersed, as confirmed by the bright spots. The existence of isolated
Pt atoms was confirmed by the size of the Pt of less than 0.2 nm. However, with an increase in Pt
loading, the spots become denser, implying the formation of subnanometer clusters of Pt. Similarly,
Kumskov et al. (23) used a combination of HRSTEM and electron energy loss spectroscopy to
identify the structure of a one-dimensional (1-D) unit cell of CuI nanocrystals having space group
Pmmm inside single-walled carbon nanotubes (SWCNTs), as shown in Figure 2.
By simultaneously using both the dark and bright field modes of HRTEM, images can be
observed with an enhanced contrast, such as in cases where small and drowned crystalline features
need to be observed. Thus, rapidly developing technologies such as HAADF-STEM enable the study
of metal atoms anchored on a structural support utilizing coordination with the center atom (24,
25). Additionally, researchers can understand the structural evolution dynamics of the nanosystem.
Liu et al. (26) found that the evolution of Pt species and its stabilization on MCM-22 zeolites
can be studied. Consequently, HAADF-STEM can be a highly functional and useful technique
for exploring the dynamic interaction of metal and substrate and other changes such as oscillatory
behavior and change in the shape of metal nanoparticles.
Thus, it can be concluded that STEM with an annular detector such as the HAADF has the
advantage of sequential scans using a beam of highly focused electrons over a selected area. The
detectors are designed to acquire electrons from various scattering angles other than the original
propagating beam. This technique allows the user to acquire images by collecting electrons that had
undergone various types of diffraction and scattering processes and provide highly vital physical
54
Sudarsanam and Singh; Advanced Heterogeneous Catalysts Volume 1: Applications at the Nano-Scale
ACS Symposium Series; American Chemical Society: Washington, DC, 2020.
information when the electrons interact with the sample. Additionally, the ability to reconstruct a
3-D morphology from an HAADF-HRSTEM image is a major advantage of this characterization
method.
Figure 2. 1-D CuI inside an SWCNT as seen in an HRSTEM image in (a) bright field mode and (b) dark
field mode with a simulated model of the CuI unit cell. Adapted with permission from ref. (23). Copyright
2016 Wiley.
Scanning Tunneling Microscopy
The STM technique is used to image the supported individual metal atoms (27, 28). STM
generally runs at low temperature under ultrahigh vacuum to enhance the resolution of STM to
examine single atoms (29, 30). Lucci et al. (31) used STM to identify a single Pt atom deposited
on Cu(111) surfaces. The result obtained by STM imaging showed that at low Pt coverage (0.02
monolayer), the Pt atoms exist as individual and isolated species substituted in the Cu surface lattice,
so this is referred to as a “single-atom alloy” (SAA) (32). The Pt atoms were added into Cu(111)
terraces and in the areas above the surface edges by place exchange (Figure 3a,b). STM imaging can
allow visualization of the atomic-scale structure of surfaces around single atoms during reactions. It
helps in the examination of reaction mechanisms and single-atom sintering (33). Lucci et al. (31)
studied the ability of Pd monomers (Pd coverage ≤ 0.05 monolayer) to exist as isolated atoms
substituted into the Au lattice (34–36). At Pd coverage greater than 0.05 monolayer, Pd atoms start to
form clusters due to kinetic limitations (37) on a Au(111) surface for H2 activation (38). Here STM
was utilized to visualize the atomic composition of the active sites directly. The result clearly is shown,
withthehelpofcouplinghigh-resolutionSTMandtemperature-programmeddesorption,thatatlow
concentration the individual and isolated Pd atoms dissociate H2, as the absorbed concentration of
H atoms was proportional to the surface Pd atoms in Au. Liu et al. (39) using STM investigated the
atomic-scale interactions of CO and H with Pt catalytic sites on Pt-Cu(111) SAA surfaces (Figure
3c–e) and suggested that the selective adsorption of CO took place on Pt sites and that H atoms were
capable of diffusing into Cu sites.
STM is a surface-science technique. STM analysis can have a lateral resolution of 0.1 nm and
depth resolution of 0.01 nm (10 pm) (25). STM can do characterization of catalysts with a uniform,
flat structure. It can investigate both geometric and electronic structures and helps in the
identification of elements with close atomic numbers (40). For example, N-doped carbon materials,
which are one of the typical metal-free catalysts, to make N atoms visible in them, are important
55
Sudarsanam and Singh; Advanced Heterogeneous Catalysts Volume 1: Applications at the Nano-Scale
ACS Symposium Series; American Chemical Society: Washington, DC, 2020.
for the identification of active sites. Deng et al. (41) used low-temperature STM to examine the N-
doped graphene at the atomic scale. The area brighter than the main 2-D graphene network (Figure
4a) indicated the presence of defects and that the electronic structure of N-doped graphene was
disturbed by N-dopants. The sizes of the bright areas were smaller than 0.5 nm. DFT calculations
were performed to gain further insight into the doping effect on the structure of graphene. So via
STM simulations (Figure 4b), the bright spots were found to be C atoms adjacent to N, and the C
atoms exhibited higher brightness because of the increased electron density of states near the Fermi
level (42). Zhao et al. (43) also reported a low-temperature STM investigation of N-doped graphene
derived by chemical vapor deposition. It showed a local structure of one N atom as a bright triangular
spot confined in the graphene lattice (Figure 4c), confirmed by their STM simulations (Figure 4d).
STM has proven to be an important spectroscopy technique to explore the surface science and
imagingsurfacesattheatomiclevel.Throughthistechnique,individualatomswithinmaterialscanbe
imaged, visualizing the atomic composition of the active site, manipulated by changing the working
conditions, such as ultrahigh vacuum, air, water, and various other liquids and gases (44).
Figure 3. (A) STM image of Pt/Cu(111) SAA surface in which Pt atoms appear as isolated protrusions
substituted into Cu. (B) STM image showing H atom spillover onto Cu; H appears as clusters. Pt appears
as protrusions, and (C–E) STM shows adsorption of H and CO on Pt-Cu(111) SAA surface. (A,B)
Adapted with permission from ref. (31). Copyright 2015 Nature Publishing Group. (C–E) Adapted with
permission from ref. (39). Copyright 2016 American Chemical Society.
Scanning Electron Microscopy with Energy-Dispersive X-ray Spectroscopy
Scanning electron microscopy along with energy-dispersive X-ray spectrometry (SEM-EDX)
helps in investigating the morphology and dispersion of nanoparticles (NPs) on a surface, accurately
measuring the lateral dimensions of NPs, and studying their elemental composition (45). SEM
helps in the analysis of the morphology and topography and provides information about the
crystallographic nature of the analyzed specimens (46). Tang et al. (47) investigated the use of
a Pd/CeO2 nanocatalyst for the development and optimization of a novel solid-phase activation
56
Sudarsanam and Singh; Advanced Heterogeneous Catalysts Volume 1: Applications at the Nano-Scale
ACS Symposium Series; American Chemical Society: Washington, DC, 2020.
method for lignite-derived humic acid. The morphology and elemental composition of the NPs
were analyzed by SEM-EDX. The SEM-EDX of CeO2 and Pd/CeO2 are shown in Figure 5i.a–d.
The EDX spectra from the synthesized CeO2 show Ce and O, indicating the high purity of the as-
synthesized samples. After the addition of Pd, then Pd, O, and Ce were observed (Figure 5i.b,d). The
EDX spectra confirmed that the Pd NPs were highly dispersed on the surface of the CeO2 support,
which corresponded with the result obtained from the HR-TEM image. Han et al. (48) synthesized
MgF2 fibers and subnano MgF2 embedded in carbon nanofibers by one-step electrospinning. For
the morphology investigation, an SEM at an accelerating voltage of 15 kV equipped with EDX was
used. The elemental mapping analysis revealed the composition of the fibers, namely C, F, and Mg.
Trace amounts of impurity, oxygen, and copper were detected. The atomic contents of C, O, F, and
Mg were determined to be 78.6%, 1.5%, 12.2%, and 7.8%, respectively. From the mapping analysis,
it is noticeable that MgF2 is uniformly distributed in the carbon structure. SEM images show that
the fibers obtained are straight, smooth, and clear (Figure 5ii.a,b,d,e,g,h). The average diameter of
the fibers was 171 nm (Figure 5ii.c), which decreases to 148 nm after calcinating at 650 °C in N2
(Figure 5ii.f), keeping the morphology almost unchanged. The structure of the fiber is also preserved
on calcination in air at 650 °C (Figure 5ii.g,h). Lastly, MgF2 is fabricated with a decrease in diameter
from 171 nm to 106 nm (Figure 5ii.i).
Figure 4. (a) STM image of N-doped graphene. (b) Simulated image of (a). (c) STM image of N-doped
graphene (derived by chemical vapor deposition). (d) Simulated image of (c). (a, b) Adapted with
permission from ref. (41). Copyright 2011 American Chemical Society. (c, d) Adapted with permission
from ref. (43). Copyright 2011 American Association for the Advancement of Science.
Klaysri et al. (49) studied the synthesis of N-doped and Si-doped TiO2 nanocatalyst powdered
and grafted onto a poly(methyl methacrylate) film. SEM-EDX was used to investigate the
morphology and the elemental composition of particles grafted onto the film. The SEM image
showed that the grafting process successfully grafted the TiO2 particle onto the film. The EDX
estimated the bulk composition on the poly(methyl methacrylate) film, and the SEM images
corresponded with the EDX result. Pascariu et al. (50) prepared Ni/Co codoped ZnO NPs via
the coprecipitation method. SEM-EDX was used to analyze their structural and morphological
57
Sudarsanam and Singh; Advanced Heterogeneous Catalysts Volume 1: Applications at the Nano-Scale
ACS Symposium Series; American Chemical Society: Washington, DC, 2020.
properties. SEM was carried out in a high vacuum at a suitable acceleration voltage, and the elemental
mapping was collected at magnification ×10,000 with a large acquisition time (more than 80,000
counts). In the SEM images, it was observed that the doped ZnO nanoparticles are rod-like, and
the concentration of dopants moderately influenced their size, morphology, and aggregation degree
(Figure 6a–d). A lower concentration of dopants leads to smaller nanorods, and as the concentration
increases, the nanorods become more homogeneous in shape and size and agglomerate less. EDX
was used for a composition characterization of Ni/Co codoped ZnO nanoparticles, and the chemical
mapping showed the doping homogeneity of Zn, O, Ni, and Co. Blass et al. (51) synthesized
lanthanide (Ln = La, Eu, Gd, Dy, and Ho) loaded ZnO catalysts (Ln-ZnO) and characterized them.
SEM-EDX micrographs and elemental mapping analysis were used to investigate the morphologies
of 0.25 M ZnO and 1% Ln-ZnO catalyst. In 0.25 M ZnO, the NPs were spherical, and EDX analysis
detected Zn and O. However, the addition of Ln ions changed the structure. It was observed that
the NPs accumulated in certain regions with smaller grain sizes, which were interpreted as available
adsorption sites. The EDX analysis showed La, Eu, Gd, Dy, and Ho in addition to Zn and O. The
combination of SEM imaging and elemental analysis by EDS spectroscopy has been widely used for
the characterization of nanocatalysts.
Figure 5. (i) SEM-EDX of CeO2 and Pd/CeO2 catalyst: (a) SEM image CeO2 catalyst. (b) EDX
spectrum of square portion of (a). (c) SEM image of Pd/CeO2 catalyst. (d) EDX spectrum of square
portion of (c). Reproduced with permission from ref. (47). Copyright 2017 American Chemical Society.
(ii) SEM images of nanofibers (a,b,d,e,g,h), and diameter distributions of fibers (c,f,i). Reproduced with
permission from ref. (48). Copyright 2017 Royal Society of Chemistry.
Energy Dispersive X-ray Spectroscopy
Energy dispersive X-ray spectroscopy plays a vital role in the qualitative and quantitative
elemental analysis of NPs, and it helps in determining their composition and confirming the
stoichiometry (52, 53). Characteristics of the elements are represented by the X-rays emitted from
the atoms, and their intensity distribution represents the thickness-projected atom densities in the
specimen (54). Nadjia et al. (53) synthesized CeO2 NPs in an alkaline medium by using the
homogeneous precipitation method and later calcinated the same at 80 °C for 24 h (CeO2-80) and
500 °C for 2 h (CeO2-500). Here the EDX technique was used to confirm the stoichiometry of CeO2
NPs, carried out at 20 kV. The EDX technique was used to investigate the atomic concentration of
Ce and O on the top layer surface of CeO2-500 (Figure 7a). The atomic abundances of Ce and O
present on the uppermost surface and in the bulk layers of CeO2-500 were compared, and the data
58
Sudarsanam and Singh; Advanced Heterogeneous Catalysts Volume 1: Applications at the Nano-Scale
ACS Symposium Series; American Chemical Society: Washington, DC, 2020.
revealed that the surface O/Ce ratio (2.13) was close to the bulk O/Ce ratio (2.00), suggesting that
the samples have an intrinsic effect that would affect their photocatalytic activity.
Figure 6. SEM-EDX characterization, elemental mapping, and spectrum of Ni/Co doped ZnO
nanoparticles with different concentrations of dopant. Reproduced with permission from ref. (50).
Copyright 2019 Elsevier.
Mahajan et al. (55) prepared Pd NPs with a varying diameter (6.9–25.1 nm) in the presence
of poly(vinyl alcohol) by a single-pot wet chemical technique, followed by adsorption on Ni foil.
The investigation of the morphology and surface characteristics of the Pd nanocatalyst was done by
electron microscopy in conjunction with energy dispersion spectroscopy. The EDX study analyzed
the surface composition of each electrode. As shown in Figure 7b, the atomic ratio of C:O for
all electrodes was around 2:1, indicating the coexistence of poly(vinyl alcohol) with NPs of metal
adsorbed on the surface of Ni. From the data computed based on the EDX data (Figure 7c), it
was revealed that with an increase in particle diameter, the moles of Pd adsorbed per unit area
increases initially, and it decreases quickly when the average diameter reaches 21.3 nm because of less
interaction with poly(vinyl alcohol) and the Ni surface.
Ganeev et al. (56) presented the results of systematic studies of the nonlinear optical properties
of BaTiO3 and SrTiO3 nanoparticles and studied their structural characteristics. By using EDX
spectroscopy, they did the elemental analysis of the NPs and confirmed the presence of BaTiO3 and
SrTiO3. Rahman et al. (57) synthesized a magnetically separable spinel CuFe2O4 nanocatalyst by the
coprecipitation method and characterized it. The EDX spectra of the spinel CuFe2O4 nanoparticle
confirmed the presence of copper, iron, and oxygen with an oxygen:copper ratio of approximately
2:1 (Figure 8a). Similarly, Khazaei et al. (58) reported a green, solvent-free synthesis of
polyhydroquinoline using a nano-CoAl2O4 catalyst. Here also EDX was used for elemental analysis
59
Sudarsanam and Singh; Advanced Heterogeneous Catalysts Volume 1: Applications at the Nano-Scale
ACS Symposium Series; American Chemical Society: Washington, DC, 2020.
of nano-CoAl2O4, and the spectrum indicated the existence of cobalt, aluminum, and oxygen
(Figure 8b). Valan et al. (59) synthesized spinel MnxCo1-xAl2O4 (x = 0, 0.3, 0.5) nanoparticles
using the Sesamum indicum plant extracted by the microwave-assisted combustion method. EDX
was used for the elemental composition analysis; the spectra showed the peaks of Mn, Co, Al,
and O in the spinels CoAl2O4 and Mn0.5Co0.5Al2O4, and there is no other peak, confirming that
the synthesized NPs are pure. In the spectrum of both samples, a small peak appeared at 2.1 kV,
indicating the presence of Au (gold), which appeared because gold was used as a sputter coating while
preparing the samples for high-resolution SEM imaging. Mainly EDX is used for elemental analysis
of nanocatalysts.
Figure 7. (a) EDX spectrum of CeO2-500 nanocatalyst. Reproduced with permission from ref. (53).
Copyright 2018 Elsevier. (b) Table showing element atomic ratios of C:O. (c) Table showing the computed
data based on EDX data. (b, c) Reproduced with permission from ref. (55). Copyright 2017 Elsevier.
Figure 8. (a) SEM-EDX of CuFe2O4. Reproduced with permission from ref. (57). Copyright 2020
Springer. (b) EDX spectrum of the nano‐CoAl2O4. Reproduced with permission from ref. (58). Copyright
2017 Wiley.
Tip-Enhanced Raman Spectroscopy
Tip-enhanced Raman spectroscopy (TERS) is an optical imaging tool that can characterize
nanomaterials through a plasmonic-nanocavity-generated confined electromagnetic field with
interaction length on the order of subnanometers (60). This method can provide chemical sensitivity
60
Sudarsanam and Singh; Advanced Heterogeneous Catalysts Volume 1: Applications at the Nano-Scale
ACS Symposium Series; American Chemical Society: Washington, DC, 2020.
and an impressive spatial subnanometer resolution when used in combination with STM images
(61). The combined advantages of Raman spectroscopy and scanning probe microscopy make TERS
a powerful tool for analysis, providing high sensitivity and resolution for local investigation and
imaging of materials such as 2-D monolayers, as shown in Figure 9 (62). Additionally, important
chemical information can also be inferred because low-temperature TERS has a high spatial
resolution with single-molecule sensitivity.
Figure 9. Benefits of TERS in a Venn diagram and scheme representing the TERS for imaging monolayers.
Reproduced with permission from ref. (62). Copyright 2019 Springer.
Liu et al. (63) used tip-enhanced resonance Raman spectroscopy along with scanning tunneling
spectroscopy to study epitaxially grown ZnO layers on a Ag(111) surface. Balois et al. (64) used
a combination of TERS-based imaging and analysis to establish strain variations in defect-free
monolayer graphene on a Au(111) substrate. As shown in Figure 10, TERS-based Raman spectra
were recorded for graphene and bare Au(111). Three peaks (D, G, and 2D) are observed in Figure
10b from the TERS imaging observed upon averaging in three different domains. The authors report
the disappearance of these peaks when the tip is far-field or retracted and thus can confirm the
enhanced Raman signals. Additionally, intensity, Raman shift, and spectral width were also
measured for all of the bands observed, which is essential as any change in chemical and mechanical
interactions can be observed in the spectral lines (65). The line scan in Figure 10c shows 0.7 nm
spatial resolution (64).
61
Sudarsanam and Singh; Advanced Heterogeneous Catalysts Volume 1: Applications at the Nano-Scale
ACS Symposium Series; American Chemical Society: Washington, DC, 2020.
Figure 10. (a) TERS on graphene (red), Au(111) substrate, and far-field Raman (tip retracted); (b)
average TERS; (c) line profile of step response; and (d) long-exposure measurement of far-field Raman.
Reproduced with permission from ref. (64). Copyright 2019 Nature Publishing Group.
Ichimura et al. (65) performed a one-dimensional scan of SWCNTs to probe the extent of spatial
resolution using TERS. Additionally, they also studied the mechanical and chemical interactions
in nanocrystal adenine with a precise tip–sample distance. Figure 11 represents a schematic that
Ichimura et al. used for analyzing with high precision by illuminating for a chosen tip–sample
distance.Thetiposcillatessinusoidally,synchronizingwiththeopeningofthetimegate,asillustrated
in Figure 11b (66). The temporal width (∆) and the time delay (τ) of the time gate are selected in
accordance with the desired tip–sample distance. This is accomplished by feeding a trigger signal to
the pulse generator extracted from the tip oscillation. This results in the synchronous generation of a
pulse signal that controls an optical shutter via a modulator, which in turn performs the illumination
depending on the tip–sample distance. Zhang et al. (67) used a high-quality and clean tip and sample
under ultrahigh vacuum and low temperature for excellent reproducibility. They showed that the
tip, when positioned on the bare surface, gives a featureless continuum spectrum, indicating that
no molecules are present and the tip is free of contamination. However, on top of island molecules,
vibrational fingerprints of molecules were visible in the TERS spectrum. These vibrational
fingerprints are provided via STM-controlled TERS while employing an excitation field, which can
be observed in the spectrum even under low bias voltage, and thus it can be inferred that the localized
tunneling of electrons does not affect the TERS spectrum signals (67, 68).
Consequently, numerous factors contribute to achieving a subnanometer resolution in TERS,
such as nanofeatures on the substrate, step size of the mapping, thermal diffusion of the molecule,
incident laser angle, and polarization. Additionally, an ultrahigh vacuum and low-temperature setup
help to provide resolution down to subnanometers (69). Thus, it can be concluded that TERS
is a powerful and versatile technique that incorporates and combines the advantageous features
of various other techniques including SERS, Raman, and scanning probe microscopy. This
62
Sudarsanam and Singh; Advanced Heterogeneous Catalysts Volume 1: Applications at the Nano-Scale
ACS Symposium Series; American Chemical Society: Washington, DC, 2020.
amalgamation makes TERS a tool that is highly selective and sensitive with a high spatial resolution
for characterization.
Figure 11. (a) Tip–sample arrangement illuminated for predecided distance. (b) Illustration representing
sinusoidal oscillation of the tip and synchronized opening of the time gate. (c) TERS using tapping mode
and acoustic–optic modulator for time-gated illumination. Reproduced with permission from ref. (65).
Copyright 2009 American Physical Society.
X-ray Reflectometry
X-ray reflectometry is a form of nondestructive characterization where X-rays are directed at
varying angles and a photodiode detects the reflected radiation. X-ray reflectometry is a general tool
for characterization of multilayers with angle-resolved XRF and can be suitably used to characterize
multilayers with subnanometer thickness (70). Subnanomaterials used in multilayer interferential
mirrors hold special importance as they are used for applications relating to plasma diagnostics,
extreme ultraviolet (EUV) photolithography, and solar corona imaging, which uses the X-ray and
EUV spectrum. In order to smooth interfaces and limit the interdiffusion, subnanometer-thick
barrier layers are used in the EUV spectral region. Applications include hard X-ray telescopes (71),
normal incidence broadband coatings (72), and grazing incidence mirrors (73). The grazing
incidence X-ray reflectometer (GIXRF) shown in Figure 12 uses a shallow incidence angle for the
primary X-ray radiation and can be used to define the thickness of subnanometer materials in a
periodic structure. There is an enhancement of excitation due to X-ray standing wave formation,
for which the essential requirement is the use of a low-divergence monochromatic primary beam
generated by an X-ray tube or a synchrotron facility (74, 75).
TheincidentandreflectedX-raybeamsinterfereatthelayerboundaries,leadingtotheformation
of constructive and destructive nodes (76). GIXRF measures below the total angle of reflection and
then surpasses it (77). In this technique, the sample is tilted at a defined angle with respect to the
beam, with the detector placed above it. The detector, usually a silicon drift detector, is energy-
dispersive. Emprin et al. (78) used a “Fabry–Perot” type structure to determine the thickness of
63
Sudarsanam and Singh; Advanced Heterogeneous Catalysts Volume 1: Applications at the Nano-Scale
ACS Symposium Series; American Chemical Society: Washington, DC, 2020.
subnanometers embedded between similar periodic multilayers. They used periodic chromium/
scandium layers with a Sc layer between with highly precise control for the study.
Figure 12. Schematic diagram showing the geometry of GIXRF.
Figure 13. Fabry–Perot type multilayer with Sc calibration layer positioned between two periodic
multilayers ML1 and ML2. Reproduced with permission from ref. (78). Copyright 2014 Elsevier.
The Fabry–Perot structure is as given in Figure 13, with the calibrating layer (LC), which is
Sc, between multilayers ML1 and ML2. The acquisition and extinction of the Bragg peak is highly
sensitive and dependent on the thickness of the layers, that is, dLC and dSC, and are synchronous to
the phase of the waves reflected from ML2 and ML1. Haase et al. (79) used various characterization
techniques such as EUV and X-ray reflectance to study Cr/Sc multilayer systems, which are useful as
near-incidence mirrors. They were able to deduce that the individual layer was less than 1 nm. The
GIXRF analysis uses fluorescence data with photons having an excitation energy of 6.25 keV. Using
GIXRF, they successfully resolved the interdiffusion layer thickness, the Sc/Cr ratio, and the spatial
arrangement of the multilayer structure.
X-ray Absorption Spectroscopy
X-ray absorption spectroscopic (XAS) analysis enables the element-specific atomic site analysis
of the local structure and electronic characterization of metal nanoclusters. The XAS involves
64
Sudarsanam and Singh; Advanced Heterogeneous Catalysts Volume 1: Applications at the Nano-Scale
ACS Symposium Series; American Chemical Society: Washington, DC, 2020.
electronic transitions from core levels to the unoccupied valence states from the X-ray absorption
process.
Figure 14. (a) XAS spectrum consisting of both EXAFS and XANES with κ-space EXAFS spectrum on the
inset. (b) L3-edge XANES spectra of a few 5d transition metals. (c) EXAFS spectrum with the best fit of Pd
foil along with structure model. (d) Illustration demonstrating the simulated EXAFS with increasing
coordination number. Reproduced with permission from ref. (80). Copyright 1992 American Chemical
Society.
A typical XAS spectrum is determined by two spectral regions: X-ray absorption near-edge
structure (XANES) and extended X-ray absorption fine structure (EXAFS; Figure 14a). XANES
provides the element-specific analysis by probing the electronic properties of absorbing atoms in the
near-edge region. For instance, the intensity of the first spectral feature (Figure 14b) is sensitive to
the unoccupied valence d state. By monitoring the intensity, holes in the d state can be ascertained.
Accurate information on the local structure of absorbing atoms, for example, bond length and
coordination number (Figure 14c,d), can be acquired by EXAFS (81).
MacDonald et al. (82) conducted the first XAS study on truly monodispersed thiolate-protected
Au144 nanoclusters (Au SR NCs). The structural information acquired by an EXAFS fitting analysis
(Figure 15b) was consistent with the structural model determined by DFT given by Lopez and
Acevedo (Figure 15a). A comparative study illustrating the electronic and bonding properties of
Au144, Au38, and Au25 was done using Au L3-edge (Figure 15d) and S K-edge (Figure 15e) XANES
(80).
Later, MacDonald and coworkers (83, 84) also reported an EXAFS study for Au38 SR NCs
(structural model shown in Figure 16a) in solid and toluene solution (Figure 16b). The solvation
65
Sudarsanam and Singh; Advanced Heterogeneous Catalysts Volume 1: Applications at the Nano-Scale
ACS Symposium Series; American Chemical Society: Washington, DC, 2020.
process of Au38 NCs resulted in the expansion of Au–Au bonds, sensitively probed by an EXAFS
fitting analysis (80).
Figure 15. (a) DFT-predicted structural model and (b) experimental and best-fit EXAFS of Au144. (c)
DFT structural model simulated site-specific EXAFS. (d) Au L3-edge and (e) S K-edge XANES of Au144.
Reproduced with permission from ref. (82). Copyright 2010 American Chemical Society.
Figure 16. Structural model (a) and EXAFS (b) of Au38 in solid and solution phases. Adapted with
permission from ref. (83). Copyright 2011 American Chemical Society.
They also conducted a multishell EXAFS fitting strategy on Au25 SR NCs (Figure 17a) to
monitor their structural change in different temperatures and solvent conditions. The site-specific
simulation spectrum (Figure 17b) showed distinct EXAFS peaks corresponding to unique scattering
paths, including Au-S and three Au-Au paths. EXAFS fitting results of the Au–thiolate cluster (Au
SR NCs) in solution phase samples (toluene and acetonitrile as solvents) and solid phase at different
temperatures (10 vs. 300 K) are compared in Figure 17c. It shows a general decrease in the bond
length of the Au13 core [i.e., (Au–Au)1 and (Au–Au)2] with an accompanying increase in the
Au(kernel)–Au(staple) [(Au–Au)3] bond length when solvated in toluene. When the Au SR NCs
were solvated in polar solvent acetonitrile, further shrinkage of the Au13 core was noticed, with no
effect on (Au–Au)3 relative to that of the solid phase. Overall, the structural changes in Au25 NCs
66
Sudarsanam and Singh; Advanced Heterogeneous Catalysts Volume 1: Applications at the Nano-Scale
ACS Symposium Series; American Chemical Society: Washington, DC, 2020.
illustrated the interplay of the “metallic” behavior of the Au13 core and the “molecular” behavior of
the gold–thiolate ligand shell.
Figure 17. Structural model (a) and simulated EXAFS (b) of Au25. (c) Bond distance fitting obtained from
EXAFS of Au25 under various environments. Adapted with permission from ref. (84). Copyright 2011
American Chemical Society.
Christensen et al. (85) used XAS to probe structure and bonding and Pt position in a thiolate-
protected PtAu24(SR)18 nanocluster. The three possible locations of Pt dopant corresponded to
different Pt-Au coordination number shown in Figure 18B–D. Au L3-edge EXAFS showed a
narrowing line-shaped Au 4f peak of PtAu24 due to metal–metal bond contraction resulting from the
Pt doping effect. It was also observed that the Au 4f peak shifted to lower binding energy, which could
be related to the Pt-Au alloy bonding effect, as shown in Figure 18F.
The XAS study by Chevrier and coworkers (86, 87) compared the structural and electronic
property sensitivity with a small change in core size (C13 vs. C19) in gold–thiolate nanoclusters,
Au19(SR)13 and Au25(SR)18, respectively (the structural model is shown in Figure 19a). Au19(SR)13
showed a different valence electron behavior with a narrowed and positively shifted band, illustrating
themoremetallicnaturerelativetoAu25(SR)18,asshowninFigure19b.Further,amultishellEXAFS
fit (Figure 19c) was conducted for a detailed correlation of electronic properties with atomic
structure. The results revealed a considerable Au–Au bond expansion of surface–surface and the
surface-stable Au atoms. In contrast, the bond distance between Au-S and center-surface (Au–Au)
remains unchanged.
Zhang et al. (88) demonstrated that encapsulation within carbon nanotubes facilitates the
oxidation activity of Pt NCs. In situ XANES revealed that encapsulation restricted the Pt NC size
to 1 nm and rewardingly enabled the retention of Pt species at an active reduced state, protected
from oxygen up to 200 °C. The XANES spectrum of Pt/CNT and the reduced Pt@CNT catalyst
exhibited features similar to that of Pt foil. The radial structural function comparison curves derived
from the EXAFS function’s Fourier transform also suggested the Pt−Pt interaction and absence of
Pt−O interaction. This confirmed the prior reduction of Pt clusters in both Pt@CNT and Pt/CNT.
The Pt LIII-edge of Pt/CNT and the situ radial structural function revealed the appearance of the
67
Sudarsanam and Singh; Advanced Heterogeneous Catalysts Volume 1: Applications at the Nano-Scale
ACS Symposium Series; American Chemical Society: Washington, DC, 2020.
Pt−O scattering paths during toluene oxidation, which become more prominent on increasing the
temperature.
Figure 18. (A)–(D) Representations of structural models and CN values of Au25 and Au24Pt with varying
dopant location. (E) Pt L3-edge EXAFS and its best fit of Au24Pt. (F) Au L3-edge EXAFS of Au25 and
Au24Pt. Reproduced with permission from ref. (85). Copyright 2012 American Chemical Society.
Meanwhile, the white-line intensity was enhanced, which reflected the 5d states’ unoccupancy
and indicated the oxidation state variation. This confirmed the oxidation of Pt species over the CNT
exterior walls. In contrast, the Pt−O scattering was not observed for Pt@CNTs even in oxygen up to
200 °C with no variation of the white-line intensity.
Yamazoe et al. (89) used Au L3-edge EXAFS spectroscopy and corresponding FT-EXAFS
spectra to investigate the bond stiffness and hierarchy in thiolate-protected gold clusters (Au SR
NCs), namely Au25(SR)18, Au38(SR)24, and Au144(SR)60. The long Au–Au bonds of the
icosahedron-based Au core surface were found to be flexible relative to the bulk metal, whereas the
short Au–Au bonds distributed in the radial direction of the Au core were stiffer than those in the
bulk metal and formed a ring structural backbone with the rigid Au-SR oligomeric framework that
enhances Au-Sr NC thermal stability. The temperature dependence of the Debye–Waller factors
of the individual bonds was analyzed within the Einstein model framework. It showed that the
Einstein temperatures of the Au–Au(S) and Au–Au(L) bonds and that of Au–Au bonds in bulk
Au were a function of cluster size. This plot indicated that Au–Au(S) and Au–Au(L) bonds were
respectively stiffer and more flexible than the cubic bulk Au–Au bonds. The correlation suggested
that the bond stiffness and bond length are correlated. This hypothesis was confirmed by plotting
Einstein temperatures of Au–Au bonds as a function of their lengths.
XAS analysis is used to probe materials and determines quantitative information for the local
physical structure, shape, and electronic properties in supported metal nanostructures and bimetallic
nanosystems. XAS spectroscopy provides insight into changes that occur in the local bonding
68
Sudarsanam and Singh; Advanced Heterogeneous Catalysts Volume 1: Applications at the Nano-Scale
ACS Symposium Series; American Chemical Society: Washington, DC, 2020.
environment by measuring accurately the bond distance. This helps in tailoring the structural
properties of the metal nanoclusters with a change in the chemical environment.
Figure 19. (a) Illustration representing structural models. (b) XPS valence band data of Au19 and Au25. (c)
EXAFS and best fit. (d) Graph showing comparison of bond distance from the EXAFS fitting results of
Au19 (stripes) and Au25 (red). Reproduced with permission from ref. (86). Copyright 2012 American
Chemical Society.
Infrared and Associated Spectroscopy Techniques
Direct monitoring of the probe/adsorbed molecules interacting with the surface of supports
such as metal catalysts is vital in the characterization of the metal catalyst (90). Infrared spectroscopy
and its subsidiaries, in combination with investigative techniques, are powerful tools that provide
a description of catalyst surface properties by monitoring the probe–surface interaction (91). This
is an indirect method whereby the study of the surface is observed through the perturbation in the
probe. The change in intensity of the probe and the vibrational frequency are monitored to infer the
properties of the active centers (92).
Techniques such as time- and temperature-resolved Fourier transform infrared spectroscopy
can be used to monitor and study intermediate species formed in the reaction (93). The oxidation
state and dispersion state of single-atom catalysts (SACs) are generally monitored by a gas like CO,
whereby the initial state frequencies of CO change when it is bound to the SAC (94). As the vibration
modes are highly sensitive to the adsorbed CO species, it effectively traces the reaction pathways on
reactionscatalyzedbyCO.Itimperviouslyprovesthepresenceofsingle-sitecatalysts,eliminatingthe
presence of nanoparticles (95). Thus, the IR technique can be successfully implemented for probing
the electronic and structural states of the catalyst where CO adsorption on different metals leads to
different vibration bands, which in turn affect the adsorption models and the electronic states in the
IR spectra (96). For example, Yan et al. (96) found different adsorption bands depending on the
adsorption model. Linear and bridge are observed; for example, ionic Pt, metallic Pt, and Pt clusters
69
Sudarsanam and Singh; Advanced Heterogeneous Catalysts Volume 1: Applications at the Nano-Scale
ACS Symposium Series; American Chemical Society: Washington, DC, 2020.
indicated different bands based on the absorption spectra. Thus, SACs having high dispersion
indicated a strong signal for adsorption by ionic metals.
Figure 20. Fourier transform infrared spectra of H2 adsorbed on (Na, K)-ETS (a) showing the effect of
contact time (dashed line, immediately after dosage; bold line, after 10 h contact at 20 K; gray line,
intermediate contact). (b) Effect of H2 equilibrium pressure at 20 K (bold line, maximum coverage; gray
curves, reducing gas pressure; dashed curve, maximum intensity of 1:1 adduct). Reproduced with
permission from ref. (97) and ref. (98). Copyright 2007 Royal Society of Chemistry.
Ricchiardi et al. (97) reported adsorption of H2 on preactivated (Na, K)-ETS-10 at 623 K
for 1 h, a self-supporting thin wafer having the chemical formula Na1.45K0.55TiSi5O13 (Engelhard
Corp., Iselin). The IR spectra in Figure 20a show the time evolution of dihydrogen spectra at 20 K;
three intense bands appear immediately after the H2 dosage (dashed curve). However, the intensity
decreases (gray curve), showing the formation of a triplet shifted upward with time, which is
completed at 10 h (solid black curve). They conclude that dihydrogen adducts are responsible for the
first triplet and after transformation for the second triplet of bands (98). The spectra change showing
new features with the equilibrium pressure change of dihydrogen is depicted in Figure 20b (97)..
Furthermore, they also studied CO adsorbed on extended surfaces and isolated surface sites. Figure
21a shows the coverage-dependent IR spectra of CO on different extended oxide and halide surfaces
such as ZnO, α-Cr2O3, MgCr2O4, LaCr2O3, titania, and CuCl. A coverage-dependent parameter
(θ)definesthecomplexcoveragefromlowesttohighest,accountingforanygeometricalhindranceor
lateral interaction of adsorbates resulting in shifting. For example, Zecchina et al. (98) used Degussa
P25, characterized by an extremely narrow bandwidth with full width at half-maximum <1.5 cm-
1, suggesting the formation of Ti4+…CO on uniform surface planes. The surface is dominated by
70
Sudarsanam and Singh; Advanced Heterogeneous Catalysts Volume 1: Applications at the Nano-Scale
ACS Symposium Series; American Chemical Society: Washington, DC, 2020.
electrostatic charges, which can be inferred from the shifts and dynamic polarizability. Ding et al.
(99) also used IR spectroscopy to distinguish and quantify Pt single atoms from Pt nanoparticles.
Figure 21. (a) Spectrum representing DRIFT of a saturated layer of CO adsorbed on 4%Rh/TiO2 at 300
K along with the vibrational modes denoted by the ball and stick model. (b) CO DRIFT spectra on 0.5%,
2%, 3%, 4%, and 6% loadings of Rh/TiO2 catalyst. (c) Percent site fraction of isolated and nanoparticle-
based Rh. Reproduced with permission from ref. (100). Copyright 2015 American Chemical Society.
Other techniques such as DRIFTS having site-specific extinction coefficients can be used to
quantify the fraction of metal atoms in a catalyst support from a mixture of metal atoms and
nanoparticles (92, 100, 101). Matsubu et al. (100) employed probe-molecule DRIFTS to quantify
the fraction of Rh dispersed to isolated sites and also on the surface of Rh nanoparticles on a TiO2
support (Figure 21).
Thus, adsorption IR spectra of molecules such as CO can be successfully utilized to determine
the electronic and structural states in various SACs. Additionally, good dispersibility of the metal
catalysts can also be evaluated using these techniques, the absorption bands of which are observed at
relatively higher wavenumbers.
X-ray Photoelectron Spectroscopy
X-ray photoelectron spectroscopy utilizes photoelectrons generated by X-ray irradiation
(primarily Mg Kα or Al Kα) for surface characterization to a depth of 2–5 nm. XPS provides the
elemental identification and composition by measuring electron energy on elastically scattered
electron emission (102). Chemical information, including surface chemistry studies, is derived from
typical binding energy peak shifts depending upon the chemical bonding of the elements.
Luo et al. (103) confirmed the presence of high contents of Au(I)-thiolate complexes in
luminescent Au NCs using XPS. The XPS spectra revealed that the Au oxidation state in luminescent
Au NCs resides between Au(I)-thiolate and larger Au(0) nanoparticles. The Au 4f on deconvolution
71
Sudarsanam and Singh; Advanced Heterogeneous Catalysts Volume 1: Applications at the Nano-Scale
ACS Symposium Series; American Chemical Society: Washington, DC, 2020.
gives binding energies of 84.3 and 83.7 eV, representing the components Au(I) and Au(0),
respectively. Du et al. (104) demonstrated that the electronic interaction between NCs and MoS2
plays a key role in the highest hydrogen evolution reaction (HER) activity of Au2Pd6/MoS2
compared to Pd3/MoS2 and Au2/MoS2. The Au2Pd6 NCs caused a large negative shift in the binding
energies of Mo 3d and S 2p in Au2Pd6/MoS2 than in Pd3/MoS2 compared to that of plain MoS2
nanosheets. This showed the influence of the synergistic effect of the bimetallic composition in
Au2Pd6/MoS2 leading to improved catalytic activity. Gao et al. (105) conducted XPS measurements
to examine chemical states and the effect of calcination on the prepared Pd clusters Pd6(C12H25S)12
symbolized by Pd6/AC‐V and Pd6/AC. The Pd 3d in Pd6/AC‐V displayed a more positive shift
in binding energy compared to Pd6/AC, which indicates the electron cloud density is lower in
Pd6/AC‐V than in Pd6/AC. This could be attributed to the direct contact between the metal cluster
and carbon support resulting in the thin carbon layers on the Pd surface after thiol ligand removal
in the Pd6/AC cluster. Zhao et al. (106) performed XPS analysis to verify successful Au25 loading
(with −SCH2CH2Ph as the ligand) onto MoS2 nanosheets and the electronic interaction role for
HER. After Au25/ MoS2 formation, the binding energy of Mo 3d undergoes a negative shift of ~0.4
eV compared to bare MoS2 with a positive shift in the binding energy of Au 5f. This suggested
the transfer of electron density from Au25 to MoS2, and the electronic interaction between NCs
and MoS2 was responsible for the enhanced HER activity in Au25/MoS2 composites. Recently, the
same group also performed XPS analysis to investigate the NCs and CoSe2 interfacial interaction in
enhancement of the oxygen evolution reaction (107). After the deposition of Au NCs onto the CoSe2
support, a negative shift of ~1 eV is observed in the binding energy of Co 2p (Figure 22a), indicating
the interfacial interaction between NCs and CoSe2. This interaction is also reflected in the positive
shift in the Raman peak of CoSe2 (Figure 22b).
Figure 22. (a) Co 2p high-resolution XPS spectra and (b) Raman spectra of CoSe2 and Au/CoSe2
composite. Reproduced with permission from ref. (107). Copyright 2017 American Chemical Society.
The synergistic interaction between NCs and the support favors the intermediate (OOH)
formation, resulting in facile desorption of oxygen molecules in the oxygen evolution reaction
process. Hang Li et al. (108) studied the oxidation state and dispersion of Pt species using XPS
analysis in PtO/TiO2 and Pt/TiO2 photocatalysts. For the PtO/TiO2 catalyst, the main peaks were
centered at binding energies of 72.4 and 75.8 eV, indicating the oxygen-bonded Pt 2p. The Pt/TiO2
photocatalyst showed peaks of Pt 4f7/2 and 4f5/2 at 70.9 and 74.3 eV, respectively, justifying the
72
Sudarsanam and Singh; Advanced Heterogeneous Catalysts Volume 1: Applications at the Nano-Scale
ACS Symposium Series; American Chemical Society: Washington, DC, 2020.
presence of metallic Pt. The Pt dispersion was evaluated on the basis of the XPS relative intensity
to Ti (IPt/ITi). The PtO/TiO2 showed a higher dispersion of Pt atoms, as demonstrated by their
higherIPt/ITi (0.021)values.Theseresultssuggestthatahighoxidationstateaswellashighdispersity
of Pt species in PtO/TiO2 could suppress the side reaction effectively. Gaur et al. (109) reported
that H2/He-treated Au38/TiO2 exhibited excellent catalytic activity, while the air-dried Au38/TiO2
catalyst under the same conditions showed no catalytic activity. To determine the reason, XPS
analysis was performed for both samples. For the reductively treated Au/TiO2 catalyst, Au 4f7/
2 peaks at 83.4 eV and 85.8 eV correspond to metallic Au(0) and Au(+1)–thiolate interaction,
respectively. The reductive sample also showed a lower energy shift, indicating the interaction of
Au atoms with an oxygen atom bonded to Ti on the surface. The XPS results showed that H2/He-
treated Au38/TiO2 removed most of the thiolate groups present, whereas the positive shift in the Au
4f peak in air-dried Au38/TiO2 was caused by the Au–SR bonding. It indicates that the thiol ligand
in air-dried Au38/TiO2 inhibited Au site contact with the CO molecule, suggesting the role of the
interfacial site in catalyzing the CO oxidation.
XPS is a quantitative, surface-sensitive analytical technique that provides elemental information
from core levels, and the chemical composition is derived from peak shifts in nanoclusters. The XPS
technique is also used to determine the chemical states of nanoclusters and to confirm the ligand
removal in the calcination process. XAS and XPS are collectively used to determine the catalyst’s
structural integrity in the reaction. There is a large scope for improved instrumentation in terms of
good energy resolution and variable X-ray energies. XPS is a highly surface-sensitive, quantitative
technique that has the potential to measure the elemental composition with high quantitative
precision and accuracy at the parts per thousand range. This is very crucial, especially for SAC
studies, as the characterization of the individual atoms on top of the support surface is a challenging
task. In conventional metal catalysts, the active sites are not well defined, so much refinement in
measurement is not required. The XPS technique gives indirect evidence for successful SAC
preparation by giving insight into the essential physicochemical properties of SACs. Using this
technique, chemical and electronic states of an element within an SAC material can be resolved.
NMR Spectroscopy
NMR spectroscopy gives information about the structure and chemical surroundings of
nanoclusters. It gives the scope to check the purity of the NCs. It helps in giving information about
the estimation of binding interactions between the ligands and the metal core (52).
Udayabhaskararao et al. (110) proposed the Ag thiolate structure from a cluster-based NMR
spectroscopic study. The 1-D and 2-D NMR investigation of Ag32SG19 (SG is thiolate glutathione)
showed spectral features that revealed it is dominated by the (SR-Ag-SR) structural motif.
The inner core and outer shell of the cluster with metal thiolate were explained from the detailed
analysis of NMR. 1H NMR data of clusters with chemical shifts of H3, H4, H2, H9, and H6 of
glutathionate were 2.17, 2.60, 3.81, 3.87, and 4.64 ppm, respectively. H7 signals were shifted
downfield (3.2–3.5 ppm) with broadening, followed by splitting denoted as [7,7] (Figure 23a).
The downfield shift was due to its proximity to the silver core. The 2-D NMR data showed one
pair of peaks labeled [7,7] in the ratio 1:1 at the seventh position for 2H, indicating an equivalent
environment. Homonuclear correlation spectroscopy and heteronuclear single quantum correlation
73
Sudarsanam and Singh; Advanced Heterogeneous Catalysts Volume 1: Applications at the Nano-Scale
ACS Symposium Series; American Chemical Society: Washington, DC, 2020.
were performed to find the cause of the splitting and the nature of the staple motif on the cluster
surface (Figure 23b,c).
Figure 23. (a) 1H NMR spectra of GSH, crude cluster, and aged crude; peaks inside the dotted box are due
to H7. Peaks marked * at 3.6 ppm are due to residual EtOH. (b) Homonuclear correlation spectrum; (c)
heteronuclear single quantum correlation spectrum. Reproduced with permission from ref. (110). Copyright
2013 Royal Society of Chemistry.
Zaluzhna et al. (111) explained the binding modes between S atoms in DMSA (meso-2,3-
dimercaptosuccinic acid) and the surface Ag7 using the 13C NMR spectrum. They took the 13C
solution NMR spectrum (Figure 24) of Ag7(DMSA)4 NCs with free DMSA in D2O. Here, 3-
trimethylsilyl-1-propane sulfonic acid sodium salt was taken as an internal reference. It is reported
(112) that the 13C NMR signal for carboxylate (–COO-) is difficult to observe due to the long spin-
lattice relaxation time. In the spectra (top in Figure 24), the C bond to S appeared at 47.8 ppm
in free DMSA (Figure 24). The peak disappeared once the DMSA was bound to AgNC, which is
a phenomenon often observed when binding takes place between ligand and metal because of the
intrinsic heterogeneity of the surface (113). The disappearance of the peak was suggested as sulfur
atoms of DMSA being bound to AgNCs and that DMSA forms a bidentate binding, because if it were
monodentate, one would have expected to see half of the signal at 47.8 ppm.
The nature of metal species and binding ligands during a catalytic reaction can be investigated
by solid-state magic-angle spinning NMR, generally performed in situ (114). This technique has
been used by Kwak et al. (115) to investigate the anchoring of Pt on alumina supports at low loading
levels. Here, the surfaces that were identified to serve as the anchoring sites for Pt single atoms were
74
Sudarsanam and Singh; Advanced Heterogeneous Catalysts Volume 1: Applications at the Nano-Scale
ACS Symposium Series; American Chemical Society: Washington, DC, 2020.
the unsaturated pentacoordinated Al3+ centers on the gamma-Al2O3 support. Corma et al. (116)
reported strong NMR signal enhancement due to parahydrogen-induced polarization, used to check
the presence of Au single atoms. Solid-state NMR (SS NMR) is used to investigate the behavior
of solid catalysts and chemical processes taking place at their surfaces (45). For example, 31P SS
NMR along with DFT calculations can provide information about the structure of heterogenized
species and the immobilization of homogeneous metal phosphine catalysts. Gutmann et al. (117) has
reported the important role of liquid and partly the SS NMR technique for the detection of surface
molecules and differentiated between different binding sites on nanoscale catalysts. Mallissery et al.
(118) reported the solid-state NMR of 31P used to characterize phosphinine- stabilized Au NPs and a
phosphinine–Au complex. Their spectra showed metal-bound, intact phosphine units and detected
several surface-bound species generated by chemical transformation of the initially supplied ligands.
Novio et al. (119) used SS NMR and Fourier transform infrared spectroscopy to characterize the
location and dynamics of CO coordinated to Ru NPs. Ru NPs (2 nm) were tested, prepared under
H2 atmosphere, and stabilized by a bidentate phosphine ligand. The results demonstrated that CO
groups were mobile on the surface of NPs, while the bulky ligand slowed down the fluxionality of CO
and prevented the exchange at certain positions.
Figure 24. 13C NMR spectra of free DMSA (top) and Ag7(DMSA)4 NCs (bottom) in D2O. Reproduced
with permission from ref. (111). Copyright 2011 Elsevier.
MALDI-TOF-MS and Electrospray Ionization Mass Spectrometry
MALDI-TOF-MS and electrospray ionization mass spectrometry (ESI-MS) are “soft”
ionization techniques as they induce minimal or no fragmentation (110). In MALDI-TOF-MS,
the matrix-assisted laser desorption/ionization (MALDI) is used as an ion source, and the mass
analyzer used is a time-of-flight (TOF) analyzer. Here, sample analytes are embedded in a solid
matrix material, and ionized gaseous ions are formed by laser pulse irradiation (120). ESI-MS
involves the conversion of solution-phase analytes into gas-phase ions by applying high voltage. Both
techniques involve the generation of [M + zH]z+ ions. Formation of singly charged species (z =
1) is common for MALDI, while ESI may produce multiple-charge ions (z ≫ 1), which extends
the mass analyzer range to kilodaltons to megadaltons (121). Generally, the ESI-MS technique is
recommended for larger nanoclusters because of its softer ionization mode.
75
Sudarsanam and Singh; Advanced Heterogeneous Catalysts Volume 1: Applications at the Nano-Scale
ACS Symposium Series; American Chemical Society: Washington, DC, 2020.
Qianetal.(122)confirmedthemolecularpurityandformulaofAu38(SC2H4Ph)24 nanoclusters
using MALDI-TOF-MS and ESI-MS. An intense peak at 10,780 Da is assigned to intact
Au38(SC2H4Ph)24 ions in the MALDI spectrum with a small fragmented peak at 9342 Da (Figure
25a). The ESI technique, being a softer ionization peak, generates unfragmented Au cluster mass
spectra with a sharp, intense peak at 10,910.69 Da (Figure 25b).
Figure 25. (a) Positive MALDI-TOF mass spectra of Au(SC2H4Ph)24 nanoclusters corresponding to
different laser intensities (decreasing from top to bottom). (b) ESI mass spectrum of Au(SC2H4Ph)24; inset
shows the zoomed-in spectrum. Reproduced with permission from ref. (122). Copyright 2009 American
Chemical Society.
Qian et al. (123) also determined the purity of Au333(SR)79 NCs using MALDI-TOF-MS and
ESI-MS techniques. MALDI-MS analysis was performed using trans-2-[3-(4-tert-butylphenyl)-2-
methyl-2-propenyldidene] malononitrile as a matrix. A broad peak at 75.3 kDa was observed in the
MALDI-TOF-MS spectrum (Figure 26). The exact molecular mass of NPs was determined by ESI-
MS analysis. Alkali acetate salt CsOAc was added to enhance nanoparticle ionization. The ESI-MS
spectrum showed two sets of NP ion peaks (Figure 27), out of which the 4p ion set is chosen to
precisely calculate its composition.
Figure 26. LDI and MALDI mass spectra of the Au nanoparticle. (A) and (C) show the spectra in the
10,000 to 370,000 range; (B) and (D) show the zoomed-in spectra. Reproduced with permission from ref.
(123). Copyright 2012 National Academy of Sciences.
The mass spectrum of electrolyzed samples (Figure 28) showed a Au cluster size range of 5–13,
with Au5 (1034 Da) being the most abundant peak in these clusters. Jeyabharathi et al. (124)
76
Sudarsanam and Singh; Advanced Heterogeneous Catalysts Volume 1: Applications at the Nano-Scale
ACS Symposium Series; American Chemical Society: Washington, DC, 2020.
synthesized CTAB-Au clusters via the electrodeposition method, and the core-size nanocluster range
is identified by MALDI-TOF mass spectrometry, as shown in Figure 29. Yang et al. (125) employed
MALDI-TOF-MS to confirm the actual structures of Ag NCs with a series of species with a number
of atoms (two to five). Gao and Chen (105) obtained the exact formula of Pd6 NCs via MALDI‐TOF
MS analysis, where the mass spectrum shows three peaks with an intense peak at m/z = 3347
assigned to [Pd6(C12H25S)12+2Na]+, as shown in Figure 30.
Figure 27. Wide-range ESI-MS spectrum of the nanoparticle; the inset shows the zoomed-in spectrum of
the 4p ion set centered at m∕z = 19,175.0. Reproduced with permission from ref. (123). Copyright 2012
National Academy of Sciences.
Figure 28. Au-cluster MALDI-TOF mass spectrum. Reproduced with permission from ref. (124).
Copyright 2010 Wiley-VCH.
Negishi et al. (126) demonstrated the use of redox reagents for stable Au25 NC formation with
various charge states. The prepared Au25(SC6H13)18 NCs exhibited a single [Au25(SC6H13)18]1-
peak in the negative ESI mass spectrum, while [Au25(SC6H13)18]1-(TOA+)2 is detected in the
positive ESI mass spectrum (Figure 31) with TOA+ as a counter ion. The [Au25(SC6H13)18]1+/1- ion
signals were not observed in any of the ESI mass spectra, indicating the neutral [Au25(SC6H13)18]0
77
Sudarsanam and Singh; Advanced Heterogeneous Catalysts Volume 1: Applications at the Nano-Scale
ACS Symposium Series; American Chemical Society: Washington, DC, 2020.
formation. As the reduction progresses, a shift in charge distribution of [Au25(SC6H13)18]x to
negative values was observed.
Figure 29. MALDI-TOF/TOF mass spectra of Ag NCs. Reproduced with permission from ref. (125).
Copyright 2014 Royal Society of Chemistry.
Figure 30. MALDI-TOF MS of Pd6(C12H25S)12. The inset shows a comparison of the experimental and
simulated patterns from the highest peak in the full spectrum. Reproduced with permission from ref. (105).
Copyright 2017 Royal Society of Chemistry.
Fu et al. (127) utilized ESI-MS analysis to monitor the reaction process of the Pd3Cl-catalyzed
Suzuki–Miyaura cross-coupling reaction. It was observed that the addition of bromobenzene to the
catalytic system caused the disappearance of the intermediate formed, [Pd3Ar(PPh2)2(PPh3)3]+ at
1553.11 Da, while a new peak corresponding to [Pd3Br(PPh2)2(PPh3)3]+ emerges at 1557.06 Da
(Figure 32d).
Thus, we can conclude that HR-MS is a highly sensitive, selective, and reliable analytical tool
used for targeted and nontargeted screening of molecular features in nanoclusters. HR-MS
techniques determine the core size and composition of metallic/bimetallic nanoclusters. Using this
technique, the active charge states of the nanocluster, the mixed protecting ligand composition, and
the mechanism of the nanocluster formation can be identified.
78
Sudarsanam and Singh; Advanced Heterogeneous Catalysts Volume 1: Applications at the Nano-Scale
ACS Symposium Series; American Chemical Society: Washington, DC, 2020.
Figure 31. Positive and negative ESI mass spectra of 1, 2, and 1′. The notation (n, m-/+) represents
[Aun(SC6H13)m]-/+. Reproduced with permission from ref. (126). Copyright 2007 American Chemical
Society.
Figure 32. ESI-MS tracking of [Pd3Cl(PPh2)2(PPh3)3]+ reacting with phenylboronic acid under alkaline
conditions: 0.0072 g (0.06 mmol) phenylboronic acid, 2 mg (1.32 × 10⁻³ mmol) catalyst, 0.0164 g (0.12
mmol) K2CO3, and 3 mL CH2Cl2, rt: (a) 0 h, (b) 1 h, (c) 2 h. (d) Adding 0.006 mL bromobenzene on
the basis of (c). Reproduced with permission from ref. (127). Copyright 2017 American Chemical Society.
Inductively Coupled Plasma Mass Spectrometry
Inductively coupled plasma mass spectrometry (ICP-MS) is an excellent technique for
determining the specific element concentration in the analyzed material with detection limits at or
below the single part per trillion (ppt) level for most of the periodic table elements (128). Here,
the plasma source is used to ionize the atomic elements, which are then sorted based on their
mass (129). ICP-MS exhibits a species-independent high sensitivity and multielement capabilities,
which allows for quantification when the species-specific standards are unavailable (130). ICP-MS
79
Sudarsanam and Singh; Advanced Heterogeneous Catalysts Volume 1: Applications at the Nano-Scale
ACS Symposium Series; American Chemical Society: Washington, DC, 2020.
converts chromatograms into simple “elementograms”; any structural and molecular information
is destroyed, so it cannot be used to elucidate structures. In such cases, ESI-MS can be used as
a technique complementary to ICP-MS (131). Zhang et al. (132) employed ICP-MS for cobalt
amount determination and cobalt phthalocyanine content in cobalt phthalocyanine catalysts
anchored onto carbon nanotubes. Negishi et al. (133) performed ICP-MS analysis on a series of Au
NCs to determine Au loading and to examine the efficiency of Au NC adsorption.
ICP-MS also helps to determine the individual isotopes of each element or isotope ratios. The
isotopic ratio, in particular, is beneficial in terms of tracing and isotope dilution. Larner et al. (134)
investigated the fractionation of the isotopic composition of engineered nanoparticles (ENPs), and
a comparison was made concerning bulk metal material for tracing purposes. For ZnO ENPs, no
fractionation of isotopic composition for ENPs was observed. Laycock et al. (135) employed ICP-
MS directly to characterize stable isotope–labeled Ag ENPs for tracing studies. Degueldre and
Favarger (136) introduced the application of ICP-MS in a single-particle version (SP-ICP-MS),
which is based on ion cloud generation through the single particle, for engineered nanomaterial
(ENM) analysis. Direct assessment of ENM size and number-size distribution is done based on the
signals obtained. SP-ICP-MS has limited multielement capabilities; this has made the hyphenation
of ICP-MS and the fractionation system attractive (137). Field flow fractionation (FFF) and SP-
ICP-MS are complementary tools in ENM analysis. FFF-ICP-MS can fractionate nanomaterials and
sensitively detect small nanomaterials by providing high resolution (Figure 33), whereas SP-ICP-MS
has a unique ability to distinguish between dissolved and nanoparticulate fractions (138).
Figure 33. Simplified schematic of the separation principle of FFF. Interaction of parabolic flow-profile
velocities, back diffusion of particles, and perpendicular applied field. (Scheme is not true to scale;
fractionation takes place only in the lower 3–5% of the channel.). Reproduced with permission from ref.
(138). Copyright 2015 Springer.
ICP-MS-based techniques are a powerful tool for metal-based single-particle and nanomaterial
applications. The SP-ICP-MS technique is used for detection and quantification by measuring the
elemental composition of nanomaterials. It is useful in measuring the size, number concentration,
and number size distribution. If ICP-MS is coupled with hyphenated techniques such as FFF and size
fractionation, the mass and number-based quantification of nanoparticles can be obtained.
Theoretical Calculations
Density functional theory calculations play an important role in the development of SACs and
the specific catalytic reaction mechanisms of supported single metal atoms. Qiao et al. (13) proposed
a reaction mechanism of oxidation for CO on Pt1/FeOx (Figure 34) based on a modified
80
Sudarsanam and Singh; Advanced Heterogeneous Catalysts Volume 1: Applications at the Nano-Scale
ACS Symposium Series; American Chemical Society: Washington, DC, 2020.
Langmuir–Hinshelwood scheme using DFT calculations and experiments in which the active sites
are single Pt atoms, coordinated with two to three oxygen atoms inserted on iron oxide.
Figure 34. Proposed CO oxidation on (A) Pt1/FeOx. Adapted with permission from ref. (13). Copyright
2011 Nature Publishing Group. (B) Ir1/FeOx. Adapted with permission from ref. (139). Copyright 2014
American Chemical Society. (C) Ni1/FeOx catalysts. Adapted with permission from ref. (140). Copyright
2016 Royal Society of Chemistry. (D) CO oxidation on oxygen-defective M1/FeOx (M = Pt, Rh, Pd, Co,
and Cu). Adapted with permission from ref. (141). Copyright 2015 American Chemical Society. (E)
Energetic alignment (in eV) of the surface-bound H and Kubas-coordinated H intermediates for V and Mo.
Adapted with permission from ref. (5). Copyright 2015 Wiley-VCH. (F) Energetic alignment (in eV) of the
Kubas-coordinated H, intermediate dissociated H2, and surface-bound H intermediates for Pt and Mo
along the pathway. Reproduced with permission from ref. (33). Copyright 2019 Springer.
Here the DFT calculations suggested that single Pt atoms embedded on the surface of Fe2O3
show a high oxidation state as they are coordinated with two to three oxygen atoms on the surface
of iron oxide, which results in a lowering of the reaction activation barrier for the rate-determining
step of oxidation of CO on single Pt (0.79 eV) compared to Pt(111) (~1 eV; Figure 34a). Further,
Liang et al. (139) analyzed Ir1/FeOx for CO oxidation using DFT, which showed that Ir1/FeOx has a
lower activity than Pt1/FeOx (Figure 34b). According to the calculation, the activation barrier of the
rate-determining step in the catalytic cycle of CO oxidation was 0.62 eV higher, and the adsorption
81
Sudarsanam and Singh; Advanced Heterogeneous Catalysts Volume 1: Applications at the Nano-Scale
ACS Symposium Series; American Chemical Society: Washington, DC, 2020.
energy of the CO molecule was 0.69 eV higher for Ir1/FeOx than for the Pt1/FeOx catalyst. In
addition, Liang et al. (140) using DFT predicted that Ni possessed a higher catalytic activity at room
temperature for CO oxidation that was comparable to that of Pt1/FeOx and considerably higher than
Ir1/FeOx, because of the lower energy barrier (Figure 34c). Later, Li et al. (141) applied DFT to
explore the catalytic activity of single metal atoms supported on an iron oxide surface and reported
that the performance of oxygen defective Rh1/FeOx, Pd1/FeOX, and Ru1/FeOx (Figure 34d) with
or without O vacancies and vacancy-free Ti1/FeOx and Co1/FeOx catalyst approached the overall
performance of the Pt1/FeOx catalyst.
DFT calculations can also be used to identify SACs. For example, Choi et al. (5) applied a
computational search of hydrogen catalysts made of transition metal atoms embedded with graphitic
carbon (Figure 34). Researchers have identified various materials that showed high efficiency as HER
and hydrogen oxidation reaction catalysts based on numerous criteria like stability, activity, and
resistance to poisoning. For example, a catalyst composed of Mo atom inserted within the divacancy
site in graphene (4C Mo) was shown to be particularly promising for the hydrogen oxidation reaction
catalyst in addition to HER catalyst. DFT can be used to study the molecular adsorption behavior
of SACs. Lou et al. (142) anchored single Rh1 atoms to the vacancy sites of 2-D MoS2 sheets to
form Rh1/MoS2 SACs. Here, the DFT calculations were conducted to understand the adsorption
behavior of CO molecules on edge-anchored single Rh1 atoms. The calculations suggested that such
a configuration is the most stable, and under an aqueous surrounding, the most outside edge atoms
of MoS2 are the oxygen atoms. It also indicated that the Rh single atom could strongly anchor to
the Mo vacancy sites to form a Rh1-S4 configuration (Figure 35a,b) on the edge of the nanosheets,
in agreement with the HAADF-STEM observations and the EXAFS results. Also, the first-principle
DFT calculations are nowadays extensively used to understand the elementary events and reaction
mechanisms.
Figure 35. (a) Rh K-edge EXAFS spectra of Rh1/MoS2 SAC, nano-Rh/MoS2 and Rh foil and (b) DFT-
calculated stable Rh1-S4 configuration of the Rh1 active site. Reproduced with permission from ref. (142).
Copyright 2019 American Chemical Society.
DFT results are converted into kinetic parameters by using transition state theory (143).
However, kinetic modeling is required to check the activity and selectivity and examine the various
aspects of catalytic behavior under operating conditions (144). Kopač et al. (145) investigated the
82
Sudarsanam and Singh; Advanced Heterogeneous Catalysts Volume 1: Applications at the Nano-Scale
ACS Symposium Series; American Chemical Society: Washington, DC, 2020.
role of surface defects in catalytic CO2 hydrogenation to methanol. Here, Cu(111) and stepped
Cu(533) surfaces were compared using a multiscale modeling approach via DFT and KMC (kinetic
Monte Carlo) simulations. DFT calculated the species adsorption energetics and reaction transition-
state profiles. These were then used by KMC to simulate the dynamics of the overall pathway and
investigate the selectivity and activity of the catalyst. The results showed that a stepped Cu(533)
enhances the selectivity and activity of the methanol synthesis. Kopač et al. (146), in his other work,
studied CO2 activation for the synthesis of methanol on Cu(111) catalysts using first-principle DFT
calculations and KMC modeling simulations. Huš et al. (147) used post-Hartree–Fock and DFT
calculations to assess the thermodynamics and to explain the pathway leading to the synthesis of
methanol from CO2 on Cu/ZnO/Al2O3. On performing the DFT calculation on Cu/ZnO/Al2O3,
it was found that the reaction proceeds via the formate route. For the development of SACs, DFT
has been extensively used. It has performed various functions for the study of SACs. Examples
have helped in understanding the catalytic reaction mechanism, identification of SACs, molecular
adsorption studies, and so on.
Conclusion
In summary, this chapter has discussed various characterization techniques and methods used
in analyzing subnano catalysts and single-atom catalysts. Understanding the materials confined at the
molecular and single-atom levels, or simply the “subnanometer” level, has been one of the targets
in the field of nanotechnology. This is central for analyzing the properties of this novel material
and its use in different applications such as catalysis and optics. From this standpoint, many unique
properties that cannot be addressed by conventional techniques due to the size and quantum effect
have been discussed. We review the characterization methods: brief working principles of various
major characterization techniques, the progress made so far, and the conditions required for the
functioning of the analytical systems. We have discussed some of the most important tools, such as
HAADF-STEM, SEM-EDAX, STM, DRIFT, other IR spectroscopy, NMR, XPS, EXAFS, TERS,
ICP-MS, and X-ray reflectometry. Theoretical techniques are also fundamental in understanding the
properties of these materials at the subnano level, and we review DFT as a modeling tool.
Acknowledgments
This chapter is dedicated to Prof. T. V. RajanBabu, The Ohio State University, on his 70th
birthday. The authors thanks DBT-PAN IIT Centre for Bioenergy (BT/EB/PANIIT/2012) for
financial assistance.
References
1. Guo, Q.; Ma, Z.; Zhou, C.; Ren, Z.; Yang, X. Single Molecule Photocatalysis on TiO2 Surfaces.
Chem. Rev. 2019, 119, 11020–11041.
2. Parkinson, G. S. Single-Atom Catalysis: How Structure Influences Catalytic Performance.
Catal. Lett. 2019, 149, 1137–1146.
3. Qin, L.; Cui, Y.-Q.; Deng, T.-L.; Wei, F.-H.; Zhang, X.-F. Highly stable and Active Cu1/
CeO2 Single-Atom Catalyst for CO Oxidation: A DFT Study. ChemPhysChem 2018, 19,
3346–3349.
83
Sudarsanam and Singh; Advanced Heterogeneous Catalysts Volume 1: Applications at the Nano-Scale
ACS Symposium Series; American Chemical Society: Washington, DC, 2020.
4. Kim, J.; Kim, H.-E.; Lee, H. Single-Atom Catalysts of Precious Metals for Electrochemical
Reactions. ChemSusChem 2018, 11, 104–113.
5. Choi, W. I.; Wood, B. C.; Schwegler, E.; Ogitsu, T. Combinatorial Search for High-Activity
Hydrogen Catalysts Based on Transition-Metal-Embedded Graphitic Carbons. Adv. Energy
Mater. 2015, 5, 1501423.
6. Varela, M.; Findlay, S. D.; Lupini, A. R.; Christen, H. M.; Borisevich, A. Y.; Dellby, N.;
Krivanek, O. L.; Nellist, P. D.; Oxley, M. P.; Allen, L. J.; Pennycook, S. J. Spectroscopic
Imaging of Single Atoms within a Bulk Solid. Phys. Rev. Lett. 2004, 92, 095502.
7. Yang, X.-F.; Wang, A.; Qiao, B.; Li, J.; Liu, J.; Zhang, T. Single-Atom Catalysts: A New
Frontier in Heterogeneous Catalysis. Acc. Chem. Res. 2013, 46, 1740–1748.
8. Thomas, J. M.; Raja, R.; Lewis, D. W. Single-Site Heterogeneous Catalysts. Angew. Chem., Int.
Ed. 2005, 44, 6456–6482.
9. Jin, R. Quantum sized, thiolate-protected gold nanoclusters. Nanoscale 2010, 2, 343–362.
10. Alvarez, M. M.; Khoury, J. T.; Schaaff, T. G.; Shafigullin, M. N.; Vezmar, I.; Whetten, R.
L. Optical Absorption Spectra of Nanocrystal Gold Molecules. J. Phys. Chem. B 1997, 101,
3706–3712.
11. Yang, S.; Tak, Y. J.; Kim, J.; Soon, A.; Lee, H. Support Effects in Single-Atom Platinum
Catalysts for Electrochemical Oxygen Reduction. ACS Catal. 2017, 7, 1301–1307.
12. Liu, J. Advanced Electron Microscopy of Metal–Support Interactions in Supported Metal
Catalysts. ChemCatChem 2011, 3, 934–948.
13. Qiao, B.; Wang, A.; Yang, X.; Allard, L. F.; Jiang, Z.; Cui, Y.; Liu, J.; Li, J.; Zhang, T. Single-
atom catalysis of CO oxidation using Pt1/FeOx. Nat. Chem. 2011, 3, 634–641.
14. Stroppa, D. G.; Righetto, R. D.; Montoro, L. A.; Houben, L.; Barthel, J.; Cordeiro, M. A.
L.; Leite, E. R.; Weng, W.; Kiely, C. J.; Ramirez, A. J. Assessment of a nanocrystal 3-D
morphology by the analysis of single HAADF-HRSTEM images. Nanoscale Res. Lett. 2013, 8,
475.
15. Chellappa, R.; Veeraraghavan, A.; Ramanathan, N.; Yam, C.-Y.; Nixon, M. S.; Elgammal, A.;
Boyd, J. E.; Little, J. J.; Lynnerup, N.; Larsen, P. K.; Reynolds, D. Gaussian Mixture Models.
In Encyclopedia of Biometrics; Springer: Boston, MA, 2009; pp 659−663.
16. McLachlan, G. J.; Peel, D. Finite Mixtures Models; Wiley: New York, 2000.
17. Pennycook, S. J.; Nellist, P. D., Scanning Transmission Electron Microscopy, 1st ed.; Springer-
Verlag: New York, pp XII, 762.
18. Van Aert, S.; Verbeeck, J.; Erni, R.; Bals, S.; Luysberg, M.; Dyck, D. V.; Tendeloo, G. V.
Quantitative atomic resolution mapping using high-angle annular dark field scanning
transmission electron microscopy. Ultramicroscopy 2009, 109, 1236–1244.
19. Krivanek, O. L.; Chisholm, M. F.; Nicolosi, V.; Pennycook, T. J.; Corbin, G. J.; Dellby, N.;
Murfitt, M. F.; Own, C. S.; Szilagyi, Z. S.; Oxley, M. P.; Pantelides, S. T.; Pennycook, S.
J. Atom-by-atom structural and chemical analysis by annular dark-field electron microscopy.
Nature 2010, 464, 571–574.
20. Stroppa, D. G.; Zagonel, L. F.; Montoro, L. A.; Leite, E. R.; Ramirez, A. J. High-Resolution
Scanning Transmission Electron Microscopy (HRSTEM) Techniques: High-Resolution
Imaging and Spectroscopy Side by Side. ChemPhysChem 2012, 13, 437–443.
84
Sudarsanam and Singh; Advanced Heterogeneous Catalysts Volume 1: Applications at the Nano-Scale
ACS Symposium Series; American Chemical Society: Washington, DC, 2020.
21. Qiu, H.-J.; Ito, Y.; Cong, W.; Tan, Y.; Liu, P.; Hirata, A.; Fujita, T.; Tang, Z.; Chen, M.
Nanoporous Graphene with Single-Atom Nickel Dopants: An Efficient and Stable Catalyst for
Electrochemical Hydrogen Production. Angew. Chem., Int. Ed. 2015, 54, 14031–14035.
22. Li, X.; Bi, W.; Zhang, L.; Tao, S.; Chu, W.; Zhang, Q.; Luo, Y.; Wu, C.; Xie, Y. Single-Atom Pt
as Co-Catalyst for Enhanced Photocatalytic H2 Evolution. Adv. Mater. 2016, 28, 2427–2431.
23. Kumskov, A.; Zhigalina, V.; Kiselev, N.; Eliseev, A.; Verbitskiy, N.; Vasiliev, A. HAADF
HRSTEM of one dimensional CuI crystals inside SWCNTs. In European Microscopy Congress
2016: Proceedings; Wiley-VCH, pp 490−491.
24. Zhang, Z.; Zhu, Y.; Asakura, H.; Zhang, B.; Zhang, J.; Zhou, M.; Han, Y.; Tanaka, T.; Wang,
A.; Zhang, T.; Yan, N. Thermally stable single atom Pt/m-Al2O3 for selective hydrogenation
and CO oxidation. Nat. Commun. 2017, 8, 16100.
25. Liu, Q.; Zhang, Z. Platinum single-atom catalysts: a comparative review towards effective
characterization. Catal. Sci. Technol. 2019, 9, 4821–4834.
26. Liu, L.; Zakharov, D. N.; Arenal, R.; Concepcion, P.; Stach, E. A.; Corma, A. Evolution and
stabilization of subnanometric metal species in confined space by in situ TEM. Nat. Commun.
2018, 9, 574.
27. Wiesendanger, R. Single-atom magnetometry. Curr. Opin. Solid State Mater. Sci. 2011, 15,
1–7.
28. Ternes,M.;Heinrich,A.J.;Schneider,W.-D.SpectroscopicmanifestationsoftheKondoeffect
on single adatoms. J. Phys. Condens. Matter 2008, 21, 053001.
29. Zhou, X.; Yang, W.; Chen, Q.; Geng, Z.; Shao, X.; Li, J.; Wang, Y.; Dai, D.; Chen, W.; Xu, G.;
Yang, X.; Wu, K. Stable Pt Single Atoms and Nanoclusters on Ultrathin CuO Film and Their
Performances in CO Oxidation. J. Phys. Chem. C 2016, 120, 1709–1715.
30. Krenner, W.; Klappenberger, F.; Kühne, D.; Diller, K.; Qu, Z.-R.; Ruben, M.; Barth, J. V.
Positioning of Single Co Atoms Steered by a Self-Assembled Organic Molecular Template. J.
Phys. Chem. Lett. 2011, 2, 1639–1645.
31. Lucci, F. R.; Liu, J.; Marcinkowski, M. D.; Yang, M.; Allard, L. F.; Flytzani-Stephanopoulos,
M.; Sykes, E. C. H. Selective hydrogenation of 1,3-butadiene on platinum–copper alloys at the
single-atom limit. Nat. Commun. 2015, 6, 8550.
32. Boucher, M. B.; Goergen, S.; Yi, N.; Flytzani-Stephanopoulos, M. ‘Shape effects’ in metal
oxide supported nanoscale gold catalysts. Phys. Chem. Chem. Phys. 2011, 13, 2517–2527.
33. Cheng, N.; Zhang, L.; Doyle-Davis, K.; Sun, X. Single-Atom Catalysts: From Design to
Application. Electrochem. Energy Rev. 2019, 2, 539–573.
34. Venkatachalam, S.; Jacob, T. Hydrogen adsorption on Pd-containing Au(111) bimetallic
surfaces. Phys. Chem. Chem. Phys. 2009, 11, 3263–3270.
35. Yudanov, I. V.; Neyman, K. M. Stabilization of Au at edges of bimetallic PdAu nanocrystallites.
Phys. Chem. Chem. Phys. 2010, 12, 5094–5100.
36. Yuan, D.; Gong, X.; Wu, R. Atomic configurations of Pd atoms in PdAu(111) bimetallic
surfaces investigated using the first-principles pseudopotential plane wave approach. Phys. Rev.
B 2007, 75, 085428.
37. Baber, A. E.; Tierney, H. L.; Sykes, E. C. H. Atomic-Scale Geometry and Electronic Structure
of Catalytically Important Pd/Au Alloys. ACS Nano 2010, 4, 1637–1645.
85
Sudarsanam and Singh; Advanced Heterogeneous Catalysts Volume 1: Applications at the Nano-Scale
ACS Symposium Series; American Chemical Society: Washington, DC, 2020.
38. Lucci, F. R.; Darby, M. T.; Mattera, M. F. G.; Ivimey, C. J.; Therrien, A. J.; Michaelides, A.;
Stamatakis, M.; Sykes, E. C. H. Controlling Hydrogen Activation, Spillover, and Desorption
with Pd–Au Single-Atom Alloys. J. Phys. Chem. Lett. 2016, 7, 480–485.
39. Liu, J.; Lucci, F. R.; Yang, M.; Lee, S.; Marcinkowski, M. D.; Therrien, A. J.; Williams, C. T.;
Sykes, E. C. H.; Flytzani-Stephanopoulos, M. Tackling CO Poisoning with Single-Atom Alloy
Catalysts. J. Am. Chem. Soc. 2016, 138, 6396–6399.
40. Wang, Y.; Mao, J.; Meng, X.; Yu, L.; Deng, D.; Bao, X. Catalysis with Two-Dimensional
Materials Confining Single Atoms: Concept, Design, and Applications. Chem. Rev. 2019, 119,
1806–1854.
41. Deng, D.; Pan, X.; Yu, L.; Cui, Y.; Jiang, Y.; Qi, J.; Li, W.-X.; Fu, Q.; Ma, X.; Xue, Q.; Sun,
G.; Bao, X. Toward N-Doped Graphene via Solvothermal Synthesis. Chem. Mater. 2011, 23,
1188–1193.
42. Zheng, B.; Hermet, P.; Henrard, L. Scanning Tunneling Microscopy Simulations of Nitrogen-
and Boron-Doped Graphene and Single-Walled Carbon Nanotubes. ACS Nano 2010, 4,
4165–4173.
43. Zhao, L.; He, R.; Rim, K. T.; Schiros, T.; Kim, K. S.; Zhou, H.; Gutiérrez, C.; Chockalingam,
S. P.; Arguello, C. J.; Pálová, L.; Nordlund, D.; Hybertsen, M. S.; Reichman, D. R.; Heinz,
T. F.; Kim, P.; Pinczuk, A.; Flynn, G. W.; Pasupathy, A. N. Visualizing Individual Nitrogen
Dopants in Monolayer Graphene. Science 2011, 333, 999–1003.
44. Binnig, G.; Rohrer, H. Scanning tunneling microscopy---From birth to adolescence. Rev. Mod.
Phys. 1987, 59, 615–625.
45. Mourdikoudis, S.; Pallares, R. M.; Thanh, N. T. K. Characterization techniques for
nanoparticles: Comparison and complementarity upon studying nanoparticle properties.
Nanoscale 2018, 10, 12871–12934.
46. Girão, A. V.; Caputo, G.; Ferro, M. C. Chapter 6, Application of Scanning Electron
Microscopy–Energy Dispersive X-Ray Spectroscopy (SEM-EDS). In Comprehensive Analytical
Chemistry; Rocha-Santos, T. A. P., Duarte, A. C., Eds.; Elsevier: 2017; Vol. 75, pp 153−168.
47. Tang, Y.; Yang, Y.; Cheng, D.; Gao, B.; Wan, Y.; Li, Y. C. Value-Added Humic Acid Derived
from Lignite Using Novel Solid-Phase Activation Process with Pd/CeO2 Nanocatalyst: A
Physiochemical Study. ACS Sustainable Chem. Eng. 2017, 5, 10099–10110.
48. Han, W.; Zhang, C.; Wang, H.; Zhou, S.; Tang, H.; Yang, L.; Wang, Z. Sub-nano MgF2
embedded in carbon nanofibers and electrospun MgF2 nanofibers by one-step electrospinning
as highly efficient catalysts for 1,1,1-trifluoroethane dehydrofluorination. Catal. Sci. Technol.
2017, 7, 6000–6012.
49. Klaysri, R.; Preechawan, V.; Thammachai, N.; Praserthdam, P.; Mekasuwandumrong, O.
Photocatalytic activity of Nitrogen and Silica doping on TiO2 nanocatalyst and grafted onto
PMMA film. Mater. Chem. Phys. 2018, 211, 420–427.
50. Pascariu, P.; Tudose, I. V.; Suchea, M.; Koudoumas, E.; Fifere, N.; Airinei, A. Preparation and
characterization of Ni, Co doped ZnO nanoparticles for photocatalytic applications. Appl. Surf.
Sci. 2018, 448, 481–488.
51. Blass, S. D.; Hermann, R. J.; Persson, N. E.; Bhan, A.; Schmidt, L. D. Conversion of glycerol
to light olefins and gasoline precursors. Appl. Catal., A 2014, 475, 10–15.
86
Sudarsanam and Singh; Advanced Heterogeneous Catalysts Volume 1: Applications at the Nano-Scale
ACS Symposium Series; American Chemical Society: Washington, DC, 2020.
52. Du, Y.; Sheng, H.; Astruc, D.; Zhu, M. Atomically Precise Noble Metal Nanoclusters as
Efficient Catalysts: A Bridge between Structure and Properties. Chem. Rev. 2020, 120,
526–622.
53. Nadjia, L.; Abdelkader, E.; Naceur, B.; Ahmed, B. CeO2 nanoscale particles: Synthesis,
characterization and photocatalytic activity under UVA light irradiation. J. Rare Earth 2018, 36,
575–587.
54. Wang, Z. L.; Lee, J. L., 9: Electron Microscopy Techniques for Imaging and Analysis of
Nanoparticles. In Developments in Surface Contamination and Cleaning; Kohli, R., Mittal, K. L.,
Eds.; William Andrew Publishing: Norwich, NY, 2008; pp 531−584.
55. Mahajan, A.; Banik, S.; Roy, P. S.; Chowdhury, S. R.; Bhattacharya, S. K. Kinetic parameters
of anodic oxidation of methanol in alkali: Effect of diameter of Pd nano-catalyst, composition
of electrode and solution and mechanism of the reaction. Int. J. Hydrogen Energy 2017, 42,
21263–21278.
56. Ganeev, R. A.; Suzuki, M.; Baba, M.; Ichihara, M.; Kuroda, H. Low- and high-order nonlinear
optical properties of BaTiO3 and SrTiO3 nanoparticles. J. Opt. Soc. Am. B 2008, 25, 325–333.
57. Rahman, T.; Borah, G.; Gogoi, P. K. Spinel Structured Copper Ferrite Nano Catalyst with
Magnetic Recyclability for Oxidative Decarboxylation of Phenyl Acetic Acids. Catal. Lett.
2020, 150, 2267–2272.
58. Khazaei, A.; Jafari-Ghalebabakhani, L.; Ghaderi, E.; Tavasoli, M.; Moosavi-Zare, A. R.
Synthesis, characterization and application of nano-CoAl2O4 as an efficient catalyst in the
preparation of hexahydroquinolines. Appl. Organomet. Chem. 2017, 31, e3815.
59. Valan, M. F.; Manikandan, A.; Antony, S. A. Microwave Combustion Synthesis and
Characterization Studies of Magnetic Zn(1-x)Cd(x)Fe2O4 (0 ≤ x ≤ 0.5) Nanoparticles. J.
Nanosci. Nanotechnol. 2015, 15, 4543–51.
60. Park, K.-D.; Raschke, M. B.; Atkin, J. M.; Lee, Y. H.; Jeong, M. S. Probing Bilayer Grain
Boundaries in Large-Area Graphene with Tip-Enhanced Raman Spectroscopy. Adv. Mater.
2017, 29, 1603601.
61. Chiang, N.; Chen, X.; Goubert, G.; Chulhai, D. V.; Chen, X.; Pozzi, E. A.; Jiang, N.; Hersam,
M. C.; Seideman, T.; Jensen, L.; Van Duyne, R. P. Conformational Contrast of Surface-
Mediated Molecular Switches Yields Angstrom-Scale Spatial Resolution in Ultrahigh Vacuum
Tip-Enhanced Raman Spectroscopy. Nano Lett. 2016, 16, 7774–7778.
62. Shao, F.; Zenobi, R. Tip-enhanced Raman spectroscopy: principles, practice, and applications
to nanospectroscopic imaging of 2D materials. Anal. Bioanal. Chem. 2019, 411, 37–61.
63. Liu, S.; Müller, M.; Sun, Y.; Hamada, I.; Hammud, A.; Wolf, M.; Kumagai, T. Resolving the
Correlation between Tip-Enhanced Resonance Raman Scattering and Local Electronic States
with 1 nm Resolution. Nano Lett. 2019, 19, 5725–5731.
64. Balois, M. V.; Hayazawa, N.; Yasuda, S.; Ikeda, K.; Yang, B.; Kazuma, E.; Yokota, Y.; Kim,
Y.; Tanaka, T. Visualization of subnanometric phonon modes in a plasmonic nano-cavity via
ambient tip-enhanced Raman spectroscopy. NPJ 2D Mater. Appl. 2019, 3, 38.
65. Ichimura, T.; Fujii, S.; Verma, P.; Yano, T.; Inouye, Y.; Kawata, S. Subnanometric Near-Field
Raman Investigation in the Vicinity of a Metallic Nanostructure. Phys. Rev. Lett. 2009, 102,
186101.
87
Sudarsanam and Singh; Advanced Heterogeneous Catalysts Volume 1: Applications at the Nano-Scale
ACS Symposium Series; American Chemical Society: Washington, DC, 2020.
66. Cleveland, J. P.; Anczykowski, B.; Schmid, A. E.; Elings, V. B. Energy dissipation in tapping-
mode atomic force microscopy. Appl. Phys. Lett. 1998, 72, 2613–2615.
67. Zhang, R.; Zhang, Y.; Dong, Z. C.; Jiang, S.; Zhang, C.; Chen, L. G.; Zhang, L.; Liao, Y.;
Aizpurua, J.; Luo, Y.; Yang, J. L.; Hou, J. G. Chemical mapping of a single molecule by
plasmon-enhanced Raman scattering. Nature 2013, 498, 82–86.
68. Stipe, B. C.; Rezaei, M. A.; Ho, W. Single-Molecule Vibrational Spectroscopy and Microscopy.
Science 1998, 280, 1732–1735.
69. Richard-Lacroix,M.;Zhang,Y.;Dong,Z.;Deckert,V.Masteringhighresolutiontip-enhanced
Raman spectroscopy: towards a shift of perception. Chem. Soc. Rev. 2017, 46, 3922–3944.
70. Szwedowski-Rammert, V.; Baumann, J.; Schlesiger, C.; Waldschläger, U.; Gross, A.;
Kanngießer, B.; Mantouvalou, I. Laboratory based GIXRF and GEXRF spectrometers for
multilayer structure investigations. J. Anal. At. Spectrom. 2019, 34, 922–929.
71. Mao, P. H.; Harrison, F. A.; Windt, D. L.; Christensen, F. E. Optimization of graded
multilayer designs for astronomical X-ray telescopes. Appl. Opt. 1999, 38, 4766–4775.
72. Ménesguen, Y.; de Rossi, S.; Meltchakov, E.; Delmotte, F. Aperiodic multilayer mirrors for
efficient broadband reflection in the extreme ultraviolet. Appl. Phys. A 2009, 98, 305.
73. Bridou, F.; Delmotte, F.; Troussel, P.; Villette, B. Design and fabrication of X-ray non-periodic
multilayer mirrors: Apodization and shaping of their spectral response. Nucl. Instrum. Meth. A
2012, 680, 69–74.
74. Ingerle, D.; Schiebl, M.; Streli, C.; Wobrauschek, P. Combination of grazing incidence X-ray
fluorescence with X-ray reflectivity in one table-top spectrometer for improved characterization
of thin layer and implants on/in silicon wafers. Rev. Sci. Instrum. 2014, 85, 083110.
75. Hönicke, P.; Detlefs, B.; Müller, M.; Darlatt, E.; Nolot, E.; Grampeix, H.; Beckhoff, B.
Reference-free, depth-dependent characterization of nanolayers and gradient systems with
advanced grazing incidence X-ray fluorescence analysis. Phys. Status Solidi A 2015, 212,
523–528.
76. Parratt, L. G.; Hempstead, C. F. Anomalous Dispersion and Scattering of X-Rays. Phys. Rev.
1954, 94, 1593–1600.
77. Beckhoff, B. Reference-free X-ray spectrometry based on metrology using synchrotron
radiation. J. Anal. At. Spectrom. 2008, 23, 845–853.
78. Emprin, B.; Troussel, P.; Soullié, G.; Stemmler, P.; Mercère, P.; Meltchakov, E.; Jérôme,
A.; Delmotte, F. Characterization of subnanometric layers by grazing incidence X-ray
reflectometry. Thin Solid Films 2014, 556, 54–60.
79. Haase, A.; Bajt, S.; Honicke, P.; Soltwisch, V.; Scholze, F. Multiparameter characterization of
subnanometre Cr/Sc multilayers based on complementary measurements. J. Appl. Crystallogr.
2016, 49, 2161–2171.
80. Zhang, P. X-ray Spectroscopy of Gold–Thiolate Nanoclusters. J. Phys. Chem. C 2014, 118,
25291–25299.
81. Jin, R.; Zeng, C.; Zhou, M.; Chen, Y. Atomically Precise Colloidal Metal Nanoclusters and
Nanoparticles: Fundamentals and Opportunities. Chem. Rev. 2016, 116, 10346–10413.
82. MacDonald, M. A.; Zhang, P.; Qian, H.; Jin, R. Site-Specific and Size-Dependent Bonding
of Compositionally Precise Gold−Thiolate Nanoparticles from X-ray Spectroscopy. J. Phys.
Chem. Lett. 2010, 1, 1821–1825.
88
Sudarsanam and Singh; Advanced Heterogeneous Catalysts Volume 1: Applications at the Nano-Scale
ACS Symposium Series; American Chemical Society: Washington, DC, 2020.
Characterization Techniques for Nano- and Atomic-Scale Catalysts

More Related Content

Similar to Characterization Techniques for Nano- and Atomic-Scale Catalysts

Computational Nano Technology and Simulation Techniques Applied to Study Silv...
Computational Nano Technology and Simulation Techniques Applied to Study Silv...Computational Nano Technology and Simulation Techniques Applied to Study Silv...
Computational Nano Technology and Simulation Techniques Applied to Study Silv...IRJET Journal
 
Nano science _technology
Nano science _technologyNano science _technology
Nano science _technologyVřáj Pàtêl
 
Study of Microstructural, Electrical and Dielectric Properties of La0.9Pb0.1M...
Study of Microstructural, Electrical and Dielectric Properties of La0.9Pb0.1M...Study of Microstructural, Electrical and Dielectric Properties of La0.9Pb0.1M...
Study of Microstructural, Electrical and Dielectric Properties of La0.9Pb0.1M...Scientific Review SR
 
Phil. Trans. R. Soc. B-2013-Michalet-
Phil. Trans. R. Soc. B-2013-Michalet-Phil. Trans. R. Soc. B-2013-Michalet-
Phil. Trans. R. Soc. B-2013-Michalet-Fabrizio Guerrieri
 
Graphene Quantum Dots-Based Composites for Biomedical Applications
Graphene Quantum Dots-Based Composites for  Biomedical ApplicationsGraphene Quantum Dots-Based Composites for  Biomedical Applications
Graphene Quantum Dots-Based Composites for Biomedical Applicationsnooralam814309
 
Study of Crystallite Size and Microstrain Using X-Ray Diffractometer (XRD)
Study of Crystallite Size and Microstrain Using X-Ray Diffractometer (XRD)Study of Crystallite Size and Microstrain Using X-Ray Diffractometer (XRD)
Study of Crystallite Size and Microstrain Using X-Ray Diffractometer (XRD)IRJET Journal
 
Recent Progress in Synthesis of Nano- and Atomic-Sized Catalysts
Recent Progress in Synthesis of Nano- and Atomic-Sized CatalystsRecent Progress in Synthesis of Nano- and Atomic-Sized Catalysts
Recent Progress in Synthesis of Nano- and Atomic-Sized CatalystsDevika Laishram
 
Ultra-optical characterization of thin film solar cells materials using core...
Ultra-optical characterization of thin film solar cells materials  using core...Ultra-optical characterization of thin film solar cells materials  using core...
Ultra-optical characterization of thin film solar cells materials using core...IJECEIAES
 
Characterization of nanopartical
Characterization of nanoparticalCharacterization of nanopartical
Characterization of nanoparticalAmany EL-Hallaq
 
Probing electrical energy storage chemistry and physics over broad time and ...
Probing electrical energy storage chemistry and physics over broad time  and ...Probing electrical energy storage chemistry and physics over broad time  and ...
Probing electrical energy storage chemistry and physics over broad time and ...Andrew Gelston
 
Poster presentat a les jornades doctorals de la UAB
Poster presentat a les jornades doctorals de la UABPoster presentat a les jornades doctorals de la UAB
Poster presentat a les jornades doctorals de la UABElisabeth Ortega
 
Numerical Modeling of Nano Bundle and Nano Rope-Reinforced Polymer Mechanical...
Numerical Modeling of Nano Bundle and Nano Rope-Reinforced Polymer Mechanical...Numerical Modeling of Nano Bundle and Nano Rope-Reinforced Polymer Mechanical...
Numerical Modeling of Nano Bundle and Nano Rope-Reinforced Polymer Mechanical...Crimsonpublishers-Mechanicalengineering
 
1 s2.0-s2352864817301992-main
1 s2.0-s2352864817301992-main1 s2.0-s2352864817301992-main
1 s2.0-s2352864817301992-mainAkshaya Rath
 
nuclearmagneticresonance-180329132838.pdf
nuclearmagneticresonance-180329132838.pdfnuclearmagneticresonance-180329132838.pdf
nuclearmagneticresonance-180329132838.pdfMonukumawat7
 
Micro and Nano Mechanical Testing of Materials_Contents.pdf
Micro and Nano Mechanical Testing of Materials_Contents.pdfMicro and Nano Mechanical Testing of Materials_Contents.pdf
Micro and Nano Mechanical Testing of Materials_Contents.pdfUttakanthaDixit1
 
CASTEP Software.pptx
CASTEP Software.pptxCASTEP Software.pptx
CASTEP Software.pptxMohsan10
 

Similar to Characterization Techniques for Nano- and Atomic-Scale Catalysts (20)

Computational Nano Technology and Simulation Techniques Applied to Study Silv...
Computational Nano Technology and Simulation Techniques Applied to Study Silv...Computational Nano Technology and Simulation Techniques Applied to Study Silv...
Computational Nano Technology and Simulation Techniques Applied to Study Silv...
 
Nano science _technology
Nano science _technologyNano science _technology
Nano science _technology
 
Study of Microstructural, Electrical and Dielectric Properties of La0.9Pb0.1M...
Study of Microstructural, Electrical and Dielectric Properties of La0.9Pb0.1M...Study of Microstructural, Electrical and Dielectric Properties of La0.9Pb0.1M...
Study of Microstructural, Electrical and Dielectric Properties of La0.9Pb0.1M...
 
Phil. Trans. R. Soc. B-2013-Michalet-
Phil. Trans. R. Soc. B-2013-Michalet-Phil. Trans. R. Soc. B-2013-Michalet-
Phil. Trans. R. Soc. B-2013-Michalet-
 
Graphene Quantum Dots-Based Composites for Biomedical Applications
Graphene Quantum Dots-Based Composites for  Biomedical ApplicationsGraphene Quantum Dots-Based Composites for  Biomedical Applications
Graphene Quantum Dots-Based Composites for Biomedical Applications
 
qring_study
qring_studyqring_study
qring_study
 
Study of Crystallite Size and Microstrain Using X-Ray Diffractometer (XRD)
Study of Crystallite Size and Microstrain Using X-Ray Diffractometer (XRD)Study of Crystallite Size and Microstrain Using X-Ray Diffractometer (XRD)
Study of Crystallite Size and Microstrain Using X-Ray Diffractometer (XRD)
 
Recent Progress in Synthesis of Nano- and Atomic-Sized Catalysts
Recent Progress in Synthesis of Nano- and Atomic-Sized CatalystsRecent Progress in Synthesis of Nano- and Atomic-Sized Catalysts
Recent Progress in Synthesis of Nano- and Atomic-Sized Catalysts
 
Ultra-optical characterization of thin film solar cells materials using core...
Ultra-optical characterization of thin film solar cells materials  using core...Ultra-optical characterization of thin film solar cells materials  using core...
Ultra-optical characterization of thin film solar cells materials using core...
 
Organic solar cells probed in situ
Organic solar cells probed in situOrganic solar cells probed in situ
Organic solar cells probed in situ
 
Characterization of nanopartical
Characterization of nanoparticalCharacterization of nanopartical
Characterization of nanopartical
 
Probing electrical energy storage chemistry and physics over broad time and ...
Probing electrical energy storage chemistry and physics over broad time  and ...Probing electrical energy storage chemistry and physics over broad time  and ...
Probing electrical energy storage chemistry and physics over broad time and ...
 
Poster presentat a les jornades doctorals de la UAB
Poster presentat a les jornades doctorals de la UABPoster presentat a les jornades doctorals de la UAB
Poster presentat a les jornades doctorals de la UAB
 
1-s2.0-S1369800114002303-main
1-s2.0-S1369800114002303-main1-s2.0-S1369800114002303-main
1-s2.0-S1369800114002303-main
 
Numerical Modeling of Nano Bundle and Nano Rope-Reinforced Polymer Mechanical...
Numerical Modeling of Nano Bundle and Nano Rope-Reinforced Polymer Mechanical...Numerical Modeling of Nano Bundle and Nano Rope-Reinforced Polymer Mechanical...
Numerical Modeling of Nano Bundle and Nano Rope-Reinforced Polymer Mechanical...
 
1 s2.0-s2352864817301992-main
1 s2.0-s2352864817301992-main1 s2.0-s2352864817301992-main
1 s2.0-s2352864817301992-main
 
nuclearmagneticresonance-180329132838.pdf
nuclearmagneticresonance-180329132838.pdfnuclearmagneticresonance-180329132838.pdf
nuclearmagneticresonance-180329132838.pdf
 
Nuclear magnetic resonance
Nuclear magnetic resonanceNuclear magnetic resonance
Nuclear magnetic resonance
 
Micro and Nano Mechanical Testing of Materials_Contents.pdf
Micro and Nano Mechanical Testing of Materials_Contents.pdfMicro and Nano Mechanical Testing of Materials_Contents.pdf
Micro and Nano Mechanical Testing of Materials_Contents.pdf
 
CASTEP Software.pptx
CASTEP Software.pptxCASTEP Software.pptx
CASTEP Software.pptx
 

More from Devika Laishram

Water-splitting photoelectrodes consisting of heterojunctions of carbon nitri...
Water-splitting photoelectrodes consisting of heterojunctions of carbon nitri...Water-splitting photoelectrodes consisting of heterojunctions of carbon nitri...
Water-splitting photoelectrodes consisting of heterojunctions of carbon nitri...Devika Laishram
 
Zinc Oxide–Titania Heterojunction-based Solid Nanospheres as Photoanodes for ...
Zinc Oxide–Titania Heterojunction-based Solid Nanospheres as Photoanodes for ...Zinc Oxide–Titania Heterojunction-based Solid Nanospheres as Photoanodes for ...
Zinc Oxide–Titania Heterojunction-based Solid Nanospheres as Photoanodes for ...Devika Laishram
 
Nickel and cobalt transfigured natural clay: a green catalyst for low-tempera...
Nickel and cobalt transfigured natural clay: a green catalyst for low-tempera...Nickel and cobalt transfigured natural clay: a green catalyst for low-tempera...
Nickel and cobalt transfigured natural clay: a green catalyst for low-tempera...Devika Laishram
 
Recent advances in ultra-low temperature (sub-zero to 100 8C) synthesis, mech...
Recent advances in ultra-low temperature (sub-zero to 100 8C) synthesis, mech...Recent advances in ultra-low temperature (sub-zero to 100 8C) synthesis, mech...
Recent advances in ultra-low temperature (sub-zero to 100 8C) synthesis, mech...Devika Laishram
 
Engineered ZnO-TiO2 Nanospheres for High Performing Membrane Assimilated Phot...
Engineered ZnO-TiO2 Nanospheres for High Performing Membrane Assimilated Phot...Engineered ZnO-TiO2 Nanospheres for High Performing Membrane Assimilated Phot...
Engineered ZnO-TiO2 Nanospheres for High Performing Membrane Assimilated Phot...Devika Laishram
 
HfO2 nanodots incorporated in TiO2 and its hydrogenation for high performance...
HfO2 nanodots incorporated in TiO2 and its hydrogenation for high performance...HfO2 nanodots incorporated in TiO2 and its hydrogenation for high performance...
HfO2 nanodots incorporated in TiO2 and its hydrogenation for high performance...Devika Laishram
 
High-performance dye-sensitized solar cell using dimensionally controlled tit...
High-performance dye-sensitized solar cell using dimensionally controlled tit...High-performance dye-sensitized solar cell using dimensionally controlled tit...
High-performance dye-sensitized solar cell using dimensionally controlled tit...Devika Laishram
 
Solution Processed Hafnia Nanoaggregates: Influence of Surface Oxygen on Cata...
Solution Processed Hafnia Nanoaggregates: Influence of Surface Oxygen on Cata...Solution Processed Hafnia Nanoaggregates: Influence of Surface Oxygen on Cata...
Solution Processed Hafnia Nanoaggregates: Influence of Surface Oxygen on Cata...Devika Laishram
 
Nitrogen-Enriched Carbon Nanobubbles and Nanospheres for Applications in Ener...
Nitrogen-Enriched Carbon Nanobubbles and Nanospheres for Applications in Ener...Nitrogen-Enriched Carbon Nanobubbles and Nanospheres for Applications in Ener...
Nitrogen-Enriched Carbon Nanobubbles and Nanospheres for Applications in Ener...Devika Laishram
 
Boosting Photocatalytic Activity Using Carbon Nitride Based 2D/2D van der Waa...
Boosting Photocatalytic Activity Using Carbon Nitride Based 2D/2D van der Waa...Boosting Photocatalytic Activity Using Carbon Nitride Based 2D/2D van der Waa...
Boosting Photocatalytic Activity Using Carbon Nitride Based 2D/2D van der Waa...Devika Laishram
 
Multifunctional materials for clean energy conversion
Multifunctional materials for clean energy conversionMultifunctional materials for clean energy conversion
Multifunctional materials for clean energy conversionDevika Laishram
 
Surface fluorination of α-Fe2O3 using selectfluor for enhancement in photoele...
Surface fluorination of α-Fe2O3 using selectfluor for enhancement in photoele...Surface fluorination of α-Fe2O3 using selectfluor for enhancement in photoele...
Surface fluorination of α-Fe2O3 using selectfluor for enhancement in photoele...Devika Laishram
 
On the study of phase and dimensionally controlled titania nanostructures syn...
On the study of phase and dimensionally controlled titania nanostructures syn...On the study of phase and dimensionally controlled titania nanostructures syn...
On the study of phase and dimensionally controlled titania nanostructures syn...Devika Laishram
 
Air- and water-stable halide perovskite nanocrystals protected with nearly-m...
Air- and water-stable halide perovskite nanocrystals protected with  nearly-m...Air- and water-stable halide perovskite nanocrystals protected with  nearly-m...
Air- and water-stable halide perovskite nanocrystals protected with nearly-m...Devika Laishram
 
Heterostructured HfO2/TiO2 spherical nanoparticles for visible photocatalytic...
Heterostructured HfO2/TiO2 spherical nanoparticles for visible photocatalytic...Heterostructured HfO2/TiO2 spherical nanoparticles for visible photocatalytic...
Heterostructured HfO2/TiO2 spherical nanoparticles for visible photocatalytic...Devika Laishram
 

More from Devika Laishram (16)

Water-splitting photoelectrodes consisting of heterojunctions of carbon nitri...
Water-splitting photoelectrodes consisting of heterojunctions of carbon nitri...Water-splitting photoelectrodes consisting of heterojunctions of carbon nitri...
Water-splitting photoelectrodes consisting of heterojunctions of carbon nitri...
 
Energy Tech - 2017.pdf
Energy Tech - 2017.pdfEnergy Tech - 2017.pdf
Energy Tech - 2017.pdf
 
Zinc Oxide–Titania Heterojunction-based Solid Nanospheres as Photoanodes for ...
Zinc Oxide–Titania Heterojunction-based Solid Nanospheres as Photoanodes for ...Zinc Oxide–Titania Heterojunction-based Solid Nanospheres as Photoanodes for ...
Zinc Oxide–Titania Heterojunction-based Solid Nanospheres as Photoanodes for ...
 
Nickel and cobalt transfigured natural clay: a green catalyst for low-tempera...
Nickel and cobalt transfigured natural clay: a green catalyst for low-tempera...Nickel and cobalt transfigured natural clay: a green catalyst for low-tempera...
Nickel and cobalt transfigured natural clay: a green catalyst for low-tempera...
 
Recent advances in ultra-low temperature (sub-zero to 100 8C) synthesis, mech...
Recent advances in ultra-low temperature (sub-zero to 100 8C) synthesis, mech...Recent advances in ultra-low temperature (sub-zero to 100 8C) synthesis, mech...
Recent advances in ultra-low temperature (sub-zero to 100 8C) synthesis, mech...
 
Engineered ZnO-TiO2 Nanospheres for High Performing Membrane Assimilated Phot...
Engineered ZnO-TiO2 Nanospheres for High Performing Membrane Assimilated Phot...Engineered ZnO-TiO2 Nanospheres for High Performing Membrane Assimilated Phot...
Engineered ZnO-TiO2 Nanospheres for High Performing Membrane Assimilated Phot...
 
HfO2 nanodots incorporated in TiO2 and its hydrogenation for high performance...
HfO2 nanodots incorporated in TiO2 and its hydrogenation for high performance...HfO2 nanodots incorporated in TiO2 and its hydrogenation for high performance...
HfO2 nanodots incorporated in TiO2 and its hydrogenation for high performance...
 
High-performance dye-sensitized solar cell using dimensionally controlled tit...
High-performance dye-sensitized solar cell using dimensionally controlled tit...High-performance dye-sensitized solar cell using dimensionally controlled tit...
High-performance dye-sensitized solar cell using dimensionally controlled tit...
 
Solution Processed Hafnia Nanoaggregates: Influence of Surface Oxygen on Cata...
Solution Processed Hafnia Nanoaggregates: Influence of Surface Oxygen on Cata...Solution Processed Hafnia Nanoaggregates: Influence of Surface Oxygen on Cata...
Solution Processed Hafnia Nanoaggregates: Influence of Surface Oxygen on Cata...
 
Nitrogen-Enriched Carbon Nanobubbles and Nanospheres for Applications in Ener...
Nitrogen-Enriched Carbon Nanobubbles and Nanospheres for Applications in Ener...Nitrogen-Enriched Carbon Nanobubbles and Nanospheres for Applications in Ener...
Nitrogen-Enriched Carbon Nanobubbles and Nanospheres for Applications in Ener...
 
Boosting Photocatalytic Activity Using Carbon Nitride Based 2D/2D van der Waa...
Boosting Photocatalytic Activity Using Carbon Nitride Based 2D/2D van der Waa...Boosting Photocatalytic Activity Using Carbon Nitride Based 2D/2D van der Waa...
Boosting Photocatalytic Activity Using Carbon Nitride Based 2D/2D van der Waa...
 
Multifunctional materials for clean energy conversion
Multifunctional materials for clean energy conversionMultifunctional materials for clean energy conversion
Multifunctional materials for clean energy conversion
 
Surface fluorination of α-Fe2O3 using selectfluor for enhancement in photoele...
Surface fluorination of α-Fe2O3 using selectfluor for enhancement in photoele...Surface fluorination of α-Fe2O3 using selectfluor for enhancement in photoele...
Surface fluorination of α-Fe2O3 using selectfluor for enhancement in photoele...
 
On the study of phase and dimensionally controlled titania nanostructures syn...
On the study of phase and dimensionally controlled titania nanostructures syn...On the study of phase and dimensionally controlled titania nanostructures syn...
On the study of phase and dimensionally controlled titania nanostructures syn...
 
Air- and water-stable halide perovskite nanocrystals protected with nearly-m...
Air- and water-stable halide perovskite nanocrystals protected with  nearly-m...Air- and water-stable halide perovskite nanocrystals protected with  nearly-m...
Air- and water-stable halide perovskite nanocrystals protected with nearly-m...
 
Heterostructured HfO2/TiO2 spherical nanoparticles for visible photocatalytic...
Heterostructured HfO2/TiO2 spherical nanoparticles for visible photocatalytic...Heterostructured HfO2/TiO2 spherical nanoparticles for visible photocatalytic...
Heterostructured HfO2/TiO2 spherical nanoparticles for visible photocatalytic...
 

Recently uploaded

Unlocking the Potential: Deep dive into ocean of Ceramic Magnets.pptx
Unlocking  the Potential: Deep dive into ocean of Ceramic Magnets.pptxUnlocking  the Potential: Deep dive into ocean of Ceramic Magnets.pptx
Unlocking the Potential: Deep dive into ocean of Ceramic Magnets.pptxanandsmhk
 
Is RISC-V ready for HPC workload? Maybe?
Is RISC-V ready for HPC workload? Maybe?Is RISC-V ready for HPC workload? Maybe?
Is RISC-V ready for HPC workload? Maybe?Patrick Diehl
 
Physiochemical properties of nanomaterials and its nanotoxicity.pptx
Physiochemical properties of nanomaterials and its nanotoxicity.pptxPhysiochemical properties of nanomaterials and its nanotoxicity.pptx
Physiochemical properties of nanomaterials and its nanotoxicity.pptxAArockiyaNisha
 
Orientation, design and principles of polyhouse
Orientation, design and principles of polyhouseOrientation, design and principles of polyhouse
Orientation, design and principles of polyhousejana861314
 
Call Girls in Munirka Delhi 💯Call Us 🔝8264348440🔝
Call Girls in Munirka Delhi 💯Call Us 🔝8264348440🔝Call Girls in Munirka Delhi 💯Call Us 🔝8264348440🔝
Call Girls in Munirka Delhi 💯Call Us 🔝8264348440🔝soniya singh
 
Disentangling the origin of chemical differences using GHOST
Disentangling the origin of chemical differences using GHOSTDisentangling the origin of chemical differences using GHOST
Disentangling the origin of chemical differences using GHOSTSérgio Sacani
 
Call Girls in Mayapuri Delhi 💯Call Us 🔝9953322196🔝 💯Escort.
Call Girls in Mayapuri Delhi 💯Call Us 🔝9953322196🔝 💯Escort.Call Girls in Mayapuri Delhi 💯Call Us 🔝9953322196🔝 💯Escort.
Call Girls in Mayapuri Delhi 💯Call Us 🔝9953322196🔝 💯Escort.aasikanpl
 
CALL ON ➥8923113531 🔝Call Girls Kesar Bagh Lucknow best Night Fun service 🪡
CALL ON ➥8923113531 🔝Call Girls Kesar Bagh Lucknow best Night Fun service  🪡CALL ON ➥8923113531 🔝Call Girls Kesar Bagh Lucknow best Night Fun service  🪡
CALL ON ➥8923113531 🔝Call Girls Kesar Bagh Lucknow best Night Fun service 🪡anilsa9823
 
Call Girls in Munirka Delhi 💯Call Us 🔝9953322196🔝 💯Escort.
Call Girls in Munirka Delhi 💯Call Us 🔝9953322196🔝 💯Escort.Call Girls in Munirka Delhi 💯Call Us 🔝9953322196🔝 💯Escort.
Call Girls in Munirka Delhi 💯Call Us 🔝9953322196🔝 💯Escort.aasikanpl
 
Behavioral Disorder: Schizophrenia & it's Case Study.pdf
Behavioral Disorder: Schizophrenia & it's Case Study.pdfBehavioral Disorder: Schizophrenia & it's Case Study.pdf
Behavioral Disorder: Schizophrenia & it's Case Study.pdfSELF-EXPLANATORY
 
TOPIC 8 Temperature and Heat.pdf physics
TOPIC 8 Temperature and Heat.pdf physicsTOPIC 8 Temperature and Heat.pdf physics
TOPIC 8 Temperature and Heat.pdf physicsssuserddc89b
 
Genomic DNA And Complementary DNA Libraries construction.
Genomic DNA And Complementary DNA Libraries construction.Genomic DNA And Complementary DNA Libraries construction.
Genomic DNA And Complementary DNA Libraries construction.k64182334
 
Analytical Profile of Coleus Forskohlii | Forskolin .pdf
Analytical Profile of Coleus Forskohlii | Forskolin .pdfAnalytical Profile of Coleus Forskohlii | Forskolin .pdf
Analytical Profile of Coleus Forskohlii | Forskolin .pdfSwapnil Therkar
 
Boyles law module in the grade 10 science
Boyles law module in the grade 10 scienceBoyles law module in the grade 10 science
Boyles law module in the grade 10 sciencefloriejanemacaya1
 
SOLUBLE PATTERN RECOGNITION RECEPTORS.pptx
SOLUBLE PATTERN RECOGNITION RECEPTORS.pptxSOLUBLE PATTERN RECOGNITION RECEPTORS.pptx
SOLUBLE PATTERN RECOGNITION RECEPTORS.pptxkessiyaTpeter
 
Call Us ≽ 9953322196 ≼ Call Girls In Mukherjee Nagar(Delhi) |
Call Us ≽ 9953322196 ≼ Call Girls In Mukherjee Nagar(Delhi) |Call Us ≽ 9953322196 ≼ Call Girls In Mukherjee Nagar(Delhi) |
Call Us ≽ 9953322196 ≼ Call Girls In Mukherjee Nagar(Delhi) |aasikanpl
 
STERILITY TESTING OF PHARMACEUTICALS ppt by DR.C.P.PRINCE
STERILITY TESTING OF PHARMACEUTICALS ppt by DR.C.P.PRINCESTERILITY TESTING OF PHARMACEUTICALS ppt by DR.C.P.PRINCE
STERILITY TESTING OF PHARMACEUTICALS ppt by DR.C.P.PRINCEPRINCE C P
 
Work, Energy and Power for class 10 ICSE Physics
Work, Energy and Power for class 10 ICSE PhysicsWork, Energy and Power for class 10 ICSE Physics
Work, Energy and Power for class 10 ICSE Physicsvishikhakeshava1
 

Recently uploaded (20)

The Philosophy of Science
The Philosophy of ScienceThe Philosophy of Science
The Philosophy of Science
 
Unlocking the Potential: Deep dive into ocean of Ceramic Magnets.pptx
Unlocking  the Potential: Deep dive into ocean of Ceramic Magnets.pptxUnlocking  the Potential: Deep dive into ocean of Ceramic Magnets.pptx
Unlocking the Potential: Deep dive into ocean of Ceramic Magnets.pptx
 
Is RISC-V ready for HPC workload? Maybe?
Is RISC-V ready for HPC workload? Maybe?Is RISC-V ready for HPC workload? Maybe?
Is RISC-V ready for HPC workload? Maybe?
 
Physiochemical properties of nanomaterials and its nanotoxicity.pptx
Physiochemical properties of nanomaterials and its nanotoxicity.pptxPhysiochemical properties of nanomaterials and its nanotoxicity.pptx
Physiochemical properties of nanomaterials and its nanotoxicity.pptx
 
Orientation, design and principles of polyhouse
Orientation, design and principles of polyhouseOrientation, design and principles of polyhouse
Orientation, design and principles of polyhouse
 
Call Girls in Munirka Delhi 💯Call Us 🔝8264348440🔝
Call Girls in Munirka Delhi 💯Call Us 🔝8264348440🔝Call Girls in Munirka Delhi 💯Call Us 🔝8264348440🔝
Call Girls in Munirka Delhi 💯Call Us 🔝8264348440🔝
 
Disentangling the origin of chemical differences using GHOST
Disentangling the origin of chemical differences using GHOSTDisentangling the origin of chemical differences using GHOST
Disentangling the origin of chemical differences using GHOST
 
Call Girls in Mayapuri Delhi 💯Call Us 🔝9953322196🔝 💯Escort.
Call Girls in Mayapuri Delhi 💯Call Us 🔝9953322196🔝 💯Escort.Call Girls in Mayapuri Delhi 💯Call Us 🔝9953322196🔝 💯Escort.
Call Girls in Mayapuri Delhi 💯Call Us 🔝9953322196🔝 💯Escort.
 
CALL ON ➥8923113531 🔝Call Girls Kesar Bagh Lucknow best Night Fun service 🪡
CALL ON ➥8923113531 🔝Call Girls Kesar Bagh Lucknow best Night Fun service  🪡CALL ON ➥8923113531 🔝Call Girls Kesar Bagh Lucknow best Night Fun service  🪡
CALL ON ➥8923113531 🔝Call Girls Kesar Bagh Lucknow best Night Fun service 🪡
 
Call Girls in Munirka Delhi 💯Call Us 🔝9953322196🔝 💯Escort.
Call Girls in Munirka Delhi 💯Call Us 🔝9953322196🔝 💯Escort.Call Girls in Munirka Delhi 💯Call Us 🔝9953322196🔝 💯Escort.
Call Girls in Munirka Delhi 💯Call Us 🔝9953322196🔝 💯Escort.
 
Behavioral Disorder: Schizophrenia & it's Case Study.pdf
Behavioral Disorder: Schizophrenia & it's Case Study.pdfBehavioral Disorder: Schizophrenia & it's Case Study.pdf
Behavioral Disorder: Schizophrenia & it's Case Study.pdf
 
TOPIC 8 Temperature and Heat.pdf physics
TOPIC 8 Temperature and Heat.pdf physicsTOPIC 8 Temperature and Heat.pdf physics
TOPIC 8 Temperature and Heat.pdf physics
 
Genomic DNA And Complementary DNA Libraries construction.
Genomic DNA And Complementary DNA Libraries construction.Genomic DNA And Complementary DNA Libraries construction.
Genomic DNA And Complementary DNA Libraries construction.
 
Analytical Profile of Coleus Forskohlii | Forskolin .pdf
Analytical Profile of Coleus Forskohlii | Forskolin .pdfAnalytical Profile of Coleus Forskohlii | Forskolin .pdf
Analytical Profile of Coleus Forskohlii | Forskolin .pdf
 
Boyles law module in the grade 10 science
Boyles law module in the grade 10 scienceBoyles law module in the grade 10 science
Boyles law module in the grade 10 science
 
SOLUBLE PATTERN RECOGNITION RECEPTORS.pptx
SOLUBLE PATTERN RECOGNITION RECEPTORS.pptxSOLUBLE PATTERN RECOGNITION RECEPTORS.pptx
SOLUBLE PATTERN RECOGNITION RECEPTORS.pptx
 
Call Us ≽ 9953322196 ≼ Call Girls In Mukherjee Nagar(Delhi) |
Call Us ≽ 9953322196 ≼ Call Girls In Mukherjee Nagar(Delhi) |Call Us ≽ 9953322196 ≼ Call Girls In Mukherjee Nagar(Delhi) |
Call Us ≽ 9953322196 ≼ Call Girls In Mukherjee Nagar(Delhi) |
 
Engler and Prantl system of classification in plant taxonomy
Engler and Prantl system of classification in plant taxonomyEngler and Prantl system of classification in plant taxonomy
Engler and Prantl system of classification in plant taxonomy
 
STERILITY TESTING OF PHARMACEUTICALS ppt by DR.C.P.PRINCE
STERILITY TESTING OF PHARMACEUTICALS ppt by DR.C.P.PRINCESTERILITY TESTING OF PHARMACEUTICALS ppt by DR.C.P.PRINCE
STERILITY TESTING OF PHARMACEUTICALS ppt by DR.C.P.PRINCE
 
Work, Energy and Power for class 10 ICSE Physics
Work, Energy and Power for class 10 ICSE PhysicsWork, Energy and Power for class 10 ICSE Physics
Work, Energy and Power for class 10 ICSE Physics
 

Characterization Techniques for Nano- and Atomic-Scale Catalysts

  • 1. Chapter 2 State of the Art in the Characterization of Nano- and Atomic- Scale Catalysts Devika Laishram, Divya Kumar, Unnati Gupta, R. Krishnapriya, and Rakesh K. Sharma* Sustainable Materials and Catalysis Research Laboratory (SMCRL), Department of Chemistry, Indian Institute of Technology Jodhpur, Jodhpur, India 342037 *Email: rks@iitj.ac.in Nanometer and subnanometer particles and films are becoming an essential and integral part of new technologies and inventions in different areas. Some of the most common areas include the microelectronic industry, magnetic recordings, photovoltaic applications, and optical coatings. Because of the ultrasmall size at atomic levels, the effect of quantum size becomes prominent, and the sensitivity of size is defined even by a difference of a single atom. Additionally, the effect is of utmost importance as the single-atom catalysts are far more advantageous than conventional catalysts as they tend to anchor easily because of their low coordination. Also, the presence of a single-atom catalyst in reactions creates efficient charge transfer as it forms a strong interaction with the support. Furthermore, catalysts in the subnanometer regime exhibit different electronic states and adsorption capabilities compared to traditional catalysts. Therefore, to fully appreciate the subnanometer catalysis reactions, it is essential to study the meansofcharacterizingthepreparedsubnanocatalysts,inordertocharacterizethe materials in their as-synthesized form, to obtain a precise and accurate analysis; these are some of the fundamental requirements for achieving an optimum performance. The physical properties of many interesting materials for advanced technological usage are highly governed by the distribution and placement of atoms. Superior techniques such as high-resolution transmission electron microscopy and high-angle annular dark-field scanning transmission electron microscopy and infrared and X-ray absorption spectroscopic techniques provide electronic and geometric configurations and also reveal the transformation of the subnano catalysts on the support material. Modeling methods such as density functional theory can successfully predict the electronic structure and geometric configuration of the catalyst, which in turn influence the selectivity and activity of the catalyst. Thus, understanding the characterization techniques gives the ability to understand, identify, and measure the local environment of individual atoms and the interaction with the surface support, which will give fundamental knowledge and insights in the realms of nanoscience and technology, materials science, chemistry, and physics. Therefore, detection and enhanced measurement © 2020 American Chemical Society Downloaded via UNIV OF CALGARY on September 25, 2022 at 15:51:41 (UTC). See https://pubs.acs.org/sharingguidelines for options on how to legitimately share published articles. Sudarsanam and Singh; Advanced Heterogeneous Catalysts Volume 1: Applications at the Nano-Scale ACS Symposium Series; American Chemical Society: Washington, DC, 2020.
  • 2. of individual atoms is inherently challenging and is a prerequisite to the development of new technology and better performing materials. In this chapter, we have discussed various important methods of characterization for characterizing subnanometer and atomic catalysts. Introduction Nanomaterials and nanochemistry have evolved gigantically over the past few decades, especially in terms of synthesis, fabrication, characterization, and application in devices. This is a consequence of the extensive and exhaustive research that has been carried out, leading to a better understanding of the properties that the materials exhibit in the nano regime. Thus, size influenced the properties, and the occurrence of size-dependent phenomena such as quantum effects and surface plasmons can rationally be understood. Materials that earlier existed in bulk form can now be transformed into nanosized materials with enhanced properties, such as useful semiconductors (1), single-atom catalysts (2), transition metals (3), and noble metals (4). Other examples include the use of two-dimensional (2-D) materials such as graphene, which has revolutionized the world with its properties (5). When materials start existing as a single atom, then it represents the smallest quantum retaining the characteristics of the material via its local electronic environment (6). In the field of heterogeneous catalysis, it is important to reduce the size of the catalyst and disperse it finely over a larger area of the support such as metal to improve the performance (7). Such a distribution impacts the use of its different active sites, affecting the selectivity. Thus, the size becomes the critical determining factor. It is vital to describe active centers for effective catalytic processes and high performance (8–10), and hence precision and control at the atomic level are necessary (9). Conventional systems of characterization, because of their inherent limitations in regards to accuracy and resolution, cannot be used to observe at the subnano level and other single- atom catalysts (11). Therefore, new sensitive techniques need to be implemented to characterize, analyze, and understand these single and nano atom catalysts in order to effectively utilize them to their maximum potential. Additionally, due to their distinctive characteristics and behavior at the atomic level, the selectivity, activity, and stability change drastically. These single-atom catalysts offer more exposed reactive sites for catalytic reactions, unlike conventional nanoparticles, which suffer from excessive aggregation, leading to fewer exposed active sites. The catalysts at the subnano level and single-atom catalysis have brought about high activity and selectivity in the field of heterogeneous catalysts. To fully understand and analyze these materials, many approaches have been established with the rapid advancement and development in characterization methods. Some of the characterization techniques discussed in this chapter include high-resolution scanning tunneling microscopy (STM), high-angle annular dark-field scanning transmission electron microscopy (HAADF-STEM), extended X-ray absorption fine structure (EXAFS), diffuse reflectance infrared Fourier transform spectroscopy (DRIFTS), X-ray photoelectron spectroscopy (XPS), NMR spectroscopy, and density functional theory (DFT) as a theoretical tool. The capacity to probe materials at the subnano level provides a huge understanding of the electronic structure and important chemical information and interaction of the molecules and the surface, which provide a deeper level of understanding of the atomic origins and their role in material properties. 52 Sudarsanam and Singh; Advanced Heterogeneous Catalysts Volume 1: Applications at the Nano-Scale ACS Symposium Series; American Chemical Society: Washington, DC, 2020.
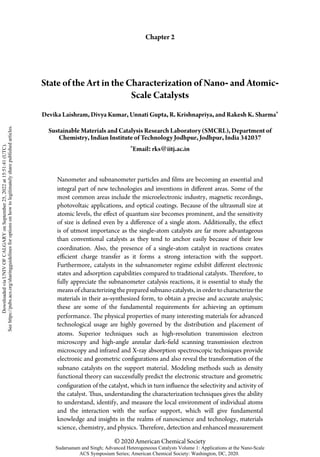
  • 3. Characterization Techniques Electron Microscopy and Associated Techniques Electron microscopy is instrumental for the characterization of a supported metal catalyst such as noble metal catalysts. It is an important tool for identifying the presence of single-atom catalysts from clusters or nanoparticles, especially for noble metals like Pt, Rh, and Pd. It is a powerful method for determining the spatial distribution of the single-atom catalysts and identifying the location of a single-atom catalyst in the support (6, 12). Furthermore, electron microscopy, along with associated techniques, can provide information such as the electronic state within the area of interest and other atomic-range information such as structure and morphology. Qiao et al. (13) utilized aberration-corrected scanning transmission electron microscopy (STEM), having a sub-angstrom resolution, to identify and locate Pt atoms on the surface of an iron oxide (FeOx) catalyst. The atomic-resolution HAADF provides enhanced contrast at low atomic numbers, unlike conventional TEM imaging, and also can identify the heavy atoms in the catalyst. The electrons scattered by the nuclei of the atom are detected using HAADF. The electrons are incoherent and quasi-elastic, mainly contributed by scattering at high angles of more than 80 mrad. Stroppa et al. (14) analyzed the three-dimensional morphology of faceted, nanocrystalline CeO2 material using high-resolution scanning transmission electron microscopy (HAADF-HRSTEM). They were able to achieve this by determining the atomic column via a Gaussian mixture model (GMM), which is a parametric probability density function represented as a weighted sum of Gaussian component densities. The parameters of GMM are estimated using the iterative expectation-maximization algorithm or maximum a posteriori estimation from a well-trained prior model (15). In this work for the estimation of atomic column thickness, the integrated intensities wereclassifiedasahistogram,andthedata-fittingprocedurewascarriedoutbyusingmultiplenormal distributions according to GMM (16). To optimize the model parameters, multiple runs of the GMM algorithm were performed. Later, each atomic column thickness was assigned to a Gaussian distribution (14), followed by identifying and assigning atomic positions using a crystallographic symmetric operation to construct the morphological model representation in three-dimensional (3-D) form. The HAADF-HRSTEM method of imaging is advantageous as it allows imaging of atomic columns directly at up to 50 pm resolution (17). The atomic number and the thickness of the atomic columns are measured from the intensity of the high-angle scattered electrons (18, 19). Thus, it allows reconstruction from an image or set of images of the nanocrystals by using crystallographic symmetry in combination with the HAADF intensity profile (20). However, there is still a limitation to the use of electron microscopy for determining 3-D structure, except for a few selected systems such as lightweight atoms having thin layers and specific Au clusters. For example, Figures 1a and 1b represent CeO2 HAADF-HRSTEM images in which the atomic Ce columns are fairlydistinguishabletobepolyhedralandcubic-typenanocrystals.Thisisachievedbyacombination oftheelectronimagingconfigurationandhigh-anglescatteringofelectrons,dependingontheatomic weight. The Fourier transform (FT), inset of Figures 1a and 1b, establishes the atomic plane index and the orientation of the zonal axis (14). Additionally, HAADF-STEM gives information about the local chemistry and structure at the atomic level, which gives a comprehension of localization of single atoms. Ni atoms located on nanoporous graphene by substituting a carbon site in the carbon lattice provides stability of Ni atoms (21). 53 Sudarsanam and Singh; Advanced Heterogeneous Catalysts Volume 1: Applications at the Nano-Scale ACS Symposium Series; American Chemical Society: Washington, DC, 2020.
  • 4. Figure 1. HAADF-HRSTEM images of CeO2: (a) polyhedra and (b) cubic nanocrystals. The inset represents the FT images defining the zonal axes and the corresponding crystallographic planes. Reproduced with permission from ref. (14). Copyright 2013 Springer. Li et al. (22) used HAADF STEM to locate the Pt atom distribution over a g-C3N4 support, where Pt atoms are uniformly dispersed, as confirmed by the bright spots. The existence of isolated Pt atoms was confirmed by the size of the Pt of less than 0.2 nm. However, with an increase in Pt loading, the spots become denser, implying the formation of subnanometer clusters of Pt. Similarly, Kumskov et al. (23) used a combination of HRSTEM and electron energy loss spectroscopy to identify the structure of a one-dimensional (1-D) unit cell of CuI nanocrystals having space group Pmmm inside single-walled carbon nanotubes (SWCNTs), as shown in Figure 2. By simultaneously using both the dark and bright field modes of HRTEM, images can be observed with an enhanced contrast, such as in cases where small and drowned crystalline features need to be observed. Thus, rapidly developing technologies such as HAADF-STEM enable the study of metal atoms anchored on a structural support utilizing coordination with the center atom (24, 25). Additionally, researchers can understand the structural evolution dynamics of the nanosystem. Liu et al. (26) found that the evolution of Pt species and its stabilization on MCM-22 zeolites can be studied. Consequently, HAADF-STEM can be a highly functional and useful technique for exploring the dynamic interaction of metal and substrate and other changes such as oscillatory behavior and change in the shape of metal nanoparticles. Thus, it can be concluded that STEM with an annular detector such as the HAADF has the advantage of sequential scans using a beam of highly focused electrons over a selected area. The detectors are designed to acquire electrons from various scattering angles other than the original propagating beam. This technique allows the user to acquire images by collecting electrons that had undergone various types of diffraction and scattering processes and provide highly vital physical 54 Sudarsanam and Singh; Advanced Heterogeneous Catalysts Volume 1: Applications at the Nano-Scale ACS Symposium Series; American Chemical Society: Washington, DC, 2020.
  • 5. information when the electrons interact with the sample. Additionally, the ability to reconstruct a 3-D morphology from an HAADF-HRSTEM image is a major advantage of this characterization method. Figure 2. 1-D CuI inside an SWCNT as seen in an HRSTEM image in (a) bright field mode and (b) dark field mode with a simulated model of the CuI unit cell. Adapted with permission from ref. (23). Copyright 2016 Wiley. Scanning Tunneling Microscopy The STM technique is used to image the supported individual metal atoms (27, 28). STM generally runs at low temperature under ultrahigh vacuum to enhance the resolution of STM to examine single atoms (29, 30). Lucci et al. (31) used STM to identify a single Pt atom deposited on Cu(111) surfaces. The result obtained by STM imaging showed that at low Pt coverage (0.02 monolayer), the Pt atoms exist as individual and isolated species substituted in the Cu surface lattice, so this is referred to as a “single-atom alloy” (SAA) (32). The Pt atoms were added into Cu(111) terraces and in the areas above the surface edges by place exchange (Figure 3a,b). STM imaging can allow visualization of the atomic-scale structure of surfaces around single atoms during reactions. It helps in the examination of reaction mechanisms and single-atom sintering (33). Lucci et al. (31) studied the ability of Pd monomers (Pd coverage ≤ 0.05 monolayer) to exist as isolated atoms substituted into the Au lattice (34–36). At Pd coverage greater than 0.05 monolayer, Pd atoms start to form clusters due to kinetic limitations (37) on a Au(111) surface for H2 activation (38). Here STM was utilized to visualize the atomic composition of the active sites directly. The result clearly is shown, withthehelpofcouplinghigh-resolutionSTMandtemperature-programmeddesorption,thatatlow concentration the individual and isolated Pd atoms dissociate H2, as the absorbed concentration of H atoms was proportional to the surface Pd atoms in Au. Liu et al. (39) using STM investigated the atomic-scale interactions of CO and H with Pt catalytic sites on Pt-Cu(111) SAA surfaces (Figure 3c–e) and suggested that the selective adsorption of CO took place on Pt sites and that H atoms were capable of diffusing into Cu sites. STM is a surface-science technique. STM analysis can have a lateral resolution of 0.1 nm and depth resolution of 0.01 nm (10 pm) (25). STM can do characterization of catalysts with a uniform, flat structure. It can investigate both geometric and electronic structures and helps in the identification of elements with close atomic numbers (40). For example, N-doped carbon materials, which are one of the typical metal-free catalysts, to make N atoms visible in them, are important 55 Sudarsanam and Singh; Advanced Heterogeneous Catalysts Volume 1: Applications at the Nano-Scale ACS Symposium Series; American Chemical Society: Washington, DC, 2020.
  • 6. for the identification of active sites. Deng et al. (41) used low-temperature STM to examine the N- doped graphene at the atomic scale. The area brighter than the main 2-D graphene network (Figure 4a) indicated the presence of defects and that the electronic structure of N-doped graphene was disturbed by N-dopants. The sizes of the bright areas were smaller than 0.5 nm. DFT calculations were performed to gain further insight into the doping effect on the structure of graphene. So via STM simulations (Figure 4b), the bright spots were found to be C atoms adjacent to N, and the C atoms exhibited higher brightness because of the increased electron density of states near the Fermi level (42). Zhao et al. (43) also reported a low-temperature STM investigation of N-doped graphene derived by chemical vapor deposition. It showed a local structure of one N atom as a bright triangular spot confined in the graphene lattice (Figure 4c), confirmed by their STM simulations (Figure 4d). STM has proven to be an important spectroscopy technique to explore the surface science and imagingsurfacesattheatomiclevel.Throughthistechnique,individualatomswithinmaterialscanbe imaged, visualizing the atomic composition of the active site, manipulated by changing the working conditions, such as ultrahigh vacuum, air, water, and various other liquids and gases (44). Figure 3. (A) STM image of Pt/Cu(111) SAA surface in which Pt atoms appear as isolated protrusions substituted into Cu. (B) STM image showing H atom spillover onto Cu; H appears as clusters. Pt appears as protrusions, and (C–E) STM shows adsorption of H and CO on Pt-Cu(111) SAA surface. (A,B) Adapted with permission from ref. (31). Copyright 2015 Nature Publishing Group. (C–E) Adapted with permission from ref. (39). Copyright 2016 American Chemical Society. Scanning Electron Microscopy with Energy-Dispersive X-ray Spectroscopy Scanning electron microscopy along with energy-dispersive X-ray spectrometry (SEM-EDX) helps in investigating the morphology and dispersion of nanoparticles (NPs) on a surface, accurately measuring the lateral dimensions of NPs, and studying their elemental composition (45). SEM helps in the analysis of the morphology and topography and provides information about the crystallographic nature of the analyzed specimens (46). Tang et al. (47) investigated the use of a Pd/CeO2 nanocatalyst for the development and optimization of a novel solid-phase activation 56 Sudarsanam and Singh; Advanced Heterogeneous Catalysts Volume 1: Applications at the Nano-Scale ACS Symposium Series; American Chemical Society: Washington, DC, 2020.
  • 7. method for lignite-derived humic acid. The morphology and elemental composition of the NPs were analyzed by SEM-EDX. The SEM-EDX of CeO2 and Pd/CeO2 are shown in Figure 5i.a–d. The EDX spectra from the synthesized CeO2 show Ce and O, indicating the high purity of the as- synthesized samples. After the addition of Pd, then Pd, O, and Ce were observed (Figure 5i.b,d). The EDX spectra confirmed that the Pd NPs were highly dispersed on the surface of the CeO2 support, which corresponded with the result obtained from the HR-TEM image. Han et al. (48) synthesized MgF2 fibers and subnano MgF2 embedded in carbon nanofibers by one-step electrospinning. For the morphology investigation, an SEM at an accelerating voltage of 15 kV equipped with EDX was used. The elemental mapping analysis revealed the composition of the fibers, namely C, F, and Mg. Trace amounts of impurity, oxygen, and copper were detected. The atomic contents of C, O, F, and Mg were determined to be 78.6%, 1.5%, 12.2%, and 7.8%, respectively. From the mapping analysis, it is noticeable that MgF2 is uniformly distributed in the carbon structure. SEM images show that the fibers obtained are straight, smooth, and clear (Figure 5ii.a,b,d,e,g,h). The average diameter of the fibers was 171 nm (Figure 5ii.c), which decreases to 148 nm after calcinating at 650 °C in N2 (Figure 5ii.f), keeping the morphology almost unchanged. The structure of the fiber is also preserved on calcination in air at 650 °C (Figure 5ii.g,h). Lastly, MgF2 is fabricated with a decrease in diameter from 171 nm to 106 nm (Figure 5ii.i). Figure 4. (a) STM image of N-doped graphene. (b) Simulated image of (a). (c) STM image of N-doped graphene (derived by chemical vapor deposition). (d) Simulated image of (c). (a, b) Adapted with permission from ref. (41). Copyright 2011 American Chemical Society. (c, d) Adapted with permission from ref. (43). Copyright 2011 American Association for the Advancement of Science. Klaysri et al. (49) studied the synthesis of N-doped and Si-doped TiO2 nanocatalyst powdered and grafted onto a poly(methyl methacrylate) film. SEM-EDX was used to investigate the morphology and the elemental composition of particles grafted onto the film. The SEM image showed that the grafting process successfully grafted the TiO2 particle onto the film. The EDX estimated the bulk composition on the poly(methyl methacrylate) film, and the SEM images corresponded with the EDX result. Pascariu et al. (50) prepared Ni/Co codoped ZnO NPs via the coprecipitation method. SEM-EDX was used to analyze their structural and morphological 57 Sudarsanam and Singh; Advanced Heterogeneous Catalysts Volume 1: Applications at the Nano-Scale ACS Symposium Series; American Chemical Society: Washington, DC, 2020.
  • 8. properties. SEM was carried out in a high vacuum at a suitable acceleration voltage, and the elemental mapping was collected at magnification ×10,000 with a large acquisition time (more than 80,000 counts). In the SEM images, it was observed that the doped ZnO nanoparticles are rod-like, and the concentration of dopants moderately influenced their size, morphology, and aggregation degree (Figure 6a–d). A lower concentration of dopants leads to smaller nanorods, and as the concentration increases, the nanorods become more homogeneous in shape and size and agglomerate less. EDX was used for a composition characterization of Ni/Co codoped ZnO nanoparticles, and the chemical mapping showed the doping homogeneity of Zn, O, Ni, and Co. Blass et al. (51) synthesized lanthanide (Ln = La, Eu, Gd, Dy, and Ho) loaded ZnO catalysts (Ln-ZnO) and characterized them. SEM-EDX micrographs and elemental mapping analysis were used to investigate the morphologies of 0.25 M ZnO and 1% Ln-ZnO catalyst. In 0.25 M ZnO, the NPs were spherical, and EDX analysis detected Zn and O. However, the addition of Ln ions changed the structure. It was observed that the NPs accumulated in certain regions with smaller grain sizes, which were interpreted as available adsorption sites. The EDX analysis showed La, Eu, Gd, Dy, and Ho in addition to Zn and O. The combination of SEM imaging and elemental analysis by EDS spectroscopy has been widely used for the characterization of nanocatalysts. Figure 5. (i) SEM-EDX of CeO2 and Pd/CeO2 catalyst: (a) SEM image CeO2 catalyst. (b) EDX spectrum of square portion of (a). (c) SEM image of Pd/CeO2 catalyst. (d) EDX spectrum of square portion of (c). Reproduced with permission from ref. (47). Copyright 2017 American Chemical Society. (ii) SEM images of nanofibers (a,b,d,e,g,h), and diameter distributions of fibers (c,f,i). Reproduced with permission from ref. (48). Copyright 2017 Royal Society of Chemistry. Energy Dispersive X-ray Spectroscopy Energy dispersive X-ray spectroscopy plays a vital role in the qualitative and quantitative elemental analysis of NPs, and it helps in determining their composition and confirming the stoichiometry (52, 53). Characteristics of the elements are represented by the X-rays emitted from the atoms, and their intensity distribution represents the thickness-projected atom densities in the specimen (54). Nadjia et al. (53) synthesized CeO2 NPs in an alkaline medium by using the homogeneous precipitation method and later calcinated the same at 80 °C for 24 h (CeO2-80) and 500 °C for 2 h (CeO2-500). Here the EDX technique was used to confirm the stoichiometry of CeO2 NPs, carried out at 20 kV. The EDX technique was used to investigate the atomic concentration of Ce and O on the top layer surface of CeO2-500 (Figure 7a). The atomic abundances of Ce and O present on the uppermost surface and in the bulk layers of CeO2-500 were compared, and the data 58 Sudarsanam and Singh; Advanced Heterogeneous Catalysts Volume 1: Applications at the Nano-Scale ACS Symposium Series; American Chemical Society: Washington, DC, 2020.
  • 9. revealed that the surface O/Ce ratio (2.13) was close to the bulk O/Ce ratio (2.00), suggesting that the samples have an intrinsic effect that would affect their photocatalytic activity. Figure 6. SEM-EDX characterization, elemental mapping, and spectrum of Ni/Co doped ZnO nanoparticles with different concentrations of dopant. Reproduced with permission from ref. (50). Copyright 2019 Elsevier. Mahajan et al. (55) prepared Pd NPs with a varying diameter (6.9–25.1 nm) in the presence of poly(vinyl alcohol) by a single-pot wet chemical technique, followed by adsorption on Ni foil. The investigation of the morphology and surface characteristics of the Pd nanocatalyst was done by electron microscopy in conjunction with energy dispersion spectroscopy. The EDX study analyzed the surface composition of each electrode. As shown in Figure 7b, the atomic ratio of C:O for all electrodes was around 2:1, indicating the coexistence of poly(vinyl alcohol) with NPs of metal adsorbed on the surface of Ni. From the data computed based on the EDX data (Figure 7c), it was revealed that with an increase in particle diameter, the moles of Pd adsorbed per unit area increases initially, and it decreases quickly when the average diameter reaches 21.3 nm because of less interaction with poly(vinyl alcohol) and the Ni surface. Ganeev et al. (56) presented the results of systematic studies of the nonlinear optical properties of BaTiO3 and SrTiO3 nanoparticles and studied their structural characteristics. By using EDX spectroscopy, they did the elemental analysis of the NPs and confirmed the presence of BaTiO3 and SrTiO3. Rahman et al. (57) synthesized a magnetically separable spinel CuFe2O4 nanocatalyst by the coprecipitation method and characterized it. The EDX spectra of the spinel CuFe2O4 nanoparticle confirmed the presence of copper, iron, and oxygen with an oxygen:copper ratio of approximately 2:1 (Figure 8a). Similarly, Khazaei et al. (58) reported a green, solvent-free synthesis of polyhydroquinoline using a nano-CoAl2O4 catalyst. Here also EDX was used for elemental analysis 59 Sudarsanam and Singh; Advanced Heterogeneous Catalysts Volume 1: Applications at the Nano-Scale ACS Symposium Series; American Chemical Society: Washington, DC, 2020.
  • 10. of nano-CoAl2O4, and the spectrum indicated the existence of cobalt, aluminum, and oxygen (Figure 8b). Valan et al. (59) synthesized spinel MnxCo1-xAl2O4 (x = 0, 0.3, 0.5) nanoparticles using the Sesamum indicum plant extracted by the microwave-assisted combustion method. EDX was used for the elemental composition analysis; the spectra showed the peaks of Mn, Co, Al, and O in the spinels CoAl2O4 and Mn0.5Co0.5Al2O4, and there is no other peak, confirming that the synthesized NPs are pure. In the spectrum of both samples, a small peak appeared at 2.1 kV, indicating the presence of Au (gold), which appeared because gold was used as a sputter coating while preparing the samples for high-resolution SEM imaging. Mainly EDX is used for elemental analysis of nanocatalysts. Figure 7. (a) EDX spectrum of CeO2-500 nanocatalyst. Reproduced with permission from ref. (53). Copyright 2018 Elsevier. (b) Table showing element atomic ratios of C:O. (c) Table showing the computed data based on EDX data. (b, c) Reproduced with permission from ref. (55). Copyright 2017 Elsevier. Figure 8. (a) SEM-EDX of CuFe2O4. Reproduced with permission from ref. (57). Copyright 2020 Springer. (b) EDX spectrum of the nano‐CoAl2O4. Reproduced with permission from ref. (58). Copyright 2017 Wiley. Tip-Enhanced Raman Spectroscopy Tip-enhanced Raman spectroscopy (TERS) is an optical imaging tool that can characterize nanomaterials through a plasmonic-nanocavity-generated confined electromagnetic field with interaction length on the order of subnanometers (60). This method can provide chemical sensitivity 60 Sudarsanam and Singh; Advanced Heterogeneous Catalysts Volume 1: Applications at the Nano-Scale ACS Symposium Series; American Chemical Society: Washington, DC, 2020.
  • 11. and an impressive spatial subnanometer resolution when used in combination with STM images (61). The combined advantages of Raman spectroscopy and scanning probe microscopy make TERS a powerful tool for analysis, providing high sensitivity and resolution for local investigation and imaging of materials such as 2-D monolayers, as shown in Figure 9 (62). Additionally, important chemical information can also be inferred because low-temperature TERS has a high spatial resolution with single-molecule sensitivity. Figure 9. Benefits of TERS in a Venn diagram and scheme representing the TERS for imaging monolayers. Reproduced with permission from ref. (62). Copyright 2019 Springer. Liu et al. (63) used tip-enhanced resonance Raman spectroscopy along with scanning tunneling spectroscopy to study epitaxially grown ZnO layers on a Ag(111) surface. Balois et al. (64) used a combination of TERS-based imaging and analysis to establish strain variations in defect-free monolayer graphene on a Au(111) substrate. As shown in Figure 10, TERS-based Raman spectra were recorded for graphene and bare Au(111). Three peaks (D, G, and 2D) are observed in Figure 10b from the TERS imaging observed upon averaging in three different domains. The authors report the disappearance of these peaks when the tip is far-field or retracted and thus can confirm the enhanced Raman signals. Additionally, intensity, Raman shift, and spectral width were also measured for all of the bands observed, which is essential as any change in chemical and mechanical interactions can be observed in the spectral lines (65). The line scan in Figure 10c shows 0.7 nm spatial resolution (64). 61 Sudarsanam and Singh; Advanced Heterogeneous Catalysts Volume 1: Applications at the Nano-Scale ACS Symposium Series; American Chemical Society: Washington, DC, 2020.
  • 12. Figure 10. (a) TERS on graphene (red), Au(111) substrate, and far-field Raman (tip retracted); (b) average TERS; (c) line profile of step response; and (d) long-exposure measurement of far-field Raman. Reproduced with permission from ref. (64). Copyright 2019 Nature Publishing Group. Ichimura et al. (65) performed a one-dimensional scan of SWCNTs to probe the extent of spatial resolution using TERS. Additionally, they also studied the mechanical and chemical interactions in nanocrystal adenine with a precise tip–sample distance. Figure 11 represents a schematic that Ichimura et al. used for analyzing with high precision by illuminating for a chosen tip–sample distance.Thetiposcillatessinusoidally,synchronizingwiththeopeningofthetimegate,asillustrated in Figure 11b (66). The temporal width (∆) and the time delay (τ) of the time gate are selected in accordance with the desired tip–sample distance. This is accomplished by feeding a trigger signal to the pulse generator extracted from the tip oscillation. This results in the synchronous generation of a pulse signal that controls an optical shutter via a modulator, which in turn performs the illumination depending on the tip–sample distance. Zhang et al. (67) used a high-quality and clean tip and sample under ultrahigh vacuum and low temperature for excellent reproducibility. They showed that the tip, when positioned on the bare surface, gives a featureless continuum spectrum, indicating that no molecules are present and the tip is free of contamination. However, on top of island molecules, vibrational fingerprints of molecules were visible in the TERS spectrum. These vibrational fingerprints are provided via STM-controlled TERS while employing an excitation field, which can be observed in the spectrum even under low bias voltage, and thus it can be inferred that the localized tunneling of electrons does not affect the TERS spectrum signals (67, 68). Consequently, numerous factors contribute to achieving a subnanometer resolution in TERS, such as nanofeatures on the substrate, step size of the mapping, thermal diffusion of the molecule, incident laser angle, and polarization. Additionally, an ultrahigh vacuum and low-temperature setup help to provide resolution down to subnanometers (69). Thus, it can be concluded that TERS is a powerful and versatile technique that incorporates and combines the advantageous features of various other techniques including SERS, Raman, and scanning probe microscopy. This 62 Sudarsanam and Singh; Advanced Heterogeneous Catalysts Volume 1: Applications at the Nano-Scale ACS Symposium Series; American Chemical Society: Washington, DC, 2020.
  • 13. amalgamation makes TERS a tool that is highly selective and sensitive with a high spatial resolution for characterization. Figure 11. (a) Tip–sample arrangement illuminated for predecided distance. (b) Illustration representing sinusoidal oscillation of the tip and synchronized opening of the time gate. (c) TERS using tapping mode and acoustic–optic modulator for time-gated illumination. Reproduced with permission from ref. (65). Copyright 2009 American Physical Society. X-ray Reflectometry X-ray reflectometry is a form of nondestructive characterization where X-rays are directed at varying angles and a photodiode detects the reflected radiation. X-ray reflectometry is a general tool for characterization of multilayers with angle-resolved XRF and can be suitably used to characterize multilayers with subnanometer thickness (70). Subnanomaterials used in multilayer interferential mirrors hold special importance as they are used for applications relating to plasma diagnostics, extreme ultraviolet (EUV) photolithography, and solar corona imaging, which uses the X-ray and EUV spectrum. In order to smooth interfaces and limit the interdiffusion, subnanometer-thick barrier layers are used in the EUV spectral region. Applications include hard X-ray telescopes (71), normal incidence broadband coatings (72), and grazing incidence mirrors (73). The grazing incidence X-ray reflectometer (GIXRF) shown in Figure 12 uses a shallow incidence angle for the primary X-ray radiation and can be used to define the thickness of subnanometer materials in a periodic structure. There is an enhancement of excitation due to X-ray standing wave formation, for which the essential requirement is the use of a low-divergence monochromatic primary beam generated by an X-ray tube or a synchrotron facility (74, 75). TheincidentandreflectedX-raybeamsinterfereatthelayerboundaries,leadingtotheformation of constructive and destructive nodes (76). GIXRF measures below the total angle of reflection and then surpasses it (77). In this technique, the sample is tilted at a defined angle with respect to the beam, with the detector placed above it. The detector, usually a silicon drift detector, is energy- dispersive. Emprin et al. (78) used a “Fabry–Perot” type structure to determine the thickness of 63 Sudarsanam and Singh; Advanced Heterogeneous Catalysts Volume 1: Applications at the Nano-Scale ACS Symposium Series; American Chemical Society: Washington, DC, 2020.
  • 14. subnanometers embedded between similar periodic multilayers. They used periodic chromium/ scandium layers with a Sc layer between with highly precise control for the study. Figure 12. Schematic diagram showing the geometry of GIXRF. Figure 13. Fabry–Perot type multilayer with Sc calibration layer positioned between two periodic multilayers ML1 and ML2. Reproduced with permission from ref. (78). Copyright 2014 Elsevier. The Fabry–Perot structure is as given in Figure 13, with the calibrating layer (LC), which is Sc, between multilayers ML1 and ML2. The acquisition and extinction of the Bragg peak is highly sensitive and dependent on the thickness of the layers, that is, dLC and dSC, and are synchronous to the phase of the waves reflected from ML2 and ML1. Haase et al. (79) used various characterization techniques such as EUV and X-ray reflectance to study Cr/Sc multilayer systems, which are useful as near-incidence mirrors. They were able to deduce that the individual layer was less than 1 nm. The GIXRF analysis uses fluorescence data with photons having an excitation energy of 6.25 keV. Using GIXRF, they successfully resolved the interdiffusion layer thickness, the Sc/Cr ratio, and the spatial arrangement of the multilayer structure. X-ray Absorption Spectroscopy X-ray absorption spectroscopic (XAS) analysis enables the element-specific atomic site analysis of the local structure and electronic characterization of metal nanoclusters. The XAS involves 64 Sudarsanam and Singh; Advanced Heterogeneous Catalysts Volume 1: Applications at the Nano-Scale ACS Symposium Series; American Chemical Society: Washington, DC, 2020.
  • 15. electronic transitions from core levels to the unoccupied valence states from the X-ray absorption process. Figure 14. (a) XAS spectrum consisting of both EXAFS and XANES with κ-space EXAFS spectrum on the inset. (b) L3-edge XANES spectra of a few 5d transition metals. (c) EXAFS spectrum with the best fit of Pd foil along with structure model. (d) Illustration demonstrating the simulated EXAFS with increasing coordination number. Reproduced with permission from ref. (80). Copyright 1992 American Chemical Society. A typical XAS spectrum is determined by two spectral regions: X-ray absorption near-edge structure (XANES) and extended X-ray absorption fine structure (EXAFS; Figure 14a). XANES provides the element-specific analysis by probing the electronic properties of absorbing atoms in the near-edge region. For instance, the intensity of the first spectral feature (Figure 14b) is sensitive to the unoccupied valence d state. By monitoring the intensity, holes in the d state can be ascertained. Accurate information on the local structure of absorbing atoms, for example, bond length and coordination number (Figure 14c,d), can be acquired by EXAFS (81). MacDonald et al. (82) conducted the first XAS study on truly monodispersed thiolate-protected Au144 nanoclusters (Au SR NCs). The structural information acquired by an EXAFS fitting analysis (Figure 15b) was consistent with the structural model determined by DFT given by Lopez and Acevedo (Figure 15a). A comparative study illustrating the electronic and bonding properties of Au144, Au38, and Au25 was done using Au L3-edge (Figure 15d) and S K-edge (Figure 15e) XANES (80). Later, MacDonald and coworkers (83, 84) also reported an EXAFS study for Au38 SR NCs (structural model shown in Figure 16a) in solid and toluene solution (Figure 16b). The solvation 65 Sudarsanam and Singh; Advanced Heterogeneous Catalysts Volume 1: Applications at the Nano-Scale ACS Symposium Series; American Chemical Society: Washington, DC, 2020.
  • 16. process of Au38 NCs resulted in the expansion of Au–Au bonds, sensitively probed by an EXAFS fitting analysis (80). Figure 15. (a) DFT-predicted structural model and (b) experimental and best-fit EXAFS of Au144. (c) DFT structural model simulated site-specific EXAFS. (d) Au L3-edge and (e) S K-edge XANES of Au144. Reproduced with permission from ref. (82). Copyright 2010 American Chemical Society. Figure 16. Structural model (a) and EXAFS (b) of Au38 in solid and solution phases. Adapted with permission from ref. (83). Copyright 2011 American Chemical Society. They also conducted a multishell EXAFS fitting strategy on Au25 SR NCs (Figure 17a) to monitor their structural change in different temperatures and solvent conditions. The site-specific simulation spectrum (Figure 17b) showed distinct EXAFS peaks corresponding to unique scattering paths, including Au-S and three Au-Au paths. EXAFS fitting results of the Au–thiolate cluster (Au SR NCs) in solution phase samples (toluene and acetonitrile as solvents) and solid phase at different temperatures (10 vs. 300 K) are compared in Figure 17c. It shows a general decrease in the bond length of the Au13 core [i.e., (Au–Au)1 and (Au–Au)2] with an accompanying increase in the Au(kernel)–Au(staple) [(Au–Au)3] bond length when solvated in toluene. When the Au SR NCs were solvated in polar solvent acetonitrile, further shrinkage of the Au13 core was noticed, with no effect on (Au–Au)3 relative to that of the solid phase. Overall, the structural changes in Au25 NCs 66 Sudarsanam and Singh; Advanced Heterogeneous Catalysts Volume 1: Applications at the Nano-Scale ACS Symposium Series; American Chemical Society: Washington, DC, 2020.
  • 17. illustrated the interplay of the “metallic” behavior of the Au13 core and the “molecular” behavior of the gold–thiolate ligand shell. Figure 17. Structural model (a) and simulated EXAFS (b) of Au25. (c) Bond distance fitting obtained from EXAFS of Au25 under various environments. Adapted with permission from ref. (84). Copyright 2011 American Chemical Society. Christensen et al. (85) used XAS to probe structure and bonding and Pt position in a thiolate- protected PtAu24(SR)18 nanocluster. The three possible locations of Pt dopant corresponded to different Pt-Au coordination number shown in Figure 18B–D. Au L3-edge EXAFS showed a narrowing line-shaped Au 4f peak of PtAu24 due to metal–metal bond contraction resulting from the Pt doping effect. It was also observed that the Au 4f peak shifted to lower binding energy, which could be related to the Pt-Au alloy bonding effect, as shown in Figure 18F. The XAS study by Chevrier and coworkers (86, 87) compared the structural and electronic property sensitivity with a small change in core size (C13 vs. C19) in gold–thiolate nanoclusters, Au19(SR)13 and Au25(SR)18, respectively (the structural model is shown in Figure 19a). Au19(SR)13 showed a different valence electron behavior with a narrowed and positively shifted band, illustrating themoremetallicnaturerelativetoAu25(SR)18,asshowninFigure19b.Further,amultishellEXAFS fit (Figure 19c) was conducted for a detailed correlation of electronic properties with atomic structure. The results revealed a considerable Au–Au bond expansion of surface–surface and the surface-stable Au atoms. In contrast, the bond distance between Au-S and center-surface (Au–Au) remains unchanged. Zhang et al. (88) demonstrated that encapsulation within carbon nanotubes facilitates the oxidation activity of Pt NCs. In situ XANES revealed that encapsulation restricted the Pt NC size to 1 nm and rewardingly enabled the retention of Pt species at an active reduced state, protected from oxygen up to 200 °C. The XANES spectrum of Pt/CNT and the reduced Pt@CNT catalyst exhibited features similar to that of Pt foil. The radial structural function comparison curves derived from the EXAFS function’s Fourier transform also suggested the Pt−Pt interaction and absence of Pt−O interaction. This confirmed the prior reduction of Pt clusters in both Pt@CNT and Pt/CNT. The Pt LIII-edge of Pt/CNT and the situ radial structural function revealed the appearance of the 67 Sudarsanam and Singh; Advanced Heterogeneous Catalysts Volume 1: Applications at the Nano-Scale ACS Symposium Series; American Chemical Society: Washington, DC, 2020.
  • 18. Pt−O scattering paths during toluene oxidation, which become more prominent on increasing the temperature. Figure 18. (A)–(D) Representations of structural models and CN values of Au25 and Au24Pt with varying dopant location. (E) Pt L3-edge EXAFS and its best fit of Au24Pt. (F) Au L3-edge EXAFS of Au25 and Au24Pt. Reproduced with permission from ref. (85). Copyright 2012 American Chemical Society. Meanwhile, the white-line intensity was enhanced, which reflected the 5d states’ unoccupancy and indicated the oxidation state variation. This confirmed the oxidation of Pt species over the CNT exterior walls. In contrast, the Pt−O scattering was not observed for Pt@CNTs even in oxygen up to 200 °C with no variation of the white-line intensity. Yamazoe et al. (89) used Au L3-edge EXAFS spectroscopy and corresponding FT-EXAFS spectra to investigate the bond stiffness and hierarchy in thiolate-protected gold clusters (Au SR NCs), namely Au25(SR)18, Au38(SR)24, and Au144(SR)60. The long Au–Au bonds of the icosahedron-based Au core surface were found to be flexible relative to the bulk metal, whereas the short Au–Au bonds distributed in the radial direction of the Au core were stiffer than those in the bulk metal and formed a ring structural backbone with the rigid Au-SR oligomeric framework that enhances Au-Sr NC thermal stability. The temperature dependence of the Debye–Waller factors of the individual bonds was analyzed within the Einstein model framework. It showed that the Einstein temperatures of the Au–Au(S) and Au–Au(L) bonds and that of Au–Au bonds in bulk Au were a function of cluster size. This plot indicated that Au–Au(S) and Au–Au(L) bonds were respectively stiffer and more flexible than the cubic bulk Au–Au bonds. The correlation suggested that the bond stiffness and bond length are correlated. This hypothesis was confirmed by plotting Einstein temperatures of Au–Au bonds as a function of their lengths. XAS analysis is used to probe materials and determines quantitative information for the local physical structure, shape, and electronic properties in supported metal nanostructures and bimetallic nanosystems. XAS spectroscopy provides insight into changes that occur in the local bonding 68 Sudarsanam and Singh; Advanced Heterogeneous Catalysts Volume 1: Applications at the Nano-Scale ACS Symposium Series; American Chemical Society: Washington, DC, 2020.
  • 19. environment by measuring accurately the bond distance. This helps in tailoring the structural properties of the metal nanoclusters with a change in the chemical environment. Figure 19. (a) Illustration representing structural models. (b) XPS valence band data of Au19 and Au25. (c) EXAFS and best fit. (d) Graph showing comparison of bond distance from the EXAFS fitting results of Au19 (stripes) and Au25 (red). Reproduced with permission from ref. (86). Copyright 2012 American Chemical Society. Infrared and Associated Spectroscopy Techniques Direct monitoring of the probe/adsorbed molecules interacting with the surface of supports such as metal catalysts is vital in the characterization of the metal catalyst (90). Infrared spectroscopy and its subsidiaries, in combination with investigative techniques, are powerful tools that provide a description of catalyst surface properties by monitoring the probe–surface interaction (91). This is an indirect method whereby the study of the surface is observed through the perturbation in the probe. The change in intensity of the probe and the vibrational frequency are monitored to infer the properties of the active centers (92). Techniques such as time- and temperature-resolved Fourier transform infrared spectroscopy can be used to monitor and study intermediate species formed in the reaction (93). The oxidation state and dispersion state of single-atom catalysts (SACs) are generally monitored by a gas like CO, whereby the initial state frequencies of CO change when it is bound to the SAC (94). As the vibration modes are highly sensitive to the adsorbed CO species, it effectively traces the reaction pathways on reactionscatalyzedbyCO.Itimperviouslyprovesthepresenceofsingle-sitecatalysts,eliminatingthe presence of nanoparticles (95). Thus, the IR technique can be successfully implemented for probing the electronic and structural states of the catalyst where CO adsorption on different metals leads to different vibration bands, which in turn affect the adsorption models and the electronic states in the IR spectra (96). For example, Yan et al. (96) found different adsorption bands depending on the adsorption model. Linear and bridge are observed; for example, ionic Pt, metallic Pt, and Pt clusters 69 Sudarsanam and Singh; Advanced Heterogeneous Catalysts Volume 1: Applications at the Nano-Scale ACS Symposium Series; American Chemical Society: Washington, DC, 2020.
  • 20. indicated different bands based on the absorption spectra. Thus, SACs having high dispersion indicated a strong signal for adsorption by ionic metals. Figure 20. Fourier transform infrared spectra of H2 adsorbed on (Na, K)-ETS (a) showing the effect of contact time (dashed line, immediately after dosage; bold line, after 10 h contact at 20 K; gray line, intermediate contact). (b) Effect of H2 equilibrium pressure at 20 K (bold line, maximum coverage; gray curves, reducing gas pressure; dashed curve, maximum intensity of 1:1 adduct). Reproduced with permission from ref. (97) and ref. (98). Copyright 2007 Royal Society of Chemistry. Ricchiardi et al. (97) reported adsorption of H2 on preactivated (Na, K)-ETS-10 at 623 K for 1 h, a self-supporting thin wafer having the chemical formula Na1.45K0.55TiSi5O13 (Engelhard Corp., Iselin). The IR spectra in Figure 20a show the time evolution of dihydrogen spectra at 20 K; three intense bands appear immediately after the H2 dosage (dashed curve). However, the intensity decreases (gray curve), showing the formation of a triplet shifted upward with time, which is completed at 10 h (solid black curve). They conclude that dihydrogen adducts are responsible for the first triplet and after transformation for the second triplet of bands (98). The spectra change showing new features with the equilibrium pressure change of dihydrogen is depicted in Figure 20b (97).. Furthermore, they also studied CO adsorbed on extended surfaces and isolated surface sites. Figure 21a shows the coverage-dependent IR spectra of CO on different extended oxide and halide surfaces such as ZnO, α-Cr2O3, MgCr2O4, LaCr2O3, titania, and CuCl. A coverage-dependent parameter (θ)definesthecomplexcoveragefromlowesttohighest,accountingforanygeometricalhindranceor lateral interaction of adsorbates resulting in shifting. For example, Zecchina et al. (98) used Degussa P25, characterized by an extremely narrow bandwidth with full width at half-maximum <1.5 cm- 1, suggesting the formation of Ti4+…CO on uniform surface planes. The surface is dominated by 70 Sudarsanam and Singh; Advanced Heterogeneous Catalysts Volume 1: Applications at the Nano-Scale ACS Symposium Series; American Chemical Society: Washington, DC, 2020.
  • 21. electrostatic charges, which can be inferred from the shifts and dynamic polarizability. Ding et al. (99) also used IR spectroscopy to distinguish and quantify Pt single atoms from Pt nanoparticles. Figure 21. (a) Spectrum representing DRIFT of a saturated layer of CO adsorbed on 4%Rh/TiO2 at 300 K along with the vibrational modes denoted by the ball and stick model. (b) CO DRIFT spectra on 0.5%, 2%, 3%, 4%, and 6% loadings of Rh/TiO2 catalyst. (c) Percent site fraction of isolated and nanoparticle- based Rh. Reproduced with permission from ref. (100). Copyright 2015 American Chemical Society. Other techniques such as DRIFTS having site-specific extinction coefficients can be used to quantify the fraction of metal atoms in a catalyst support from a mixture of metal atoms and nanoparticles (92, 100, 101). Matsubu et al. (100) employed probe-molecule DRIFTS to quantify the fraction of Rh dispersed to isolated sites and also on the surface of Rh nanoparticles on a TiO2 support (Figure 21). Thus, adsorption IR spectra of molecules such as CO can be successfully utilized to determine the electronic and structural states in various SACs. Additionally, good dispersibility of the metal catalysts can also be evaluated using these techniques, the absorption bands of which are observed at relatively higher wavenumbers. X-ray Photoelectron Spectroscopy X-ray photoelectron spectroscopy utilizes photoelectrons generated by X-ray irradiation (primarily Mg Kα or Al Kα) for surface characterization to a depth of 2–5 nm. XPS provides the elemental identification and composition by measuring electron energy on elastically scattered electron emission (102). Chemical information, including surface chemistry studies, is derived from typical binding energy peak shifts depending upon the chemical bonding of the elements. Luo et al. (103) confirmed the presence of high contents of Au(I)-thiolate complexes in luminescent Au NCs using XPS. The XPS spectra revealed that the Au oxidation state in luminescent Au NCs resides between Au(I)-thiolate and larger Au(0) nanoparticles. The Au 4f on deconvolution 71 Sudarsanam and Singh; Advanced Heterogeneous Catalysts Volume 1: Applications at the Nano-Scale ACS Symposium Series; American Chemical Society: Washington, DC, 2020.
  • 22. gives binding energies of 84.3 and 83.7 eV, representing the components Au(I) and Au(0), respectively. Du et al. (104) demonstrated that the electronic interaction between NCs and MoS2 plays a key role in the highest hydrogen evolution reaction (HER) activity of Au2Pd6/MoS2 compared to Pd3/MoS2 and Au2/MoS2. The Au2Pd6 NCs caused a large negative shift in the binding energies of Mo 3d and S 2p in Au2Pd6/MoS2 than in Pd3/MoS2 compared to that of plain MoS2 nanosheets. This showed the influence of the synergistic effect of the bimetallic composition in Au2Pd6/MoS2 leading to improved catalytic activity. Gao et al. (105) conducted XPS measurements to examine chemical states and the effect of calcination on the prepared Pd clusters Pd6(C12H25S)12 symbolized by Pd6/AC‐V and Pd6/AC. The Pd 3d in Pd6/AC‐V displayed a more positive shift in binding energy compared to Pd6/AC, which indicates the electron cloud density is lower in Pd6/AC‐V than in Pd6/AC. This could be attributed to the direct contact between the metal cluster and carbon support resulting in the thin carbon layers on the Pd surface after thiol ligand removal in the Pd6/AC cluster. Zhao et al. (106) performed XPS analysis to verify successful Au25 loading (with −SCH2CH2Ph as the ligand) onto MoS2 nanosheets and the electronic interaction role for HER. After Au25/ MoS2 formation, the binding energy of Mo 3d undergoes a negative shift of ~0.4 eV compared to bare MoS2 with a positive shift in the binding energy of Au 5f. This suggested the transfer of electron density from Au25 to MoS2, and the electronic interaction between NCs and MoS2 was responsible for the enhanced HER activity in Au25/MoS2 composites. Recently, the same group also performed XPS analysis to investigate the NCs and CoSe2 interfacial interaction in enhancement of the oxygen evolution reaction (107). After the deposition of Au NCs onto the CoSe2 support, a negative shift of ~1 eV is observed in the binding energy of Co 2p (Figure 22a), indicating the interfacial interaction between NCs and CoSe2. This interaction is also reflected in the positive shift in the Raman peak of CoSe2 (Figure 22b). Figure 22. (a) Co 2p high-resolution XPS spectra and (b) Raman spectra of CoSe2 and Au/CoSe2 composite. Reproduced with permission from ref. (107). Copyright 2017 American Chemical Society. The synergistic interaction between NCs and the support favors the intermediate (OOH) formation, resulting in facile desorption of oxygen molecules in the oxygen evolution reaction process. Hang Li et al. (108) studied the oxidation state and dispersion of Pt species using XPS analysis in PtO/TiO2 and Pt/TiO2 photocatalysts. For the PtO/TiO2 catalyst, the main peaks were centered at binding energies of 72.4 and 75.8 eV, indicating the oxygen-bonded Pt 2p. The Pt/TiO2 photocatalyst showed peaks of Pt 4f7/2 and 4f5/2 at 70.9 and 74.3 eV, respectively, justifying the 72 Sudarsanam and Singh; Advanced Heterogeneous Catalysts Volume 1: Applications at the Nano-Scale ACS Symposium Series; American Chemical Society: Washington, DC, 2020.
  • 23. presence of metallic Pt. The Pt dispersion was evaluated on the basis of the XPS relative intensity to Ti (IPt/ITi). The PtO/TiO2 showed a higher dispersion of Pt atoms, as demonstrated by their higherIPt/ITi (0.021)values.Theseresultssuggestthatahighoxidationstateaswellashighdispersity of Pt species in PtO/TiO2 could suppress the side reaction effectively. Gaur et al. (109) reported that H2/He-treated Au38/TiO2 exhibited excellent catalytic activity, while the air-dried Au38/TiO2 catalyst under the same conditions showed no catalytic activity. To determine the reason, XPS analysis was performed for both samples. For the reductively treated Au/TiO2 catalyst, Au 4f7/ 2 peaks at 83.4 eV and 85.8 eV correspond to metallic Au(0) and Au(+1)–thiolate interaction, respectively. The reductive sample also showed a lower energy shift, indicating the interaction of Au atoms with an oxygen atom bonded to Ti on the surface. The XPS results showed that H2/He- treated Au38/TiO2 removed most of the thiolate groups present, whereas the positive shift in the Au 4f peak in air-dried Au38/TiO2 was caused by the Au–SR bonding. It indicates that the thiol ligand in air-dried Au38/TiO2 inhibited Au site contact with the CO molecule, suggesting the role of the interfacial site in catalyzing the CO oxidation. XPS is a quantitative, surface-sensitive analytical technique that provides elemental information from core levels, and the chemical composition is derived from peak shifts in nanoclusters. The XPS technique is also used to determine the chemical states of nanoclusters and to confirm the ligand removal in the calcination process. XAS and XPS are collectively used to determine the catalyst’s structural integrity in the reaction. There is a large scope for improved instrumentation in terms of good energy resolution and variable X-ray energies. XPS is a highly surface-sensitive, quantitative technique that has the potential to measure the elemental composition with high quantitative precision and accuracy at the parts per thousand range. This is very crucial, especially for SAC studies, as the characterization of the individual atoms on top of the support surface is a challenging task. In conventional metal catalysts, the active sites are not well defined, so much refinement in measurement is not required. The XPS technique gives indirect evidence for successful SAC preparation by giving insight into the essential physicochemical properties of SACs. Using this technique, chemical and electronic states of an element within an SAC material can be resolved. NMR Spectroscopy NMR spectroscopy gives information about the structure and chemical surroundings of nanoclusters. It gives the scope to check the purity of the NCs. It helps in giving information about the estimation of binding interactions between the ligands and the metal core (52). Udayabhaskararao et al. (110) proposed the Ag thiolate structure from a cluster-based NMR spectroscopic study. The 1-D and 2-D NMR investigation of Ag32SG19 (SG is thiolate glutathione) showed spectral features that revealed it is dominated by the (SR-Ag-SR) structural motif. The inner core and outer shell of the cluster with metal thiolate were explained from the detailed analysis of NMR. 1H NMR data of clusters with chemical shifts of H3, H4, H2, H9, and H6 of glutathionate were 2.17, 2.60, 3.81, 3.87, and 4.64 ppm, respectively. H7 signals were shifted downfield (3.2–3.5 ppm) with broadening, followed by splitting denoted as [7,7] (Figure 23a). The downfield shift was due to its proximity to the silver core. The 2-D NMR data showed one pair of peaks labeled [7,7] in the ratio 1:1 at the seventh position for 2H, indicating an equivalent environment. Homonuclear correlation spectroscopy and heteronuclear single quantum correlation 73 Sudarsanam and Singh; Advanced Heterogeneous Catalysts Volume 1: Applications at the Nano-Scale ACS Symposium Series; American Chemical Society: Washington, DC, 2020.
  • 24. were performed to find the cause of the splitting and the nature of the staple motif on the cluster surface (Figure 23b,c). Figure 23. (a) 1H NMR spectra of GSH, crude cluster, and aged crude; peaks inside the dotted box are due to H7. Peaks marked * at 3.6 ppm are due to residual EtOH. (b) Homonuclear correlation spectrum; (c) heteronuclear single quantum correlation spectrum. Reproduced with permission from ref. (110). Copyright 2013 Royal Society of Chemistry. Zaluzhna et al. (111) explained the binding modes between S atoms in DMSA (meso-2,3- dimercaptosuccinic acid) and the surface Ag7 using the 13C NMR spectrum. They took the 13C solution NMR spectrum (Figure 24) of Ag7(DMSA)4 NCs with free DMSA in D2O. Here, 3- trimethylsilyl-1-propane sulfonic acid sodium salt was taken as an internal reference. It is reported (112) that the 13C NMR signal for carboxylate (–COO-) is difficult to observe due to the long spin- lattice relaxation time. In the spectra (top in Figure 24), the C bond to S appeared at 47.8 ppm in free DMSA (Figure 24). The peak disappeared once the DMSA was bound to AgNC, which is a phenomenon often observed when binding takes place between ligand and metal because of the intrinsic heterogeneity of the surface (113). The disappearance of the peak was suggested as sulfur atoms of DMSA being bound to AgNCs and that DMSA forms a bidentate binding, because if it were monodentate, one would have expected to see half of the signal at 47.8 ppm. The nature of metal species and binding ligands during a catalytic reaction can be investigated by solid-state magic-angle spinning NMR, generally performed in situ (114). This technique has been used by Kwak et al. (115) to investigate the anchoring of Pt on alumina supports at low loading levels. Here, the surfaces that were identified to serve as the anchoring sites for Pt single atoms were 74 Sudarsanam and Singh; Advanced Heterogeneous Catalysts Volume 1: Applications at the Nano-Scale ACS Symposium Series; American Chemical Society: Washington, DC, 2020.
  • 25. the unsaturated pentacoordinated Al3+ centers on the gamma-Al2O3 support. Corma et al. (116) reported strong NMR signal enhancement due to parahydrogen-induced polarization, used to check the presence of Au single atoms. Solid-state NMR (SS NMR) is used to investigate the behavior of solid catalysts and chemical processes taking place at their surfaces (45). For example, 31P SS NMR along with DFT calculations can provide information about the structure of heterogenized species and the immobilization of homogeneous metal phosphine catalysts. Gutmann et al. (117) has reported the important role of liquid and partly the SS NMR technique for the detection of surface molecules and differentiated between different binding sites on nanoscale catalysts. Mallissery et al. (118) reported the solid-state NMR of 31P used to characterize phosphinine- stabilized Au NPs and a phosphinine–Au complex. Their spectra showed metal-bound, intact phosphine units and detected several surface-bound species generated by chemical transformation of the initially supplied ligands. Novio et al. (119) used SS NMR and Fourier transform infrared spectroscopy to characterize the location and dynamics of CO coordinated to Ru NPs. Ru NPs (2 nm) were tested, prepared under H2 atmosphere, and stabilized by a bidentate phosphine ligand. The results demonstrated that CO groups were mobile on the surface of NPs, while the bulky ligand slowed down the fluxionality of CO and prevented the exchange at certain positions. Figure 24. 13C NMR spectra of free DMSA (top) and Ag7(DMSA)4 NCs (bottom) in D2O. Reproduced with permission from ref. (111). Copyright 2011 Elsevier. MALDI-TOF-MS and Electrospray Ionization Mass Spectrometry MALDI-TOF-MS and electrospray ionization mass spectrometry (ESI-MS) are “soft” ionization techniques as they induce minimal or no fragmentation (110). In MALDI-TOF-MS, the matrix-assisted laser desorption/ionization (MALDI) is used as an ion source, and the mass analyzer used is a time-of-flight (TOF) analyzer. Here, sample analytes are embedded in a solid matrix material, and ionized gaseous ions are formed by laser pulse irradiation (120). ESI-MS involves the conversion of solution-phase analytes into gas-phase ions by applying high voltage. Both techniques involve the generation of [M + zH]z+ ions. Formation of singly charged species (z = 1) is common for MALDI, while ESI may produce multiple-charge ions (z ≫ 1), which extends the mass analyzer range to kilodaltons to megadaltons (121). Generally, the ESI-MS technique is recommended for larger nanoclusters because of its softer ionization mode. 75 Sudarsanam and Singh; Advanced Heterogeneous Catalysts Volume 1: Applications at the Nano-Scale ACS Symposium Series; American Chemical Society: Washington, DC, 2020.
  • 26. Qianetal.(122)confirmedthemolecularpurityandformulaofAu38(SC2H4Ph)24 nanoclusters using MALDI-TOF-MS and ESI-MS. An intense peak at 10,780 Da is assigned to intact Au38(SC2H4Ph)24 ions in the MALDI spectrum with a small fragmented peak at 9342 Da (Figure 25a). The ESI technique, being a softer ionization peak, generates unfragmented Au cluster mass spectra with a sharp, intense peak at 10,910.69 Da (Figure 25b). Figure 25. (a) Positive MALDI-TOF mass spectra of Au(SC2H4Ph)24 nanoclusters corresponding to different laser intensities (decreasing from top to bottom). (b) ESI mass spectrum of Au(SC2H4Ph)24; inset shows the zoomed-in spectrum. Reproduced with permission from ref. (122). Copyright 2009 American Chemical Society. Qian et al. (123) also determined the purity of Au333(SR)79 NCs using MALDI-TOF-MS and ESI-MS techniques. MALDI-MS analysis was performed using trans-2-[3-(4-tert-butylphenyl)-2- methyl-2-propenyldidene] malononitrile as a matrix. A broad peak at 75.3 kDa was observed in the MALDI-TOF-MS spectrum (Figure 26). The exact molecular mass of NPs was determined by ESI- MS analysis. Alkali acetate salt CsOAc was added to enhance nanoparticle ionization. The ESI-MS spectrum showed two sets of NP ion peaks (Figure 27), out of which the 4p ion set is chosen to precisely calculate its composition. Figure 26. LDI and MALDI mass spectra of the Au nanoparticle. (A) and (C) show the spectra in the 10,000 to 370,000 range; (B) and (D) show the zoomed-in spectra. Reproduced with permission from ref. (123). Copyright 2012 National Academy of Sciences. The mass spectrum of electrolyzed samples (Figure 28) showed a Au cluster size range of 5–13, with Au5 (1034 Da) being the most abundant peak in these clusters. Jeyabharathi et al. (124) 76 Sudarsanam and Singh; Advanced Heterogeneous Catalysts Volume 1: Applications at the Nano-Scale ACS Symposium Series; American Chemical Society: Washington, DC, 2020.
  • 27. synthesized CTAB-Au clusters via the electrodeposition method, and the core-size nanocluster range is identified by MALDI-TOF mass spectrometry, as shown in Figure 29. Yang et al. (125) employed MALDI-TOF-MS to confirm the actual structures of Ag NCs with a series of species with a number of atoms (two to five). Gao and Chen (105) obtained the exact formula of Pd6 NCs via MALDI‐TOF MS analysis, where the mass spectrum shows three peaks with an intense peak at m/z = 3347 assigned to [Pd6(C12H25S)12+2Na]+, as shown in Figure 30. Figure 27. Wide-range ESI-MS spectrum of the nanoparticle; the inset shows the zoomed-in spectrum of the 4p ion set centered at m∕z = 19,175.0. Reproduced with permission from ref. (123). Copyright 2012 National Academy of Sciences. Figure 28. Au-cluster MALDI-TOF mass spectrum. Reproduced with permission from ref. (124). Copyright 2010 Wiley-VCH. Negishi et al. (126) demonstrated the use of redox reagents for stable Au25 NC formation with various charge states. The prepared Au25(SC6H13)18 NCs exhibited a single [Au25(SC6H13)18]1- peak in the negative ESI mass spectrum, while [Au25(SC6H13)18]1-(TOA+)2 is detected in the positive ESI mass spectrum (Figure 31) with TOA+ as a counter ion. The [Au25(SC6H13)18]1+/1- ion signals were not observed in any of the ESI mass spectra, indicating the neutral [Au25(SC6H13)18]0 77 Sudarsanam and Singh; Advanced Heterogeneous Catalysts Volume 1: Applications at the Nano-Scale ACS Symposium Series; American Chemical Society: Washington, DC, 2020.
  • 28. formation. As the reduction progresses, a shift in charge distribution of [Au25(SC6H13)18]x to negative values was observed. Figure 29. MALDI-TOF/TOF mass spectra of Ag NCs. Reproduced with permission from ref. (125). Copyright 2014 Royal Society of Chemistry. Figure 30. MALDI-TOF MS of Pd6(C12H25S)12. The inset shows a comparison of the experimental and simulated patterns from the highest peak in the full spectrum. Reproduced with permission from ref. (105). Copyright 2017 Royal Society of Chemistry. Fu et al. (127) utilized ESI-MS analysis to monitor the reaction process of the Pd3Cl-catalyzed Suzuki–Miyaura cross-coupling reaction. It was observed that the addition of bromobenzene to the catalytic system caused the disappearance of the intermediate formed, [Pd3Ar(PPh2)2(PPh3)3]+ at 1553.11 Da, while a new peak corresponding to [Pd3Br(PPh2)2(PPh3)3]+ emerges at 1557.06 Da (Figure 32d). Thus, we can conclude that HR-MS is a highly sensitive, selective, and reliable analytical tool used for targeted and nontargeted screening of molecular features in nanoclusters. HR-MS techniques determine the core size and composition of metallic/bimetallic nanoclusters. Using this technique, the active charge states of the nanocluster, the mixed protecting ligand composition, and the mechanism of the nanocluster formation can be identified. 78 Sudarsanam and Singh; Advanced Heterogeneous Catalysts Volume 1: Applications at the Nano-Scale ACS Symposium Series; American Chemical Society: Washington, DC, 2020.
  • 29. Figure 31. Positive and negative ESI mass spectra of 1, 2, and 1′. The notation (n, m-/+) represents [Aun(SC6H13)m]-/+. Reproduced with permission from ref. (126). Copyright 2007 American Chemical Society. Figure 32. ESI-MS tracking of [Pd3Cl(PPh2)2(PPh3)3]+ reacting with phenylboronic acid under alkaline conditions: 0.0072 g (0.06 mmol) phenylboronic acid, 2 mg (1.32 × 10⁻³ mmol) catalyst, 0.0164 g (0.12 mmol) K2CO3, and 3 mL CH2Cl2, rt: (a) 0 h, (b) 1 h, (c) 2 h. (d) Adding 0.006 mL bromobenzene on the basis of (c). Reproduced with permission from ref. (127). Copyright 2017 American Chemical Society. Inductively Coupled Plasma Mass Spectrometry Inductively coupled plasma mass spectrometry (ICP-MS) is an excellent technique for determining the specific element concentration in the analyzed material with detection limits at or below the single part per trillion (ppt) level for most of the periodic table elements (128). Here, the plasma source is used to ionize the atomic elements, which are then sorted based on their mass (129). ICP-MS exhibits a species-independent high sensitivity and multielement capabilities, which allows for quantification when the species-specific standards are unavailable (130). ICP-MS 79 Sudarsanam and Singh; Advanced Heterogeneous Catalysts Volume 1: Applications at the Nano-Scale ACS Symposium Series; American Chemical Society: Washington, DC, 2020.
  • 30. converts chromatograms into simple “elementograms”; any structural and molecular information is destroyed, so it cannot be used to elucidate structures. In such cases, ESI-MS can be used as a technique complementary to ICP-MS (131). Zhang et al. (132) employed ICP-MS for cobalt amount determination and cobalt phthalocyanine content in cobalt phthalocyanine catalysts anchored onto carbon nanotubes. Negishi et al. (133) performed ICP-MS analysis on a series of Au NCs to determine Au loading and to examine the efficiency of Au NC adsorption. ICP-MS also helps to determine the individual isotopes of each element or isotope ratios. The isotopic ratio, in particular, is beneficial in terms of tracing and isotope dilution. Larner et al. (134) investigated the fractionation of the isotopic composition of engineered nanoparticles (ENPs), and a comparison was made concerning bulk metal material for tracing purposes. For ZnO ENPs, no fractionation of isotopic composition for ENPs was observed. Laycock et al. (135) employed ICP- MS directly to characterize stable isotope–labeled Ag ENPs for tracing studies. Degueldre and Favarger (136) introduced the application of ICP-MS in a single-particle version (SP-ICP-MS), which is based on ion cloud generation through the single particle, for engineered nanomaterial (ENM) analysis. Direct assessment of ENM size and number-size distribution is done based on the signals obtained. SP-ICP-MS has limited multielement capabilities; this has made the hyphenation of ICP-MS and the fractionation system attractive (137). Field flow fractionation (FFF) and SP- ICP-MS are complementary tools in ENM analysis. FFF-ICP-MS can fractionate nanomaterials and sensitively detect small nanomaterials by providing high resolution (Figure 33), whereas SP-ICP-MS has a unique ability to distinguish between dissolved and nanoparticulate fractions (138). Figure 33. Simplified schematic of the separation principle of FFF. Interaction of parabolic flow-profile velocities, back diffusion of particles, and perpendicular applied field. (Scheme is not true to scale; fractionation takes place only in the lower 3–5% of the channel.). Reproduced with permission from ref. (138). Copyright 2015 Springer. ICP-MS-based techniques are a powerful tool for metal-based single-particle and nanomaterial applications. The SP-ICP-MS technique is used for detection and quantification by measuring the elemental composition of nanomaterials. It is useful in measuring the size, number concentration, and number size distribution. If ICP-MS is coupled with hyphenated techniques such as FFF and size fractionation, the mass and number-based quantification of nanoparticles can be obtained. Theoretical Calculations Density functional theory calculations play an important role in the development of SACs and the specific catalytic reaction mechanisms of supported single metal atoms. Qiao et al. (13) proposed a reaction mechanism of oxidation for CO on Pt1/FeOx (Figure 34) based on a modified 80 Sudarsanam and Singh; Advanced Heterogeneous Catalysts Volume 1: Applications at the Nano-Scale ACS Symposium Series; American Chemical Society: Washington, DC, 2020.
  • 31. Langmuir–Hinshelwood scheme using DFT calculations and experiments in which the active sites are single Pt atoms, coordinated with two to three oxygen atoms inserted on iron oxide. Figure 34. Proposed CO oxidation on (A) Pt1/FeOx. Adapted with permission from ref. (13). Copyright 2011 Nature Publishing Group. (B) Ir1/FeOx. Adapted with permission from ref. (139). Copyright 2014 American Chemical Society. (C) Ni1/FeOx catalysts. Adapted with permission from ref. (140). Copyright 2016 Royal Society of Chemistry. (D) CO oxidation on oxygen-defective M1/FeOx (M = Pt, Rh, Pd, Co, and Cu). Adapted with permission from ref. (141). Copyright 2015 American Chemical Society. (E) Energetic alignment (in eV) of the surface-bound H and Kubas-coordinated H intermediates for V and Mo. Adapted with permission from ref. (5). Copyright 2015 Wiley-VCH. (F) Energetic alignment (in eV) of the Kubas-coordinated H, intermediate dissociated H2, and surface-bound H intermediates for Pt and Mo along the pathway. Reproduced with permission from ref. (33). Copyright 2019 Springer. Here the DFT calculations suggested that single Pt atoms embedded on the surface of Fe2O3 show a high oxidation state as they are coordinated with two to three oxygen atoms on the surface of iron oxide, which results in a lowering of the reaction activation barrier for the rate-determining step of oxidation of CO on single Pt (0.79 eV) compared to Pt(111) (~1 eV; Figure 34a). Further, Liang et al. (139) analyzed Ir1/FeOx for CO oxidation using DFT, which showed that Ir1/FeOx has a lower activity than Pt1/FeOx (Figure 34b). According to the calculation, the activation barrier of the rate-determining step in the catalytic cycle of CO oxidation was 0.62 eV higher, and the adsorption 81 Sudarsanam and Singh; Advanced Heterogeneous Catalysts Volume 1: Applications at the Nano-Scale ACS Symposium Series; American Chemical Society: Washington, DC, 2020.
  • 32. energy of the CO molecule was 0.69 eV higher for Ir1/FeOx than for the Pt1/FeOx catalyst. In addition, Liang et al. (140) using DFT predicted that Ni possessed a higher catalytic activity at room temperature for CO oxidation that was comparable to that of Pt1/FeOx and considerably higher than Ir1/FeOx, because of the lower energy barrier (Figure 34c). Later, Li et al. (141) applied DFT to explore the catalytic activity of single metal atoms supported on an iron oxide surface and reported that the performance of oxygen defective Rh1/FeOx, Pd1/FeOX, and Ru1/FeOx (Figure 34d) with or without O vacancies and vacancy-free Ti1/FeOx and Co1/FeOx catalyst approached the overall performance of the Pt1/FeOx catalyst. DFT calculations can also be used to identify SACs. For example, Choi et al. (5) applied a computational search of hydrogen catalysts made of transition metal atoms embedded with graphitic carbon (Figure 34). Researchers have identified various materials that showed high efficiency as HER and hydrogen oxidation reaction catalysts based on numerous criteria like stability, activity, and resistance to poisoning. For example, a catalyst composed of Mo atom inserted within the divacancy site in graphene (4C Mo) was shown to be particularly promising for the hydrogen oxidation reaction catalyst in addition to HER catalyst. DFT can be used to study the molecular adsorption behavior of SACs. Lou et al. (142) anchored single Rh1 atoms to the vacancy sites of 2-D MoS2 sheets to form Rh1/MoS2 SACs. Here, the DFT calculations were conducted to understand the adsorption behavior of CO molecules on edge-anchored single Rh1 atoms. The calculations suggested that such a configuration is the most stable, and under an aqueous surrounding, the most outside edge atoms of MoS2 are the oxygen atoms. It also indicated that the Rh single atom could strongly anchor to the Mo vacancy sites to form a Rh1-S4 configuration (Figure 35a,b) on the edge of the nanosheets, in agreement with the HAADF-STEM observations and the EXAFS results. Also, the first-principle DFT calculations are nowadays extensively used to understand the elementary events and reaction mechanisms. Figure 35. (a) Rh K-edge EXAFS spectra of Rh1/MoS2 SAC, nano-Rh/MoS2 and Rh foil and (b) DFT- calculated stable Rh1-S4 configuration of the Rh1 active site. Reproduced with permission from ref. (142). Copyright 2019 American Chemical Society. DFT results are converted into kinetic parameters by using transition state theory (143). However, kinetic modeling is required to check the activity and selectivity and examine the various aspects of catalytic behavior under operating conditions (144). Kopač et al. (145) investigated the 82 Sudarsanam and Singh; Advanced Heterogeneous Catalysts Volume 1: Applications at the Nano-Scale ACS Symposium Series; American Chemical Society: Washington, DC, 2020.
  • 33. role of surface defects in catalytic CO2 hydrogenation to methanol. Here, Cu(111) and stepped Cu(533) surfaces were compared using a multiscale modeling approach via DFT and KMC (kinetic Monte Carlo) simulations. DFT calculated the species adsorption energetics and reaction transition- state profiles. These were then used by KMC to simulate the dynamics of the overall pathway and investigate the selectivity and activity of the catalyst. The results showed that a stepped Cu(533) enhances the selectivity and activity of the methanol synthesis. Kopač et al. (146), in his other work, studied CO2 activation for the synthesis of methanol on Cu(111) catalysts using first-principle DFT calculations and KMC modeling simulations. Huš et al. (147) used post-Hartree–Fock and DFT calculations to assess the thermodynamics and to explain the pathway leading to the synthesis of methanol from CO2 on Cu/ZnO/Al2O3. On performing the DFT calculation on Cu/ZnO/Al2O3, it was found that the reaction proceeds via the formate route. For the development of SACs, DFT has been extensively used. It has performed various functions for the study of SACs. Examples have helped in understanding the catalytic reaction mechanism, identification of SACs, molecular adsorption studies, and so on. Conclusion In summary, this chapter has discussed various characterization techniques and methods used in analyzing subnano catalysts and single-atom catalysts. Understanding the materials confined at the molecular and single-atom levels, or simply the “subnanometer” level, has been one of the targets in the field of nanotechnology. This is central for analyzing the properties of this novel material and its use in different applications such as catalysis and optics. From this standpoint, many unique properties that cannot be addressed by conventional techniques due to the size and quantum effect have been discussed. We review the characterization methods: brief working principles of various major characterization techniques, the progress made so far, and the conditions required for the functioning of the analytical systems. We have discussed some of the most important tools, such as HAADF-STEM, SEM-EDAX, STM, DRIFT, other IR spectroscopy, NMR, XPS, EXAFS, TERS, ICP-MS, and X-ray reflectometry. Theoretical techniques are also fundamental in understanding the properties of these materials at the subnano level, and we review DFT as a modeling tool. Acknowledgments This chapter is dedicated to Prof. T. V. RajanBabu, The Ohio State University, on his 70th birthday. The authors thanks DBT-PAN IIT Centre for Bioenergy (BT/EB/PANIIT/2012) for financial assistance. References 1. Guo, Q.; Ma, Z.; Zhou, C.; Ren, Z.; Yang, X. Single Molecule Photocatalysis on TiO2 Surfaces. Chem. Rev. 2019, 119, 11020–11041. 2. Parkinson, G. S. Single-Atom Catalysis: How Structure Influences Catalytic Performance. Catal. Lett. 2019, 149, 1137–1146. 3. Qin, L.; Cui, Y.-Q.; Deng, T.-L.; Wei, F.-H.; Zhang, X.-F. Highly stable and Active Cu1/ CeO2 Single-Atom Catalyst for CO Oxidation: A DFT Study. ChemPhysChem 2018, 19, 3346–3349. 83 Sudarsanam and Singh; Advanced Heterogeneous Catalysts Volume 1: Applications at the Nano-Scale ACS Symposium Series; American Chemical Society: Washington, DC, 2020.
  • 34. 4. Kim, J.; Kim, H.-E.; Lee, H. Single-Atom Catalysts of Precious Metals for Electrochemical Reactions. ChemSusChem 2018, 11, 104–113. 5. Choi, W. I.; Wood, B. C.; Schwegler, E.; Ogitsu, T. Combinatorial Search for High-Activity Hydrogen Catalysts Based on Transition-Metal-Embedded Graphitic Carbons. Adv. Energy Mater. 2015, 5, 1501423. 6. Varela, M.; Findlay, S. D.; Lupini, A. R.; Christen, H. M.; Borisevich, A. Y.; Dellby, N.; Krivanek, O. L.; Nellist, P. D.; Oxley, M. P.; Allen, L. J.; Pennycook, S. J. Spectroscopic Imaging of Single Atoms within a Bulk Solid. Phys. Rev. Lett. 2004, 92, 095502. 7. Yang, X.-F.; Wang, A.; Qiao, B.; Li, J.; Liu, J.; Zhang, T. Single-Atom Catalysts: A New Frontier in Heterogeneous Catalysis. Acc. Chem. Res. 2013, 46, 1740–1748. 8. Thomas, J. M.; Raja, R.; Lewis, D. W. Single-Site Heterogeneous Catalysts. Angew. Chem., Int. Ed. 2005, 44, 6456–6482. 9. Jin, R. Quantum sized, thiolate-protected gold nanoclusters. Nanoscale 2010, 2, 343–362. 10. Alvarez, M. M.; Khoury, J. T.; Schaaff, T. G.; Shafigullin, M. N.; Vezmar, I.; Whetten, R. L. Optical Absorption Spectra of Nanocrystal Gold Molecules. J. Phys. Chem. B 1997, 101, 3706–3712. 11. Yang, S.; Tak, Y. J.; Kim, J.; Soon, A.; Lee, H. Support Effects in Single-Atom Platinum Catalysts for Electrochemical Oxygen Reduction. ACS Catal. 2017, 7, 1301–1307. 12. Liu, J. Advanced Electron Microscopy of Metal–Support Interactions in Supported Metal Catalysts. ChemCatChem 2011, 3, 934–948. 13. Qiao, B.; Wang, A.; Yang, X.; Allard, L. F.; Jiang, Z.; Cui, Y.; Liu, J.; Li, J.; Zhang, T. Single- atom catalysis of CO oxidation using Pt1/FeOx. Nat. Chem. 2011, 3, 634–641. 14. Stroppa, D. G.; Righetto, R. D.; Montoro, L. A.; Houben, L.; Barthel, J.; Cordeiro, M. A. L.; Leite, E. R.; Weng, W.; Kiely, C. J.; Ramirez, A. J. Assessment of a nanocrystal 3-D morphology by the analysis of single HAADF-HRSTEM images. Nanoscale Res. Lett. 2013, 8, 475. 15. Chellappa, R.; Veeraraghavan, A.; Ramanathan, N.; Yam, C.-Y.; Nixon, M. S.; Elgammal, A.; Boyd, J. E.; Little, J. J.; Lynnerup, N.; Larsen, P. K.; Reynolds, D. Gaussian Mixture Models. In Encyclopedia of Biometrics; Springer: Boston, MA, 2009; pp 659−663. 16. McLachlan, G. J.; Peel, D. Finite Mixtures Models; Wiley: New York, 2000. 17. Pennycook, S. J.; Nellist, P. D., Scanning Transmission Electron Microscopy, 1st ed.; Springer- Verlag: New York, pp XII, 762. 18. Van Aert, S.; Verbeeck, J.; Erni, R.; Bals, S.; Luysberg, M.; Dyck, D. V.; Tendeloo, G. V. Quantitative atomic resolution mapping using high-angle annular dark field scanning transmission electron microscopy. Ultramicroscopy 2009, 109, 1236–1244. 19. Krivanek, O. L.; Chisholm, M. F.; Nicolosi, V.; Pennycook, T. J.; Corbin, G. J.; Dellby, N.; Murfitt, M. F.; Own, C. S.; Szilagyi, Z. S.; Oxley, M. P.; Pantelides, S. T.; Pennycook, S. J. Atom-by-atom structural and chemical analysis by annular dark-field electron microscopy. Nature 2010, 464, 571–574. 20. Stroppa, D. G.; Zagonel, L. F.; Montoro, L. A.; Leite, E. R.; Ramirez, A. J. High-Resolution Scanning Transmission Electron Microscopy (HRSTEM) Techniques: High-Resolution Imaging and Spectroscopy Side by Side. ChemPhysChem 2012, 13, 437–443. 84 Sudarsanam and Singh; Advanced Heterogeneous Catalysts Volume 1: Applications at the Nano-Scale ACS Symposium Series; American Chemical Society: Washington, DC, 2020.
  • 35. 21. Qiu, H.-J.; Ito, Y.; Cong, W.; Tan, Y.; Liu, P.; Hirata, A.; Fujita, T.; Tang, Z.; Chen, M. Nanoporous Graphene with Single-Atom Nickel Dopants: An Efficient and Stable Catalyst for Electrochemical Hydrogen Production. Angew. Chem., Int. Ed. 2015, 54, 14031–14035. 22. Li, X.; Bi, W.; Zhang, L.; Tao, S.; Chu, W.; Zhang, Q.; Luo, Y.; Wu, C.; Xie, Y. Single-Atom Pt as Co-Catalyst for Enhanced Photocatalytic H2 Evolution. Adv. Mater. 2016, 28, 2427–2431. 23. Kumskov, A.; Zhigalina, V.; Kiselev, N.; Eliseev, A.; Verbitskiy, N.; Vasiliev, A. HAADF HRSTEM of one dimensional CuI crystals inside SWCNTs. In European Microscopy Congress 2016: Proceedings; Wiley-VCH, pp 490−491. 24. Zhang, Z.; Zhu, Y.; Asakura, H.; Zhang, B.; Zhang, J.; Zhou, M.; Han, Y.; Tanaka, T.; Wang, A.; Zhang, T.; Yan, N. Thermally stable single atom Pt/m-Al2O3 for selective hydrogenation and CO oxidation. Nat. Commun. 2017, 8, 16100. 25. Liu, Q.; Zhang, Z. Platinum single-atom catalysts: a comparative review towards effective characterization. Catal. Sci. Technol. 2019, 9, 4821–4834. 26. Liu, L.; Zakharov, D. N.; Arenal, R.; Concepcion, P.; Stach, E. A.; Corma, A. Evolution and stabilization of subnanometric metal species in confined space by in situ TEM. Nat. Commun. 2018, 9, 574. 27. Wiesendanger, R. Single-atom magnetometry. Curr. Opin. Solid State Mater. Sci. 2011, 15, 1–7. 28. Ternes,M.;Heinrich,A.J.;Schneider,W.-D.SpectroscopicmanifestationsoftheKondoeffect on single adatoms. J. Phys. Condens. Matter 2008, 21, 053001. 29. Zhou, X.; Yang, W.; Chen, Q.; Geng, Z.; Shao, X.; Li, J.; Wang, Y.; Dai, D.; Chen, W.; Xu, G.; Yang, X.; Wu, K. Stable Pt Single Atoms and Nanoclusters on Ultrathin CuO Film and Their Performances in CO Oxidation. J. Phys. Chem. C 2016, 120, 1709–1715. 30. Krenner, W.; Klappenberger, F.; Kühne, D.; Diller, K.; Qu, Z.-R.; Ruben, M.; Barth, J. V. Positioning of Single Co Atoms Steered by a Self-Assembled Organic Molecular Template. J. Phys. Chem. Lett. 2011, 2, 1639–1645. 31. Lucci, F. R.; Liu, J.; Marcinkowski, M. D.; Yang, M.; Allard, L. F.; Flytzani-Stephanopoulos, M.; Sykes, E. C. H. Selective hydrogenation of 1,3-butadiene on platinum–copper alloys at the single-atom limit. Nat. Commun. 2015, 6, 8550. 32. Boucher, M. B.; Goergen, S.; Yi, N.; Flytzani-Stephanopoulos, M. ‘Shape effects’ in metal oxide supported nanoscale gold catalysts. Phys. Chem. Chem. Phys. 2011, 13, 2517–2527. 33. Cheng, N.; Zhang, L.; Doyle-Davis, K.; Sun, X. Single-Atom Catalysts: From Design to Application. Electrochem. Energy Rev. 2019, 2, 539–573. 34. Venkatachalam, S.; Jacob, T. Hydrogen adsorption on Pd-containing Au(111) bimetallic surfaces. Phys. Chem. Chem. Phys. 2009, 11, 3263–3270. 35. Yudanov, I. V.; Neyman, K. M. Stabilization of Au at edges of bimetallic PdAu nanocrystallites. Phys. Chem. Chem. Phys. 2010, 12, 5094–5100. 36. Yuan, D.; Gong, X.; Wu, R. Atomic configurations of Pd atoms in PdAu(111) bimetallic surfaces investigated using the first-principles pseudopotential plane wave approach. Phys. Rev. B 2007, 75, 085428. 37. Baber, A. E.; Tierney, H. L.; Sykes, E. C. H. Atomic-Scale Geometry and Electronic Structure of Catalytically Important Pd/Au Alloys. ACS Nano 2010, 4, 1637–1645. 85 Sudarsanam and Singh; Advanced Heterogeneous Catalysts Volume 1: Applications at the Nano-Scale ACS Symposium Series; American Chemical Society: Washington, DC, 2020.
  • 36. 38. Lucci, F. R.; Darby, M. T.; Mattera, M. F. G.; Ivimey, C. J.; Therrien, A. J.; Michaelides, A.; Stamatakis, M.; Sykes, E. C. H. Controlling Hydrogen Activation, Spillover, and Desorption with Pd–Au Single-Atom Alloys. J. Phys. Chem. Lett. 2016, 7, 480–485. 39. Liu, J.; Lucci, F. R.; Yang, M.; Lee, S.; Marcinkowski, M. D.; Therrien, A. J.; Williams, C. T.; Sykes, E. C. H.; Flytzani-Stephanopoulos, M. Tackling CO Poisoning with Single-Atom Alloy Catalysts. J. Am. Chem. Soc. 2016, 138, 6396–6399. 40. Wang, Y.; Mao, J.; Meng, X.; Yu, L.; Deng, D.; Bao, X. Catalysis with Two-Dimensional Materials Confining Single Atoms: Concept, Design, and Applications. Chem. Rev. 2019, 119, 1806–1854. 41. Deng, D.; Pan, X.; Yu, L.; Cui, Y.; Jiang, Y.; Qi, J.; Li, W.-X.; Fu, Q.; Ma, X.; Xue, Q.; Sun, G.; Bao, X. Toward N-Doped Graphene via Solvothermal Synthesis. Chem. Mater. 2011, 23, 1188–1193. 42. Zheng, B.; Hermet, P.; Henrard, L. Scanning Tunneling Microscopy Simulations of Nitrogen- and Boron-Doped Graphene and Single-Walled Carbon Nanotubes. ACS Nano 2010, 4, 4165–4173. 43. Zhao, L.; He, R.; Rim, K. T.; Schiros, T.; Kim, K. S.; Zhou, H.; Gutiérrez, C.; Chockalingam, S. P.; Arguello, C. J.; Pálová, L.; Nordlund, D.; Hybertsen, M. S.; Reichman, D. R.; Heinz, T. F.; Kim, P.; Pinczuk, A.; Flynn, G. W.; Pasupathy, A. N. Visualizing Individual Nitrogen Dopants in Monolayer Graphene. Science 2011, 333, 999–1003. 44. Binnig, G.; Rohrer, H. Scanning tunneling microscopy---From birth to adolescence. Rev. Mod. Phys. 1987, 59, 615–625. 45. Mourdikoudis, S.; Pallares, R. M.; Thanh, N. T. K. Characterization techniques for nanoparticles: Comparison and complementarity upon studying nanoparticle properties. Nanoscale 2018, 10, 12871–12934. 46. Girão, A. V.; Caputo, G.; Ferro, M. C. Chapter 6, Application of Scanning Electron Microscopy–Energy Dispersive X-Ray Spectroscopy (SEM-EDS). In Comprehensive Analytical Chemistry; Rocha-Santos, T. A. P., Duarte, A. C., Eds.; Elsevier: 2017; Vol. 75, pp 153−168. 47. Tang, Y.; Yang, Y.; Cheng, D.; Gao, B.; Wan, Y.; Li, Y. C. Value-Added Humic Acid Derived from Lignite Using Novel Solid-Phase Activation Process with Pd/CeO2 Nanocatalyst: A Physiochemical Study. ACS Sustainable Chem. Eng. 2017, 5, 10099–10110. 48. Han, W.; Zhang, C.; Wang, H.; Zhou, S.; Tang, H.; Yang, L.; Wang, Z. Sub-nano MgF2 embedded in carbon nanofibers and electrospun MgF2 nanofibers by one-step electrospinning as highly efficient catalysts for 1,1,1-trifluoroethane dehydrofluorination. Catal. Sci. Technol. 2017, 7, 6000–6012. 49. Klaysri, R.; Preechawan, V.; Thammachai, N.; Praserthdam, P.; Mekasuwandumrong, O. Photocatalytic activity of Nitrogen and Silica doping on TiO2 nanocatalyst and grafted onto PMMA film. Mater. Chem. Phys. 2018, 211, 420–427. 50. Pascariu, P.; Tudose, I. V.; Suchea, M.; Koudoumas, E.; Fifere, N.; Airinei, A. Preparation and characterization of Ni, Co doped ZnO nanoparticles for photocatalytic applications. Appl. Surf. Sci. 2018, 448, 481–488. 51. Blass, S. D.; Hermann, R. J.; Persson, N. E.; Bhan, A.; Schmidt, L. D. Conversion of glycerol to light olefins and gasoline precursors. Appl. Catal., A 2014, 475, 10–15. 86 Sudarsanam and Singh; Advanced Heterogeneous Catalysts Volume 1: Applications at the Nano-Scale ACS Symposium Series; American Chemical Society: Washington, DC, 2020.
  • 37. 52. Du, Y.; Sheng, H.; Astruc, D.; Zhu, M. Atomically Precise Noble Metal Nanoclusters as Efficient Catalysts: A Bridge between Structure and Properties. Chem. Rev. 2020, 120, 526–622. 53. Nadjia, L.; Abdelkader, E.; Naceur, B.; Ahmed, B. CeO2 nanoscale particles: Synthesis, characterization and photocatalytic activity under UVA light irradiation. J. Rare Earth 2018, 36, 575–587. 54. Wang, Z. L.; Lee, J. L., 9: Electron Microscopy Techniques for Imaging and Analysis of Nanoparticles. In Developments in Surface Contamination and Cleaning; Kohli, R., Mittal, K. L., Eds.; William Andrew Publishing: Norwich, NY, 2008; pp 531−584. 55. Mahajan, A.; Banik, S.; Roy, P. S.; Chowdhury, S. R.; Bhattacharya, S. K. Kinetic parameters of anodic oxidation of methanol in alkali: Effect of diameter of Pd nano-catalyst, composition of electrode and solution and mechanism of the reaction. Int. J. Hydrogen Energy 2017, 42, 21263–21278. 56. Ganeev, R. A.; Suzuki, M.; Baba, M.; Ichihara, M.; Kuroda, H. Low- and high-order nonlinear optical properties of BaTiO3 and SrTiO3 nanoparticles. J. Opt. Soc. Am. B 2008, 25, 325–333. 57. Rahman, T.; Borah, G.; Gogoi, P. K. Spinel Structured Copper Ferrite Nano Catalyst with Magnetic Recyclability for Oxidative Decarboxylation of Phenyl Acetic Acids. Catal. Lett. 2020, 150, 2267–2272. 58. Khazaei, A.; Jafari-Ghalebabakhani, L.; Ghaderi, E.; Tavasoli, M.; Moosavi-Zare, A. R. Synthesis, characterization and application of nano-CoAl2O4 as an efficient catalyst in the preparation of hexahydroquinolines. Appl. Organomet. Chem. 2017, 31, e3815. 59. Valan, M. F.; Manikandan, A.; Antony, S. A. Microwave Combustion Synthesis and Characterization Studies of Magnetic Zn(1-x)Cd(x)Fe2O4 (0 ≤ x ≤ 0.5) Nanoparticles. J. Nanosci. Nanotechnol. 2015, 15, 4543–51. 60. Park, K.-D.; Raschke, M. B.; Atkin, J. M.; Lee, Y. H.; Jeong, M. S. Probing Bilayer Grain Boundaries in Large-Area Graphene with Tip-Enhanced Raman Spectroscopy. Adv. Mater. 2017, 29, 1603601. 61. Chiang, N.; Chen, X.; Goubert, G.; Chulhai, D. V.; Chen, X.; Pozzi, E. A.; Jiang, N.; Hersam, M. C.; Seideman, T.; Jensen, L.; Van Duyne, R. P. Conformational Contrast of Surface- Mediated Molecular Switches Yields Angstrom-Scale Spatial Resolution in Ultrahigh Vacuum Tip-Enhanced Raman Spectroscopy. Nano Lett. 2016, 16, 7774–7778. 62. Shao, F.; Zenobi, R. Tip-enhanced Raman spectroscopy: principles, practice, and applications to nanospectroscopic imaging of 2D materials. Anal. Bioanal. Chem. 2019, 411, 37–61. 63. Liu, S.; Müller, M.; Sun, Y.; Hamada, I.; Hammud, A.; Wolf, M.; Kumagai, T. Resolving the Correlation between Tip-Enhanced Resonance Raman Scattering and Local Electronic States with 1 nm Resolution. Nano Lett. 2019, 19, 5725–5731. 64. Balois, M. V.; Hayazawa, N.; Yasuda, S.; Ikeda, K.; Yang, B.; Kazuma, E.; Yokota, Y.; Kim, Y.; Tanaka, T. Visualization of subnanometric phonon modes in a plasmonic nano-cavity via ambient tip-enhanced Raman spectroscopy. NPJ 2D Mater. Appl. 2019, 3, 38. 65. Ichimura, T.; Fujii, S.; Verma, P.; Yano, T.; Inouye, Y.; Kawata, S. Subnanometric Near-Field Raman Investigation in the Vicinity of a Metallic Nanostructure. Phys. Rev. Lett. 2009, 102, 186101. 87 Sudarsanam and Singh; Advanced Heterogeneous Catalysts Volume 1: Applications at the Nano-Scale ACS Symposium Series; American Chemical Society: Washington, DC, 2020.
  • 38. 66. Cleveland, J. P.; Anczykowski, B.; Schmid, A. E.; Elings, V. B. Energy dissipation in tapping- mode atomic force microscopy. Appl. Phys. Lett. 1998, 72, 2613–2615. 67. Zhang, R.; Zhang, Y.; Dong, Z. C.; Jiang, S.; Zhang, C.; Chen, L. G.; Zhang, L.; Liao, Y.; Aizpurua, J.; Luo, Y.; Yang, J. L.; Hou, J. G. Chemical mapping of a single molecule by plasmon-enhanced Raman scattering. Nature 2013, 498, 82–86. 68. Stipe, B. C.; Rezaei, M. A.; Ho, W. Single-Molecule Vibrational Spectroscopy and Microscopy. Science 1998, 280, 1732–1735. 69. Richard-Lacroix,M.;Zhang,Y.;Dong,Z.;Deckert,V.Masteringhighresolutiontip-enhanced Raman spectroscopy: towards a shift of perception. Chem. Soc. Rev. 2017, 46, 3922–3944. 70. Szwedowski-Rammert, V.; Baumann, J.; Schlesiger, C.; Waldschläger, U.; Gross, A.; Kanngießer, B.; Mantouvalou, I. Laboratory based GIXRF and GEXRF spectrometers for multilayer structure investigations. J. Anal. At. Spectrom. 2019, 34, 922–929. 71. Mao, P. H.; Harrison, F. A.; Windt, D. L.; Christensen, F. E. Optimization of graded multilayer designs for astronomical X-ray telescopes. Appl. Opt. 1999, 38, 4766–4775. 72. Ménesguen, Y.; de Rossi, S.; Meltchakov, E.; Delmotte, F. Aperiodic multilayer mirrors for efficient broadband reflection in the extreme ultraviolet. Appl. Phys. A 2009, 98, 305. 73. Bridou, F.; Delmotte, F.; Troussel, P.; Villette, B. Design and fabrication of X-ray non-periodic multilayer mirrors: Apodization and shaping of their spectral response. Nucl. Instrum. Meth. A 2012, 680, 69–74. 74. Ingerle, D.; Schiebl, M.; Streli, C.; Wobrauschek, P. Combination of grazing incidence X-ray fluorescence with X-ray reflectivity in one table-top spectrometer for improved characterization of thin layer and implants on/in silicon wafers. Rev. Sci. Instrum. 2014, 85, 083110. 75. Hönicke, P.; Detlefs, B.; Müller, M.; Darlatt, E.; Nolot, E.; Grampeix, H.; Beckhoff, B. Reference-free, depth-dependent characterization of nanolayers and gradient systems with advanced grazing incidence X-ray fluorescence analysis. Phys. Status Solidi A 2015, 212, 523–528. 76. Parratt, L. G.; Hempstead, C. F. Anomalous Dispersion and Scattering of X-Rays. Phys. Rev. 1954, 94, 1593–1600. 77. Beckhoff, B. Reference-free X-ray spectrometry based on metrology using synchrotron radiation. J. Anal. At. Spectrom. 2008, 23, 845–853. 78. Emprin, B.; Troussel, P.; Soullié, G.; Stemmler, P.; Mercère, P.; Meltchakov, E.; Jérôme, A.; Delmotte, F. Characterization of subnanometric layers by grazing incidence X-ray reflectometry. Thin Solid Films 2014, 556, 54–60. 79. Haase, A.; Bajt, S.; Honicke, P.; Soltwisch, V.; Scholze, F. Multiparameter characterization of subnanometre Cr/Sc multilayers based on complementary measurements. J. Appl. Crystallogr. 2016, 49, 2161–2171. 80. Zhang, P. X-ray Spectroscopy of Gold–Thiolate Nanoclusters. J. Phys. Chem. C 2014, 118, 25291–25299. 81. Jin, R.; Zeng, C.; Zhou, M.; Chen, Y. Atomically Precise Colloidal Metal Nanoclusters and Nanoparticles: Fundamentals and Opportunities. Chem. Rev. 2016, 116, 10346–10413. 82. MacDonald, M. A.; Zhang, P.; Qian, H.; Jin, R. Site-Specific and Size-Dependent Bonding of Compositionally Precise Gold−Thiolate Nanoparticles from X-ray Spectroscopy. J. Phys. Chem. Lett. 2010, 1, 1821–1825. 88 Sudarsanam and Singh; Advanced Heterogeneous Catalysts Volume 1: Applications at the Nano-Scale ACS Symposium Series; American Chemical Society: Washington, DC, 2020.