

Recommended
More Related Content
What's hot
What's hot (20)
Similar to Gene mapping
Similar to Gene mapping (20)
More from Deepak Kumar
More from Deepak Kumar (20)
Recently uploaded
Recently uploaded (20)
Gene mapping
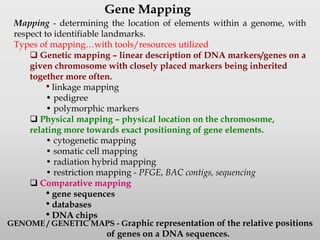
- 1. Mapping - determining the location of elements within a genome, with respect to identifiable landmarks. Types of mapping…with tools/resources utilized Genetic mapping – linear description of DNA markers/genes on a given chromosome with closely placed markers being inherited together more often. • linkage mapping • pedigree • polymorphic markers Physical mapping – physical location on the chromosome, relating more towards exact positioning of gene elements. • cytogenetic mapping • somatic cell mapping • radiation hybrid mapping • restriction mapping - PFGE, BAC contigs, sequencing Comparative mapping • gene sequences • databases • DNA chips Gene Mapping GENOME / GENETIC MAPS - Graphic representation of the relative positions of genes on a DNA sequences.
- 2. If two alleles are far apart on the chromosome, as it is more likely that a cross-over will occur between them and they will be separated. Genes inherited in this way are said to be linked, and are referred to as "linkage groups." For example, in fruit flies the genes affecting eye color are inherited together because they appear on the same chromosome. Image of crossing over occuring in chromosomes Sturtevant from the analyze of the fruit fly genome found, for example, that leg length was inherited with eye color more often than with wing length, and that wing length was inherited with eye color more often than with leg length. . Thus, he concluded, the gene for eye color must be between the genes for wing length and leg length. . CLASSICAL EXPERIMENT OF MAPPING
- 3. Linkage map versus physical map It follows that a linkage map is a chromosome shows the position of its known genes and/or markers relative to each other in terms of recombination frequency, rather than as specific physical distance along each chromosome as in physical maps
- 4. GENETIC MARKER (Landmarks on the map) - Any inherited physical or molecular characteristic that differs among individuals and is easily detectable in the laboratory is a potential genetic marker e.g. polymorphic/morphological markers like scorable phenotypes - in hemophilia, wrinkled pea and pedigrees used for genetic map construction. e.g. physical markers like RFLPs, RAPDs, AFLPs, VNTRs, STSs– used for physical map construction
- 5. Approaches to Genetic mapping 1. Experimental crosses - Backcrosses - F2 intercrosses - Introgression lines - Recombinant inbred (RI) lines 2. Pedigree analysis 3. Association studies (Linkage disequilibrium, LD mapping) - With candidate genes (direct approach) - Localized association studies (chromosomal region) - Whole-genome association studies
- 6. CONSTRUCTING GENETIC LINKAGE MAPS A. GENERATE MARKER DATA - informative markers - polymorphic and a population with known relationships B. CALCULATE ALL PAIR-WISE DISTANCES – Test for linkage between “close” markers, check for recombinations. C. GROUP MARKERS INTO LINKAGE GROUPS - Unit of distance in genetic maps = centimorgans, cM D. ORDER MARKERS IN EACH LINKAGE GROUP - 1 cM = 1% chance of recombination between markers
- 10. Constructing a Linkage map Two markers located in close proximity on the same chromosome tend to be linked Frequency of such occurrence leads to distance estimation between markers Thus the greater the frequency of recombination (segregation, localization of different chromosomes) between two genetic markers, the farther apart they are assumed to be. Conversely, the higher the frequency of association between the markers, the smaller the physical distance between them.
- 12. The basic idea in pedigree mapping is to follow affected individuals and markers in related families. Markers that are co-inherited with disease status are linked to the causative gene. Most useful pedigrees contain– nil parentage error, large population study, subsequent follow-up progeny study. Mapping with Pedigrees • Two unrelated pedigrees • Haplotypes in each pedigree are identified by numbers (different for each family), and determined from five linked markers • Dark blue - affected • White - unaffected • Light blue - status uncertain • In each case one haplotype, in red, co-segregates with the disease
- 13. The resolution of mapping using crosses or pedigrees depends on the amount of recombination, which is determined mostly by the number of meioses. Since mapping studies cannot be easily performed with very large numbers of individuals or very many generations, their resolution is generally poor. They provide a good way for localizing genes to genomic regions, but typically do not provide sufficient resolution to locate the gene. They are also inefficient at finding alleles of very weak effect or at low frequencies in populations One solution is to take advantage of historical recombination in the ancestry of a lineage. Linkage disequilibrium is the non-random association of alleles at different loci. These associations are caused by the mutational process and are broken down by recombination in the population over time. LD mapping is more efficient for finding genes of small effect (as may underlie most complex diseases), for detecting contributions of rare alleles, and for localizing the gene of interest.
- 15. Because map distances are additive, calculation of the A–B and A–C distances leaves us with the two possibilities shown for the B–C distance.
- 16. The goal of genetic mapping is to find the genes underlying traits of interest. The basic idea in all mapping studies is to look for markers that are inherited with the trait. Physical linkage will result in co-inheritance, while recombination and independent assortment will disrupt these associations. In general, markers that are co-inherited with a trait are more likely to be physically close to the genes underlying the trait. Inheritance can be followed in controlled crosses, in pedigrees, or in the gene genealogies of a species. Traits can be simple (controlled by one or a few genes, with little environmental influence; e.g. eye color in Drosophila, cystic fibrosis in humans) or complex (controlled by many genes with many environmental influences; e.g. asthma, heart disease). Mendelian traits - discrete, controlled by one or a few genes Quantitative traits - continuous, controlled by many genes (QTL - Quantitative Trait Loci) Mapping Quantitative Traits
- 18. PHYSICAL MAPPING - Cytogenetic Mapping Cytogenetic mapping refers to observing a map location in reference to a chromosomal banding pattern. e.g. In situ hybridization - allow a rough determination of localization of fragments of DNA, but to not yield a direct measure of distance.
- 19. Somatic Cell Hybrid Mapping Somatic cell mapping can be used to map an element to a portion of a genome. typically with chromosome resolution Exploits the ability of rodent (hamster) cells to stably integrate genetic material from other species. Cells from the target genome are fused with hamster cells. The resulting cells are then screened for cells (hybrids) that have retained one or more of the chromosomes from the target genome. Ideally, a complete set of hybrids can be constructed such that each has retained a single chromosome from the target genome. Using PCR and gene primers-DNA from the clones can be used to see if certain genes are present in marked clones– leading to cytogenetic gene mapping. DNA from cell lines used to form a panel and here no polymorphisms needed. Finer mapping (higher resolution) can be obtained if hybrids are present in the panel that contain partial chromosomes. (E.g., translocations)
- 20. Somatic Cell Hybrid Mapping Probe1 Probe2 Probe3 1 2 3 4 5 Chromosome 0 1 1 1 1 1 1 1 1 000 000 Probe1 -- maps to chromosome 2 Probe2 -- maps to chromosomes 3 and 4 -- possible paralogs, pseudogene, or low-copy repeat Probe3 -- maps to all chromosomes -- possible high-copy repeat or ribosomal genes
- 21. Radiation Hybrid Mapping Radiation hybrid mapping is a method for high- resolution mapping. Exploits the ability of rodent cells (hamster cells) to stably incorporate genetic material from fused cells (same as SCH). Panel is created by breaking the chromosome of interest or whole genome into several fragments by high X- ray irradiation. Use PCR to screen clones that are analyzed for presence or absence of markers.
- 22. Restriction Mapping Restriction enzymes - cut DNA at specific sites Ex. EcoRI cuts at GAATTC sites are often palindromic GAATTC CTTAAG may leave blunt ends or overlaps GGCC GG CC CCGG CC GG GAATTC G AATTC CTTAAG CTTAA G Restriction maps show the relative location of a selection of restriction sites along linear or circular DNA. HindIII BamHI PstII PstII BamHI HindIII EcoRI
- 23. Restriction Mapping BglII BamHI PstI BglII +BamHI BglII +PstI BamHI +PstI 4.2 5.2 3.6 3.5 3.3 2.6 1.7 1.7 1.4 1.4 1.2 1.2 1.0 1.0 1.2 0.7 0.9 0.5 0.3 0.30.3 BglII BamHI PstI BglII PstI 0.3 0.7 2.6 0.9 0.5 1.2
- 32. . Physical maps. the highest-resolution physical map is the complete nucleotide sequence of the chromosomes. the lowest-resolution physical map an ordered set of landmarks (or markers) with the physical distances in DNA-base-pairs from one landmark to another. Landmark or "sequence-tagged site," (STS) is a unique DNA sequence— one that is found in only one place in the genome—and is a few hundred base pairs long. Thus finding a piece of DNA with STS shows exactly where in the genome that piece of DNA belongs. One of the early goals of the Human Genome Project was to select and map a set of STS markers such that there would be at least one STS in each stretch of 100 kb of the genome. Markers DNA
- 33. Comparison of chromosomal, linkage, and physical maps on Chr 17. The chromosomal and linkage maps extend over the entire chromosome with lines connecting the relative positions of loci mapped in both. An example of a long-range physical map for a 1,200 kb genomic interval is shown along with a short-range physical map for the gene itself.
- 34. Can be very useful in utilizing animal models of human disease, and also in exploring the causes of complex diseases. Comparing gene content, localization and ordering among multiple species. Comparative Mapping Sources of Information sequence mapping BLAST potential orthologs colocalization sequence mapping Putative orthologs and syntenic segments GeneMap 99 (human) • 42,000 ESTS • 12,500 genes Mouse RH consortium (mouse) • 14,000 ESTs UIowa EST placements (rat) • 13,793 ESTs
- 37. Summary of Mapping Strategies
- 38. Genetic Variation Program supports research aimed at: FIND differences in the sequence of DNA among individuals are called genetic variation, which could explain some of the differences among people, such as eye color and blood group, and a risk for getting particular diseases. DISCOVER single nucleotide polymorphisms (SNPs) and other forms of genetic variation on a large scale across the genome. DEVELOP high-resolution maps of genetic variation and haplotypes. USE statistical methods to relate genetic variation to phenotype.
- 39. Genome variations include mutations and polymorphisms. If a given variation …A C T G A… …A C C G A… (T ⇔ C) is present in less than 1 percent of people (for instance, 99.9 percent of people have a T and 0.1 percent have a G), then the variation is called a mutation, if in more than 1 percent then the variation is called a polymorphism. The term mutation was originally used by Dutch botanist Hugo De Vries (1848–1935) to describe rapid changes in phenotype from one generation to the next. Now the term mutation used to describe heritable physical changes to genes. Mutations range from the single base point mutations to mutations that can span many functional genes. About 90 percent of human genome variation comes in the form of single nucleotide polymorphisms, or SNPs (“snip”)
- 40. The most popular SNPs ? Two of every three SNPs involve the replacement of cytosine (C) with thymine (T). Where SNPs can occur ? in both coding (gene) and noncoding regions of the genome. Are SNPs evolutionarily stable ? SNPs are evolutionarily stable --not changing much from generation to generation. Why analysis of SNPs are important? It helps to understand people's widely differing susceptibilities to common diseases such as heart disease, diabetes, and various forms of cancer. This answer shows another difference between mutation and SNP: Mutations may be associated with inherited diseases (the Huntington's disease mutation), but SNPs act in more subtle ways. SNPs don't cause disease—they are risk factors for disease.
- 41. SNPs and Disease Diagnosis SNPs are not responsible for a disease state, they serve as biological markers for pinpointing a disease on the human genome map, because they are usually located near a gene found to be associated with a certain disease. Two steps to create a genetic test for screening for a disease. 1) identify the disease-causing gene; 2) compare DNA for SNP patterns of a group of individuals - Non-affected and Affected by the disease. This type of comparison, called an "association study", can detect differences between the SNP patterns of the two groups, Then physicians can screen individuals for susceptibility to a disease just by analyzing their DNA samples for specific SNP patterns.
- 42. •Close genes are usually inherited together. •In some cases, recombination (crossover) may occur during meiosis, thus separating genes / loci. Chromosomal crossoveris the exchange of genetic material between homologous chromosomes during prophase 1 of meiosis. The larger the distance between 2 genetic loci, the greater the chance that they will be separated by a crossover. The relative distance between two genes can be calculated using the offspring of an organism showing two linked genetic markers, and finding the percentage of the offspring where the two loci are not found together. The higher the percentage of the offspring that does not show both traits, the farther apart on the chromosome the two genes are. By calculating the recombination frequency between the 2 genes/ loci, the approximate distance between them can be determined. •If the position of one gene/locus in the genome is known (marker locus), the second gene’s approximate location can be predicted (estimated). •For example, in Drosophila the genes affecting eye color and wing length are inherited together because they appear on the same chromosome. •Genes are not considered reliable markers since they are not always close enough to each other to allow precise determination of chromosomal location. •Other physical markers (loci) are generally short stretches of DNA with known sequence and location in the genome, such as single nucleotide polymorphisms (SNPs) and microsatellites, which consist of repeating units of 2-6 bp. Linkage Mapping Linkage Mapping
- 43. Instead of beginning with a mutant organism and proceeding to identify the mutated gene / gene function, reverse genetics approach starts with a particular gene, mutating it, transferring it to cells or an organism then analyzing its function. •By studying encoded protein structure, inactivating mutations can be designed so that it may interfere with protein functions. •Truncation mutations; sequence alteration may be done by using different fragments of the gene, which encode truncated gene products and analyze the function of these constructs as compared to the full-length gene product (wild-type). •Site-directed mutations; the DNA sequence alteration involves a single amino-acid change in the encoded product. It usually performed by PCR using a primer(s) that contain the desired mutation and used to amplify the normal gene in conditions that permits annealing of imperfectly matching primer(s). •Expression of mutated gene; altered DNA sequence is cloned into an expression vector (under control of inducible promoter), transferred to target cells (transformation / transfection) or an organism (transgenic technology), allowed to be expressed (switched on or off on demand), observe the effects and determine the gene product’s function. Reverse Genetics