More Related Content
Similar to Richardson TX - January 2011 - Housing Market Report
Similar to Richardson TX - January 2011 - Housing Market Report (18)
More from Valarie Littles
More from Valarie Littles (9)
Richardson TX - January 2011 - Housing Market Report
- 1. Valarie Littles Ultima Real Estate
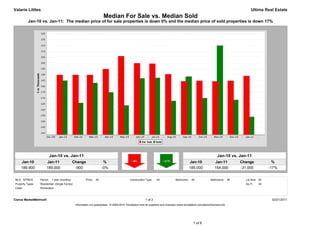
Median For Sale vs. Median Sold
Jan-10 vs. Jan-11: The median price of for sale properties is down 0% and the median price of sold properties is down 17%
Jan-10 vs. Jan-11 Jan-10 vs. Jan-11
Jan-10 Jan-11 Change % Jan-10 Jan-11 Change %
189,900 189,000 -900 -0% 185,000 154,000 -31,000 -17%
MLS: NTREIS Period: 1 year (monthly) Price: All Construction Type: All Bedrooms: All Bathrooms: All Lot Size: All
Property Types: Residential: (Single Family) Sq Ft: All
Cities: Richardson
Clarus MarketMetrics® 1 of 2 02/21/2011
Information not guaranteed. © 2009-2010 Terradatum and its suppliers and licensors (www.terradatum.com/about/licensors.td).
1 of 6
- 2. Valarie Littles Ultima Real Estate
Median For Sale vs. Median Sold
Jan-10 vs. Jan-11: The median price of for sale properties is down 0% and the median price of sold properties is down 17%
For Sale # Properties Sold # Properties Price
Time Period Median For Sale Median Sold Difference
Jan-11 189,000 448 154,000 29 -35,000
Dec-10 184,900 446 168,500 64 -16,400
Nov-10 184,500 503 215,000 53 30,500
Oct-10 184,900 527 170,000 67 -14,900
Sep-10 184,500 534 188,500 66 4,000
Aug-10 190,500 584 167,634 76 -22,867
Jul-10 199,500 571 187,400 65 -12,100
Jun-10 199,900 503 187,000 91 -12,900
May-10 205,900 479 163,800 82 -42,100
Apr-10 194,900 505 175,000 93 -19,900
Mar-10 189,900 460 183,000 69 -6,900
Feb-10 189,900 367 165,900 53 -24,000
Jan-10 189,900 337 185,000 43 -4,900
Clarus MarketMetrics® 2 of 2 02/21/2011
Information not guaranteed. © 2009-2010 Terradatum and its suppliers and licensors (www.terradatum.com/about/licensors.td).
2 of 6
- 3. Valarie Littles Ultima Real Estate
Supply & Demand by Month
Jan-10 vs. Jan-11: The number of for sale properties is up 33% and the number of sold properties is down 33%
Jan-10 vs. Jan-11 Jan-10 vs. Jan-11
Jan-10 Jan-11 Change % Jan-10 Jan-11 Change %
337 448 111 +33% 43 29 -14 -33%
MLS: NTREIS Period: 1 year (monthly) Price: All Construction Type: All Bedrooms: All Bathrooms: All Lot Size: All
Property Types: Residential: (Single Family) Sq Ft: All
Cities: Richardson
Clarus MarketMetrics® 1 of 2 02/21/2011
Information not guaranteed. © 2009-2010 Terradatum and its suppliers and licensors (www.terradatum.com/about/licensors.td).
3 of 6
- 4. Valarie Littles Ultima Real Estate
Supply & Demand by Month
Jan-10 vs. Jan-11: The number of for sale properties is up 33% and the number of sold properties is down 33%
# Properties Average DOM # Properties Average DOM
Time Period For Sale For Sale Sold Sold
Jan-11 448 120 29 82
Dec-10 446 138 64 77
Nov-10 503 143 53 75
Oct-10 527 146 67 67
Sep-10 534 149 66 47
Aug-10 584 144 76 52
Jul-10 571 144 65 51
Jun-10 503 150 91 65
May-10 479 145 82 52
Apr-10 505 134 93 47
Mar-10 460 133 69 58
Feb-10 367 141 53 46
Jan-10 337 143 43 54
Clarus MarketMetrics® 2 of 2 02/21/2011
Information not guaranteed. © 2009-2010 Terradatum and its suppliers and licensors (www.terradatum.com/about/licensors.td).
4 of 6
- 5. Valarie Littles Ultima Real Estate
Months Supply of Inventory
Jan-10 vs. Jan-11: The average months supply of inventory is up 35%
Jan-10 vs. Jan-11
Jan-10 Jan-11 Change %
3.6 4.8 1.2 +35%
MLS: NTREIS Period: 1 year (monthly) Price: All Construction Type: All Bedrooms: All Bathrooms: All Lot Size: All
Property Types: Residential: (Single Family) Sq Ft: All
Cities: Richardson
Clarus MarketMetrics® 1 of 2 02/21/2011
Information not guaranteed. © 2009-2010 Terradatum and its suppliers and licensors (www.terradatum.com/about/licensors.td).
5 of 6
- 6. Valarie Littles Ultima Real Estate
Months Supply of Inventory
Jan-10 vs. Jan-11: The average months supply of inventory is up 35%
# Units For Sale # UC Units UC Average
Time Period Last Day of Month During Month MSI DOM
Jan-11 323 67 4.8 75
Dec-10 359 31 11.6 63
Nov-10 376 55 6.8 74
Oct-10 403 66 6.1 73
Sep-10 416 58 7.2 70
Aug-10 432 77 5.6 52
Jul-10 450 69 6.5 56
Jun-10 398 58 6.9 58
May-10 363 64 5.7 54
Apr-10 350 115 3.0 60
Mar-10 318 96 3.3 48
Feb-10 277 60 4.6 47
Jan-10 240 67 3.6 51
Clarus MarketMetrics® 2 of 2 02/21/2011
Information not guaranteed. © 2009-2010 Terradatum and its suppliers and licensors (www.terradatum.com/about/licensors.td).
6 of 6