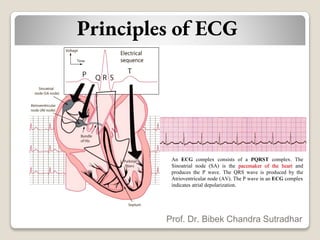
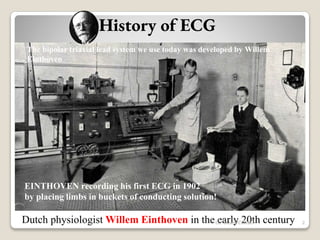
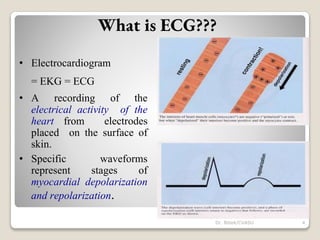
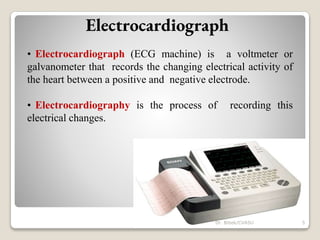
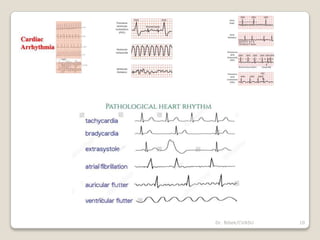
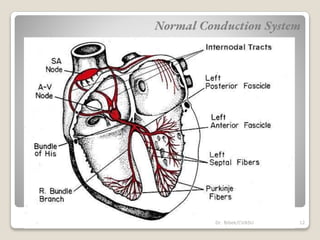
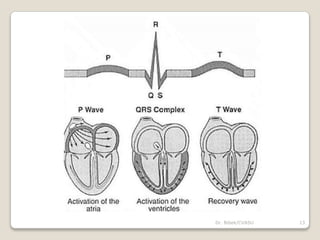
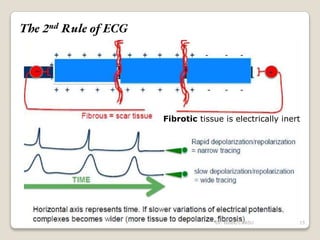
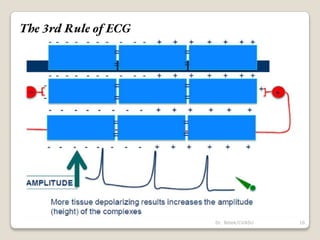
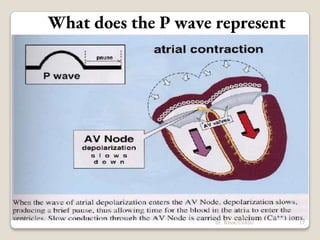
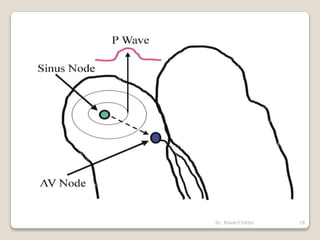
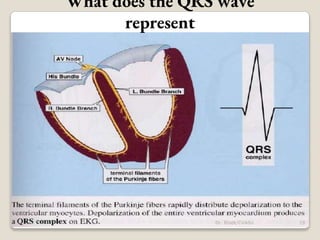
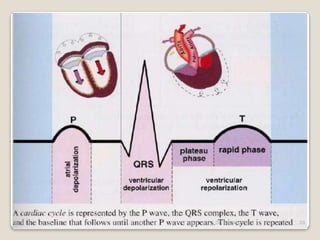
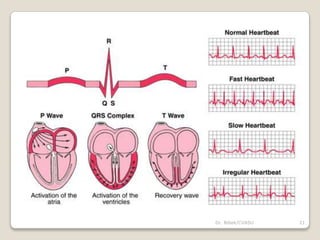
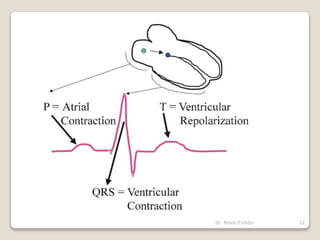
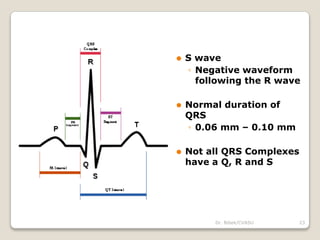
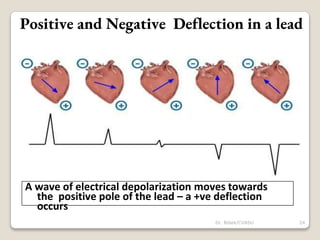
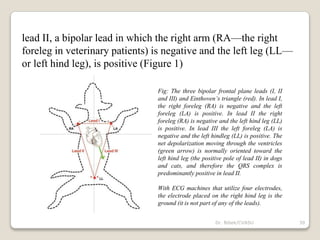
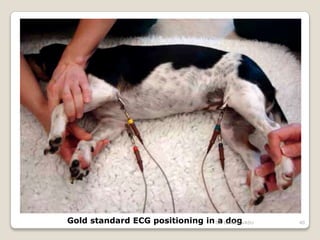
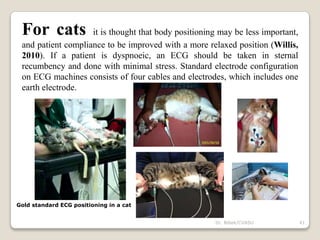
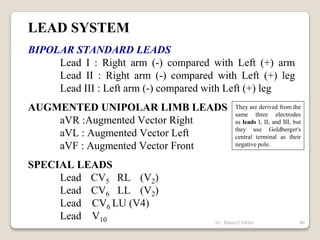
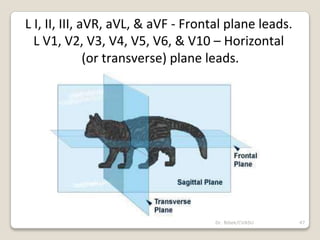
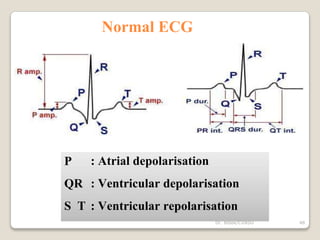
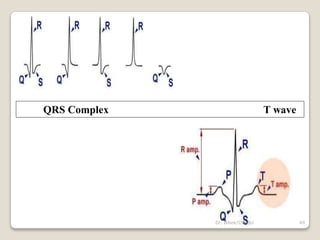
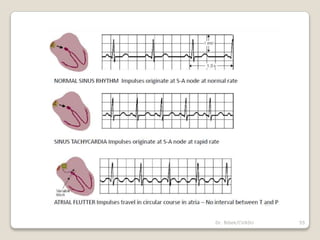
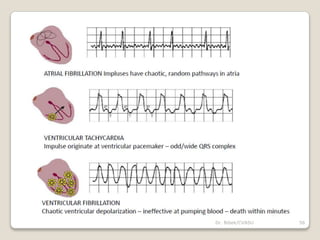
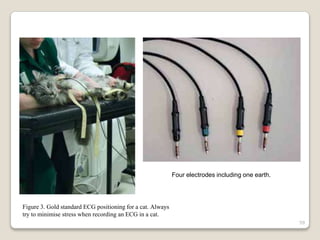
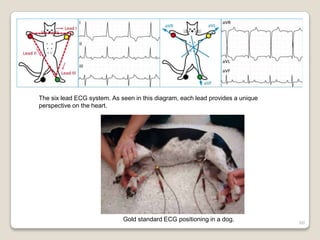
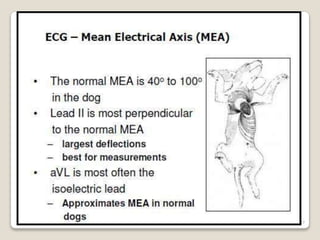
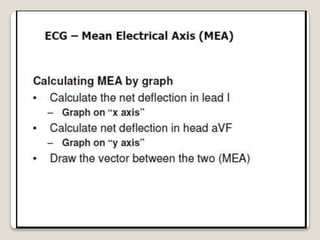
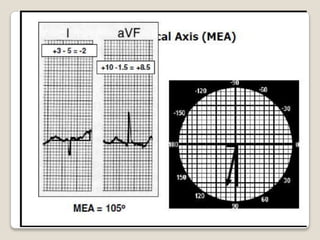
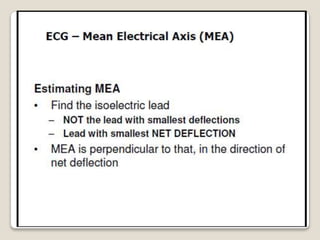
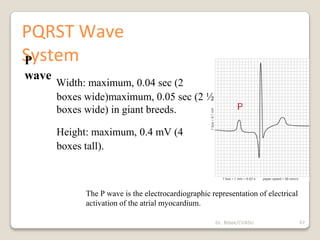
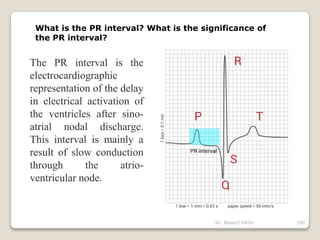
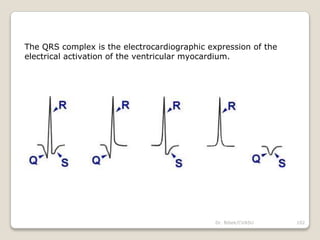
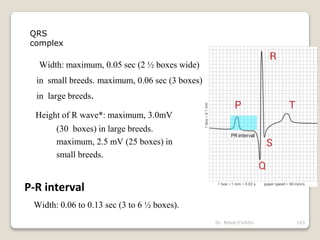
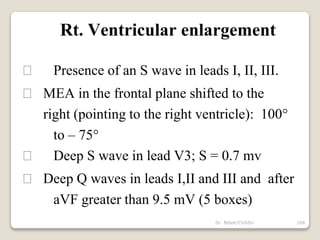
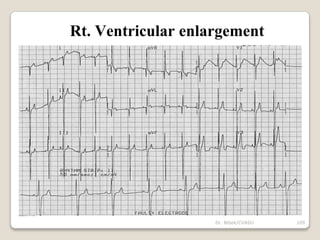
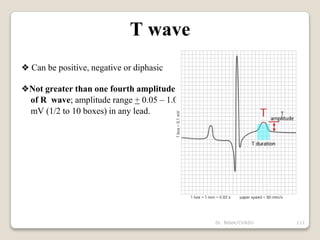
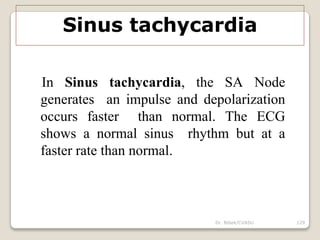
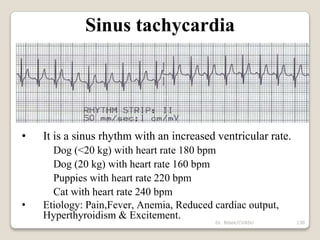
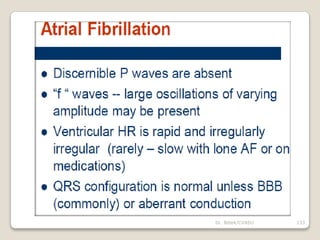
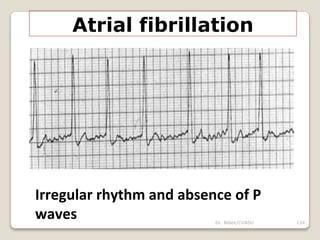
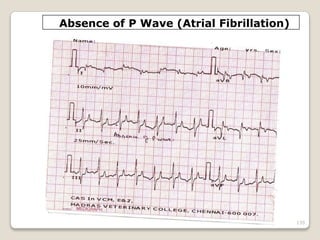
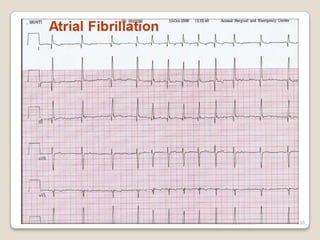
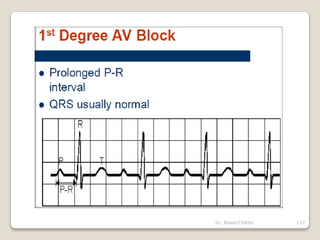
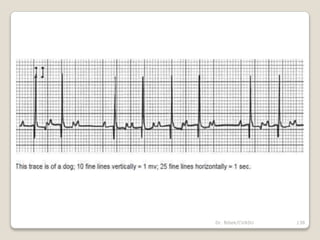
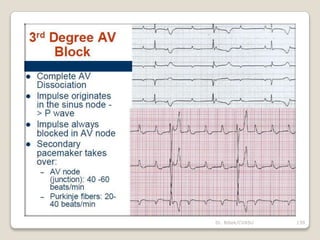
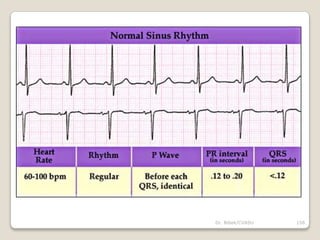
Principles of ECG
Prof. Dr. Bibek Chandra Sutradhar
An ECG complex consists of a PQRST complex. The
Sinoatrial node (SA) is the pacemaker of the heart and
produces the P wave. The QRS wave is produced by the
Atrioventricular node (AV). The P wave in an ECG complex
indicates atrial depolarization.
History of ECG
Dutch physiologist Willem Einthoven in the early 20th century
EINTHOVEN recording his first ECG in 1902
by placing limbs in buckets of conducting solution!
The bipolar triaxial lead system we use today was developed by Willem
Einthoven
2
Dr. Bibek/CVASU
3
Dr. Bibek/CVASU
• Electrocardiogram
= EKG = ECG
• A recording of the
electrical activity of the
heart from electrodes
placed on the surface of
skin.
• Specific waveforms
represent stages of
myocardial depolarization
and repolarization.
What is ECG???
4
Dr. Bibek/CVASU
Electrocardiograph
• Electrocardiograph (ECG machine) is a voltmeter or
galvanometer that records the changing electrical activity of
the heart between a positive and negative electrode.
• Electrocardiography is the process of recording this
electrical changes.
5
Dr. Bibek/CVASU
Indications
6
Dr. Bibek/CVASU
Indications
The electrocardiogram (ECG) is a valuable diagnostic test in
veterinary medicine and is easy to acquire.
It is the most important test to perform in animals with an
auscultable arrhythmia (other than sinus arrhythmia in
dogs).
The ECG may also yield useful information regarding
chamber dilation and hypertrophy. However, the ECG does
not record cardiac mechanical activity, so it does not yield
information regarding cardiac contractility. It’s also
important to remember that the ECG may be normal even in
the face of advanced cardiovascular disease.
7
Dr. Bibek/CVASU
1. Cardiac arrhythmias.
2. Acute onset of dyspnoea
3. Shock.
4. Fainting or seizures.
5. Cardiac monitoring during and after surgery.
6. Cardiac murmurs.
7. Cardiomegaly found on thoracic radiographs.
Indications
8
Dr. Bibek/CVASU
8. Cyanosis.
8. Pre operatively in older animals.
10. Evaluating the effect of cardiac drugs –
especially
quinidine and propanolol.
11. Electrolyte disturbances, especially potassium
abnormalities.
11. Systemic diseases that affect the heart.
11. Serial electrocardiograms as an aid in the prognosis and
diagnosis of cardiac disease.
Indications
9
Dr. Bibek/CVASU
10
Dr. Bibek/CVASU
Normal Conduction System
11
Dr. Bibek/CVASU
Normal Conduction System
12
Dr. Bibek/CVASU
13
Dr. Bibek/CVASU
The 1st Rule of ECG
• A current of depolarization
traveling towards the +
electrode is recorded as a
positive deflection
• A current of depolarization
traveling away from the +
electrode is seen as a
negative deflection
• A current of
repolarization traveling
away from the + electrode
is seen as a positive
deflection
Fig: As the positive wave of depolarization within the myocytes flows toward a
positive electrode, there is a positive (upward) deflection recorded on EKG
Positive deflection Negative deflection Biphasic deflection
Isoelectric line
14
Dr. Bibek/CVASU
The 2nd Rule of ECG
Fibrotic tissue is electrically inert
15
Dr. Bibek/CVASU
The 3rd Rule of ECG
16
Dr. Bibek/CVASU
What does the P wave represent
17
Dr. Bibek/CVASU
Dr. Bibek/CVASU 18
What does the QRS wave
represent
19
Dr. Bibek/CVASU
20
Dr. Bibek/CVASU
Dr. Bibek/CVASU 21
Dr. Bibek/CVASU 22
Dr. Bibek/CVASU 23
⚫ S wave
◦ Negative waveform
following the R wave
⚫ Normal duration of
QRS
◦ 0.06 mm – 0.10 mm
⚫ Not all QRS Complexes
have a Q, R and S
Positive and Negative Deflection in a lead
A wave of electrical depolarization moves towards
the positive pole of the lead – a +ve deflection
occurs
24
Dr. Bibek/CVASU
Limitations
ECG must always be evaluated in conjunction
with clinical findings
öAn animal with CHF may have a normal ECG
and normal animal may show non specific
electrocardiographic abnormalities
25
Dr. Bibek/CVASU
Types of ECG
26
Dr. Bibek/CVASU
o Single channel recorder
-Has one stylus – records one lead
at a time
o Multiple channel recorder
-Has more than one stylus provide
simultaneous tracings of 3 leads
27
Dr. Bibek/CVASU
28
Dr. Bibek/CVASU
Dr. Bibek/CVASU 29
Position & Restraint
o Lateral recumbency - the standard position for canine and
feline electrocardiography
o No chemical restraint
o Trained attendant or animal owner
o Lead placement
30
Dr. Bibek/CVASU
Preparing for the ECG
• Place the patient on a padded surface; don’t let the patient
or the clips touch metal.
• Place the patient in right-lateral recumbency when possible.
Note: This is the only position valid to determine the ECG axis. Other
acceptable positions include standing or sternal, however, we need the
position included in the history if not in right-lateral recumbency.
Try these techniques to minimize panting, shaking or purring:
• For animals that are shaking try placing your hands on either side of
the chest and apply moderate pressure.
• To reduce panting, hold the patient’s mouth closed. Be careful not to
obstruct breathing.
• To stop purring, wave an alcohol-soaked cotton ball under the
patient’s nose.
How to Prepare a Patient for an ECG
31
Dr. Bibek/CVASU
• Make sure that the patient’s limbs do not touch each other.
• Make sure cables and electrodes do not touch each other or
anything metal.
• Soak the area to be clipped with alcohol.
• Part the fur for good skin contact and attach clips 1"–2" below
elbows and knees. Clip back dense fur.
• Do not place clips on calluses or joints.
32
Dr. Bibek/CVASU
How to get a chest lead
•A chest lead may be helpful if the P wave is not clear or if
the complexes are small.
• Follow the general instructions for using clips, but clip the
black cable to the left side of the chest, between fourth and
fifth ribs, wherever you feel the strongest heartbeat.
• Place the other clips on the limbs, as previously described.
33
Dr. Bibek/CVASU
Firmly insert the lead tip of the patient cable to the electrode,
matching the tip color and electrode site. Refer to the table below.
PATIENT CABLE TIP COLOR COATING
34
Dr. Bibek/CVASU
Problem solving with cats
Unlike humans and most dogs, the cardiac axis is not aligned
top right to bottom left in cats. The heart has a tendency to lie
more centrally with its apex more ventral than the atria, i.e.,
the heart points downward towards the ground when the
animal stands.
This gives rise to one of the common problems with monitoring cats,
finding the strongest signal to present to the RA and LL electrodes. The
best signal is derived top/bottom axis i.e. Lead II in humans, with RA
looking at the top of the heart and LL at the bottom. In cats, as stated, the
axis may not lie across the body. (see figure 1)
35
Dr. Bibek/CVASU
Figure-1
36
Dr. Bibek/CVASU
As lead II may not align with the cat’s axis, the signal is
small and sometimes cancels. Therefore, by moving RA
more centrally onto the cat’s body above the top, and LL
onto the cat’s body below the bottom of the heart, a much
larger signal will be obtained. The plane in which the cat’s
heart lies within its body may also vary. The “top” of the
heart may be more dorsal and the “bottom” more ventral. In
this case, we would refer to the base/apex axis (see figure 2)
when the following instructions should be followed. 1. Move
LL to the left apex of the heart. 2. Move RA to the V10
position (over the dorsal spinous process of the seventh
thoracic vertebra) and LL to the V4 position (sixth left
intercostal space at the costochondrail junction). It will be
necessary to annotate the printouts, if any, with actual
configurations used to avoid later confusion.
37
Dr. Bibek/CVASU
38
Dr. Bibek/CVASU
lead II, a bipolar lead in which the right arm (RA—the right
foreleg in veterinary patients) is negative and the left leg (LL—
or left hind leg), is positive (Figure 1)
Fig: The three bipolar frontal plane leads (I, II
and III) and Einthoven’s triangle (red). In lead I,
the right foreleg (RA) is negative and the left
foreleg (LA) is positive. In lead II the right
foreleg (RA) is negative and the left hind leg (LL)
is positive. In lead III the left foreleg (LA) is
negative and the left hindleg (LL) is positive. The
net depolarization moving through the ventricles
(green arrow) is normally oriented toward the
left hind leg (the positive pole of lead II) in dogs
and cats, and therefore the QRS complex is
predominantly positive in lead II.
With ECG machines that utilize four electrodes,
the electrode placed on the right hind leg is the
ground (it is not part of any of the leads).
39
Dr. Bibek/CVASU
Gold standard ECG positioning in a dog 40
Dr. Bibek/CVASU
For cats it is thought that body positioning may be less important,
and patient compliance to be improved with a more relaxed position (Willis,
2010). If a patient is dyspnoeic, an ECG should be taken in sternal
recumbency and done with minimal stress. Standard electrode configuration
on ECG machines consists of four cables and electrodes, which includes one
earth electrode.
Gold standard ECG positioning in a cat
41
Dr. Bibek/CVASU
Dr. Bibek/CVASU 42
Electrodes &
Leads
43
Dr. Bibek/CVASU
ELECTRODES
Alligator clips or flat contact electrodes
Hair and stern surrounding the electrode should be
moistened with conductive gel or alcohol
Standard paper speed : 50 mm/sec.
Left Arm (LA), Right Arm (RA) and Left Leg (LL)
44
Dr. Bibek/CVASU
Dr. Bibek/CVASU 45
Standard leads
Useful for studying
1. Abnormalities in the P-QRS-T
deflection
2. Diagnosing cardiac arrhythmias
3. Determining the mean electrical axis
LEAD SYSTEM
BIPOLAR STANDARD LEADS
Lead I : Right arm (-) compared with Left (+) arm
Lead II : Right arm (-) compared with Left (+) leg
Lead III : Left arm (-) compared with Left (+) leg
AUGMENTED UNIPOLAR LIMB LEADS
aVR :Augmented Vector Right
aVL : Augmented Vector Left
aVF : Augmented Vector Front
SPECIAL LEADS
Lead CV5 RL (V2)
Lead CV6 LL (V2)
Lead CV6 LU (V4)
Lead V10
They are derived from the
same three electrodes
as leads I, II, and III, but
they use Goldberger's
central terminal as their
negative pole.
46
Dr. Bibek/CVASU
L I, II, III, aVR, aVL, & aVF - Frontal plane leads.
L V1, V2, V3, V4, V5, V6, & V10 – Horizontal
(or transverse) plane leads.
47
Dr. Bibek/CVASU
Normal ECG
P
QR
S T
: Atrial depolarisation
: Ventricular depolarisation
: Ventricular repolarisation
48
Dr. Bibek/CVASU
QRS Complex T wave
49
Dr. Bibek/CVASU
Normal ECG Parameters - Dog & Cat
Heart Rate (beats per minute) :
Canine :
»Adults: 70-160
»Toy Breeds: up to 180
»Puppies: up to 220
Feline :
»160-240
50
Dr. Bibek/CVASU
Amplitudes (mV) in lead II
P amp
Canine
< 0.4
Feline
< 0.2
R < 20 kg: < 2.5
> 20 kg: < 3.0 <
0.9
51
Dr. Bibek/CVASU
Intervals (seconds)
Canine Feline
P < 0.04 < 0.04
PR 0.06 -0.13 0.05 - 0.09
QRS < 20 kg: < 0.05 < 0.04
> 20 kg: < 0.06
QT 0.15 to 0.25 0.12 to 0.18
52
Dr. Bibek/CVASU
Normal ECG Parameters - Dog & Cat
Rhythm : rhythm controlled by sinus node at a rate of 60-100
beats/min; each P wave followed by QRS and each QRS preceded
by a P wave.
Canine :
Normal sinus rhythm
Sinus arrhythmia
Wandering atrial pacemaker
Feline :
Normal sinus rhythm
Sinus tachycardia
53
Dr. Bibek/CVASU
Specific Arrhythmias
• Sinus bradycardia
• Sinus tachycardia
• Sick sinus syndrome- disturbance of SA nodal function that results
in a markedly variable rhythm (cycles of bradycardia and
tachycardia).
• Atrial flutter - sinus rate of 250-350 beats/min
• AV nodal blocks - a conduction block within the AV node (or
occasionally in the bundle of His) that impairs impulse conduction
from the atria to the ventricles.
• Ventricular flutter - very rapid ventricular depolarizations
>250/min
• Ventricular fibrillation - uncoordinated ventricular
depolarizations;
leads to death if not quickly corrected
54
Dr. Bibek/CVASU
55
Dr. Bibek/CVASU
56
Dr. Bibek/CVASU
57
Dr. Bibek/CVASU
58
Dr. Bibek/CVASU
Methodical approaches to
ECG
59
Figure 3. Gold standard ECG positioning for a cat. Always
try to minimise stress when recording an ECG in a cat.
Four electrodes including one earth.
60
The six lead ECG system. As seen in this diagram, each lead provides a unique
perspective on the heart.
Gold standard ECG positioning in a dog.
61
Electrode
Colour for British
machines
Colour for American
machines
Right forelimb Red White
Left forelimb Yellow Black
Left hindlimb Green Red
Right hindlimb Black Green
Electrode placement for UK and US ECG machines
62
An example of electrical artefact. Note the unclear baseline making P wave identification impossible.
ECG machine showing gain and speed.
63
Heart rate calculation using an ECG ruler. The ruler has one side for 25 mm/seconds, the
other for 50 mm/second. The ruler should be lined up with lead II as shown, and the distance
from the first R wave to the next R wave equals the heart rate. In this example, the heart rate
is 160 beats/min. If the rate is variable on the ECG trace (if it slows down or speeds up),
repeated measurements might need to be taken along lead II to give a more accurate answer.
64
BIC pen method for 25 mm/second or 50 mm/second. Lie the BIC pen alongside lead II.
Measure from the first R wave, count the number of R wave intervals, until the end of the pen.
Depending on the paper speed, multiply by 10 if the paper speed is 25 mm/second or 20 if the
paper speed is 50 mm/second. As with the ruler method, a number of measurements might be
needed if the rate is variable.
Dr. Bibek/CVASU 65
ECG interpretation essentially involves four
main steps:
1. Calculation of the heart rate;
2. Determination of the heart rhythm;
3. Measurement of the complex amplitudes and intervals;
4. MEASUREMENT OF THE MEAN ELECTRICAL AXIS:
A good understanding of the electrical activity of the heart is key to
the accurate interpretations of ECG (Martin, 2002).
Dr. Bibek/CVASU 66
Dr. Bibek/CVASU 67
Dr. Bibek/CVASU 68
Dr. Bibek/CVASU 69
Dr. Bibek/CVASU 70
Dr. Bibek/CVASU 71
Dr. Bibek/CVASU 72
Dr. Bibek/CVASU 73
How to measure heart rate
???
Dr. Bibek/CVASU 74
1. Calculation of the average heart rate
• Each large box = 5 × 5 small boxes
• At a paper speed of 25 mm/sec:□ 5 large boxes (a 25-
mm length of paper) pass in 1 second
• In 1 minute, 5 × 60 boxes (300) pass. Therefore each
large box = 0.2 second
• 25 small boxes pass in 1 second
• In 1 minute, 25 × 60 boxes (1500) pass. Therefore
each small box = 0.04 second
Use either of the following methods to calculate heart rate.
(Either method can be used in any species, as long as the heart rhythm
is regular; this method is not reliable if bradycardia with pauses is
present.)
Dr. Bibek/CVASU 75
First, start at a complex on a heavy line (see arrows in figures
following), then go to the next complex.
▪ Count number of large boxes (5 × 5 small boxes) between
consecutive R waves of complexes
-Divide 300 by this number
▪ Count the number of small boxes between consecutive R
waves of complexes
-Divide 1500 by this number
Note: At a paper speed of 50 mm/sec use the same method but substitute
600 for 300 and 3000 for 1500.
Dr. Bibek/CVASU 76
Dog
This dog’s heart rate can be calculated as 300 ÷ 2.4 = 125. An
alternative method is 1500 ÷ 12 = 125.
Dr. Bibek/CVASU 77
Cat
This cat’s heart rate can be calculated as 1500 ÷ 9.5 = 158.
An alternative method is 300 ÷ 1.9 = 158.
Dr. Bibek/CVASU 78
Dr. Bibek/CVASU 79
Dr. Bibek/CVASU 80
Dr. Bibek/CVASU 81
See the Rhythm …Regular
or irregular???
Dr. Bibek/CVASU 82
Rhythm
1. Regular
irregular
2. Irregular
irregular
Dr. Bibek/CVASU 83
How to decide
MEA???
Dr. Bibek/CVASU 84
• The Vector Method: Using leads I, II or III and the frontal
plane diagram, calculate the algebraic sum of the QRS
deflections in any two leads.
• The Isoelectric Method.
• The Largest Net Deflection Method.
There are three common methods of calculating
the MEA in the frontal plane
Dr. Bibek/CVASU 85
Dr. Bibek/CVASU 86
Dr. Bibek/CVASU 87
Dr. Bibek/CVASU 88
Dr. Bibek/CVASU 89
Dr. Bibek/CVASU 90
Dr. Bibek/CVASU 91
Dr. Bibek/CVASU 92
Dr. Bibek/CVASU 93
Dr. Bibek/CVASU 94
Normal ECG
Dr. Bibek/CVASU 95
What differentiates a segment from an interval?
A segment is a straight line connecting two waves.
An interval encompasses at least one wave plus the
connecting straight line.
96
Dr. Bibek/CVASU
Dr. Bibek/CVASU 97
PQRST Wave
System
P
wave
Width: maximum, 0.04 sec (2
boxes wide)maximum, 0.05 sec (2 ½
boxes wide) in giant breeds.
Height: maximum, 0.4 mV (4
boxes tall).
The P wave is the electrocardiographic representation of electrical
activation of the atrial myocardium.
Dr. Bibek/CVASU 98
Right atrial enlargement - P too high in L II.
Dog: P > 0.4 mv ; Cat: P > 0.2 mv
Biatrial enlargement - P too tall and wide in L II.
Left atrial enlargement - P too wide in L II.
Dog & Cat : P > 0.04 sec
Dr. Bibek/CVASU 99
Rt Atrial enlargement (P Amp )
Dr. Bibek/CVASU 100
What is the PR interval? What is the significance of
the PR interval?
The PR interval is the
electrocardiographic
representation of the delay
in electrical activation of
the ventricles after sino-
atrial nodal discharge.
This interval is mainly a
result of slow conduction
through the atrio-
ventricular node.
Dr. Bibek/CVASU 101
QRS wave
Dr. Bibek/CVASU 102
The QRS complex is the electrocardiographic expression of the
electrical activation of the ventricular myocardium.
Dr. Bibek/CVASU 103
Width: maximum, 0.05 sec (2 ½ boxes wide)
in small breeds. maximum, 0.06 sec (3 boxes)
in large breeds.
Height of R wave*: maximum, 3.0mV
(30 boxes) in large breeds.
maximum, 2.5 mV (25 boxes) in
small breeds.
P-R interval
Width: 0.06 to 0.13 sec (3 to 6 ½ boxes).
QRS
complex
Dr. Bibek/CVASU 104
Wide QRS Complexes
Etiologies:
Aberrant
conduction
(Bundle Branch
Block)
Myocardial
hypoxemia/ischemia
Left ventricular
enlargement
Dr. Bibek/CVASU 105
Low amplitude QRS complexes
Etiologies: Pleural effusion ,Pericardial effusion, Obesity
,Hypothyroidism, Pneumothorax and Diffuse myocardial disease.
Dr. Bibek/CVASU 106
Left Ventricular Enlargement
R wave amplitude in L II increased.
QRS duration in L II increased.
Dr. Bibek/CVASU 107
Lt Ventricular Enlargement (Increased R
Amp)
Dr. Bibek/CVASU 108
Rt. Ventricular enlargement
Presence of an S wave in leads I, II, III.
MEA in the frontal plane shifted to the
right (pointing to the right ventricle): 100°
to – 75°
Deep S wave in lead V3; S = 0.7 mv
Deep Q waves in leads I,II and III and after
aVF greater than 9.5 mV (5 boxes)
Dr. Bibek/CVASU 109
Rt. Ventricular enlargement
Dr. Bibek/CVASU 110
T
wave
Dr. Bibek/CVASU 111
T wave
❖ Can be positive, negative or diphasic
❖Not greater than one fourth amplitude
of R wave; amplitude range + 0.05 – 1.0
mV (1/2 to 10 boxes) in any lead.
Dr. Bibek/CVASU 112
T wave abnormalities
Should not be greater than 1/4 of the R wave.
Sharply pointed (or) Notched – Electrolyte imbalances
Electolyte abnormality
Dr. Bibek/CVASU 113
Peaked T wave
Dr. Bibek/CVASU 114
Q-T interval duration
Dog : 0.15 to 0.25 sec (7 ½ to 12
½ boxes)
Cat: 0.12 to 0.18 sec
Faster the heart rate, shorter the Q-T
interval
Q-T interval should be less than
half the preceding R-R
interval
Dr. Bibek/CVASU 115
Prolongation of Q-T interval
⚫ Myocardial problems,
⚫ Toxicity or Hypoxia
⚫ Hypokalemia
⚫ Hyperkalemia
⚫ Hypocalcemia
⚫ Antiarrhythmic drugs
Shortening of QT interval
⚫ Hypercalcemia
Dr. Bibek/CVASU 116
ST segment abnormalities
ST segment depression - 0.2 mV ;seen in
Myocardial ischemia
Myocardial infarction
Hyper and Hypokalemia
Trauma to the heart.
ST segment elevation - 0.15 mV in Lead I ; seen in
Pericarditis,
Severe ischaemia/infarction (e.g. full wall
thickness).
Dr. Bibek/CVASU 117
Dr. Bibek/CVASU 118
Dr. Bibek/CVASU 119
Dr. Bibek/CVASU 120
Sinus Arrhythmia and Wandering
Atrial Pacemaker in the Dog
Sinus arrhythmia - Irregular ventricular rhythm which is of
sino-atrial origin. On the EKG, the QRS to QRS interval varies
and there is a P wave for every QRS complex.
Dr. Bibek/CVASU 121
Sinus Arrhythmia
Dr. Bibek/CVASU 122
Wandering Atrial Pacemaker in the
Dog
Dr. Bibek/CVASU 123
Sinus rhythm:
A sequence of beats originating from the sino
atrial node forms a rhythm, known as the
sinus rhythm.
There are four common sinus rhythms.
Dr. Bibek/CVASU 124
Dr. Bibek/CVASU 125
Sinus Bradycardia in the Dog
1.
Hypothyroidis
m ,
3. Hyperkalemia,
2. Hypothermia,
4.
Hypoglyce
mia
5. Enhanced parasympathetic tone as with:
Increased inspiratory effort, Gastric
irritation, Increased CSF pressure.
Atropine will abolish the bradycardia (atropine - 0.04 mg/kg
IV)
Dr. Bibek/CVASU 126
Sinus bradycardia
In Sinus bradycardia, the SA Node
generates an impulse and depolarization
occurs more slowly than normal. This can
be a normal feature in some giant breed
dogs and in athletically fit animals. The ECG
shows a normal sinus rhythm but at a
slower rate than normal.
Dr. Bibek/CVASU 127
Sinus
bradycardia
Dr. Bibek/CVASU 128
Dr. Bibek/CVASU 129
Sinus tachycardia
In Sinus tachycardia, the SA Node
generates an impulse and depolarization
occurs faster than normal. The ECG
shows a normal sinus rhythm but at a
faster rate than normal.
Dr. Bibek/CVASU 130
Sinus tachycardia
• It is a sinus rhythm with an increased ventricular rate.
Dog (<20 kg) with heart rate 180 bpm
Dog (20 kg) with heart rate 160 bpm
Puppies with heart rate 220 bpm
Cat with heart rate 240 bpm
• Etiology: Pain,Fever, Anemia, Reduced cardiac output,
Hyperthyroidism & Excitement.
Dr. Bibek/CVASU 131
Dr. Bibek/CVASU 132
Dr. Bibek/CVASU 133
Dr. Bibek/CVASU 134
Atrial fibrillation
Irregular rhythm and absence of P
waves
Dr. Bibek/CVASU 135
Absence of P Wave (Atrial Fibrillation)
Dr. Bibek/CVASU 136
Dr. Bibek/CVASU 137
Dr. Bibek/CVASU 138
Dr. Bibek/CVASU 139
Dr. Bibek/CVASU 140
Dr. Bibek/CVASU 141
Dr. Bibek/CVASU 142
Ventricular premature contractions
(VPC)
Premature beats. QRS complexes are wide & bizarre.
Common finding in dogs and cats and arise from an ectopic
focus or foci within the ventricular myocardium.
Dr. Bibek/CVASU 143
Dr. Bibek/CVASU 144
Dr. Bibek/CVASU 145
Dr. Bibek/CVASU 146
Ventricular Tachycardia (VT)
Refers to runs of greater than 3 PVC's in
sequence. Markedly reduce cardiac output
(dysynergy of contraction).
Etiology is as for PVC.
Dr. Bibek/CVASU 147
Dr. Bibek/CVASU 148
Dr. Bibek/CVASU 149
Other abnormalities
Right bundle branch block
Wide S waves
QRS complex greater than 0.08 sec.
Left bundle branch block
QRS complex greater than 0.08 sec
duration
QRS complex wide and +ve.
Dr. Bibek/CVASU 151
Dr. Bibek/CVASU 152
Artifacts
Muscle tremor artifact.
Movement artifact.
Electrical interference.
Electrical alternans
Alternation in the size of the QRS
amplitude that occurs nearly every other
beat.
Dr. Bibek/CVASU 153
Artifact
Dr. Bibek/CVASU 154
Dr. Bibek/CVASU 155
Dr. Bibek/CVASU 156
Dr. Bibek/CVASU 157
Dr. Bibek/CVASU 158
Dr. Bibek/CVASU 159
Dr. Bibek/CVASU 160
What differentiates a segment from an interval?
A segment is a straight line connecting two waves.
An interval encompasses at least one wave plus the
connecting straight line.
161
Dr. Bibek/CVASU
J WAVE AND U WAVE (Abnormal waves) ?
J wave= hypothermic wave (Junction between QRS complex and ST segment)
U wave=hypokalemia/hypercalcemia and thyrotoxicosis (Follows the T wave)
162
Dr. Bibek/CVASU
Dr. Bibek/CVASU 163
⚫U wave
◦ Small waveform
◦ Follows T wave
◦ Less than 1.5 mm in
amplitude
Dr. Bibek/CVASU 164
Thank U

ECG (Veterinary).pptx

  • 1.
    Principles of ECG Prof.Dr. Bibek Chandra Sutradhar An ECG complex consists of a PQRST complex. The Sinoatrial node (SA) is the pacemaker of the heart and produces the P wave. The QRS wave is produced by the Atrioventricular node (AV). The P wave in an ECG complex indicates atrial depolarization.
  • 2.
    History of ECG Dutchphysiologist Willem Einthoven in the early 20th century EINTHOVEN recording his first ECG in 1902 by placing limbs in buckets of conducting solution! The bipolar triaxial lead system we use today was developed by Willem Einthoven 2 Dr. Bibek/CVASU
  • 3.
  • 4.
    • Electrocardiogram = EKG= ECG • A recording of the electrical activity of the heart from electrodes placed on the surface of skin. • Specific waveforms represent stages of myocardial depolarization and repolarization. What is ECG??? 4 Dr. Bibek/CVASU
  • 5.
    Electrocardiograph • Electrocardiograph (ECGmachine) is a voltmeter or galvanometer that records the changing electrical activity of the heart between a positive and negative electrode. • Electrocardiography is the process of recording this electrical changes. 5 Dr. Bibek/CVASU
  • 6.
  • 7.
    Indications The electrocardiogram (ECG)is a valuable diagnostic test in veterinary medicine and is easy to acquire. It is the most important test to perform in animals with an auscultable arrhythmia (other than sinus arrhythmia in dogs). The ECG may also yield useful information regarding chamber dilation and hypertrophy. However, the ECG does not record cardiac mechanical activity, so it does not yield information regarding cardiac contractility. It’s also important to remember that the ECG may be normal even in the face of advanced cardiovascular disease. 7 Dr. Bibek/CVASU
  • 8.
    1. Cardiac arrhythmias. 2.Acute onset of dyspnoea 3. Shock. 4. Fainting or seizures. 5. Cardiac monitoring during and after surgery. 6. Cardiac murmurs. 7. Cardiomegaly found on thoracic radiographs. Indications 8 Dr. Bibek/CVASU
  • 9.
    8. Cyanosis. 8. Preoperatively in older animals. 10. Evaluating the effect of cardiac drugs – especially quinidine and propanolol. 11. Electrolyte disturbances, especially potassium abnormalities. 11. Systemic diseases that affect the heart. 11. Serial electrocardiograms as an aid in the prognosis and diagnosis of cardiac disease. Indications 9 Dr. Bibek/CVASU
  • 10.
  • 11.
  • 12.
  • 13.
  • 14.
    The 1st Ruleof ECG • A current of depolarization traveling towards the + electrode is recorded as a positive deflection • A current of depolarization traveling away from the + electrode is seen as a negative deflection • A current of repolarization traveling away from the + electrode is seen as a positive deflection Fig: As the positive wave of depolarization within the myocytes flows toward a positive electrode, there is a positive (upward) deflection recorded on EKG Positive deflection Negative deflection Biphasic deflection Isoelectric line 14 Dr. Bibek/CVASU
  • 15.
    The 2nd Ruleof ECG Fibrotic tissue is electrically inert 15 Dr. Bibek/CVASU
  • 16.
    The 3rd Ruleof ECG 16 Dr. Bibek/CVASU
  • 17.
    What does theP wave represent 17 Dr. Bibek/CVASU
  • 18.
  • 19.
    What does theQRS wave represent 19 Dr. Bibek/CVASU
  • 20.
  • 21.
  • 22.
  • 23.
    Dr. Bibek/CVASU 23 ⚫S wave ◦ Negative waveform following the R wave ⚫ Normal duration of QRS ◦ 0.06 mm – 0.10 mm ⚫ Not all QRS Complexes have a Q, R and S
  • 24.
    Positive and NegativeDeflection in a lead A wave of electrical depolarization moves towards the positive pole of the lead – a +ve deflection occurs 24 Dr. Bibek/CVASU
  • 25.
    Limitations ECG must alwaysbe evaluated in conjunction with clinical findings öAn animal with CHF may have a normal ECG and normal animal may show non specific electrocardiographic abnormalities 25 Dr. Bibek/CVASU
  • 26.
  • 27.
    o Single channelrecorder -Has one stylus – records one lead at a time o Multiple channel recorder -Has more than one stylus provide simultaneous tracings of 3 leads 27 Dr. Bibek/CVASU
  • 28.
  • 29.
  • 30.
    Position & Restraint oLateral recumbency - the standard position for canine and feline electrocardiography o No chemical restraint o Trained attendant or animal owner o Lead placement 30 Dr. Bibek/CVASU
  • 31.
    Preparing for theECG • Place the patient on a padded surface; don’t let the patient or the clips touch metal. • Place the patient in right-lateral recumbency when possible. Note: This is the only position valid to determine the ECG axis. Other acceptable positions include standing or sternal, however, we need the position included in the history if not in right-lateral recumbency. Try these techniques to minimize panting, shaking or purring: • For animals that are shaking try placing your hands on either side of the chest and apply moderate pressure. • To reduce panting, hold the patient’s mouth closed. Be careful not to obstruct breathing. • To stop purring, wave an alcohol-soaked cotton ball under the patient’s nose. How to Prepare a Patient for an ECG 31 Dr. Bibek/CVASU
  • 32.
    • Make surethat the patient’s limbs do not touch each other. • Make sure cables and electrodes do not touch each other or anything metal. • Soak the area to be clipped with alcohol. • Part the fur for good skin contact and attach clips 1"–2" below elbows and knees. Clip back dense fur. • Do not place clips on calluses or joints. 32 Dr. Bibek/CVASU
  • 33.
    How to geta chest lead •A chest lead may be helpful if the P wave is not clear or if the complexes are small. • Follow the general instructions for using clips, but clip the black cable to the left side of the chest, between fourth and fifth ribs, wherever you feel the strongest heartbeat. • Place the other clips on the limbs, as previously described. 33 Dr. Bibek/CVASU
  • 34.
    Firmly insert thelead tip of the patient cable to the electrode, matching the tip color and electrode site. Refer to the table below. PATIENT CABLE TIP COLOR COATING 34 Dr. Bibek/CVASU
  • 35.
    Problem solving withcats Unlike humans and most dogs, the cardiac axis is not aligned top right to bottom left in cats. The heart has a tendency to lie more centrally with its apex more ventral than the atria, i.e., the heart points downward towards the ground when the animal stands. This gives rise to one of the common problems with monitoring cats, finding the strongest signal to present to the RA and LL electrodes. The best signal is derived top/bottom axis i.e. Lead II in humans, with RA looking at the top of the heart and LL at the bottom. In cats, as stated, the axis may not lie across the body. (see figure 1) 35 Dr. Bibek/CVASU
  • 36.
  • 37.
    As lead IImay not align with the cat’s axis, the signal is small and sometimes cancels. Therefore, by moving RA more centrally onto the cat’s body above the top, and LL onto the cat’s body below the bottom of the heart, a much larger signal will be obtained. The plane in which the cat’s heart lies within its body may also vary. The “top” of the heart may be more dorsal and the “bottom” more ventral. In this case, we would refer to the base/apex axis (see figure 2) when the following instructions should be followed. 1. Move LL to the left apex of the heart. 2. Move RA to the V10 position (over the dorsal spinous process of the seventh thoracic vertebra) and LL to the V4 position (sixth left intercostal space at the costochondrail junction). It will be necessary to annotate the printouts, if any, with actual configurations used to avoid later confusion. 37 Dr. Bibek/CVASU
  • 38.
  • 39.
    lead II, abipolar lead in which the right arm (RA—the right foreleg in veterinary patients) is negative and the left leg (LL— or left hind leg), is positive (Figure 1) Fig: The three bipolar frontal plane leads (I, II and III) and Einthoven’s triangle (red). In lead I, the right foreleg (RA) is negative and the left foreleg (LA) is positive. In lead II the right foreleg (RA) is negative and the left hind leg (LL) is positive. In lead III the left foreleg (LA) is negative and the left hindleg (LL) is positive. The net depolarization moving through the ventricles (green arrow) is normally oriented toward the left hind leg (the positive pole of lead II) in dogs and cats, and therefore the QRS complex is predominantly positive in lead II. With ECG machines that utilize four electrodes, the electrode placed on the right hind leg is the ground (it is not part of any of the leads). 39 Dr. Bibek/CVASU
  • 40.
    Gold standard ECGpositioning in a dog 40 Dr. Bibek/CVASU
  • 41.
    For cats itis thought that body positioning may be less important, and patient compliance to be improved with a more relaxed position (Willis, 2010). If a patient is dyspnoeic, an ECG should be taken in sternal recumbency and done with minimal stress. Standard electrode configuration on ECG machines consists of four cables and electrodes, which includes one earth electrode. Gold standard ECG positioning in a cat 41 Dr. Bibek/CVASU
  • 42.
  • 43.
  • 44.
    ELECTRODES Alligator clips orflat contact electrodes Hair and stern surrounding the electrode should be moistened with conductive gel or alcohol Standard paper speed : 50 mm/sec. Left Arm (LA), Right Arm (RA) and Left Leg (LL) 44 Dr. Bibek/CVASU
  • 45.
    Dr. Bibek/CVASU 45 Standardleads Useful for studying 1. Abnormalities in the P-QRS-T deflection 2. Diagnosing cardiac arrhythmias 3. Determining the mean electrical axis
  • 46.
    LEAD SYSTEM BIPOLAR STANDARDLEADS Lead I : Right arm (-) compared with Left (+) arm Lead II : Right arm (-) compared with Left (+) leg Lead III : Left arm (-) compared with Left (+) leg AUGMENTED UNIPOLAR LIMB LEADS aVR :Augmented Vector Right aVL : Augmented Vector Left aVF : Augmented Vector Front SPECIAL LEADS Lead CV5 RL (V2) Lead CV6 LL (V2) Lead CV6 LU (V4) Lead V10 They are derived from the same three electrodes as leads I, II, and III, but they use Goldberger's central terminal as their negative pole. 46 Dr. Bibek/CVASU
  • 47.
    L I, II,III, aVR, aVL, & aVF - Frontal plane leads. L V1, V2, V3, V4, V5, V6, & V10 – Horizontal (or transverse) plane leads. 47 Dr. Bibek/CVASU
  • 48.
    Normal ECG P QR S T :Atrial depolarisation : Ventricular depolarisation : Ventricular repolarisation 48 Dr. Bibek/CVASU
  • 49.
    QRS Complex Twave 49 Dr. Bibek/CVASU
  • 50.
    Normal ECG Parameters- Dog & Cat Heart Rate (beats per minute) : Canine : »Adults: 70-160 »Toy Breeds: up to 180 »Puppies: up to 220 Feline : »160-240 50 Dr. Bibek/CVASU
  • 51.
    Amplitudes (mV) inlead II P amp Canine < 0.4 Feline < 0.2 R < 20 kg: < 2.5 > 20 kg: < 3.0 < 0.9 51 Dr. Bibek/CVASU
  • 52.
    Intervals (seconds) Canine Feline P< 0.04 < 0.04 PR 0.06 -0.13 0.05 - 0.09 QRS < 20 kg: < 0.05 < 0.04 > 20 kg: < 0.06 QT 0.15 to 0.25 0.12 to 0.18 52 Dr. Bibek/CVASU
  • 53.
    Normal ECG Parameters- Dog & Cat Rhythm : rhythm controlled by sinus node at a rate of 60-100 beats/min; each P wave followed by QRS and each QRS preceded by a P wave. Canine : Normal sinus rhythm Sinus arrhythmia Wandering atrial pacemaker Feline : Normal sinus rhythm Sinus tachycardia 53 Dr. Bibek/CVASU
  • 54.
    Specific Arrhythmias • Sinusbradycardia • Sinus tachycardia • Sick sinus syndrome- disturbance of SA nodal function that results in a markedly variable rhythm (cycles of bradycardia and tachycardia). • Atrial flutter - sinus rate of 250-350 beats/min • AV nodal blocks - a conduction block within the AV node (or occasionally in the bundle of His) that impairs impulse conduction from the atria to the ventricles. • Ventricular flutter - very rapid ventricular depolarizations >250/min • Ventricular fibrillation - uncoordinated ventricular depolarizations; leads to death if not quickly corrected 54 Dr. Bibek/CVASU
  • 55.
  • 56.
  • 57.
  • 58.
  • 59.
    59 Figure 3. Goldstandard ECG positioning for a cat. Always try to minimise stress when recording an ECG in a cat. Four electrodes including one earth.
  • 60.
    60 The six leadECG system. As seen in this diagram, each lead provides a unique perspective on the heart. Gold standard ECG positioning in a dog.
  • 61.
    61 Electrode Colour for British machines Colourfor American machines Right forelimb Red White Left forelimb Yellow Black Left hindlimb Green Red Right hindlimb Black Green Electrode placement for UK and US ECG machines
  • 62.
    62 An example ofelectrical artefact. Note the unclear baseline making P wave identification impossible. ECG machine showing gain and speed.
  • 63.
    63 Heart rate calculationusing an ECG ruler. The ruler has one side for 25 mm/seconds, the other for 50 mm/second. The ruler should be lined up with lead II as shown, and the distance from the first R wave to the next R wave equals the heart rate. In this example, the heart rate is 160 beats/min. If the rate is variable on the ECG trace (if it slows down or speeds up), repeated measurements might need to be taken along lead II to give a more accurate answer.
  • 64.
    64 BIC pen methodfor 25 mm/second or 50 mm/second. Lie the BIC pen alongside lead II. Measure from the first R wave, count the number of R wave intervals, until the end of the pen. Depending on the paper speed, multiply by 10 if the paper speed is 25 mm/second or 20 if the paper speed is 50 mm/second. As with the ruler method, a number of measurements might be needed if the rate is variable.
  • 65.
    Dr. Bibek/CVASU 65 ECGinterpretation essentially involves four main steps: 1. Calculation of the heart rate; 2. Determination of the heart rhythm; 3. Measurement of the complex amplitudes and intervals; 4. MEASUREMENT OF THE MEAN ELECTRICAL AXIS: A good understanding of the electrical activity of the heart is key to the accurate interpretations of ECG (Martin, 2002).
  • 66.
  • 67.
  • 68.
  • 69.
  • 70.
  • 71.
  • 72.
  • 73.
    Dr. Bibek/CVASU 73 Howto measure heart rate ???
  • 74.
    Dr. Bibek/CVASU 74 1.Calculation of the average heart rate • Each large box = 5 × 5 small boxes • At a paper speed of 25 mm/sec:□ 5 large boxes (a 25- mm length of paper) pass in 1 second • In 1 minute, 5 × 60 boxes (300) pass. Therefore each large box = 0.2 second • 25 small boxes pass in 1 second • In 1 minute, 25 × 60 boxes (1500) pass. Therefore each small box = 0.04 second Use either of the following methods to calculate heart rate. (Either method can be used in any species, as long as the heart rhythm is regular; this method is not reliable if bradycardia with pauses is present.)
  • 75.
    Dr. Bibek/CVASU 75 First,start at a complex on a heavy line (see arrows in figures following), then go to the next complex. ▪ Count number of large boxes (5 × 5 small boxes) between consecutive R waves of complexes -Divide 300 by this number ▪ Count the number of small boxes between consecutive R waves of complexes -Divide 1500 by this number Note: At a paper speed of 50 mm/sec use the same method but substitute 600 for 300 and 3000 for 1500.
  • 76.
    Dr. Bibek/CVASU 76 Dog Thisdog’s heart rate can be calculated as 300 ÷ 2.4 = 125. An alternative method is 1500 ÷ 12 = 125.
  • 77.
    Dr. Bibek/CVASU 77 Cat Thiscat’s heart rate can be calculated as 1500 ÷ 9.5 = 158. An alternative method is 300 ÷ 1.9 = 158.
  • 78.
  • 79.
  • 80.
  • 81.
    Dr. Bibek/CVASU 81 Seethe Rhythm …Regular or irregular???
  • 82.
    Dr. Bibek/CVASU 82 Rhythm 1.Regular irregular 2. Irregular irregular
  • 83.
    Dr. Bibek/CVASU 83 Howto decide MEA???
  • 84.
    Dr. Bibek/CVASU 84 •The Vector Method: Using leads I, II or III and the frontal plane diagram, calculate the algebraic sum of the QRS deflections in any two leads. • The Isoelectric Method. • The Largest Net Deflection Method. There are three common methods of calculating the MEA in the frontal plane
  • 85.
  • 86.
  • 87.
  • 88.
  • 89.
  • 90.
  • 91.
  • 92.
  • 93.
  • 94.
  • 95.
  • 96.
    What differentiates asegment from an interval? A segment is a straight line connecting two waves. An interval encompasses at least one wave plus the connecting straight line. 96 Dr. Bibek/CVASU
  • 97.
    Dr. Bibek/CVASU 97 PQRSTWave System P wave Width: maximum, 0.04 sec (2 boxes wide)maximum, 0.05 sec (2 ½ boxes wide) in giant breeds. Height: maximum, 0.4 mV (4 boxes tall). The P wave is the electrocardiographic representation of electrical activation of the atrial myocardium.
  • 98.
    Dr. Bibek/CVASU 98 Rightatrial enlargement - P too high in L II. Dog: P > 0.4 mv ; Cat: P > 0.2 mv Biatrial enlargement - P too tall and wide in L II. Left atrial enlargement - P too wide in L II. Dog & Cat : P > 0.04 sec
  • 99.
    Dr. Bibek/CVASU 99 RtAtrial enlargement (P Amp )
  • 100.
    Dr. Bibek/CVASU 100 Whatis the PR interval? What is the significance of the PR interval? The PR interval is the electrocardiographic representation of the delay in electrical activation of the ventricles after sino- atrial nodal discharge. This interval is mainly a result of slow conduction through the atrio- ventricular node.
  • 101.
  • 102.
    Dr. Bibek/CVASU 102 TheQRS complex is the electrocardiographic expression of the electrical activation of the ventricular myocardium.
  • 103.
    Dr. Bibek/CVASU 103 Width:maximum, 0.05 sec (2 ½ boxes wide) in small breeds. maximum, 0.06 sec (3 boxes) in large breeds. Height of R wave*: maximum, 3.0mV (30 boxes) in large breeds. maximum, 2.5 mV (25 boxes) in small breeds. P-R interval Width: 0.06 to 0.13 sec (3 to 6 ½ boxes). QRS complex
  • 104.
    Dr. Bibek/CVASU 104 WideQRS Complexes Etiologies: Aberrant conduction (Bundle Branch Block) Myocardial hypoxemia/ischemia Left ventricular enlargement
  • 105.
    Dr. Bibek/CVASU 105 Lowamplitude QRS complexes Etiologies: Pleural effusion ,Pericardial effusion, Obesity ,Hypothyroidism, Pneumothorax and Diffuse myocardial disease.
  • 106.
    Dr. Bibek/CVASU 106 LeftVentricular Enlargement R wave amplitude in L II increased. QRS duration in L II increased.
  • 107.
    Dr. Bibek/CVASU 107 LtVentricular Enlargement (Increased R Amp)
  • 108.
    Dr. Bibek/CVASU 108 Rt.Ventricular enlargement Presence of an S wave in leads I, II, III. MEA in the frontal plane shifted to the right (pointing to the right ventricle): 100° to – 75° Deep S wave in lead V3; S = 0.7 mv Deep Q waves in leads I,II and III and after aVF greater than 9.5 mV (5 boxes)
  • 109.
    Dr. Bibek/CVASU 109 Rt.Ventricular enlargement
  • 110.
  • 111.
    Dr. Bibek/CVASU 111 Twave ❖ Can be positive, negative or diphasic ❖Not greater than one fourth amplitude of R wave; amplitude range + 0.05 – 1.0 mV (1/2 to 10 boxes) in any lead.
  • 112.
    Dr. Bibek/CVASU 112 Twave abnormalities Should not be greater than 1/4 of the R wave. Sharply pointed (or) Notched – Electrolyte imbalances Electolyte abnormality
  • 113.
  • 114.
    Dr. Bibek/CVASU 114 Q-Tinterval duration Dog : 0.15 to 0.25 sec (7 ½ to 12 ½ boxes) Cat: 0.12 to 0.18 sec Faster the heart rate, shorter the Q-T interval Q-T interval should be less than half the preceding R-R interval
  • 115.
    Dr. Bibek/CVASU 115 Prolongationof Q-T interval ⚫ Myocardial problems, ⚫ Toxicity or Hypoxia ⚫ Hypokalemia ⚫ Hyperkalemia ⚫ Hypocalcemia ⚫ Antiarrhythmic drugs Shortening of QT interval ⚫ Hypercalcemia
  • 116.
    Dr. Bibek/CVASU 116 STsegment abnormalities ST segment depression - 0.2 mV ;seen in Myocardial ischemia Myocardial infarction Hyper and Hypokalemia Trauma to the heart. ST segment elevation - 0.15 mV in Lead I ; seen in Pericarditis, Severe ischaemia/infarction (e.g. full wall thickness).
  • 117.
  • 118.
  • 119.
  • 120.
    Dr. Bibek/CVASU 120 SinusArrhythmia and Wandering Atrial Pacemaker in the Dog Sinus arrhythmia - Irregular ventricular rhythm which is of sino-atrial origin. On the EKG, the QRS to QRS interval varies and there is a P wave for every QRS complex.
  • 121.
  • 122.
    Dr. Bibek/CVASU 122 WanderingAtrial Pacemaker in the Dog
  • 123.
    Dr. Bibek/CVASU 123 Sinusrhythm: A sequence of beats originating from the sino atrial node forms a rhythm, known as the sinus rhythm. There are four common sinus rhythms.
  • 124.
  • 125.
    Dr. Bibek/CVASU 125 SinusBradycardia in the Dog 1. Hypothyroidis m , 3. Hyperkalemia, 2. Hypothermia, 4. Hypoglyce mia 5. Enhanced parasympathetic tone as with: Increased inspiratory effort, Gastric irritation, Increased CSF pressure. Atropine will abolish the bradycardia (atropine - 0.04 mg/kg IV)
  • 126.
    Dr. Bibek/CVASU 126 Sinusbradycardia In Sinus bradycardia, the SA Node generates an impulse and depolarization occurs more slowly than normal. This can be a normal feature in some giant breed dogs and in athletically fit animals. The ECG shows a normal sinus rhythm but at a slower rate than normal.
  • 127.
  • 128.
  • 129.
    Dr. Bibek/CVASU 129 Sinustachycardia In Sinus tachycardia, the SA Node generates an impulse and depolarization occurs faster than normal. The ECG shows a normal sinus rhythm but at a faster rate than normal.
  • 130.
    Dr. Bibek/CVASU 130 Sinustachycardia • It is a sinus rhythm with an increased ventricular rate. Dog (<20 kg) with heart rate 180 bpm Dog (20 kg) with heart rate 160 bpm Puppies with heart rate 220 bpm Cat with heart rate 240 bpm • Etiology: Pain,Fever, Anemia, Reduced cardiac output, Hyperthyroidism & Excitement.
  • 131.
  • 132.
  • 133.
  • 134.
    Dr. Bibek/CVASU 134 Atrialfibrillation Irregular rhythm and absence of P waves
  • 135.
    Dr. Bibek/CVASU 135 Absenceof P Wave (Atrial Fibrillation)
  • 136.
  • 137.
  • 138.
  • 139.
  • 140.
  • 141.
  • 142.
    Dr. Bibek/CVASU 142 Ventricularpremature contractions (VPC) Premature beats. QRS complexes are wide & bizarre. Common finding in dogs and cats and arise from an ectopic focus or foci within the ventricular myocardium.
  • 143.
  • 144.
  • 145.
  • 146.
    Dr. Bibek/CVASU 146 VentricularTachycardia (VT) Refers to runs of greater than 3 PVC's in sequence. Markedly reduce cardiac output (dysynergy of contraction). Etiology is as for PVC.
  • 147.
  • 148.
  • 149.
    Dr. Bibek/CVASU 149 Otherabnormalities Right bundle branch block Wide S waves QRS complex greater than 0.08 sec. Left bundle branch block QRS complex greater than 0.08 sec duration QRS complex wide and +ve.
  • 151.
  • 152.
    Dr. Bibek/CVASU 152 Artifacts Muscletremor artifact. Movement artifact. Electrical interference. Electrical alternans Alternation in the size of the QRS amplitude that occurs nearly every other beat.
  • 153.
  • 154.
  • 155.
  • 156.
  • 157.
  • 158.
  • 159.
  • 160.
  • 161.
    What differentiates asegment from an interval? A segment is a straight line connecting two waves. An interval encompasses at least one wave plus the connecting straight line. 161 Dr. Bibek/CVASU
  • 162.
    J WAVE ANDU WAVE (Abnormal waves) ? J wave= hypothermic wave (Junction between QRS complex and ST segment) U wave=hypokalemia/hypercalcemia and thyrotoxicosis (Follows the T wave) 162 Dr. Bibek/CVASU
  • 163.
    Dr. Bibek/CVASU 163 ⚫Uwave ◦ Small waveform ◦ Follows T wave ◦ Less than 1.5 mm in amplitude
  • 164.