
Recommended
More Related Content
Similar to High risk Floods prone area ManagementIndia By B.pptx
Similar to High risk Floods prone area ManagementIndia By B.pptx (20)
More from B. BHASKAR
More from B. BHASKAR (20)
Recently uploaded
Recently uploaded (20)
High risk Floods prone area ManagementIndia By B.pptx
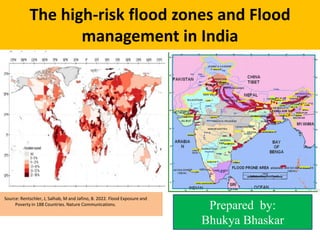
- 1. The high-risk flood zones and Flood management in India Source: Rentschler, J, Salhab, M and Jafino, B. 2022. Flood Exposure and Poverty in 188 Countries. Nature Communications. Prepared by: Bhukya Bhaskar
- 2. INTRODUCTION • 1.81 billion people, or 23% of the world population, are directly exposed to flood depths greater than 0.15 meters in a 1-in-100-year flood event, thus posing significant risk to lives and livelihoods. Of these, 89% live in low- and middle-income countries. • Moreover, 780 million flood-exposed people live on less than $5.50 a day, and 170 million flood-exposed people live in extreme poverty (on less than $1.90 a day). In short, 4 in every 10 people exposed to flood risk globally live in poverty. • It also estimates that 170 million extremely poor people are facing flood risk and its devastating long- term consequences. • India is the most flood affected nation in the world after banladesh. • As per constitutional provisions, the subject of flood management including erosion control falls within the purview of the States. • Union Government only renders assistance to States which is technical, advisory, catalytic and promotional in nature, drainage and embankments are two of the measures specifically mentioned in Entry 17 of List II (State List). • “Water, that is to say, water supplies, irrigation and canals, drainage and embankments, water storage and water power subject to the provision of entry 56 of List I (Union List).” • “Regulation and development of inter-State rivers and river valleys to the extent to which such regulation and development under the control of the Union is declared by Parliament by law to be expedient in the public interest. • Entry 17 of List II (State List) quoted above does not cover land use involved in the administrative measures of dealing with reduction of flood losses viz. flood plain zoning • India account s 1/5th of global deaths due to floods ,on an average 30m people are evacuated every year. • Country receives an annually precipitation of 400m –hactares meters-75%rainfall receive during June – SEPT. • Flood vulnerable area is40mhac and average effected by floods annually is 8mhac. • National Disaster Management Authority (NDMA) has brought out detailed guidelines for management of urban floods to boost the efforts for urban flood disaster management and strengthen the national vision of moving towards a more proactive predisaster preparedness and mitigation centric approach.
- 3. Flood risk is global, but the most flood-exposed people live in South and East Asia. • Flood risks are a near universal threat, affecting people in all 188 countries covered in this study. • At 668 million people, East Asia has the highest number of flood-exposed people, corresponding to about 28% of its total population. • Across Sub-Saharan Africa, Europe, Central Asia, the Middle East, North Africa, Latin America, and the Caribbean flood exposure ranges between 9% to 20% of the population. • of the 2,084 subnational regions we analyzed, only 9 have less than 1% of their population exposed to flood risks. • Almost 70% (1.24 billion) of flood-exposed people live in South and East Asia, with China and India alone accounting for over one-third of global exposure. • And in several South and East Asian subnational areas, more than two-thirds of the population are exposed to significant flood risk.
- 4. Flood prone states and Area’s • The Ganga-Yamuna basin states of Haryana, Himachal Pradesh, Uttar Pradesh, Bihar, West Bengal are prone to floods. Also, Assam gets affected due to floods in Brahmaputra river. • The delta parts of river basins of Mahanadi (in Odisha), Godavari, Krishna, Pennar (In Andhra Pradesh), Narmada, Sabarmati and Tapti basin areas in Gujarat are identified as prone to floods. • of late, the upper reaches of river basins of Krishna, Godavari caused severe floods in the states of Karnataka and Maharashtra. Even states like Kerala received significant rainfall in 2018 causing widespread floods and damage to life and property in almost entire state. • The peninsular India faces flood situation during the retreating NE monsoon cyclones during October-November.
- 6. • India receives major rainfall in four months spanning from June to September. • Distribution of rain across India is dissimilar as some areas receive heavy rainfall while some are at deficit. • Urban flood has become one of the major problems now a days, the recent floods in Kerala, Uttarakhand and in metropolitan cities like Delhi, Mumbai, Kolkata point towards the need for proper management of floods and the drainage system. • Average yearly damage due to floods is RS9720millions,effecting 32.03million population. • On an average 1500human lives are lost and 1lakh livestock annually.
- 7. • The Rashtriya Barh Ayog (RBA) estimated the total area liable to floods in the country as 40 Million Hectare (Mha). • The extent of maximum area affected by floods in any year during 1953- 2010 as per the Report of Working Group on Flood Management and Region-Specific Issues for XII Plan is 49.815 Mha1 . • Out of it, nearly 21 Mha can be provided with reasonable degree of protection. • Based on the statistical details available so far, it has been estimated that annually 7.17 mha. of area is affected with floods of which 3.94 mha. is cropped area. • On an average, floods claim 1654 human and 618248 cattle life annually. Around 1.2 million houses are damaged by floods and the average annual losses in monetary terms came to the tune of Rs 5649 crores.
- 9. Causes of flood • Flood condition may occur due to –conc of runoff from the tributaries and rivers carrying flows in excess of their capacities. • -snowmelt. storm surges . Short intence storms causing flash floos. • Floods in rivers mainly by-inadequate capacity within the banks of the river to contain high flows. • River bank erosion silting of riverbeds ,intence rain fall when river is flowing full,landslides,synchronisation of flood peaks and tributary river. Flow retardation dueto tidal,backwater,poor natural drainage system,cyclone and heavy rain fallwhen EL Nino effectis on decline
- 10. VENICE FLOODS
- 12. Characteristics of floods • Floods may be measured and analysed by following criteria.-depth of water, duration , velocity(erosive and hydrodynamic force), rate of rise, frequency of occurrence, seasonality. •
- 14. Flood disaster management • It is majorly 4 groups • 1. attempts to modify the flood system , by taking physical measures such as;-consruction of embankment, construction of detention reservoirs,channel improvements etc. • 2. attempts to modify the susceptibility to flood damage. • 3.attempts to modify the loss burden. • 4. loss bearing ; means living with floods’ measures clssify as -structural (phycal),non structuralmeasures.
- 16. Flood mitigation • It can be categorized into 2such as • 1. structural (physical )measures;to prevent flood water from reaching potential damage centers.- • Damsand resevoirs • Embankments,floodwalls,sea walls • Natural detention basins • Drainage improvement • Channel improvement • Diversion of flood waters.
- 17. 2.Non structural measures • Aim to modify the susceptibility to flood damage as well as modify the loss burden. • Flood mapping • Flood proofing • Flood fighting • Flood forecasting and warning ;accuracy of such forecast has been assed between93.4to 97.5% • Monitor-forecaster-decider—foreca • Flood insurance monitor forecaster decider Forecasting warning t r t r trigger
- 18. Types of floods • Basically 3 types such as • 1. flash floods ; occurs within 6 months during heavy rainfall(associated with towering cumulus clouds)severe thunderstorms and tropical cyclones • 2.river floods : caused by precipitation over large catchment areas or by melting of snow or both • 3.coastal floods : as green house gases warm the earth ‘s atmosphere , sea temperature will rise, causing world ocean s to expand and occupy more space.
- 19. Major Flood Events in the India
- 20. Flood Management Programme • As per the report published by Asian Development Bank, floods account for more than half of climate-related disasters in India and cause damages of $54.63 billion during 1990–2017. • Furthermore, the worst flood of Kerala in 2018 led to the estimated losses of US$ 4.25 billion displacing over 8,00,000 people in the region. • Besides this, it has also been estimated that one percent increase in floods can reduce economic growth by 2.7%. • The Flood Management Programme (FMP) with an outlay of Rs. 8,000 crores were implemented by the Government of India in XI Five Year Plan to provide financial assistance to States/UTs in implementing flood management projects. • The Scheme was continued with outlay of Rs. 10,000 crores during XII Plan. • Another scheme “River Management Activities and Works related to Border Areas (RMBA)” was started in XI Plan with an outlay of Rs 820 Cr and was continued in XII Plan also with an outlay of Rs 740 Cr for taking up of different works in Border areas. • Both the schemes were merged as Flood Management and Border Areas Programme (FMBAP) and continued for the year 2017-20 with merged components.
- 21. • As per a study by CWC, in order to mitigate Brahmaputra flood at Pandu, Guwahati, from 22 lakh cusec to 14-15.5 lakh cusec (reduction in level by 1.25 to 1.6 m) aggregate flood storage of the order of 13.30 BCM would be required in various sub-basins. In order to mitigate Barak flood, flood storage is also essential in Barak basin. • During XI and XII Plan period with Central assistance under Flood Management Programme (FMP) of Ministry of Jal Shakti, State Governments have taken up several projects for construction of embankments. So far State Governments have built 37073 km length of embankments in the country which includes projects undertaken from their own resources till March, 2017. • NWDA has identified 30 inter-basin transfer links (16 under Peninsular component and 14 under Himalayan components).
- 22. Few Structural Methods for Flood Control
- 23. • Integrated flood approach aims at adopting well judicious mix of structural and nonstructural measures. 1) Flood Plain Zoning 2) Flood Forecasting: • Presently, there are around 1600 Hydrometeorological sites being operated by CWC across the country covering 20 river basins for gauge, discharge, sediment & water quality observations. Many of these stations are used as flood monitoring stations for formulating flood forecasts. • Presently, Flood forecasts are issued by CWC at 325 stations (128 Inflow Forecast Stations + 197 Level Forecast Stations) as per Standard Operating Procedure. Annually, about 7000 flood forecasts are issued by CWC during floods. • CWC had planned for installation of real-time data acquisition system for 968 stations in various river basins. There is a proposal to increase the coverage by another 125 stations under 14th Finance Commission period for which work is in progress. • by 2025 taking the total automatic sensorbased data acquisition and satellite- based data transmission to around 1193 stations. • , IMD is also planning to expand its Automatic Weather Station (AWS)/ Automatic Rain Gauge (ARG) Network which can also be utilised by mutual sharing for use in Mathematical models for flood forecast.
- 24. The two-tier system for flood management in India Central Government • Central Water Commission • Ganga Flood Control Commission (GFCC) • Brahmaputra Board (BB) • National Disaster Management Authority (NDMA) State Government • • Water Resources Departments • • State Technical Advisory Committees (STAC) • • Flood Control Boards, • • Irrigation Departments • • Public Works Departments • Flood Management Programme: The scheme was sanctioned by the Cabinet in November 2007 with Central Assistance of Rs 8,000 crore in XI FYP (2007- 2012). Further, a central assistance of 10,000 crore was approved in October 2013 for XII FYP (2012-2017) for undertaking works related to (i) river management, (ii) flood control, (iii) anti – erosion, (iv) drainage development, etc. During the XI and XII plans Rs 4,723.08 crores was released by MoWR, RD&GR upto March 2016.
- 25. Various Approaches to flood Management