Covid 19 Immigration Effects - May 2021 draft
•
0 likes•102 views

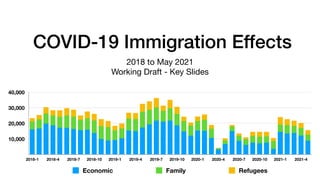
This document summarizes Canadian immigration statistics from 2018 to May 2021. It shows that immigration levels decreased significantly during the COVID-19 pandemic across most programs. Permanent resident admissions fell sharply from 2019 levels, especially in the economic and family categories. Temporary resident numbers also declined substantially for international mobility programs and temporary foreign worker programs. Overall, the pandemic led to large declines compared to previous years across permanent and temporary immigration programs in Canada.

Recommended
Recommended
More Related Content
What's hot
What's hot (12)
Similar to Covid 19 Immigration Effects - May 2021 draft
Similar to Covid 19 Immigration Effects - May 2021 draft (20)
More from Andrew Griffith
More from Andrew Griffith (8)
Recently uploaded
Recently uploaded (20)
Covid 19 Immigration Effects - May 2021 draft
- 1. COVID-19 Immigration Effects 2018 to May 2021 Working Draft - Key Slides 10,000 20,000 30,000 40,000 2018-1 2018-4 2018-7 2018-10 2019-1 2019-4 2019-7 2019-10 2020-1 2020-4 2020-7 2020-10 2021-1 2021-4 Economic Family Refugees
- 2. Programs Examined • Permanent Residents/Immigrants (PRs): Economic, Family and Refugees • TR to Permanent Resident transition • Asylum Claimants • Temporary Residents/International Mobility Program (IMP): International Agreements (e.g., NAFTA, GATS), Canadian Interests (e.g., intra-corporate transfers, work exchange programs, post-graduate employment, spouses) • Temporary Residents/Temporary Foreign Worker Program (TFWP): caregivers, agriculture workers, other workers with Labour Market Impact Assessment (LMIA) • Study Permits (international students) • Settlement Services • Citizenship • Visitor Visas 2
- 3. May 2021 Highlights • 2021 Permanent Resident numbers to date remain below 2019 levels, 109,615 Jan-May 2021 compared to 125,850. To meet 2021 target of 401,000, over 40,000 new PRs per month needed over the next 7 months. Given the various measures taken to date, a stretch but not impossible. • PRs: Admissions decreased from 21,105 in April to 17,085 in May. May Year-over-year change (change from 2019 in parentheses): Economic 34.8% (-48.6%), Family 60.4% (-62.4%), Refugees 103.9% (-42.9%) • Applications: Decrease from 26,048 in April to 22,194 in May. May year-over-year change (change from 2019): 25.6% (-55.7%) • Web “Immigrate to Canada”: Decrease from 440,452 in May (outside Canada) to 410,862 in June. June year-over-year change (change from 2019): -3.6% (3.8%) • Provincial Nominee Program: Decrease from 2,880 in April to 1,995 in May. May year-over-year change (change from 2019): -32.8% (-66.6%) • TR to PRs transition (i.e., those already in Canada): Decrease from 11,520 in April (some double counting) to 9,000 in May. May year-over-year change (change from 2019): 54.6% (-4.2%) • Temporary Residents: • TRs/IMP: From 19,815 in April to 20,975 in May. May year-over-year (two year change): Agreements 31.5% (-39.0%), Canadian Interests: 6.3% (-39.8%). Other IMP Participants (largely open work permits granted to Hong Kong residents who hold HSAR or BNO passports) 5,533.9% • TRs/TFWP: Decrease from 17,140 in April to 11,920 in May. May year-over-year increase (two year change): Caregivers 73.9% (-48.1%), Agriculture 14.2% (10.1%) and Other LMIA 45.4% (-14.3%). • Web “Get a work permit”: From 60,050 in May (outside Canada) to 68,056 in June. June year-over-year change (change from 2019): -7.5% (-19.9%) • Students: Decrease 31,200 in April to 26,410 in May. May year-over-year change (change from 2019): -14.2% (-5.0%) • Applications: Decrease from 45,683 in April to 38,483 in May. May year-over-year change (change from 2019): 1,048.1% (10.8%) • Web “Get a study permit”: From 122,865 in May (outside Canada) to 82,033 in June. Year-over-year change (change from 2019): 10.8% (-1.7%) • Asylum Claimants: Stable, from 1,110 in April (about 75% inland) to 1,160 in May. May year-over-year change (change from 2019): -16.5% (-75.1%) • Settlement Services (December): Decline from 48,700 in November to 42,890 in December. December year-over-year (change from 2019): 21.6% (-17.1%) • Web “Find immigrant services hear you”: From 9,524 in May (outside Canada) to 9,076 in June. June year-over-year change (change from 2019): -15.8% (-17.1%) • Citizenship: Increase from 6,825 in April to 7,699 in May. May year-over-year change (change from 2019): no number given April 2020 shutdown (-68.6%) • Applications: From 16,783 in February to 6,069 in March. March year-over-year change (change from 2019): -70.4% (-76.1%) • “Apply for citizenship”: From 21,717 in May (outside Canada) to 21,077 in June. June year-over-year change (change from 2019): -38.5% (90.1%) • Visitor Visas: Increase from 4,199 in April to 4,413 in May. May year-over-year change (change from 2019): 556.7% (-96.8%) 3
- 4. Overall Decline Across all Programs FY 2020-2021 Compared to FY 2019-20 4 PR Applications PR Admissions Asylum Claimants Temporary Workers IMP Temporary Workers TFWP Study Permit Applications Study Permit Holders Citizenship Applications New Citizens Settlement Services (2020/19) Visitor Visas -120% -88.75% -57.5% -26.25% 5% -95.1% -21.4% -77.3% -30.5% -25% -38.8% 4.4% -9.3% -76.4% -46.1% -38.8%
- 6. PR Applications: Region of Citizenship —2018-21 15,000 30,000 45,000 60,000 2018-1 2018-4 2018-7 2018-10 2019-1 2019-4 2019-7 2019-10 2020-1 2020-4 2020-7 2020-10 2021-1 2021-4 Asia Africa Americas Europe Oceania 6
- 7. Admissions: PRs by Categories—2018-21 10,000 20,000 30,000 40,000 2018-1 2018-4 2018-7 2018-10 2019-1 2019-4 2019-7 2019-10 2020-1 2020-4 2020-7 2020-10 2021-1 2021-4 Economic Family Refugees 7
- 8. Admissions: PRs Region of Citizenship—2018-21 25% 50% 75% 100% 2018-1 2018-4 2018-7 2018-10 2019-1 2019-4 2019-7 2019-10 2020-1 2020-4 2020-7 2020-10 2021-1 2021-4 Asia Africa Americas Europe Oceania 8
- 9. Admissions: Provincial Nominee Program— 2018-21 2,250 4,500 6,750 9,000 2018-1 2018-4 2018-7 2018-10 2019-1 2019-4 2019-7 2019-10 2020-1 2020-4 2020-7 2020-10 2021-1 2021-4 9
- 10. Admissions: PRs Total, Provincial Nominee Program Two-Year Comparison (monthly) -90% -67.5% -45% -22.5% 0% 22.5% 45% 67.5% 90% 2019-1 2019-3 2019-5 2019-7 2019-9 2019-11 2020-1 2020-3 2020-5 2020-7 2020-9 2020-11 2021-1 2021-3 2021-5 -66.6% -36.5% -50.4% -5.6% 26.7% -55.5% -40% -55.7% -49.9% -77.7% -61.4% -30.9% -50.2% -71.4% -32.7% 45.6% 64.7% 13.5% 43.2% 38.4% 36.8% 57.3% 43.2% 25.4% -1.6% -29.7% -18.7% -36.2% -32.4% -48.3% -21.6% -17.2% -9.9% -0.3% -48.5% -39.1% -51.8% -57.7% -64.2% -62.7% -44.2% -66.8% -84.6% -29.4% 28.1% 32.7% -4.1% 9.5% 18.3% 27.1% 24.7% 26.1% 14.3% 14.8% -6.6% -12.2% -21.1% -20.9% PRs Total PNP 10
- 11. Admissions: PRs Canada Total May Comparison: 2021/20, 2021/19 -90% -60% -30% 0% 30% 60% 90% 120% Economic Family Refugees 23% -28.8% 19.6% -42.9% -62.4% -48.6% 103.9% 60.4% 34.8% May 2021/20 May 2021/19 Q1 11
- 12. Admissions: PNP Provinces May Comparison: 2021/20, 2021/19 -100% -75% -50% -25% 0% Atlantic ON MB SK AB BC -31.7% -29.7% -51.3% -53.3% -45.2% -49.6% -63.2% -58.3% -72.2% -80.6% -57% -70.6% -48.5% -42.7% -23% -28.4% -10.4% -21.3% May 2021/20 May 2021/19 2020 12
- 13. Admissions: Permanent Residents by Citizenship May Comparison: 2021/20, 2021/19 Top 10 Countries — Ordered by 2018 base year -100% -25% 50% 125% 200% India Philippines China Syria Nigeria USA Pakistan France Eritrea UK -38.5% -62.6% -7.5% -42.6% -40% -49.6% -52.2% -44.7% -60.3% -49.7% -33.9% -72.7% 67.1% -66.8% -36.4% -20.8% -75% -52.4% -75.4% -58.3% 16.1% 123.5% 77.3% 25% 25.5% 183.3% 114.3% 43.1% 6.2% 58.9% May 2021/20 May 2021/19 2020 13
- 14. Admissions: Temporary to Permanent Residents By Program—2018-21 3,500 7,000 10,500 14,000 2018-1 2018-4 2018-7 2018-10 2019-1 2019-4 2019-7 2019-10 2020-1 2020-4 2020-7 2020-10 2021-1 2021-4 IMP Post-Graduate WP Students TFWP 14
- 15. Admissions by Province: TRs to PRs May Comparison: 2021/20, 2021/19 -80% -25% 30% 85% 140% Atlantic QC ON MB SK AB BC -28.1% -32.3% -51.9% -39.2% -27.3% -20.8% -41.2% -12% -45.4% -66.2% -71.1% 33.6% 66.7% -54.5% 22.9% -6.4% 23.8% 15.6% 105.2% 133.3% -32.3% May 2021/20 May 2021/19 2020 15
- 16. Admissions: TRs to PRs May Comparison: 2021/20, 2021/19 -60% -45% -30% -15% 0% 15% 30% 45% 60% IMP Post-Graduate WP Students TFWP -41.6% -32.6% -28.8% -29.9% -24.5% -11.7% -5.6% 0% 37.5% 40.3% 55.7% 58.5% May 2021/20 May 2021/19 2020 16
- 17. Asylum Claimants: Of fi ce Type 2018-21 1,750 3,500 5,250 7,000 2018-1 2018-4 2018-7 2018-10 2019-1 2019-4 2019-7 2019-10 2020-1 2020-4 2020-7 2020-10 2021-1 2021-4 Airport Border Inland 17
- 18. Asylum Claimants: Year-over-year May Comparison: 2021/20, 2021/19 -250% 0% 250% 500% 750% 1,000% Airport Border Inland -54% -72.2% -77.1% -65.4% -84.7% -91% -28.3% 29.7% 1,000% May 2021/20 May 2021/19 2020 18
- 19. Asylum Claimants: Year-over-year May Comparison: 2021/20, 2021/19 -100% -25% 50% 125% 200% India Mexico Iran Nigeria Colombia Pakistan China Turkey Haiti USA -85% -54.5% -53.8% -74.2% -90.9% -71.4% -93% -66.7% -71.4% -77.3% -25% -31.3% 200% 71.4% 0% 175% 0% -30% -64.9% -54.2% May 2021/20 May 2021/19 19
- 20. Immigrate to Canada—Web Interest 250,000 500,000 750,000 1,000,000 2018-1 2018-4 2018-7 2018-10 2019-1 2019-4 2019-7 2019-10 2020-1 2020-4 2020-7 2020-10 2021-1 2021-4 Canada Asia Americas Africa Europe Oceania Not speci fi ed 20
- 21. Immigrate to Canada—Web Interest June Comparison: 2021/20, 2021/19 Top 10 Countries by “Get a work permit” ordered by site visits, 2018 base year -70% -52.5% -35% -17.5% 0% 17.5% 35% 52.5% India USA Nigeria UK UAE Pakistan Philippines Mexico Saudi Arabia Brazil -67.2% 13.6% -31.4% 31% -11.1% -4.2% -15% 2.9% -20.8% 12.2% -33.6% -1.6% -30.8% 27.2% 10.3% -19.9% -37.3% 13.9% -54.9% 35.5% June 2021/20 June 2021/19 21
- 23. IMP & TFWP Work Permit Holders—2018-21 12,500 25,000 37,500 50,000 2018-1 2018-5 2018-9 2019-1 2019-5 2019-9 2020-1 2020-5 2020-9 2021-1 2021-5 Agreements Cdn Interests Other IMP Not Stated Caregivers Agriculture LMIA 23
- 24. IMP by Region of Citizenship—2018-21 0% 25% 50% 75% 100% 2018-1 2018-4 2018-7 2018-10 2019-1 2019-4 2019-7 2019-10 2020-1 2020-4 2020-7 2020-10 2021-1 2021-4 Asia Europe Americas Africa Oceania 24
- 25. TFWP by Region of Citizenship—2018-21 0% 25% 50% 75% 100% 2018-1 2018-4 2018-7 2018-10 2019-1 2019-4 2019-7 2019-10 2020-1 2020-4 2020-7 2020-10 2021-1 2021-4 Americas Asia Europe Africa Oceania 25
- 26. IMP & TFWP Work Permit Holders Total Year to Year Comparison (Monthly) -80% -40% 0% 40% 80% 120% 160% 2019-1 2019-3 2019-5 2019-7 2019-9 2019-11 2020-1 2020-3 2020-5 2020-7 2020-9 2020-11 2021-1 2021-3 2021-5 IMP TFWP 26
- 27. Temporary Residents by Program Canada May Comparison: 2021/20, 2021/19 -60% -40% -20% 0% 20% 40% 60% 80% Agreements Canadian Interests Caregivers Agriculture LMIA -12.7% -6.1% -49% -7.9% -31.1% -14.3% 10.1% -48.1% -39.8% -39% 45.4% 14.2% 73.9% 6.3% 31.5% May 2021/20 May 2021/19 2020 27
- 28. IMP by Citizenship May Comparison: 2021/20, 2021/19 Top 10 Countries—Ordered by 2018 base year -120% -80% -40% 0% 40% 80% 120% 160% India USA France China UK Australia Ireland Korea Brazil Japan -81.3% -27.9% -60.8% -91.7% -82% -57.8% -47.4% -54.4% -59.6% -26.9% 100% 44.2% 85.7% 153.8% 81.3% 137.5% 15.1% 122.9% -3.9% 33.2% May 2021/20 May 2021/19 28
- 29. TFWP by Citizenship May Comparison: 2021/20, 2021/19 Top 10 Countries—Ordered by 2018 base year -150% -12.5% 125% 262.5% 400% Mexico Jamaica Guatemala Philippines India Korea USA UK China France 47.4% -37.9% -6.3% -68.4% -40% -33.3% -7.9% 41.9% 60.8% -6.7% 366.7% 0% 275% 71.4% 42.9% 29.6% 103.1% 8.5% 6.4% 23.8% May 2021/20 May 2021/19 29
- 30. Work Permits—Web Interest 40,000 80,000 120,000 160,000 2018-1 2018-4 2018-7 2018-10 2019-1 2019-4 2019-7 2019-10 2020-1 2020-4 2020-7 2020-10 2021-1 2021-4 Canada Asia Americas Europe Oceania Africa Not captured 30
- 31. Work Permits—Web Interest June Comparison—2021/20, 2021/19 Top 10 Countries by “Get a work permit” ordered by site visits, 2018 base year -70% -52.5% -35% -17.5% 0% 17.5% 35% 52.5% 70% India USA Mexico UK Australia Pakistan Brazil Philippines UAE Saudi Arabia 6.5% -10.1% 9.5% -10.4% -20.1% -59.2% -39.6% -19% -41.9% -2.8% 21.3% 4.9% 55.1% -4.5% 23.2% -3.4% -24.3% -20.2% -38.9% 62.6% June 2021/20 June 2021/19 31
- 32. Study Permits 32
- 33. Study Permit Applications—By Region—2018-21 17,500 35,000 52,500 70,000 2018-1 2018-4 2018-7 2018-10 2019-1 2019-4 2019-7 2019-10 2020-1 2020-4 2020-7 2020-10 2021-1 2021-4 Asia Africa Americas Europe Oceania 33
- 34. Study Permit Holders—By Level—2018-21 30,000 60,000 90,000 120,000 2018-1 2018-4 2018-7 2018-10 2019-1 2019-4 2019-7 2019-10 2020-1 2020-4 2020-7 2020-10 2021-1 2021-4 Secondary or less Post Secondary Other Studies 34
- 35. Study Permit Holders—By Region—2018-21 0% 25% 50% 75% 100% 2018-1 2018-4 2018-7 2018-10 2019-1 2019-4 2019-7 2019-10 2020-1 2020-4 2020-7 2020-10 2021-1 2021-4 Asia Africa Americas Europe Oceania 35
- 36. Study Permit Holders by Citizenship May Comparison: 2021/20, 2021/19 Top 10 Countries — Ordered by Number of Permits, 2018 base year -60% -30% 0% 30% 60% 90% 120% India China Korea France Vietnam Brazil Iran Japan USA Nigeria 38.7% 45.3% 21.4% 62.6% -31.9% 26.5% 116.9% -30.5% -29% -37.3% -21% -34.7% 70% -12.7% -14% -53.4% 54.6% -39% -30.2% -25.5% May 2021/20 May 2021/19 36
- 37. Study Permit Holders by Province May Comparison: 2021/20, 2021/19 -90% -62.5% -35% -7.5% 20% Atlantic QC ON MB SK AB BC -28.2% -34.4% -41.8% -26.5% -36.5% -21.5% -46.8% 7.3% 13.2% 8.0% 11.8% -11.3% -10.9% -20.8% -13.5% -14.0% 0.0% -19.8% -22.8% 18.2% -17.3% May 2021/20 May 2021/19 2020 37
- 38. Study Permits—Web Interest 40,000 80,000 120,000 160,000 2018-1 2018-4 2018-7 2018-10 2019-1 2019-4 2019-7 2019-10 2020-1 2020-4 2020-7 2020-10 2020-1 2021-4 Canada Asia Americas Africa Europe Oceania Not captured 38
- 39. Study Permits—Web Interest June Comparison: 2021/20, 2021/19 Top 10 Countries by “Get your study permit” ordered by site visits, 2018 base year -120% -80% -40% 0% 40% 80% 120% 160% India USA China Nigeria Brazil PhilippinesColombia Mexico Iran Pakistan 27.5% -99% 4.6% 130.3% 118.3% 10.7% 33.1% -62.9% -20.3% 22.6% 18.6% -91.9% 5% 156.4% 116.8% 26.1% 36.6% -23.7% -27.5% 37.1% June 2021/20 June 2021/19 39
- 41. Settlement—By Service—2018-20 In Canada Services—Top 25 Countries 20,000 40,000 60,000 80,000 2018-1 2018-4 2018-7 2018-10 2019-1 2019-4 2019-7 2019-10 2020-1 2020-4 2020-7 2020-10 Community Connections Employment Related Services Information and Orientation Services Language Assessment Language Training Needs & Assets Assessment and Referrals Resettlement Assistance Program Service Delivery Improvement 41
- 42. Settlement Services Year-over-year Comparison by Service—December 2020, Last Quarter Community Employment Information/Orientation Language Assessment Language Training Needs Assessment, Referrals Resettlement Assistance -100% -72.5% -45% -17.5% 10% -88.2% -30.5% -13.3% -71.1% 1.5% -24.3% -23.3% -48.4% -29.3% -9.8% -68.2% -9.1% -36.2% -40.3% December 2020 July-September 42
- 43. Settlement Services Year-over-year Comparison by Province—December 2020, Last Quarter -50% -37.5% -25% -12.5% 0% Atlantic QC ON MB SK AB BC -18.4% -23.2% -24.8% -26.5% -7.4% -28.4% -45.8% -19.7% -13.4% -24.1% -35.8% -15.9% -28.9% -21.8% December 2020 July-September 43
- 44. Settlement Services by Citizenship Year-over-year Comparison—December 2020, Last Quarter Top 10, 2018 base year -40% -30% -20% -10% 0% 10% Syria Eritrea Congo Somalia Afghanistan India Pakistan Korea Mexico Philippines -14.3% -15.4% -29.3% -16.6% -15.6% -15.9% -28.1% -24.5% -17.4% -23.5% -38.3% -26.1% -17.3% -18.8% -2.2% 0.9% -32.5% -36.4% -23.3% -20.2% December 2020 July-September 44
- 45. Settlement Services—Web Interest 12,500 25,000 37,500 50,000 2018-11 2019-2 2019-5 2019-8 2019-11 2020-2 2020-5 2020-8 2020-11 2021-2 2021-5 Canada Asia Americas Europe Africa Oceania Not speci fi ed 45
- 46. Settlement Services—Web Interest June Comparison: 2021/20, 2021/19 Top 10 Countries by “Find immigrant services near you” ordered by site visits, 2018 base year -80% -40% 0% 40% 80% 120% 160% India USA Brazil UAE Pakistan Nigeria Mexico UK ColombiaPhilippines 8.1% 72% -39.2% -35.5% -32.9% -15.5% -17.7% 28% -53.6% -10.5% 25.6% 150.7% -19.2% -26.9% 0% -17.5% -21.7% -5.9% -36.8% 5.5% June 2021/20 June 2021/19 46
- 47. Citizenship 47
- 48. Citizenship Applications—2018-21 7,500 15,000 22,500 30,000 2018-1 2018-4 2018-7 2018-10 2019-1 2019-4 2019-7 2019-10 2020-1 2020-4 2020-7 2020-10 2021-1 48
- 49. New Citizens—By Region of Birth—2018-21 7,500 15,000 22,500 30,000 2018-1 2018-4 2018-7 2018-10 2019-1 2019-4 2019-7 2019-10 2020-1 2020-4 2020-7 2020-10 2021-1 2021-4 Asia Africa Americas Europe Oceania 49
- 50. Citizenship by Region of Birth May Comparison: 2021/19 Top 10 Countries—Ordered by 2018 base year 2021/20 Comparison not calculable given complete shutdown April-May 2020 -100% -75% -50% -25% 0% Philippines India Iran China Pakistan Nigeria USA Egypt Iraq France -92.7% -72.5% -69.3% -67.7% -54.7% -67.5% -79% -86.3% -53.8% -57.4% May 2021/20 May 2021/19 50
- 51. Citizenship—Web Interest Note: Technical anomaly April - December 2019 45,000 90,000 135,000 180,000 2018-1 2018-4 2018-72018-102019-1 2019-4 2019-72019-102020-1 2020-4 2020-72020-102021-1 2021-4 Canada Americas Asia Europe Africa Oceania Not captured 51
- 52. Citizenship—Web Interest June Comparison: 2021/20, 2021/19 Top 10 Countries by “Apply for Citizenship” ordered by site visits, 2018 base year -75% 0% 75% 150% 225% 300% USA India UK Pakistan UAE Nigeria China Brazil Turkey Bangladesh 293.9% 118.5% 98.9% 63.8% 86.2% 108% 141.6% 70% 129% 54.7% -18.5% 8.8% -43% -20.4% 17.6% -29.7% -2% -51.5% -5% -63.7% June 2021/20 June 2021/19 52
- 54. Visitor Visas—By Source Country—2018-21 45,000 90,000 135,000 180,000 2018-1 2018-4 2018-7 2018-10 2019-1 2019-4 2019-7 2019-10 2020-1 2020-4 2020-7 2020-10 2021-1 2021-4 Asia Americas Africa Europe Oceania Other 54
- 55. Visitor Visas—By Source Country May Comparison: 2021/20, 2021/19 Top 10 Countries—Ordered by 2018 base year -500% 1,125% 2,750% 4,375% 6,000% China India Philippines Iran Brazil Vietnam Colombia Algeria Pakistan Russia -87.4% -98.4% -98.9% -98.9% -99% -98% -90.8% -97.6% -98.9% -95.4% 122.9% 412.5% 156.3% 156.3% 220% 355.6% 5,233.3% 775% 1,542.9% 4,620% May 2021/20 May 2021/20 55
- 56. Research Questions 56 • Which programs contracted most quickly and which source countries were most a ff ected? Similarly, which programs and source countries recovered more quickly? • Did application success rates vary pre and post-COVID by source country? • Were exogenous factors such as US immigration restrictions or tensions with China a factor? • Did interest in immigrating to Canada increase or decrease and for which countries?
- 57. Annex 57
- 58. Top Countries Share of Total (2018) 10 Countries 25 Countries Permanent Residents 60.9% 77.7% IMP 70.8% 86.4% TFWP 85.2% 93.2% Study Permits 70.3% 73.8% Asylum Claimants 57.4% 77.4% Citizenship 50.3% 71.5% 58
- 59. Top Countries (2018) Permanent Residents IMP TFWP Students Settlement Citizenship India 69,980 India 55,610 Mexico 28,860 India 107,105 Syria 15,530 Philippines 19,647 Philippines 35,050 USA 26,540 Jamaica 10,200 China 85,100 Eritrea 11,865 India 19,486 China 29,710 Finland 23,445 Guatemala 9,810 Korea 16,875 Congo 11,355 Iran 10,037 Syria 12,045 China 21,910 Philippines 8,750 Vietnam 12,370 Somalia 10,785 PRC 9,718 Nigeria 10,920 UK 11,205 India 7,380 Iran 7,040 Afghanistan 9,550 Pakistan 9,406 USA 10,905 Australia 8,850 Korea 1,960 Japan 6,685 India 9,035 Nigeria 4,398 Pakistan 9,490 Ireland 8,675 USA 1,850 Bangladesh 4,155 Pakistan 8,360 USA 4,229 France 6,175 Korea 8,105 UK 940 Philippines 4,075 Korea of 7,775 Egypt 4,115 Eritrea 5,695 Brazil 8,080 China 935 Taiwan 3,160 Mexico 7,640 Iraq 3,951 UK 5,660 Japan 7,250 France 915 Saudi Arabia 2,870 Philippines 6,995 France 3,836 59
- 60. Data Sources • PRs: Canada - Admissions of Permanent Residents by Province/Territory of Intended Destination and Immigration Category, Canada - Admissions of Permanent Residents by Country of Citizenship, COVID Immigration Impact - PR Applications Source Countries • TR to Permanent Resident transition: Canada – Admissions of Permanent Residents with Prior Post-graduate Work Permit Holder Status by Province/Territory of Intended Destination and Immigration Category, Canada – Admissions of Permanent Residents with Prior International Mobility Program Work Permit Holder Status by Province/Territory of Intended Destination and Immigration Category, Canada – Admissions of Permanent Residents with Prior Study Permit Holder Status by Province/Territory of Intended Destination and Immigration Category, Canada – Admissions of Permanent Residents with Prior Temporary Foreign Worker Program Work Permit Holder Status by Province/Territory of Intended Destination and Immigration Category • Asylum Claimants: Canada - Asylum Claimants by Claim O ffi ce Type, Province/Territory* of Claim and Claim Year, Canada - Asylum Claimants by Top Twenty-Five Countries of Citizenship (2019 ranking), Claim O ffi ce Type and Claim Year • TRs: Canada - International Mobility Program (IMP) work permit holders by province/territory of intended destination, program and year in which permit(s) became e ff ective, Canada - Temporary Foreign Worker Program (TFWP) work permit holders by province/territory of intended destination, program and year in which permit(s) became e ff ective, Canada – International Mobility Program work permit holders by country of citizenship and year in which permit(s) became e ff ective, Canada – Temporary Foreign Worker Program work permit holders by country of citizenship and year in which permit(s) became e ff ective • Study Permits: Canada - Study permit holders by country of citizenship and year in which permit(s) became e ff ective, Canada - Study permit holders by province/territory of intended destination, study level and year in which permit(s) became e ff ective, Source Countries - Applications Processed by IRCC for New Study Permit Applications • Settlement Services: Special request IRCC data table • Citizenship: Source Countries (Country of Birth) - New Canadian Citizens (in Persons) by Month • Web: Provided by IRCC 60