SlideShare a Scribd company logo
1 of 64
Download to read offline
Canadian Immigration Tracker
2018 to September 2023
Working Draft - Key Slides
15,000
30,000
45,000
60,000
2018-1 2018-7 2019-1 2019-7 2020-1 2020-7 2021-1 2021-7 2022-1 2022-7 2023-1 2023-7
Economic - PNP Economic - Fed Family Refugees Other
Programs Examined
• Permanent Residents/Immigrants (PRs): Economic (PNP and Federal), Family and Refugees
• TR to Permanent Resident transition
• Asylum Claimants
• Temporary Residents/International Mobility Program (IMP): International Agreements (e.g., NAFTA, GATS),
Canadian Interests (e.g., intra-corporate transfers, work exchange programs, post-graduate employment,
spouses)
• Temporary Residents/Temporary Foreign Worker Program (TFWP): caregivers, agriculture workers, other
workers with Labour Market Impact Assessment (LMIA)
• Study Permits (international students)
• Settlement Services
• Citizenship
• Visitor Visas
2
August 2023 Highlights
• PRs: Admissions Decline from 34,920 in August to 32,065 in September. September year-over-year change (change from 2021 in parentheses): Economic - PNP
-53.4% (-1.0%), Economic - Federal -14.1% (-45.5%), Family -21.3% (-23.7%), Refugees -29.4% (-0.9%)
• Applications: Given time delays in entering application data, am using a six month time lag. From 29,481 in February (time delays greater) to 41,485 in March. March year-over-year change (change from 2020): 55.7% (-29.1%).
• Express Entry and Arrima Invitations to Apply: Decrease from 10,751 in September (1,384 Arrima) to 8,845 (1,220 Arrima) in October. October year-over-year change (change from 2020): -1.7% (455.9%)
• Web “Immigrate to Canada”: Decrease from 332,817 in September (outside Canada) to 304,732 in October. October year-over-year change (change from 2021): -24.7% (-30.5%)
• TR to PRs transition (i.e., those already in Canada): Sharp decrease from 23,315 in August (some double counting) to 10,325 in September (32 percent of all PRs). September year-over-year change (change from 2020): -22.2% (-69.8%)
• Temporary Residents:
• TRs/IMP: Sharp decrease from 125,460 in August to 74,930 in September. September year-over-year (change from 2021: Agreements: -43.8% (-21.2%), Canadian Interests: 8.8% (52.6%), Other IMP Participants 152.8% (1,130.5%), Not stated 19.5%
(350.4%)
• TRs/TFWP: Increase from 12,615 in August to 14,700 in September. September year-over-year change (change from 2021): Caregivers 32.8% (165.6%), Agriculture -0.1% (96.3%) and Other LMIA 28.1% (274.2%).
• Web “Get a work permit”: Increase from 104,970 in September (outside Canada) to 131,019 in October. October year-over-year change (change from 2021): 19.3% (35.8%)
• Students: Seasonal decrease from 178,070 in August to 69,470 in September. September year-over-year change (change from 2021): 6.5% (-2.8%)
• Applications: Decrease from 80,897 in August to 60,294 in September. September year-over-year change (change from 2021): -21.5% (20.9%)
• Web “Get a study permit”: Stable from 51,110 in September (outside Canada) to 50,493 in October. October year-over-year change (change from 2021): -21.9% (-36.3%)
• Asylum Claimants: Increase from 12,620 in August to 15,340 in September. September year-over-year change (change from 2021): 81.3% (559.8%)
• Irregular arrivals (Roxham Road etc): Remain low level, from 84 in August. to 70 in September. September year-over-year change (change from 2021): -98.1% (-58.6%).
• Settlement Services: Decrease from 251,625 in November to 211,560 in December (most recent data). December year-over-year (change from 2020): 37.0%
(47.9%)
• Web “Find immigrant services near you”: Decrease from 6,476 in September (outside Canada) to 4,688 in October. October year-over-year change (change from 2021): -0.2% (-49.5%). In Canada: -11.4% (-53.7%)
• Citizenship: Increase from 34,700 in August to 37,822 in September (monthly average year to date 31,164). September year-over-year change (change from 2021):
22.4% (171.2%)
• Applications: From 232,974 in 2021 to 264,231 in 2022. Year-over-year change (change from 2018): 13.4% (33.8%)
• “Apply for citizenship”: Decrease from15,794 in September (outside Canada) to 14,503 in October. October year-over-year change (change from 2021): -22.4% (-35.7%). In Canada: -30.3% (-37.1%)
• Visitor Visas: Stable 142,238 in August to 145,323 in September. September year-over-year change (change from 2021): 73.5% (230.8%).
3
Change Across Major Programs
2022 full year Compared to full year 2018 Baseline
4
PR Applications
PR Admissions-PNP
PR Admissions-Fed
TR2PR
Temporary Workers IMP
Temporary Workers TFWP
Asylum Claimants
Study Permit Applications
Study Permit Holders
Citizenship Applications
New Citizens
Settlement Services
Visitor Visas
-75% -21.25% 32.5% 86.25% 140%
-7.4%
-16.9%
109.2%
1.7%
56.1%
101.7%
66.3%
65.1%
126.7%
93.2%
34.9%
40.2%
-35.8%
Permanent Residents
5
Express Entry & Arrima Invitations—2018-23
7,500
15,000
22,500
30,000
2018-1 2018-7 2019-1 2019-7 2020-1 2020-7 2021-1 2021-7 2022-1 2022-7 2023-1 2023-7
CEC PNP No Program Federal Skilled Trades Healthcare STEM
Trades Transport Agriculture French QC Arrima
6
PR Applications: Region of Citizenship —2018-23
35,000
70,000
105,000
140,000
2018-1 2018-7 2019-1 2019-7 2020-1 2020-7 2021-1 2021-7 2022-1 2022-7 2023-1
Asia Africa Americas Europe Oceania
7
Note: Given delays in entering applications in processing systems, a six month time lag is used. May 2021 surge driven by
applications from India
Admissions: PRs by Categories—2018-23
15,000
30,000
45,000
60,000
2018-1 2018-7 2019-1 2019-7 2020-1 2020-7 2021-1 2021-7 2022-1 2022-7 2023-1 2023-7
Economic - PNP Economic - Fed Family Refugees Other
8
Admissions: PRs Region of Citizenship—2018-23
25%
50%
75%
100%
2018-1 2018-7 2019-1 2019-7 2020-1 2020-7 2021-1 2021-7 2022-1 2022-7 2023-1 2023-7
Asia Africa Americas Europe Oceania
9
Admissions: PRs Canada Total
September Comparison: 2023/22, 2023/21, Full year 2022/18
-60%
-45%
-30%
-15%
0%
15%
30%
45%
60%
Economic - PNP Economic - Fed Family Refugees
54.6%
5.9%
28.4%
33.2%
-0.9%
-23.7%
-45.5%
-1%
-29.4%
-21.3%
-14.1%
-53.4%
September 2023/22 September 2023/21 Full year 2022/18
10
Admissions: PNP Provinces
September Comparison: 2023/22, 2023/21, Full year 2022/18
-90%
-60%
-30%
0%
30%
60%
90%
120%
Atlantic ON MB SK AB BC
35.8%
17.3%
39.2%
41.9%
33.5%
102.6%
-61.9%
-28.7%
-30%
-6.4%
-23.5%
-37.3%
-65.7%
-62.6%
-30.8%
-62.9%
-55%
-49.2%
September 2023/22 September 2023/21 Full year 2022/18
11
Admissions: Permanent Residents by Citizenship
September Comparison: 2023/22, 2023/21, Full year 2022/18
Top 10 Countries — Ordered by 2018 base year
-100%
-40%
20%
80%
140%
India Philippines China Syria Nigeria USA Pakistan France Eritrea UK
-21.3%
33.7%
128.9%
21.1%
-5.1%
101.3%
-29.9%
6.5%
-37.3%
67.8%
-65.6%
58.8%
-16.7%
-18.4%
-63.8%
-24%
53.4%
-36.3%
-8.6%
-53.7%
-39.7%
-17.2%
-8.2%
-27.5%
-53.3%
-59.1%
-3.8%
-34.8%
-12.4%
-34.2%
September 2023/22 September 2023/21 Full year 2022/18
12
Admissions: Temporary to Permanent Residents
By Program—2018-23
10,000
20,000
30,000
40,000
2018-1 2018-7 2019-1 2019-7 2020-1 2020-7 2021-1 2021-7 2022-1 2022-7 2023-1 2023-7
IMP Post-Graduate WP Students TFWP
13
Admissions by Province: TRs to PRs
September Comparison: 2023/22, 2023/21, Full year 2022/18
-150%
-75%
0%
75%
150%
225%
300%
Atlantic QC ON MB SK AB BC
76%
12.7%
3.7%
199.2%
99.7%
136.2%
205.5%
-83.3%
-73.4%
-66.7%
-73.1%
-74.9%
34.9%
-73.7%
-49.8%
-57.8%
-54.8%
-63.5%
5.1%
19.2%
-55.7%
September 2023/22 September 2023/21 Full year 2022/18
14
Admissions: TRs to PRs
September Comparison: 2023/22, 2023/21, Full year 2022/18
-90%
-60%
-30%
0%
30%
60%
90%
120%
IMP Post-Graduate WP Students TFWP
62.7%
79.7%
114.8%
88.6%
-56.4%
-48.7%
-78.5%
-68.3%
0%
-31.1%
-32%
-16.9%
September 2023/22 September 2023/21 Full year 2022/18
15
Two-Step Immigration
TR2PR Percent Total Admission
0
15,000
30,000
45,000
60,000
22.5%
45%
67.5%
90%
2018-1 2018-7 2019-1 2019-7 2020-1 2020-7 2021-1 2021-7 2022-1 2022-7 2023-1 2023-7
Percent TR2PR Total Admissions
16
Immigrate to Canada—Web Interest
250,000
500,000
750,000
1,000,000
2018-1 2018-7 2019-1 2019-7 2020-1 2020-7 2021-1 2021-7 2022-1 2022-7 2023-1 2023-7
Canada Asia Americas Africa Europe Oceania Not speci
fi
ed
17
Immigrate to Canada—Web Interest
October Comparison: 2023/22, 2023/21
Top 10 Countries by “Immigrate to Canada” ordered by site visits, 2018 base year
-80%
-60%
-40%
-20%
0%
20%
40%
India USA Nigeria UK UAE Pakistan Philippines Mexico Saudi Arabia Brazil
-53.9%
-25.6%
-38.1%
-47.2%
39.8%
-40.3%
3.9%
-2%
-22.6%
-71.8%
-51.7%
-19.8%
-42.5%
-37.1%
15%
-35%
-10.5%
-8.2%
-14%
-53.9%
October 2023-22 October 2023-21
18
Asylum Claimants
19
Asylum Claimants: Of
fi
ce Type 2018-23
4,000
8,000
12,000
16,000
2018-1 2018-7 2019-1 2019-7 2020-1 2020-7 2021-1 2021-7 2022-1 2022-7 2023-1 2023-7
Airport Border Inland Other
20
Note: The “other claim of
fi
ce” surge in September-November likely re
fl
ected delays in classi
fi
cation, most of these were likely Inland
Asylum Claimants: Irregular Arrivals
RCMP Interceptions as Percent Total Asylum Claimants—2018-23
0
1,250
2,500
3,750
5,000
15%
30%
45%
60%
2018-1 2018-7 2019-1 2019-7 2020-1 2020-7 2021-1 2021-7 2022-1 2022-7 2023-1 2023-7
Percent Claimants Irregular Arrivals
21
Asylum Claimants: Year-over-year
September Comparison: 2023/22, 2023/21, Full year 2022/18
-300%
0%
300%
600%
900%
1,200%
Airport Border Inland
-17%
123.4%
146.4%
766.7%
91.7%
1,149.4%
406.9%
-57.6%
166.4%
September 2023/22 September 2023/21 Full year 2022/18
22
Asylum Claimants: Year-over-year
September Comparison: 2023/22, 2023/21, Full year 2022/18
-750%
0%
750%
1,500%
2,250%
3,000%
India Mexico Iran Nigeria Colombia Pakistan China Turkey Haiti USA
-39.6%
734.3%
366.7%
-50%
20.6%
182.7%
-80.4%
88.1%
397.6%
-10.9%
75%
400%
56.4%
322.2%
652.9%
95.1%
2,812.5%
317.4%
1,135.7%
873.9%
0%
-34.2%
-50.3%
280%
172.3%
-45.9%
529.7%
68.4%
43.8%
234.3%
September 2023/22 September 2023/21 Full year 2022/18
23
Temporary Residents
24
IMP & TFWP Work Permit Holders—2018-23
35,000
70,000
105,000
140,000
2018-1 2018-7 2019-1 2019-7 2020-1 2020-7 2021-1 2021-7 2022-1 2022-7 2023-1 2023-7
Agreements Cdn Interests Other IMP Vulnerable Not Stated Caregivers
Agriculture LMIA 25
Temporary Residents by Program Canada
September Comparison: 2023/22, 2023/21, Full year 2022/18
-75%
0%
75%
150%
225%
300%
Agreements Canadian Interests Caregivers Agriculture LMIA
156.7%
28.5%
-48.9%
53.1%
-9.5%
274.2%
96.3%
165.6%
52.6%
-21.2%
28.1%
-0.1%
32.8%
8.8%
-43.8%
September 2023/22 September 2023/21 Full year 2022/18
26
IMP by Region of Citizenship—2018-23
0%
25%
50%
75%
100%
2018-1 2018-7 2019-1 2019-7 2020-1 2020-7 2021-1 2021-7 2022-1 2022-7 2023-1 2023-7
Asia Europe Americas Africa Oceania
27
IMP by Citizenship
September Comparison: 2023/22, 2023/21, Full year 2022/18
Top 10 Countries—Ordered by 2018 base year
-75%
0%
75%
150%
225%
300%
India USA France China UK Australia Ireland Korea Brazil Japan
-19%
0%
-8.7%
-32.8%
-29.2%
1.1%
-6.2%
6.4%
-31.1%
172.5%
275%
-1.1%
47.2%
48.5%
215.4%
67.7%
10.2%
69.2%
8.5%
65.2%
55.6%
5.9%
-4.3%
-19.7%
1.2%
1.8%
32.3%
13.4%
2.7%
-2.7%
September 2023/22 September 2023/21 Full year 2022/18
28
IMP by Province
September Comparison: 2023/22, 2023/21, Full year 2022/18
Top 10 Countries—Ordered by 2018 base year
-45%
0%
45%
90%
135%
180%
Atlantic QC ON MB SK AB BC
55.1%
46%
39.6%
72.7%
81.2%
49%
100.9%
167.4%
178.3%
75.8%
99.5%
124.3%
77%
55.6%
62.4%
26%
-2.8%
-11%
30.4%
51%
33.7%
September 2023/22 September 2023/21 Full year 2022/18
29
TFWP by Region of Citizenship—2018-23
0%
25%
50%
75%
100%
2018-1 2018-7 2019-1 2019-7 2020-1 2020-7 2021-1 2021-7 2022-1 2022-7 2023-1 2023-7
Americas Asia Europe Africa Oceania
30
TFWP by Citizenship
September Comparison: 2023/22, 2023/21, Full year 2022/18
Top 10 Countries—Ordered by 2018 base year
-125%
0%
125%
250%
375%
500%
Mexico Jamaica Guatemala Philippines India Korea USA UK China France
134%
71.9%
26.3%
-40.4%
12.1%
160.3%
48.2%
93.7%
9.8%
45.3%
76.9%
416.7%
23.1%
87.5%
90.5%
405.9%
352.8%
58.5%
150.8%
115.8%
40.8%
113.8%
-5.9%
-11.8%
5.3%
-12.9%
55.7%
-2.8%
10.1%
0.3%
September 2023/22 September 2023/21 Full year 2022/18
31
TFWP by Province
September Comparison: 2023/22, 2023/21, Full year 2022/18
Top 10 Countries—Ordered by 2018 base year
-125%
0%
125%
250%
375%
500%
Atlantic QC ON MB SK AB BC
58.1%
60.3%
69.8%
63%
31%
120.7%
112.4%
220.7%
468.8%
288.9%
380%
161.3%
167%
131.7%
-6.8%
42.2%
59.1%
33.3%
14.9%
39.6%
6.1%
September 2023/22 September 2023/21 Full year 2022/18
32
Work Permits—Web Interest
75,000
150,000
225,000
300,000
2018-1 2018-7 2019-1 2019-7 2020-1 2020-7 2021-1 2021-7 2022-1 2022-7 2023-1 2023-7
Canada Asia Americas Europe Oceania Africa Not captured
33
Work Permits—Web Interest
October Comparison: 2023/22, 2023/21
Top 10 Countries by “Get a work permit” ordered by site visits, 2018 base year
-150%
0%
150%
300%
450%
600%
India USA Mexico UK Australia Pakistan Brazil Philippines UAE Saudi Arabia
77.2%
39%
27.1%
-16.3%
530.1%
14.9%
45.9%
33%
36.5%
-42.1%
29%
8.7%
2.2%
-16.9%
216.7%
9.4%
-1.7%
-28%
5.8%
-42.4%
October 2023-22 October 2023-21
34
Study Permits
35
Study Permit Applications—By Region—2018-23
25,000
50,000
75,000
100,000
2018-1 2018-7 2019-1 2019-7 2020-1 2020-7 2021-1 2021-7 2022-1 2022-7 2023-1 2023-7
Asia Africa Americas Europe Oceania
36
Study Permit Holders—By Level—2018-23
45,000
90,000
135,000
180,000
2018-1 2018-7 2019-1 2019-7 2020-1 2020-7 2021-1 2021-7 2022-1 2022-7 2023-1 2023-7
Secondary or less Post Secondary Other Studies
37
Study Permit Holders—By Region—2018-23
0%
25%
50%
75%
100%
2018-1 2018-7 2019-1 2019-7 2020-1 2020-7 2021-1 2021-7 2022-1 2022-7 2023-1 2023-7
Asia Africa Americas Europe Oceania
38
Study Permit Holders by Citizenship
September Comparison: 2023/22, 2023/21, Full year 2022/18
Top 10 Countries — Ordered by Number of Permits, 2018 base year
-100%
0%
100%
200%
300%
400%
India China Korea France Vietnam Brazil Iran Japan USA Nigeria
150%
9.9%
68.2%
93.4%
-1.6%
-17.2%
26.6%
-32.2%
-38.3%
114.1%
397.2%
-26.8%
4.2%
82.1%
-19.8%
76%
-53.4%
16.8%
65.5%
-48.9%
150.9%
6.9%
-8.3%
-1.7%
-7.6%
-10.5%
-17.5%
1.5%
29.3%
-20.7%
September 2023/22 September 2023/21 Full year 2022/18
39
Study Permit Holders by Province
September Comparison: 2023/22, 2023/21, Full year 2022/18
-17.5%
0%
17.5%
35%
52.5%
70%
Atlantic QC ON MB SK AB BC
34.6%
51.7%
44.4%
19.9%
66.3%
45.6%
51.1%
2.0%
32.5%
27.0%
17.5%
-15.1%
1.9%
48.9%
16.2%
38.7%
43.3%
17.9%
-1.5%
13.9%
13.3%
September 2023/22 September 2023/21 Full year 2022/18
40
Study Permits—Web Interest
40,000
80,000
120,000
160,000
2018-1 2018-7 2019-1 2019-7 2020-1 2020-7 2020-1 2021-7 2022-1 2022-7 2023-1 2023-7
Canada Asia Americas Africa Europe Oceania Not captured
41
Study Permits—Web Interest
October Comparison: 2023/22, 2023/21
Top 10 Countries by “Get your study permit” ordered by site visits, 2018 base year
-125%
0%
125%
250%
375%
500%
India USA China Nigeria Brazil PhilippinesColombia Mexico Iran Pakistan
18.1%
220%
-55.8%
-64.1%
-44.5%
-57.5%
38.8%
-1.6%
-21.1%
-64.8%
1.3%
481.8%
-40.2%
-33.7%
-44.8%
-31.4%
-0.7%
-12.8%
-17.2%
-38.6%
October 2023-22 October 2023-21
42
Settlement Services
43
Settlement—By Service—2018-22
Pre-Arrival and In Canada Services
68,750
137,500
206,250
275,000
2018-1 2018-7 2019-1 2019-7 2020-1 2020-7 2021-1 2021-7 2022-1 2022-7
Pre-Arrival Information & Orientation Needs & Assets Assessment, Referrals Employment Related Services
Information & Orientation Services Community Connections Language Assessment
Language Training Resettlement Assistance Service Delivery Improvement
44
Settlement Services
December Comparison: 2022/21, 2022/20, Full year 2022/18
Pre-Arrival Info & Orientation
Needs, Assets & Referrals
Employment Related
Information & Orientation
Community Connections
Language Assessment
Language Training
Resettlement Assistance
Service Delivery Improvement
-100% 0% 100% 200% 300% 400%
18.8%
109.2%
-15.5%
8.9%
-1.7%
13%
18.9%
7.5%
18.8%
99.3%
374.9%
22.7%
224.9%
42.7%
41.7%
64.9%
66.8%
99.3%
11.3%
82.6%
22.9%
93.4%
32.6%
36.2%
76.9%
48.0%
11.3%
December 2022/21 December 2022/20 Full year 2022/18
45
Settlement Services—By Region—2018-22
0%
25%
50%
75%
100%
2018-1 2018-7 2019-1 2019-7 2020-1 2020-7 2021-1 2021-7 2022-1 2022-7
Asia Africa Americas Europe Oceania
46
Settlement Services by Citizenship
December Comparison: 2022/21, 2022/20, Full year 2021/18
Top 10, 2018 base year
-125%
0%
125%
250%
375%
500%
Syria China India Philippines Iraq Eritrea Iran PakistanAfghanistan Somalia
15.9%
267.2%
-9.9%
-9.6%
23.3%
-25.9%
-39.5%
-7.4%
-20.8%
-21.6%
25.7%
429.3%
11.8%
4.8%
41.5%
-7.7%
-11.2%
19.7%
6.5%
-9.3%
22.9%
115.6%
10.3%
6.7%
14.7%
-1%
-13.7%
15.9%
11.3%
-0.3%
December 2022/21 December 2022/20 Full year 2021/18
47
Settlement Services
December Comparison: 2022/21, 2022/20, Full year 2022/18
-45%
-30%
-15%
0%
15%
30%
45%
60%
Atlantic QC ON MB SK AB BC
6.9%
9.5%
10.5%
-10.4%
5.5%
-27.4%
25%
36.6%
50.8%
39.2%
40.5%
41.4%
-0.9%
44.3%
28.1%
39.9%
30.8%
40.1%
32.7%
11.4%
40.6%
December 2022/21 December 2022/20 Full year 2022/18
48
Settlement Services—Web Interest
12,500
25,000
37,500
50,000
2018-11 2019-5 2019-11 2020-5 2020-11 2021-5 2021-11 2022-5 2022-11 2023-5
Canada Asia Americas Europe Africa Oceania Not speci
fi
ed
49
Settlement Services—Web Interest
October Comparison: 2023/22, 2023/21
Top 10 Countries by “Find immigrant services near you” ordered by site visits, 2018 base year
-100%
-75%
-50%
-25%
0%
25%
50%
75%
100%
India USA Brazil UAE Pakistan Nigeria Mexico UK ColombiaPhilippines
-43.6%
-73%
15.7%
-77.2%
-1.5%
30.3%
-31.6%
-86.3%
-49%
-76.5%
34.2%
-30.6%
29.7%
-37.4%
20.2%
91.6%
-11.7%
-49.5%
-20.1%
-39.6%
October 2023-22 October 2023-21
50
Citizenship
51
Citizenship Applications—2018-22
7,500
15,000
22,500
30,000
2018-1 2018-7 2019-1 2019-7 2020-1 2020-7 2021-1 2021-7 2022-1 2022-7
Number: Red line is 3-month moving average
52
New Citizens—By Region of Birth—2018-23
12,500
25,000
37,500
50,000
2018-1 2018-7 2019-1 2019-7 2020-1 2020-7 2021-1 2021-7 2022-1 2022-7 2023-1 2023-7
Asia Africa Americas Europe Oceania
53
Citizenship by Region of Birth
September Comparison: 2023/22, 2023/1, Full year 2022/18
-200%
50%
300%
550%
800%
Philippines India Iran China Pakistan Nigeria USA Egypt Iraq France
110.3%
88.2%
25%
162.4%
185.1%
60.2%
8.8%
29.6%
203.2%
109.1%
784%
136.2%
74.3%
-36.3%
201.6%
93.9%
151.4%
116.3%
289.8%
98.5% 98%
-18.9%
-25.9%
-8%
-5%
-0.3%
72.3%
-2.4%
67.9%
7.7%
September 2023/22 September 2023/21 Full year 2022/18
54
Citizenship—Web Interest
Note: Technical anomaly April - December 2019
45,000
90,000
135,000
180,000
2018-1 2018-7 2019-1 2019-7 2020-1 2020-7 2021-1 2021-7 2022-1 2022-7 2023-1 2023-7
Canada Americas Asia Europe Africa Oceania Not captured
55
Citizenship—Web Interest
September Comparison: 2023/22, 2023/21
Top 10 Countries by “Apply for Citizenship” ordered by site visits, 2018 base year
-80%
-60%
-40%
-20%
0%
20%
40%
60%
USA India UK Pakistan UAE Nigeria China Brazil Turkey Bangladesh
-23.3%
-36.2%
30.1%
-66.4%
55.2%
-17.4%
-43.3%
38.8%
-33.7%
-75%
-22.8%
14.8%
-25.6%
14.3%
-13.9%
-32.7%
37.4%
-21.6%
-59.6%
-25.7%
September 2023-22 September 2023-21
56
Approved Visitor Visas
57
Visitor Visas—By Source Country—2018-23
75,000
150,000
225,000
300,000
2018-1 2018-7 2019-1 2019-7 2020-1 2020-7 2021-1 2021-7 2022-1 2022-7 2023-1 2023-7
Asia Americas Africa Europe Oceania Other
58
Note: Increase in Europe driven by Ukraine, almost totality of Europe
Visitor Visas—By Source Country
September Comparison: 2023/22, 2023/21, Full year 2022/18
Top 10 Countries—Ordered by 2018 base year
-175%
0%
175%
350%
525%
700%
China India Philippines Iran Brazil Vietnam Colombia Algeria Pakistan Russia
-55.2%
1.8%
-36%
28.4%
-22.1%
-39.5%
-35.5%
-4.7%
9.1%
-81.8%
-100%
602.1%
224.6%
295.7%
343.6%
537.6%
12%
664.6%
157.4%
140.5%
-100%
320.8%
264.6%
258.2%
-42.3%
4.2%
6.2%
-11.5%
42%
100.2%
September 2023/22 September 2023/21 Full year 2022/18
59
Note: The most dramatic change has been the number of visas issued to Ukrainians under the Canada-Ukraine authorization for emergency travel
which was not among the top 10 in 2018.
Research Questions
60
• Which programs contracted most quickly and which source countries
were most a
ff
ected? Similarly, which programs and source countries
recovered more quickly?
• Did application success rates vary pre and post-COVID by source
country?
• Were exogenous factors such as US immigration restrictions or
tensions with China a factor?
• Did interest in immigrating to Canada increase or decrease and for
which countries?
Annex
61
Top Countries Share of Total (2018)
10 Countries 25 Countries
Permanent Residents 60.9% 77.7%
IMP 70.8% 86.4%
TFWP 85.2% 93.2%
Study Permits 70.3% 73.8%
Asylum Claimants 57.4% 77.4%
Citizenship 50.3% 71.5%
62
Top Countries (2018)
Permanent
Residents
IMP TFWP Students Settlement Citizenship
India 69,980 India 55,610 Mexico 28,860 India 107,105 Syria 15,530 Philippines 19,647
Philippines 35,050 USA 26,540 Jamaica 10,200 China 85,100 Eritrea 11,865 India 19,486
China 29,710 Finland 23,445 Guatemala 9,810 Korea 16,875 Congo 11,355 Iran 10,037
Syria 12,045 China 21,910 Philippines 8,750 Vietnam 12,370 Somalia 10,785 PRC 9,718
Nigeria 10,920 UK 11,205 India 7,380 Iran 7,040 Afghanistan 9,550 Pakistan 9,406
USA 10,905 Australia 8,850 Korea 1,960 Japan 6,685 India 9,035 Nigeria 4,398
Pakistan 9,490 Ireland 8,675 USA 1,850 Bangladesh 4,155 Pakistan 8,360 USA 4,229
France 6,175 Korea 8,105 UK 940 Philippines 4,075 Korea of 7,775 Egypt 4,115
Eritrea 5,695 Brazil 8,080 China 935 Taiwan 3,160 Mexico 7,640 Iraq 3,951
UK 5,660 Japan 7,250 France 915
Saudi
Arabia
2,870 Philippines 6,995 France 3,836
63
Data Sources
• PRs: Canada - Admissions of Permanent Residents by Province/Territory of Intended Destination and Immigration Category, Canada - Admissions of
Permanent Residents by Country of Citizenship, COVID Immigration Impact - PR Applications Source Countries
• TR to Permanent Resident transition: Canada – Admissions of Permanent Residents with Prior Post-graduate Work Permit Holder Status by Province/Territory of Intended Destination and Immigration
Category, Canada – Admissions of Permanent Residents with Prior International Mobility Program Work Permit Holder Status by Province/Territory of Intended Destination and Immigration Category,
Canada – Admissions of Permanent Residents with Prior Study Permit Holder Status by Province/Territory of Intended Destination and Immigration Category, Canada – Admissions of Permanent
Residents with Prior Temporary Foreign Worker Program Work Permit Holder Status by Province/Territory of Intended Destination and Immigration Category
• Asylum Claimants: Canada - Asylum Claimants by Claim O
ffi
ce Type, Province/Territory* of Claim and Claim Year, Canada - Asylum Claimants by Top Twenty-Five Countries of Citizenship (2019 ranking),
Claim O
ffi
ce Type and Claim Year
• TRs: Canada - International Mobility Program (IMP) work permit holders by province/territory of intended destination, program and year in which permit(s)
became e
ff
ective, Canada - Temporary Foreign Worker Program (TFWP) work permit holders by province/territory of intended destination, program and year
in which permit(s) became e
ff
ective, Canada – International Mobility Program work permit holders by country of citizenship and year in which permit(s)
became e
ff
ective, Canada – Temporary Foreign Worker Program work permit holders by country of citizenship and year in which permit(s) became e
ff
ective
• Study Permits: Canada - Study permit holders by country of citizenship and year in which permit(s) became e
ff
ective, Canada - Study permit holders by
province/territory of intended destination, study level and year in which permit(s) became e
ff
ective, Source Countries - Applications Processed by IRCC for
New Study Permit Applications
• Settlement Services: Special request IRCC data table
• Citizenship: Source Countries (Country of Birth) - New Canadian Citizens (in Persons) by Month
• Web: Provided by IRCC
• 2018 is used as baseline
64

More Related Content

Similar to Covid-19 Immigration Effects - Key Slides - September 2023.pdf

Covid-19 Immigration Effects - Key Slides - July 2023 .pdf
Covid-19 Immigration Effects - Key Slides - July 2023 .pdfCovid-19 Immigration Effects - Key Slides - July 2023 .pdf
Covid-19 Immigration Effects - Key Slides - July 2023 .pdfAndrew Griffith
 
Covid-19 Immigration Effects - Key Slides - November 2022 .pdf
Covid-19 Immigration Effects - Key Slides - November 2022 .pdfCovid-19 Immigration Effects - Key Slides - November 2022 .pdf
Covid-19 Immigration Effects - Key Slides - November 2022 .pdfAndrew Griffith
 
Covid 19 Immigration Effects - Key Slides - July 2021
Covid 19 Immigration Effects - Key Slides - July 2021Covid 19 Immigration Effects - Key Slides - July 2021
Covid 19 Immigration Effects - Key Slides - July 2021Andrew Griffith
 
Covid 19 Immigration Effects - Key Slides - August 2021 update
Covid 19 Immigration Effects - Key Slides - August 2021 updateCovid 19 Immigration Effects - Key Slides - August 2021 update
Covid 19 Immigration Effects - Key Slides - August 2021 updateAndrew Griffith
 
Covid-19 Immigration Effects - Key Slides - June 2023 .pdf
Covid-19 Immigration Effects - Key Slides - June 2023 .pdfCovid-19 Immigration Effects - Key Slides - June 2023 .pdf
Covid-19 Immigration Effects - Key Slides - June 2023 .pdfAndrew Griffith
 
Canadian Immigration Tracker - Key Slides - December 2023
Canadian Immigration Tracker - Key Slides - December 2023Canadian Immigration Tracker - Key Slides - December 2023
Canadian Immigration Tracker - Key Slides - December 2023Andrew Griffith
 
Covid-19 Immigration Effects - Key Slides - March 2023
Covid-19 Immigration Effects - Key Slides - March 2023Covid-19 Immigration Effects - Key Slides - March 2023
Covid-19 Immigration Effects - Key Slides - March 2023Andrew Griffith
 
Canadian Immigration Tracker - January 2024.pdf
Canadian Immigration Tracker - January 2024.pdfCanadian Immigration Tracker - January 2024.pdf
Canadian Immigration Tracker - January 2024.pdfAndrew Griffith
 
Canadian Immigration Tracker - Key Slides - April 2023.pdf
Canadian Immigration Tracker - Key Slides - April 2023.pdfCanadian Immigration Tracker - Key Slides - April 2023.pdf
Canadian Immigration Tracker - Key Slides - April 2023.pdfAndrew Griffith
 
Covid 19 Immigration Effects - November 2021
Covid 19 Immigration Effects - November 2021 Covid 19 Immigration Effects - November 2021
Covid 19 Immigration Effects - November 2021 Andrew Griffith
 
Covid-19 Immigration Effects - Key Slides - June 2022
Covid-19 Immigration  Effects - Key Slides - June 2022Covid-19 Immigration  Effects - Key Slides - June 2022
Covid-19 Immigration Effects - Key Slides - June 2022Andrew Griffith
 
Covid 19 Immigration Effects - December 2021 Update with 2018 baseline compar...
Covid 19 Immigration Effects - December 2021 Update with 2018 baseline compar...Covid 19 Immigration Effects - December 2021 Update with 2018 baseline compar...
Covid 19 Immigration Effects - December 2021 Update with 2018 baseline compar...Andrew Griffith
 
Covid-19 Immigration Effects - Key Slides - July 2022
Covid-19 Immigration Effects - Key Slides - July 2022Covid-19 Immigration Effects - Key Slides - July 2022
Covid-19 Immigration Effects - Key Slides - July 2022Andrew Griffith
 
Covid 19 Immigration Effects - Key Slides - June 2021
Covid 19 Immigration Effects - Key Slides - June 2021Covid 19 Immigration Effects - Key Slides - June 2021
Covid 19 Immigration Effects - Key Slides - June 2021Andrew Griffith
 
Covid-19 Immigration Effects - Key Slides - February 2023.pdf
Covid-19 Immigration Effects - Key Slides - February 2023.pdfCovid-19 Immigration Effects - Key Slides - February 2023.pdf
Covid-19 Immigration Effects - Key Slides - February 2023.pdfAndrew Griffith
 
Covid-19 Immigration Effects - Key Slides - May 2022
Covid-19 Immigration Effects - Key Slides - May 2022Covid-19 Immigration Effects - Key Slides - May 2022
Covid-19 Immigration Effects - Key Slides - May 2022Andrew Griffith
 
Covid-19 Immigration Effects - Key Slides - January 2023.pdf
Covid-19 Immigration Effects - Key Slides - January 2023.pdfCovid-19 Immigration Effects - Key Slides - January 2023.pdf
Covid-19 Immigration Effects - Key Slides - January 2023.pdfAndrew Griffith
 
Covid-19 Immigration Effects - Key Slides - February 2022.pdf
Covid-19 Immigration Effects - Key Slides - February 2022.pdfCovid-19 Immigration Effects - Key Slides - February 2022.pdf
Covid-19 Immigration Effects - Key Slides - February 2022.pdfAndrew Griffith
 
Canadian Immigration Tracker - Key Slides - February 2024.pdf
Canadian Immigration Tracker - Key Slides - February 2024.pdfCanadian Immigration Tracker - Key Slides - February 2024.pdf
Canadian Immigration Tracker - Key Slides - February 2024.pdfAndrew Griffith
 
Covid-19 Immigration Effects - January 2022
Covid-19 Immigration Effects - January 2022Covid-19 Immigration Effects - January 2022
Covid-19 Immigration Effects - January 2022Andrew Griffith
 

Similar to Covid-19 Immigration Effects - Key Slides - September 2023.pdf (20)

Covid-19 Immigration Effects - Key Slides - July 2023 .pdf
Covid-19 Immigration Effects - Key Slides - July 2023 .pdfCovid-19 Immigration Effects - Key Slides - July 2023 .pdf
Covid-19 Immigration Effects - Key Slides - July 2023 .pdf
 
Covid-19 Immigration Effects - Key Slides - November 2022 .pdf
Covid-19 Immigration Effects - Key Slides - November 2022 .pdfCovid-19 Immigration Effects - Key Slides - November 2022 .pdf
Covid-19 Immigration Effects - Key Slides - November 2022 .pdf
 
Covid 19 Immigration Effects - Key Slides - July 2021
Covid 19 Immigration Effects - Key Slides - July 2021Covid 19 Immigration Effects - Key Slides - July 2021
Covid 19 Immigration Effects - Key Slides - July 2021
 
Covid 19 Immigration Effects - Key Slides - August 2021 update
Covid 19 Immigration Effects - Key Slides - August 2021 updateCovid 19 Immigration Effects - Key Slides - August 2021 update
Covid 19 Immigration Effects - Key Slides - August 2021 update
 
Covid-19 Immigration Effects - Key Slides - June 2023 .pdf
Covid-19 Immigration Effects - Key Slides - June 2023 .pdfCovid-19 Immigration Effects - Key Slides - June 2023 .pdf
Covid-19 Immigration Effects - Key Slides - June 2023 .pdf
 
Canadian Immigration Tracker - Key Slides - December 2023
Canadian Immigration Tracker - Key Slides - December 2023Canadian Immigration Tracker - Key Slides - December 2023
Canadian Immigration Tracker - Key Slides - December 2023
 
Covid-19 Immigration Effects - Key Slides - March 2023
Covid-19 Immigration Effects - Key Slides - March 2023Covid-19 Immigration Effects - Key Slides - March 2023
Covid-19 Immigration Effects - Key Slides - March 2023
 
Canadian Immigration Tracker - January 2024.pdf
Canadian Immigration Tracker - January 2024.pdfCanadian Immigration Tracker - January 2024.pdf
Canadian Immigration Tracker - January 2024.pdf
 
Canadian Immigration Tracker - Key Slides - April 2023.pdf
Canadian Immigration Tracker - Key Slides - April 2023.pdfCanadian Immigration Tracker - Key Slides - April 2023.pdf
Canadian Immigration Tracker - Key Slides - April 2023.pdf
 
Covid 19 Immigration Effects - November 2021
Covid 19 Immigration Effects - November 2021 Covid 19 Immigration Effects - November 2021
Covid 19 Immigration Effects - November 2021
 
Covid-19 Immigration Effects - Key Slides - June 2022
Covid-19 Immigration  Effects - Key Slides - June 2022Covid-19 Immigration  Effects - Key Slides - June 2022
Covid-19 Immigration Effects - Key Slides - June 2022
 
Covid 19 Immigration Effects - December 2021 Update with 2018 baseline compar...
Covid 19 Immigration Effects - December 2021 Update with 2018 baseline compar...Covid 19 Immigration Effects - December 2021 Update with 2018 baseline compar...
Covid 19 Immigration Effects - December 2021 Update with 2018 baseline compar...
 
Covid-19 Immigration Effects - Key Slides - July 2022
Covid-19 Immigration Effects - Key Slides - July 2022Covid-19 Immigration Effects - Key Slides - July 2022
Covid-19 Immigration Effects - Key Slides - July 2022
 
Covid 19 Immigration Effects - Key Slides - June 2021
Covid 19 Immigration Effects - Key Slides - June 2021Covid 19 Immigration Effects - Key Slides - June 2021
Covid 19 Immigration Effects - Key Slides - June 2021
 
Covid-19 Immigration Effects - Key Slides - February 2023.pdf
Covid-19 Immigration Effects - Key Slides - February 2023.pdfCovid-19 Immigration Effects - Key Slides - February 2023.pdf
Covid-19 Immigration Effects - Key Slides - February 2023.pdf
 
Covid-19 Immigration Effects - Key Slides - May 2022
Covid-19 Immigration Effects - Key Slides - May 2022Covid-19 Immigration Effects - Key Slides - May 2022
Covid-19 Immigration Effects - Key Slides - May 2022
 
Covid-19 Immigration Effects - Key Slides - January 2023.pdf
Covid-19 Immigration Effects - Key Slides - January 2023.pdfCovid-19 Immigration Effects - Key Slides - January 2023.pdf
Covid-19 Immigration Effects - Key Slides - January 2023.pdf
 
Covid-19 Immigration Effects - Key Slides - February 2022.pdf
Covid-19 Immigration Effects - Key Slides - February 2022.pdfCovid-19 Immigration Effects - Key Slides - February 2022.pdf
Covid-19 Immigration Effects - Key Slides - February 2022.pdf
 
Canadian Immigration Tracker - Key Slides - February 2024.pdf
Canadian Immigration Tracker - Key Slides - February 2024.pdfCanadian Immigration Tracker - Key Slides - February 2024.pdf
Canadian Immigration Tracker - Key Slides - February 2024.pdf
 
Covid-19 Immigration Effects - January 2022
Covid-19 Immigration Effects - January 2022Covid-19 Immigration Effects - January 2022
Covid-19 Immigration Effects - January 2022
 

More from Andrew Griffith

Integration - General Deck 2022 data
Integration - General Deck 2022 dataIntegration - General Deck 2022 data
Integration - General Deck 2022 dataAndrew Griffith
 
Covid-19 Immigration Effects - Key Slides - December 2022 and full-year comp...
Covid-19 Immigration Effects - Key Slides - December  2022 and full-year comp...Covid-19 Immigration Effects - Key Slides - December  2022 and full-year comp...
Covid-19 Immigration Effects - Key Slides - December 2022 and full-year comp...Andrew Griffith
 
Order of Canada 2013-22 Diversity
Order of Canada 2013-22 DiversityOrder of Canada 2013-22 Diversity
Order of Canada 2013-22 DiversityAndrew Griffith
 
Covid-19 Immigration Effects - Key Slides - April 2022.pdf
Covid-19 Immigration Effects - Key Slides - April 2022.pdfCovid-19 Immigration Effects - Key Slides - April 2022.pdf
Covid-19 Immigration Effects - Key Slides - April 2022.pdfAndrew Griffith
 
Covid-19 Immigration Effects - Key Slides - March 2022
Covid-19 Immigration Effects - Key Slides - March 2022Covid-19 Immigration Effects - Key Slides - March 2022
Covid-19 Immigration Effects - Key Slides - March 2022Andrew Griffith
 
Order of Canada Appointments 2013-21 - How Diverse Are They?
Order of Canada Appointments 2013-21 - How Diverse Are They?  Order of Canada Appointments 2013-21 - How Diverse Are They?
Order of Canada Appointments 2013-21 - How Diverse Are They? Andrew Griffith
 

More from Andrew Griffith (6)

Integration - General Deck 2022 data
Integration - General Deck 2022 dataIntegration - General Deck 2022 data
Integration - General Deck 2022 data
 
Covid-19 Immigration Effects - Key Slides - December 2022 and full-year comp...
Covid-19 Immigration Effects - Key Slides - December  2022 and full-year comp...Covid-19 Immigration Effects - Key Slides - December  2022 and full-year comp...
Covid-19 Immigration Effects - Key Slides - December 2022 and full-year comp...
 
Order of Canada 2013-22 Diversity
Order of Canada 2013-22 DiversityOrder of Canada 2013-22 Diversity
Order of Canada 2013-22 Diversity
 
Covid-19 Immigration Effects - Key Slides - April 2022.pdf
Covid-19 Immigration Effects - Key Slides - April 2022.pdfCovid-19 Immigration Effects - Key Slides - April 2022.pdf
Covid-19 Immigration Effects - Key Slides - April 2022.pdf
 
Covid-19 Immigration Effects - Key Slides - March 2022
Covid-19 Immigration Effects - Key Slides - March 2022Covid-19 Immigration Effects - Key Slides - March 2022
Covid-19 Immigration Effects - Key Slides - March 2022
 
Order of Canada Appointments 2013-21 - How Diverse Are They?
Order of Canada Appointments 2013-21 - How Diverse Are They?  Order of Canada Appointments 2013-21 - How Diverse Are They?
Order of Canada Appointments 2013-21 - How Diverse Are They?
 

Recently uploaded

Cunningham Road Call Girls Bangalore WhatsApp 8250192130 High Profile Service
Cunningham Road Call Girls Bangalore WhatsApp 8250192130 High Profile ServiceCunningham Road Call Girls Bangalore WhatsApp 8250192130 High Profile Service
Cunningham Road Call Girls Bangalore WhatsApp 8250192130 High Profile ServiceHigh Profile Call Girls
 
“Exploring the world: One page turn at a time.” World Book and Copyright Day ...
“Exploring the world: One page turn at a time.” World Book and Copyright Day ...“Exploring the world: One page turn at a time.” World Book and Copyright Day ...
“Exploring the world: One page turn at a time.” World Book and Copyright Day ...Christina Parmionova
 
Club of Rome: Eco-nomics for an Ecological Civilization
Club of Rome: Eco-nomics for an Ecological CivilizationClub of Rome: Eco-nomics for an Ecological Civilization
Club of Rome: Eco-nomics for an Ecological CivilizationEnergy for One World
 
Call Girls Bangalore Saanvi 7001305949 Independent Escort Service Bangalore
Call Girls Bangalore Saanvi 7001305949 Independent Escort Service BangaloreCall Girls Bangalore Saanvi 7001305949 Independent Escort Service Bangalore
Call Girls Bangalore Saanvi 7001305949 Independent Escort Service Bangalorenarwatsonia7
 
2024: The FAR, Federal Acquisition Regulations - Part 27
2024: The FAR, Federal Acquisition Regulations - Part 272024: The FAR, Federal Acquisition Regulations - Part 27
2024: The FAR, Federal Acquisition Regulations - Part 27JSchaus & Associates
 
history of 1935 philippine constitution.pptx
history of 1935 philippine constitution.pptxhistory of 1935 philippine constitution.pptx
history of 1935 philippine constitution.pptxhellokittymaearciaga
 
Jewish Efforts to Influence American Immigration Policy in the Years Before t...
Jewish Efforts to Influence American Immigration Policy in the Years Before t...Jewish Efforts to Influence American Immigration Policy in the Years Before t...
Jewish Efforts to Influence American Immigration Policy in the Years Before t...yalehistoricalreview
 
(多少钱)Dal毕业证国外本科学位证
(多少钱)Dal毕业证国外本科学位证(多少钱)Dal毕业证国外本科学位证
(多少钱)Dal毕业证国外本科学位证mbetknu
 
Panet vs.Plastics - Earth Day 2024 - 22 APRIL
Panet vs.Plastics - Earth Day 2024 - 22 APRILPanet vs.Plastics - Earth Day 2024 - 22 APRIL
Panet vs.Plastics - Earth Day 2024 - 22 APRILChristina Parmionova
 
EDUROOT SME_ Performance upto March-2024.pptx
EDUROOT SME_ Performance upto March-2024.pptxEDUROOT SME_ Performance upto March-2024.pptx
EDUROOT SME_ Performance upto March-2024.pptxaaryamanorathofficia
 
##9711199012 Call Girls Delhi Rs-5000 UpTo 10 K Hauz Khas Whats Up Number
##9711199012 Call Girls Delhi Rs-5000 UpTo 10 K Hauz Khas  Whats Up Number##9711199012 Call Girls Delhi Rs-5000 UpTo 10 K Hauz Khas  Whats Up Number
##9711199012 Call Girls Delhi Rs-5000 UpTo 10 K Hauz Khas Whats Up NumberMs Riya
 
(SUHANI) Call Girls Pimple Saudagar ( 7001035870 ) HI-Fi Pune Escorts Service
(SUHANI) Call Girls Pimple Saudagar ( 7001035870 ) HI-Fi Pune Escorts Service(SUHANI) Call Girls Pimple Saudagar ( 7001035870 ) HI-Fi Pune Escorts Service
(SUHANI) Call Girls Pimple Saudagar ( 7001035870 ) HI-Fi Pune Escorts Serviceranjana rawat
 
Take action for a healthier planet and brighter future.
Take action for a healthier planet and brighter future.Take action for a healthier planet and brighter future.
Take action for a healthier planet and brighter future.Christina Parmionova
 
Earth Day 2024 - AMC "COMMON GROUND'' movie night.
Earth Day 2024 - AMC "COMMON GROUND'' movie night.Earth Day 2024 - AMC "COMMON GROUND'' movie night.
Earth Day 2024 - AMC "COMMON GROUND'' movie night.Christina Parmionova
 
WORLD CREATIVITY AND INNOVATION DAY 2024.
WORLD CREATIVITY AND INNOVATION DAY 2024.WORLD CREATIVITY AND INNOVATION DAY 2024.
WORLD CREATIVITY AND INNOVATION DAY 2024.Christina Parmionova
 
Call Girls Connaught Place Delhi reach out to us at ☎ 9711199012
Call Girls Connaught Place Delhi reach out to us at ☎ 9711199012Call Girls Connaught Place Delhi reach out to us at ☎ 9711199012
Call Girls Connaught Place Delhi reach out to us at ☎ 9711199012rehmti665
 
Call Girl Benson Town - Phone No 7001305949 For Ultimate Sexual Urges
Call Girl Benson Town - Phone No 7001305949 For Ultimate Sexual UrgesCall Girl Benson Town - Phone No 7001305949 For Ultimate Sexual Urges
Call Girl Benson Town - Phone No 7001305949 For Ultimate Sexual Urgesnarwatsonia7
 
Powering Britain: Can we decarbonise electricity without disadvantaging poore...
Powering Britain: Can we decarbonise electricity without disadvantaging poore...Powering Britain: Can we decarbonise electricity without disadvantaging poore...
Powering Britain: Can we decarbonise electricity without disadvantaging poore...ResolutionFoundation
 
Russian Call Girl Hebbagodi ! 7001305949 ₹2999 Only and Free Hotel Delivery 2...
Russian Call Girl Hebbagodi ! 7001305949 ₹2999 Only and Free Hotel Delivery 2...Russian Call Girl Hebbagodi ! 7001305949 ₹2999 Only and Free Hotel Delivery 2...
Russian Call Girl Hebbagodi ! 7001305949 ₹2999 Only and Free Hotel Delivery 2...narwatsonia7
 

Recently uploaded (20)

Cunningham Road Call Girls Bangalore WhatsApp 8250192130 High Profile Service
Cunningham Road Call Girls Bangalore WhatsApp 8250192130 High Profile ServiceCunningham Road Call Girls Bangalore WhatsApp 8250192130 High Profile Service
Cunningham Road Call Girls Bangalore WhatsApp 8250192130 High Profile Service
 
“Exploring the world: One page turn at a time.” World Book and Copyright Day ...
“Exploring the world: One page turn at a time.” World Book and Copyright Day ...“Exploring the world: One page turn at a time.” World Book and Copyright Day ...
“Exploring the world: One page turn at a time.” World Book and Copyright Day ...
 
Club of Rome: Eco-nomics for an Ecological Civilization
Club of Rome: Eco-nomics for an Ecological CivilizationClub of Rome: Eco-nomics for an Ecological Civilization
Club of Rome: Eco-nomics for an Ecological Civilization
 
Call Girls Bangalore Saanvi 7001305949 Independent Escort Service Bangalore
Call Girls Bangalore Saanvi 7001305949 Independent Escort Service BangaloreCall Girls Bangalore Saanvi 7001305949 Independent Escort Service Bangalore
Call Girls Bangalore Saanvi 7001305949 Independent Escort Service Bangalore
 
Call Girls In Rohini ꧁❤ 🔝 9953056974🔝❤꧂ Escort ServiCe
Call Girls In  Rohini ꧁❤ 🔝 9953056974🔝❤꧂ Escort ServiCeCall Girls In  Rohini ꧁❤ 🔝 9953056974🔝❤꧂ Escort ServiCe
Call Girls In Rohini ꧁❤ 🔝 9953056974🔝❤꧂ Escort ServiCe
 
2024: The FAR, Federal Acquisition Regulations - Part 27
2024: The FAR, Federal Acquisition Regulations - Part 272024: The FAR, Federal Acquisition Regulations - Part 27
2024: The FAR, Federal Acquisition Regulations - Part 27
 
history of 1935 philippine constitution.pptx
history of 1935 philippine constitution.pptxhistory of 1935 philippine constitution.pptx
history of 1935 philippine constitution.pptx
 
Jewish Efforts to Influence American Immigration Policy in the Years Before t...
Jewish Efforts to Influence American Immigration Policy in the Years Before t...Jewish Efforts to Influence American Immigration Policy in the Years Before t...
Jewish Efforts to Influence American Immigration Policy in the Years Before t...
 
(多少钱)Dal毕业证国外本科学位证
(多少钱)Dal毕业证国外本科学位证(多少钱)Dal毕业证国外本科学位证
(多少钱)Dal毕业证国外本科学位证
 
Panet vs.Plastics - Earth Day 2024 - 22 APRIL
Panet vs.Plastics - Earth Day 2024 - 22 APRILPanet vs.Plastics - Earth Day 2024 - 22 APRIL
Panet vs.Plastics - Earth Day 2024 - 22 APRIL
 
EDUROOT SME_ Performance upto March-2024.pptx
EDUROOT SME_ Performance upto March-2024.pptxEDUROOT SME_ Performance upto March-2024.pptx
EDUROOT SME_ Performance upto March-2024.pptx
 
##9711199012 Call Girls Delhi Rs-5000 UpTo 10 K Hauz Khas Whats Up Number
##9711199012 Call Girls Delhi Rs-5000 UpTo 10 K Hauz Khas  Whats Up Number##9711199012 Call Girls Delhi Rs-5000 UpTo 10 K Hauz Khas  Whats Up Number
##9711199012 Call Girls Delhi Rs-5000 UpTo 10 K Hauz Khas Whats Up Number
 
(SUHANI) Call Girls Pimple Saudagar ( 7001035870 ) HI-Fi Pune Escorts Service
(SUHANI) Call Girls Pimple Saudagar ( 7001035870 ) HI-Fi Pune Escorts Service(SUHANI) Call Girls Pimple Saudagar ( 7001035870 ) HI-Fi Pune Escorts Service
(SUHANI) Call Girls Pimple Saudagar ( 7001035870 ) HI-Fi Pune Escorts Service
 
Take action for a healthier planet and brighter future.
Take action for a healthier planet and brighter future.Take action for a healthier planet and brighter future.
Take action for a healthier planet and brighter future.
 
Earth Day 2024 - AMC "COMMON GROUND'' movie night.
Earth Day 2024 - AMC "COMMON GROUND'' movie night.Earth Day 2024 - AMC "COMMON GROUND'' movie night.
Earth Day 2024 - AMC "COMMON GROUND'' movie night.
 
WORLD CREATIVITY AND INNOVATION DAY 2024.
WORLD CREATIVITY AND INNOVATION DAY 2024.WORLD CREATIVITY AND INNOVATION DAY 2024.
WORLD CREATIVITY AND INNOVATION DAY 2024.
 
Call Girls Connaught Place Delhi reach out to us at ☎ 9711199012
Call Girls Connaught Place Delhi reach out to us at ☎ 9711199012Call Girls Connaught Place Delhi reach out to us at ☎ 9711199012
Call Girls Connaught Place Delhi reach out to us at ☎ 9711199012
 
Call Girl Benson Town - Phone No 7001305949 For Ultimate Sexual Urges
Call Girl Benson Town - Phone No 7001305949 For Ultimate Sexual UrgesCall Girl Benson Town - Phone No 7001305949 For Ultimate Sexual Urges
Call Girl Benson Town - Phone No 7001305949 For Ultimate Sexual Urges
 
Powering Britain: Can we decarbonise electricity without disadvantaging poore...
Powering Britain: Can we decarbonise electricity without disadvantaging poore...Powering Britain: Can we decarbonise electricity without disadvantaging poore...
Powering Britain: Can we decarbonise electricity without disadvantaging poore...
 
Russian Call Girl Hebbagodi ! 7001305949 ₹2999 Only and Free Hotel Delivery 2...
Russian Call Girl Hebbagodi ! 7001305949 ₹2999 Only and Free Hotel Delivery 2...Russian Call Girl Hebbagodi ! 7001305949 ₹2999 Only and Free Hotel Delivery 2...
Russian Call Girl Hebbagodi ! 7001305949 ₹2999 Only and Free Hotel Delivery 2...
 

Covid-19 Immigration Effects - Key Slides - September 2023.pdf

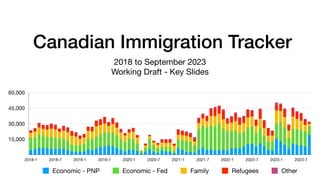
  • 1. Canadian Immigration Tracker 2018 to September 2023 Working Draft - Key Slides 15,000 30,000 45,000 60,000 2018-1 2018-7 2019-1 2019-7 2020-1 2020-7 2021-1 2021-7 2022-1 2022-7 2023-1 2023-7 Economic - PNP Economic - Fed Family Refugees Other
  • 2. Programs Examined • Permanent Residents/Immigrants (PRs): Economic (PNP and Federal), Family and Refugees • TR to Permanent Resident transition • Asylum Claimants • Temporary Residents/International Mobility Program (IMP): International Agreements (e.g., NAFTA, GATS), Canadian Interests (e.g., intra-corporate transfers, work exchange programs, post-graduate employment, spouses) • Temporary Residents/Temporary Foreign Worker Program (TFWP): caregivers, agriculture workers, other workers with Labour Market Impact Assessment (LMIA) • Study Permits (international students) • Settlement Services • Citizenship • Visitor Visas 2
  • 3. August 2023 Highlights • PRs: Admissions Decline from 34,920 in August to 32,065 in September. September year-over-year change (change from 2021 in parentheses): Economic - PNP -53.4% (-1.0%), Economic - Federal -14.1% (-45.5%), Family -21.3% (-23.7%), Refugees -29.4% (-0.9%) • Applications: Given time delays in entering application data, am using a six month time lag. From 29,481 in February (time delays greater) to 41,485 in March. March year-over-year change (change from 2020): 55.7% (-29.1%). • Express Entry and Arrima Invitations to Apply: Decrease from 10,751 in September (1,384 Arrima) to 8,845 (1,220 Arrima) in October. October year-over-year change (change from 2020): -1.7% (455.9%) • Web “Immigrate to Canada”: Decrease from 332,817 in September (outside Canada) to 304,732 in October. October year-over-year change (change from 2021): -24.7% (-30.5%) • TR to PRs transition (i.e., those already in Canada): Sharp decrease from 23,315 in August (some double counting) to 10,325 in September (32 percent of all PRs). September year-over-year change (change from 2020): -22.2% (-69.8%) • Temporary Residents: • TRs/IMP: Sharp decrease from 125,460 in August to 74,930 in September. September year-over-year (change from 2021: Agreements: -43.8% (-21.2%), Canadian Interests: 8.8% (52.6%), Other IMP Participants 152.8% (1,130.5%), Not stated 19.5% (350.4%) • TRs/TFWP: Increase from 12,615 in August to 14,700 in September. September year-over-year change (change from 2021): Caregivers 32.8% (165.6%), Agriculture -0.1% (96.3%) and Other LMIA 28.1% (274.2%). • Web “Get a work permit”: Increase from 104,970 in September (outside Canada) to 131,019 in October. October year-over-year change (change from 2021): 19.3% (35.8%) • Students: Seasonal decrease from 178,070 in August to 69,470 in September. September year-over-year change (change from 2021): 6.5% (-2.8%) • Applications: Decrease from 80,897 in August to 60,294 in September. September year-over-year change (change from 2021): -21.5% (20.9%) • Web “Get a study permit”: Stable from 51,110 in September (outside Canada) to 50,493 in October. October year-over-year change (change from 2021): -21.9% (-36.3%) • Asylum Claimants: Increase from 12,620 in August to 15,340 in September. September year-over-year change (change from 2021): 81.3% (559.8%) • Irregular arrivals (Roxham Road etc): Remain low level, from 84 in August. to 70 in September. September year-over-year change (change from 2021): -98.1% (-58.6%). • Settlement Services: Decrease from 251,625 in November to 211,560 in December (most recent data). December year-over-year (change from 2020): 37.0% (47.9%) • Web “Find immigrant services near you”: Decrease from 6,476 in September (outside Canada) to 4,688 in October. October year-over-year change (change from 2021): -0.2% (-49.5%). In Canada: -11.4% (-53.7%) • Citizenship: Increase from 34,700 in August to 37,822 in September (monthly average year to date 31,164). September year-over-year change (change from 2021): 22.4% (171.2%) • Applications: From 232,974 in 2021 to 264,231 in 2022. Year-over-year change (change from 2018): 13.4% (33.8%) • “Apply for citizenship”: Decrease from15,794 in September (outside Canada) to 14,503 in October. October year-over-year change (change from 2021): -22.4% (-35.7%). In Canada: -30.3% (-37.1%) • Visitor Visas: Stable 142,238 in August to 145,323 in September. September year-over-year change (change from 2021): 73.5% (230.8%). 3
  • 4. Change Across Major Programs 2022 full year Compared to full year 2018 Baseline 4 PR Applications PR Admissions-PNP PR Admissions-Fed TR2PR Temporary Workers IMP Temporary Workers TFWP Asylum Claimants Study Permit Applications Study Permit Holders Citizenship Applications New Citizens Settlement Services Visitor Visas -75% -21.25% 32.5% 86.25% 140% -7.4% -16.9% 109.2% 1.7% 56.1% 101.7% 66.3% 65.1% 126.7% 93.2% 34.9% 40.2% -35.8%
  • 6. Express Entry & Arrima Invitations—2018-23 7,500 15,000 22,500 30,000 2018-1 2018-7 2019-1 2019-7 2020-1 2020-7 2021-1 2021-7 2022-1 2022-7 2023-1 2023-7 CEC PNP No Program Federal Skilled Trades Healthcare STEM Trades Transport Agriculture French QC Arrima 6
  • 7. PR Applications: Region of Citizenship —2018-23 35,000 70,000 105,000 140,000 2018-1 2018-7 2019-1 2019-7 2020-1 2020-7 2021-1 2021-7 2022-1 2022-7 2023-1 Asia Africa Americas Europe Oceania 7 Note: Given delays in entering applications in processing systems, a six month time lag is used. May 2021 surge driven by applications from India
  • 8. Admissions: PRs by Categories—2018-23 15,000 30,000 45,000 60,000 2018-1 2018-7 2019-1 2019-7 2020-1 2020-7 2021-1 2021-7 2022-1 2022-7 2023-1 2023-7 Economic - PNP Economic - Fed Family Refugees Other 8
  • 9. Admissions: PRs Region of Citizenship—2018-23 25% 50% 75% 100% 2018-1 2018-7 2019-1 2019-7 2020-1 2020-7 2021-1 2021-7 2022-1 2022-7 2023-1 2023-7 Asia Africa Americas Europe Oceania 9
  • 10. Admissions: PRs Canada Total September Comparison: 2023/22, 2023/21, Full year 2022/18 -60% -45% -30% -15% 0% 15% 30% 45% 60% Economic - PNP Economic - Fed Family Refugees 54.6% 5.9% 28.4% 33.2% -0.9% -23.7% -45.5% -1% -29.4% -21.3% -14.1% -53.4% September 2023/22 September 2023/21 Full year 2022/18 10
  • 11. Admissions: PNP Provinces September Comparison: 2023/22, 2023/21, Full year 2022/18 -90% -60% -30% 0% 30% 60% 90% 120% Atlantic ON MB SK AB BC 35.8% 17.3% 39.2% 41.9% 33.5% 102.6% -61.9% -28.7% -30% -6.4% -23.5% -37.3% -65.7% -62.6% -30.8% -62.9% -55% -49.2% September 2023/22 September 2023/21 Full year 2022/18 11
  • 12. Admissions: Permanent Residents by Citizenship September Comparison: 2023/22, 2023/21, Full year 2022/18 Top 10 Countries — Ordered by 2018 base year -100% -40% 20% 80% 140% India Philippines China Syria Nigeria USA Pakistan France Eritrea UK -21.3% 33.7% 128.9% 21.1% -5.1% 101.3% -29.9% 6.5% -37.3% 67.8% -65.6% 58.8% -16.7% -18.4% -63.8% -24% 53.4% -36.3% -8.6% -53.7% -39.7% -17.2% -8.2% -27.5% -53.3% -59.1% -3.8% -34.8% -12.4% -34.2% September 2023/22 September 2023/21 Full year 2022/18 12
  • 13. Admissions: Temporary to Permanent Residents By Program—2018-23 10,000 20,000 30,000 40,000 2018-1 2018-7 2019-1 2019-7 2020-1 2020-7 2021-1 2021-7 2022-1 2022-7 2023-1 2023-7 IMP Post-Graduate WP Students TFWP 13
  • 14. Admissions by Province: TRs to PRs September Comparison: 2023/22, 2023/21, Full year 2022/18 -150% -75% 0% 75% 150% 225% 300% Atlantic QC ON MB SK AB BC 76% 12.7% 3.7% 199.2% 99.7% 136.2% 205.5% -83.3% -73.4% -66.7% -73.1% -74.9% 34.9% -73.7% -49.8% -57.8% -54.8% -63.5% 5.1% 19.2% -55.7% September 2023/22 September 2023/21 Full year 2022/18 14
  • 15. Admissions: TRs to PRs September Comparison: 2023/22, 2023/21, Full year 2022/18 -90% -60% -30% 0% 30% 60% 90% 120% IMP Post-Graduate WP Students TFWP 62.7% 79.7% 114.8% 88.6% -56.4% -48.7% -78.5% -68.3% 0% -31.1% -32% -16.9% September 2023/22 September 2023/21 Full year 2022/18 15
  • 16. Two-Step Immigration TR2PR Percent Total Admission 0 15,000 30,000 45,000 60,000 22.5% 45% 67.5% 90% 2018-1 2018-7 2019-1 2019-7 2020-1 2020-7 2021-1 2021-7 2022-1 2022-7 2023-1 2023-7 Percent TR2PR Total Admissions 16
  • 17. Immigrate to Canada—Web Interest 250,000 500,000 750,000 1,000,000 2018-1 2018-7 2019-1 2019-7 2020-1 2020-7 2021-1 2021-7 2022-1 2022-7 2023-1 2023-7 Canada Asia Americas Africa Europe Oceania Not speci fi ed 17
  • 18. Immigrate to Canada—Web Interest October Comparison: 2023/22, 2023/21 Top 10 Countries by “Immigrate to Canada” ordered by site visits, 2018 base year -80% -60% -40% -20% 0% 20% 40% India USA Nigeria UK UAE Pakistan Philippines Mexico Saudi Arabia Brazil -53.9% -25.6% -38.1% -47.2% 39.8% -40.3% 3.9% -2% -22.6% -71.8% -51.7% -19.8% -42.5% -37.1% 15% -35% -10.5% -8.2% -14% -53.9% October 2023-22 October 2023-21 18
  • 20. Asylum Claimants: Of fi ce Type 2018-23 4,000 8,000 12,000 16,000 2018-1 2018-7 2019-1 2019-7 2020-1 2020-7 2021-1 2021-7 2022-1 2022-7 2023-1 2023-7 Airport Border Inland Other 20 Note: The “other claim of fi ce” surge in September-November likely re fl ected delays in classi fi cation, most of these were likely Inland
  • 21. Asylum Claimants: Irregular Arrivals RCMP Interceptions as Percent Total Asylum Claimants—2018-23 0 1,250 2,500 3,750 5,000 15% 30% 45% 60% 2018-1 2018-7 2019-1 2019-7 2020-1 2020-7 2021-1 2021-7 2022-1 2022-7 2023-1 2023-7 Percent Claimants Irregular Arrivals 21
  • 22. Asylum Claimants: Year-over-year September Comparison: 2023/22, 2023/21, Full year 2022/18 -300% 0% 300% 600% 900% 1,200% Airport Border Inland -17% 123.4% 146.4% 766.7% 91.7% 1,149.4% 406.9% -57.6% 166.4% September 2023/22 September 2023/21 Full year 2022/18 22
  • 23. Asylum Claimants: Year-over-year September Comparison: 2023/22, 2023/21, Full year 2022/18 -750% 0% 750% 1,500% 2,250% 3,000% India Mexico Iran Nigeria Colombia Pakistan China Turkey Haiti USA -39.6% 734.3% 366.7% -50% 20.6% 182.7% -80.4% 88.1% 397.6% -10.9% 75% 400% 56.4% 322.2% 652.9% 95.1% 2,812.5% 317.4% 1,135.7% 873.9% 0% -34.2% -50.3% 280% 172.3% -45.9% 529.7% 68.4% 43.8% 234.3% September 2023/22 September 2023/21 Full year 2022/18 23
  • 25. IMP & TFWP Work Permit Holders—2018-23 35,000 70,000 105,000 140,000 2018-1 2018-7 2019-1 2019-7 2020-1 2020-7 2021-1 2021-7 2022-1 2022-7 2023-1 2023-7 Agreements Cdn Interests Other IMP Vulnerable Not Stated Caregivers Agriculture LMIA 25
  • 26. Temporary Residents by Program Canada September Comparison: 2023/22, 2023/21, Full year 2022/18 -75% 0% 75% 150% 225% 300% Agreements Canadian Interests Caregivers Agriculture LMIA 156.7% 28.5% -48.9% 53.1% -9.5% 274.2% 96.3% 165.6% 52.6% -21.2% 28.1% -0.1% 32.8% 8.8% -43.8% September 2023/22 September 2023/21 Full year 2022/18 26
  • 27. IMP by Region of Citizenship—2018-23 0% 25% 50% 75% 100% 2018-1 2018-7 2019-1 2019-7 2020-1 2020-7 2021-1 2021-7 2022-1 2022-7 2023-1 2023-7 Asia Europe Americas Africa Oceania 27
  • 28. IMP by Citizenship September Comparison: 2023/22, 2023/21, Full year 2022/18 Top 10 Countries—Ordered by 2018 base year -75% 0% 75% 150% 225% 300% India USA France China UK Australia Ireland Korea Brazil Japan -19% 0% -8.7% -32.8% -29.2% 1.1% -6.2% 6.4% -31.1% 172.5% 275% -1.1% 47.2% 48.5% 215.4% 67.7% 10.2% 69.2% 8.5% 65.2% 55.6% 5.9% -4.3% -19.7% 1.2% 1.8% 32.3% 13.4% 2.7% -2.7% September 2023/22 September 2023/21 Full year 2022/18 28
  • 29. IMP by Province September Comparison: 2023/22, 2023/21, Full year 2022/18 Top 10 Countries—Ordered by 2018 base year -45% 0% 45% 90% 135% 180% Atlantic QC ON MB SK AB BC 55.1% 46% 39.6% 72.7% 81.2% 49% 100.9% 167.4% 178.3% 75.8% 99.5% 124.3% 77% 55.6% 62.4% 26% -2.8% -11% 30.4% 51% 33.7% September 2023/22 September 2023/21 Full year 2022/18 29
  • 30. TFWP by Region of Citizenship—2018-23 0% 25% 50% 75% 100% 2018-1 2018-7 2019-1 2019-7 2020-1 2020-7 2021-1 2021-7 2022-1 2022-7 2023-1 2023-7 Americas Asia Europe Africa Oceania 30
  • 31. TFWP by Citizenship September Comparison: 2023/22, 2023/21, Full year 2022/18 Top 10 Countries—Ordered by 2018 base year -125% 0% 125% 250% 375% 500% Mexico Jamaica Guatemala Philippines India Korea USA UK China France 134% 71.9% 26.3% -40.4% 12.1% 160.3% 48.2% 93.7% 9.8% 45.3% 76.9% 416.7% 23.1% 87.5% 90.5% 405.9% 352.8% 58.5% 150.8% 115.8% 40.8% 113.8% -5.9% -11.8% 5.3% -12.9% 55.7% -2.8% 10.1% 0.3% September 2023/22 September 2023/21 Full year 2022/18 31
  • 32. TFWP by Province September Comparison: 2023/22, 2023/21, Full year 2022/18 Top 10 Countries—Ordered by 2018 base year -125% 0% 125% 250% 375% 500% Atlantic QC ON MB SK AB BC 58.1% 60.3% 69.8% 63% 31% 120.7% 112.4% 220.7% 468.8% 288.9% 380% 161.3% 167% 131.7% -6.8% 42.2% 59.1% 33.3% 14.9% 39.6% 6.1% September 2023/22 September 2023/21 Full year 2022/18 32
  • 33. Work Permits—Web Interest 75,000 150,000 225,000 300,000 2018-1 2018-7 2019-1 2019-7 2020-1 2020-7 2021-1 2021-7 2022-1 2022-7 2023-1 2023-7 Canada Asia Americas Europe Oceania Africa Not captured 33
  • 34. Work Permits—Web Interest October Comparison: 2023/22, 2023/21 Top 10 Countries by “Get a work permit” ordered by site visits, 2018 base year -150% 0% 150% 300% 450% 600% India USA Mexico UK Australia Pakistan Brazil Philippines UAE Saudi Arabia 77.2% 39% 27.1% -16.3% 530.1% 14.9% 45.9% 33% 36.5% -42.1% 29% 8.7% 2.2% -16.9% 216.7% 9.4% -1.7% -28% 5.8% -42.4% October 2023-22 October 2023-21 34
  • 36. Study Permit Applications—By Region—2018-23 25,000 50,000 75,000 100,000 2018-1 2018-7 2019-1 2019-7 2020-1 2020-7 2021-1 2021-7 2022-1 2022-7 2023-1 2023-7 Asia Africa Americas Europe Oceania 36
  • 37. Study Permit Holders—By Level—2018-23 45,000 90,000 135,000 180,000 2018-1 2018-7 2019-1 2019-7 2020-1 2020-7 2021-1 2021-7 2022-1 2022-7 2023-1 2023-7 Secondary or less Post Secondary Other Studies 37
  • 38. Study Permit Holders—By Region—2018-23 0% 25% 50% 75% 100% 2018-1 2018-7 2019-1 2019-7 2020-1 2020-7 2021-1 2021-7 2022-1 2022-7 2023-1 2023-7 Asia Africa Americas Europe Oceania 38
  • 39. Study Permit Holders by Citizenship September Comparison: 2023/22, 2023/21, Full year 2022/18 Top 10 Countries — Ordered by Number of Permits, 2018 base year -100% 0% 100% 200% 300% 400% India China Korea France Vietnam Brazil Iran Japan USA Nigeria 150% 9.9% 68.2% 93.4% -1.6% -17.2% 26.6% -32.2% -38.3% 114.1% 397.2% -26.8% 4.2% 82.1% -19.8% 76% -53.4% 16.8% 65.5% -48.9% 150.9% 6.9% -8.3% -1.7% -7.6% -10.5% -17.5% 1.5% 29.3% -20.7% September 2023/22 September 2023/21 Full year 2022/18 39
  • 40. Study Permit Holders by Province September Comparison: 2023/22, 2023/21, Full year 2022/18 -17.5% 0% 17.5% 35% 52.5% 70% Atlantic QC ON MB SK AB BC 34.6% 51.7% 44.4% 19.9% 66.3% 45.6% 51.1% 2.0% 32.5% 27.0% 17.5% -15.1% 1.9% 48.9% 16.2% 38.7% 43.3% 17.9% -1.5% 13.9% 13.3% September 2023/22 September 2023/21 Full year 2022/18 40
  • 41. Study Permits—Web Interest 40,000 80,000 120,000 160,000 2018-1 2018-7 2019-1 2019-7 2020-1 2020-7 2020-1 2021-7 2022-1 2022-7 2023-1 2023-7 Canada Asia Americas Africa Europe Oceania Not captured 41
  • 42. Study Permits—Web Interest October Comparison: 2023/22, 2023/21 Top 10 Countries by “Get your study permit” ordered by site visits, 2018 base year -125% 0% 125% 250% 375% 500% India USA China Nigeria Brazil PhilippinesColombia Mexico Iran Pakistan 18.1% 220% -55.8% -64.1% -44.5% -57.5% 38.8% -1.6% -21.1% -64.8% 1.3% 481.8% -40.2% -33.7% -44.8% -31.4% -0.7% -12.8% -17.2% -38.6% October 2023-22 October 2023-21 42
  • 44. Settlement—By Service—2018-22 Pre-Arrival and In Canada Services 68,750 137,500 206,250 275,000 2018-1 2018-7 2019-1 2019-7 2020-1 2020-7 2021-1 2021-7 2022-1 2022-7 Pre-Arrival Information & Orientation Needs & Assets Assessment, Referrals Employment Related Services Information & Orientation Services Community Connections Language Assessment Language Training Resettlement Assistance Service Delivery Improvement 44
  • 45. Settlement Services December Comparison: 2022/21, 2022/20, Full year 2022/18 Pre-Arrival Info & Orientation Needs, Assets & Referrals Employment Related Information & Orientation Community Connections Language Assessment Language Training Resettlement Assistance Service Delivery Improvement -100% 0% 100% 200% 300% 400% 18.8% 109.2% -15.5% 8.9% -1.7% 13% 18.9% 7.5% 18.8% 99.3% 374.9% 22.7% 224.9% 42.7% 41.7% 64.9% 66.8% 99.3% 11.3% 82.6% 22.9% 93.4% 32.6% 36.2% 76.9% 48.0% 11.3% December 2022/21 December 2022/20 Full year 2022/18 45
  • 46. Settlement Services—By Region—2018-22 0% 25% 50% 75% 100% 2018-1 2018-7 2019-1 2019-7 2020-1 2020-7 2021-1 2021-7 2022-1 2022-7 Asia Africa Americas Europe Oceania 46
  • 47. Settlement Services by Citizenship December Comparison: 2022/21, 2022/20, Full year 2021/18 Top 10, 2018 base year -125% 0% 125% 250% 375% 500% Syria China India Philippines Iraq Eritrea Iran PakistanAfghanistan Somalia 15.9% 267.2% -9.9% -9.6% 23.3% -25.9% -39.5% -7.4% -20.8% -21.6% 25.7% 429.3% 11.8% 4.8% 41.5% -7.7% -11.2% 19.7% 6.5% -9.3% 22.9% 115.6% 10.3% 6.7% 14.7% -1% -13.7% 15.9% 11.3% -0.3% December 2022/21 December 2022/20 Full year 2021/18 47
  • 48. Settlement Services December Comparison: 2022/21, 2022/20, Full year 2022/18 -45% -30% -15% 0% 15% 30% 45% 60% Atlantic QC ON MB SK AB BC 6.9% 9.5% 10.5% -10.4% 5.5% -27.4% 25% 36.6% 50.8% 39.2% 40.5% 41.4% -0.9% 44.3% 28.1% 39.9% 30.8% 40.1% 32.7% 11.4% 40.6% December 2022/21 December 2022/20 Full year 2022/18 48
  • 49. Settlement Services—Web Interest 12,500 25,000 37,500 50,000 2018-11 2019-5 2019-11 2020-5 2020-11 2021-5 2021-11 2022-5 2022-11 2023-5 Canada Asia Americas Europe Africa Oceania Not speci fi ed 49
  • 50. Settlement Services—Web Interest October Comparison: 2023/22, 2023/21 Top 10 Countries by “Find immigrant services near you” ordered by site visits, 2018 base year -100% -75% -50% -25% 0% 25% 50% 75% 100% India USA Brazil UAE Pakistan Nigeria Mexico UK ColombiaPhilippines -43.6% -73% 15.7% -77.2% -1.5% 30.3% -31.6% -86.3% -49% -76.5% 34.2% -30.6% 29.7% -37.4% 20.2% 91.6% -11.7% -49.5% -20.1% -39.6% October 2023-22 October 2023-21 50
  • 52. Citizenship Applications—2018-22 7,500 15,000 22,500 30,000 2018-1 2018-7 2019-1 2019-7 2020-1 2020-7 2021-1 2021-7 2022-1 2022-7 Number: Red line is 3-month moving average 52
  • 53. New Citizens—By Region of Birth—2018-23 12,500 25,000 37,500 50,000 2018-1 2018-7 2019-1 2019-7 2020-1 2020-7 2021-1 2021-7 2022-1 2022-7 2023-1 2023-7 Asia Africa Americas Europe Oceania 53
  • 54. Citizenship by Region of Birth September Comparison: 2023/22, 2023/1, Full year 2022/18 -200% 50% 300% 550% 800% Philippines India Iran China Pakistan Nigeria USA Egypt Iraq France 110.3% 88.2% 25% 162.4% 185.1% 60.2% 8.8% 29.6% 203.2% 109.1% 784% 136.2% 74.3% -36.3% 201.6% 93.9% 151.4% 116.3% 289.8% 98.5% 98% -18.9% -25.9% -8% -5% -0.3% 72.3% -2.4% 67.9% 7.7% September 2023/22 September 2023/21 Full year 2022/18 54
  • 55. Citizenship—Web Interest Note: Technical anomaly April - December 2019 45,000 90,000 135,000 180,000 2018-1 2018-7 2019-1 2019-7 2020-1 2020-7 2021-1 2021-7 2022-1 2022-7 2023-1 2023-7 Canada Americas Asia Europe Africa Oceania Not captured 55
  • 56. Citizenship—Web Interest September Comparison: 2023/22, 2023/21 Top 10 Countries by “Apply for Citizenship” ordered by site visits, 2018 base year -80% -60% -40% -20% 0% 20% 40% 60% USA India UK Pakistan UAE Nigeria China Brazil Turkey Bangladesh -23.3% -36.2% 30.1% -66.4% 55.2% -17.4% -43.3% 38.8% -33.7% -75% -22.8% 14.8% -25.6% 14.3% -13.9% -32.7% 37.4% -21.6% -59.6% -25.7% September 2023-22 September 2023-21 56
  • 58. Visitor Visas—By Source Country—2018-23 75,000 150,000 225,000 300,000 2018-1 2018-7 2019-1 2019-7 2020-1 2020-7 2021-1 2021-7 2022-1 2022-7 2023-1 2023-7 Asia Americas Africa Europe Oceania Other 58 Note: Increase in Europe driven by Ukraine, almost totality of Europe
  • 59. Visitor Visas—By Source Country September Comparison: 2023/22, 2023/21, Full year 2022/18 Top 10 Countries—Ordered by 2018 base year -175% 0% 175% 350% 525% 700% China India Philippines Iran Brazil Vietnam Colombia Algeria Pakistan Russia -55.2% 1.8% -36% 28.4% -22.1% -39.5% -35.5% -4.7% 9.1% -81.8% -100% 602.1% 224.6% 295.7% 343.6% 537.6% 12% 664.6% 157.4% 140.5% -100% 320.8% 264.6% 258.2% -42.3% 4.2% 6.2% -11.5% 42% 100.2% September 2023/22 September 2023/21 Full year 2022/18 59 Note: The most dramatic change has been the number of visas issued to Ukrainians under the Canada-Ukraine authorization for emergency travel which was not among the top 10 in 2018.
  • 60. Research Questions 60 • Which programs contracted most quickly and which source countries were most a ff ected? Similarly, which programs and source countries recovered more quickly? • Did application success rates vary pre and post-COVID by source country? • Were exogenous factors such as US immigration restrictions or tensions with China a factor? • Did interest in immigrating to Canada increase or decrease and for which countries?
  • 62. Top Countries Share of Total (2018) 10 Countries 25 Countries Permanent Residents 60.9% 77.7% IMP 70.8% 86.4% TFWP 85.2% 93.2% Study Permits 70.3% 73.8% Asylum Claimants 57.4% 77.4% Citizenship 50.3% 71.5% 62
  • 63. Top Countries (2018) Permanent Residents IMP TFWP Students Settlement Citizenship India 69,980 India 55,610 Mexico 28,860 India 107,105 Syria 15,530 Philippines 19,647 Philippines 35,050 USA 26,540 Jamaica 10,200 China 85,100 Eritrea 11,865 India 19,486 China 29,710 Finland 23,445 Guatemala 9,810 Korea 16,875 Congo 11,355 Iran 10,037 Syria 12,045 China 21,910 Philippines 8,750 Vietnam 12,370 Somalia 10,785 PRC 9,718 Nigeria 10,920 UK 11,205 India 7,380 Iran 7,040 Afghanistan 9,550 Pakistan 9,406 USA 10,905 Australia 8,850 Korea 1,960 Japan 6,685 India 9,035 Nigeria 4,398 Pakistan 9,490 Ireland 8,675 USA 1,850 Bangladesh 4,155 Pakistan 8,360 USA 4,229 France 6,175 Korea 8,105 UK 940 Philippines 4,075 Korea of 7,775 Egypt 4,115 Eritrea 5,695 Brazil 8,080 China 935 Taiwan 3,160 Mexico 7,640 Iraq 3,951 UK 5,660 Japan 7,250 France 915 Saudi Arabia 2,870 Philippines 6,995 France 3,836 63
  • 64. Data Sources • PRs: Canada - Admissions of Permanent Residents by Province/Territory of Intended Destination and Immigration Category, Canada - Admissions of Permanent Residents by Country of Citizenship, COVID Immigration Impact - PR Applications Source Countries • TR to Permanent Resident transition: Canada – Admissions of Permanent Residents with Prior Post-graduate Work Permit Holder Status by Province/Territory of Intended Destination and Immigration Category, Canada – Admissions of Permanent Residents with Prior International Mobility Program Work Permit Holder Status by Province/Territory of Intended Destination and Immigration Category, Canada – Admissions of Permanent Residents with Prior Study Permit Holder Status by Province/Territory of Intended Destination and Immigration Category, Canada – Admissions of Permanent Residents with Prior Temporary Foreign Worker Program Work Permit Holder Status by Province/Territory of Intended Destination and Immigration Category • Asylum Claimants: Canada - Asylum Claimants by Claim O ffi ce Type, Province/Territory* of Claim and Claim Year, Canada - Asylum Claimants by Top Twenty-Five Countries of Citizenship (2019 ranking), Claim O ffi ce Type and Claim Year • TRs: Canada - International Mobility Program (IMP) work permit holders by province/territory of intended destination, program and year in which permit(s) became e ff ective, Canada - Temporary Foreign Worker Program (TFWP) work permit holders by province/territory of intended destination, program and year in which permit(s) became e ff ective, Canada – International Mobility Program work permit holders by country of citizenship and year in which permit(s) became e ff ective, Canada – Temporary Foreign Worker Program work permit holders by country of citizenship and year in which permit(s) became e ff ective • Study Permits: Canada - Study permit holders by country of citizenship and year in which permit(s) became e ff ective, Canada - Study permit holders by province/territory of intended destination, study level and year in which permit(s) became e ff ective, Source Countries - Applications Processed by IRCC for New Study Permit Applications • Settlement Services: Special request IRCC data table • Citizenship: Source Countries (Country of Birth) - New Canadian Citizens (in Persons) by Month • Web: Provided by IRCC • 2018 is used as baseline 64