SlideShare a Scribd company logo
1 of 60
Download to read offline
COVID-19 Immigration Effects
2018 to April 2021

Working Draft - Key Slides
10,000
20,000
30,000
40,000
2018-1 2018-4 2018-7 2018-10 2019-1 2019-4 2019-7 2019-10 2020-1 2020-4 2020-7 2020-10 2021-1 2021-4
Economic Family Refugees
Programs Examined
• Permanent Residents/Immigrants (PRs): Economic, Family and Refugees

• TR to Permanent Resident transition

• Asylum Claimants

• Temporary Residents/International Mobility Program (IMP): International Agreements (e.g., NAFTA, GATS),
Canadian Interests (e.g., intra-corporate transfers, work exchange programs, post-graduate employment,
spouses)

• Temporary Residents/Temporary Foreign Worker Program (TFWP): caregivers, agriculture workers, other
workers with Labour Market Impact Assessment (LMIA)

• Study Permits (international students)

• Settlement Services


• Citizenship 

• Visitor Visas
2
April 2021 Highlights
• Given travel restrictions and initial shutdown, large gap between April 2021 and April 2020. Two year comparison (April 2019) more signi
fi
cant.


• April immigration continued to come back closer to traditional levels, re
fl
ecting government decision to use inventory of temporary residents to transition to permanent
residency: First four months 91,530 permanent resident admissions, annualized would be about 275,000 (but likely to be higher)


• PRs: Admissions decreased slightly from 22,410 in March to 21,105 in April. April Year-over-year change (change from 2019 in parentheses): Economic 280.8% (-18.2%),
Family 544.2% (-38.5%), Refugees 1,800% (-18.8%)


• Applications: Increase from 24,195 in March to 26,048 in April. April year-over-year change (change from 2019): 31.7% (-21.7%)


• Web “Immigrate to Canada”: Increase from 362,518 in April (outside Canada) to 440,452 in May. May year-over-year change (change from 2019): 20.4% (13.9%)


• Provincial Nominee Program: Increase from 2,645 in March to 2,880 in April. April year-over-year change (change from 2019): 122.4% (-36.5%)


• TR to PRs transition (i.e., those already in Canada): Decrease from 12,625 in March (some double counting) to 11,520 in April. April year-over-year change (change from 2019): 351.8% (49.0%)


• Temporary Residents:


• TRs/IMP: Sharp decline from 31,115 in March to 19,815 in April. April year-over-year (two year change): Agreements 121.9% (-34.2%), Canadian Interests: -16.7% (19.7%). Other IMP Participants (largely open work permits granted to Hong Kong residents who hold
HSAR or BNO passports) 9,237.5%


• TRs/TFWP: Increase from 14,545 in March to 17,140 in April. April year-over-year increase (two year change): Caregivers 246.4% (-18.5%), Agriculture 3.9% (0.7%) and Other LMIA 168% (29.5%).


• Web “Get a work permit”: From 54,203 in April (outside Canada) to 60,050 in May. May year-over-year change (change from 2019): -2.9% (-26.2%)


• Students: Increase from 22,790 in March to 31,200 in April. April year-over-year change (change from 2019): 63.9% (-2.6%)


• Applications: Slight increase from 44,073 in March to 45,683 in April. April year-over-year change (change from 2019): 1,104.4% (37.8%)


• Web “Get a study permit”: From 92,843 in April (outside Canada) to 122,865 in May Year-over-year change (change rom 2019): 88.1% (47.5%)


• Asylum Claimants: Decrease from 1,280 in March (about 75% inland) to 1,110 in April. April year-over-year change (change from 2019): -29.3% (-74.3%)


• Settlement Services (December): Decline from 48,700 in November to 42,890 in December. December year-over-year (change from 2019): 21.6% (-17.1%)


• Web “Find immigrant services hear you”: From 8,608 in April (outside Canada) to 9,524 in May. May year-over-year change (change from 2019): -3.5% (7.2%)


• Citizenship: Almost tripling from 2,561 in March to 6,825 in April. April year-over-year change (change from 2019): no number given April 2020 shutdown (-63.9%)


• Applications: From 16,783 in February to 6,069 in March. March year-over-year change (change from 2019): -70.4% (-76.1%)


• “Apply for citizenship”: From 19,161 in April (outside Canada) to 21,717 in May. May year-over-year change (change from 2019): -23.6% (95.0%)


• Visitor Visas: Decrease from 4,431 in March to 4,199 in April. April year-over-year change (change from 2019): 164.1% (-96.4%)
3
Overall Decline Across all Programs


April-December 2019-20 Comparison
4
PR Applications
PR Admissions
Asylum Claimants
Temporary Workers IMP
Temporary Workers TFWP
Study Permit Applications
Study Permit Holders
Citizenship Applications
New Citizens
Settlement Services
Visitor Visas
-120% -90% -60% -30% 0%
-95.7%
-21.4%
-74.7%
-30.1%
-34.5%
-59.1%
-12.6%
-3.8%
-77.6%
-58.1%
-59.9%
Permanent Residents
5
PR Applications: Region of Citizenship —2018-21
15,000
30,000
45,000
60,000
2018-1 2018-4 2018-7 2018-10 2019-1 2019-4 2019-7 2019-10 2020-1 2020-4 2020-7 2020-10 2021-1 2021-4
Asia Africa Americas Europe Oceania
6
Admissions: PRs by Categories—2018-21
10,000
20,000
30,000
40,000
2018-1 2018-4 2018-7 2018-10 2019-1 2019-4 2019-7 2019-10 2020-1 2020-4 2020-7 2020-10 2021-1 2021-4
Economic Family Refugees
7
Admissions: PRs Region of Citizenship—2018-21
25%
50%
75%
100%
2018-1 2018-4 2018-7 2018-10 2019-1 2019-4 2019-7 2019-10 2020-1 2020-4 2020-7 2020-10 2021-1 2021-4
Asia Africa Americas Europe Oceania
8
Admissions: Provincial Nominee Program—
2018-21
2,250
4,500
6,750
9,000
2018-1 2018-4 2018-7 2018-10 2019-1 2019-4 2019-7 2019-10 2020-1 2020-4 2020-7 2020-10 2021-1 2021-4
9
Admissions: PRs Total, Provincial Nominee Program


Two-Year Comparison (monthly)
-90%
-67.5%
-45%
-22.5%
0%
22.5%
45%
67.5%
90%
2019-1 2019-3 2019-5 2019-7 2019-9 2019-11 2020-1 2020-3 2020-5 2020-7 2020-9 2020-11 2021-1 2021-3
-36.5%
-50.4%
-5.6%
26.7%
-55.5%
-40%
-55.7%
-49.9%
-77.7%
-61.4%
-30.9%
-50.2%
-71.4%
-32.7%
45.6%
64.7%
13.5%
43.2%
38.4%
36.8%
57.3%
43.2%
25.4%
-1.6%
-29.7%
-18.7%
-36.2%
-32.4%
-21.6%
-17.2%
-9.9%
-0.3%
-48.5%
-39.1%
-51.8%
-57.7%
-64.2%
-62.7%
-44.2%
-66.8%
-84.6%
-29.4%
28.1%
32.7%
-4.1%
9.5%
18.3%
27.1%
24.7%
26.1%
14.3%
14.8%
-6.6%
-12.2%
-21.1%
-20.9%
PRs Total PNP
10
Admissions: PRs Canada Total


April Comparison: 2021/20, 2021/19
-450%
0%
450%
900%
1,350%
1,800%
Economic Family Refugees
23%
-28.8%
19.6%
-18.8%
-38.5%
-18.2%
1,800%
544.2%
280.8%
April 2021/20 April 2021/19 Q1
11
Admissions: PNP Provinces


April Comparison: 2021/20, 2021/19
-100%
75%
250%
425%
600%
Atlantic ON MB SK AB BC
-31.7%
-29.7%
-51.3%
-53.3%
-45.2%
-49.6% -45.9%
-27.8%
-44.1%
-14.3%
-47.8%
-61.8%
522.2%
40.5%
100%
228.6%
42.4%
160%
April 2021/20 April 2021/19 2020
12
Admissions: Permanent Residents by Citizenship


April Comparison: 2021/20, 2021/19 

Top 10 Countries — Ordered by 2018 base year
-100%
150%
400%
650%
900%
India Philippines China Syria Nigeria USA Pakistan France Eritrea UK
-38.5%
-62.6%
-7.5%
-42.6%
-40%
-49.6%
-52.2%
-44.7%
-60.3%
-49.7%
11.9%
-53.1%
131.3%
-39%
-13.9%
8.9%
-71.7%
-29.1%
-69%
-18.3%
370%
411.1%
761.1%
170.3%
369.7%
816.7%
680%
312.4%
110.1%
520.6%
April 2021/20 April 2021/19 2020
13
Admissions: Temporary to Permanent Residents

By Program—2018-21
3,500
7,000
10,500
14,000
2018-1 2018-4 2018-7 2018-10 2019-1 2019-4 2019-7 2019-10 2020-1 2020-4 2020-7 2020-10 2021-1 2021-4
IMP Post-Graduate WP Students TFWP
14
Admissions by Province: TRs to PRs


April Comparison: 2021/20, 2021/19
-80%
940%
1,960%
2,980%
4,000%
Atlantic QC ON MB SK AB BC
-28.1%
-32.3%
-51.9%
-39.2%
-27.3%
-20.8%
-41.2%
64.9%
-6.3%
3%
142.9%
50.7%
215.7%
-28.1%
1,622.2%
87.4%
353.3%
376%
239.6%
3,175%
1,433.3%
April 2021/20 April 2021/19 2020
15
Admissions: TRs to PRs


April Comparison: 2021/20, 2021/19
-125%
0%
125%
250%
375%
500%
IMP Post-Graduate WP Students TFWP
-41.6%
-32.6%
-28.8%
-29.9%
8.3%
35.8%
49.1%
55.8%
435.3%
465.1%
317%
348.5%
April 2021/20 April 2021/19 2020
16
Asylum Claimants: Of
fi
ce Type 2018-21
1,750
3,500
5,250
7,000
2018-1 2018-4 2018-7 2018-10 2019-1 2019-4 2019-7 2019-10 2020-1 2020-4 2020-7 2020-10 2021-1 2021-4
Airport Border Inland
17
Asylum Claimants: Year-over-year


April Comparison: 2021/20, 2021/19
-110%
142.5%
395%
647.5%
900%
Airport Border Inland
-54%
-72.2%
-77.1% -63.9%
-84.2%
-90.9%
-45.9%
571.4%
900%
April 2021/20 April 2021/19 2020
18
Asylum Claimants: Year-over-year


April Comparison: 2021/20, 2021/19
-100%
-60%
-20%
20%
60%
India Mexico Iran Nigeria Colombia Pakistan China Turkey Haiti USA
-85%
-54.5%
-53.8%
-74.2%
-90.9%
-71.4%
-93%
-66.7%
-71.4%
-77.3%
50%
-28.6%
0%
14.3%
-75%
60%
25%
-63.8%
-31.3%
-47.6%
April 2021/20 April 2021/19
19
Immigrate to Canada—Web Interest
250,000
500,000
750,000
1,000,000
2018-1 2018-4 2018-7 2018-10 2019-1 2019-4 2019-7 2019-10 2020-1 2020-4 2020-7 2020-10 2021-1 2021-4
Canada Asia Americas Africa Europe Oceania Not speci
fi
ed
20
Immigrate to Canada—Web Interest


May Comparison: 2021/20, 2021/19


Top 10 Countries by “Get a work permit” ordered by site visits, 2018 base year
-70%
-52.5%
-35%
-17.5%
0%
17.5%
35%
52.5%
70%
India USA Nigeria UK UAE Pakistan Philippines Mexico Saudi Arabia Brazil
-54.9%
23.3%
24.2%
-55.4%
-1.6%
-5.5%
-4%
11.3%
-0.4%
24.5%
-4.1%
12.9%
-23.7%
41%
53.2%
4.4%
-28.9%
17.3%
-36.6%
66.7%
May 2021/20 May 2021/19
21
Temporary Residents
22
IMP & TFWP Work Permit Holders—2018-21
12,500
25,000
37,500
50,000
2018-1 2018-5 2018-9 2019-1 2019-5 2019-9 2020-1 2020-5 2020-9 2021-1
Agreements Cdn Interests Other IMP Not Stated Caregivers Agriculture LMIA
23
IMP by Region of Citizenship—2018-21
0%
25%
50%
75%
100%
2018-1 2018-4 2018-7 2018-10 2019-1 2019-4 2019-7 2019-10 2020-1 2020-4 2020-7 2020-10 2021-1 2021-4
Asia Europe Americas Africa Oceania
24
TFWP by Region of Citizenship—2018-21
0%
25%
50%
75%
100%
2018-1 2018-4 2018-7 2018-10 2019-1 2019-4 2019-7 2019-10 2020-1 2020-4 2020-7 2020-10 2021-1 2021-4
Americas Asia Europe Africa Oceania
25
IMP & TFWP Work Permit Holders Total


Year to Year Comparison (Monthly)
-80%
-40%
0%
40%
80%
120%
160%
2019-1 2019-3 2019-5 2019-7 2019-9 2019-11 2020-1 2020-3 2020-5 2020-7 2020-9 2020-11 2021-1 2021-3
IMP TFWP
26
Temporary Residents by Program Canada


April Comparison: 2021/20, 2021/19
-75%
0%
75%
150%
225%
300%
Agreements Canadian Interests Caregivers Agriculture LMIA
-12.7%
-6.1%
-49%
-7.9%
-31.1%
29.5%
-0.7%
-18.5%
-19.7%
-34.2%
168%
3.9%
246.4%
-16.7%
121.9%
April 2021/20 April 2021/19 2020
27
IMP by Citizenship


April Comparison: 2021/20, 2021/19 

Top 10 Countries—Ordered by 2018 base year
-175%
0%
175%
350%
525%
700%
India USA France China UK Australia Ireland Korea Brazil Japan
-84%
-30.4%
-54.8%
-72.6%
-80.8%
-60.6%
19.7%
-54.6%
-53.5%
30.8%
113.3%
-32%
17.2%
155.6%
92.3%
116.1%
28.3%
140.2%
671.4%
-15.1%
April 2021/20 April 2021/19
28
TFWP by Citizenship


April Comparison: 2021/20, 2021/19 

Top 10 Countries—Ordered by 2018 base year
-150%
187.5%
525%
862.5%
1,200%
Mexico Jamaica Guatemala Philippines India Korea USA UK China France
33.3%
-28.8%
22.2%
-63.6%
-13.9%
2.8%
22.6%
39%
-14%
2.2%
600%
270%
633.3%
1,100%
47.6%
73.6%
171.3%
52%
-10.4%
4.8%
April 2021/20 April 2021/19
29
Work Permits—Web Interest
40,000
80,000
120,000
160,000
2018-1 2018-4 2018-7 2018-10 2019-1 2019-4 2019-7 2019-10 2020-1 2020-4 2020-7 2020-10 2021-1 2021-4
Canada Asia Americas Europe Oceania Africa Not captured
30
Work Permits—Web Interest


May Comparison—2021/20, 2021/19


Top 10 Countries by “Get a work permit” ordered by site visits, 2018 base year
-70%
-52.5%
-35%
-17.5%
0%
17.5%
35%
52.5%
India USA Mexico UK Australia Pakistan Brazil Philippines UAE Saudi Arabia
-5.2%
-24.7%
30.3%
-11.5%
-19.3%
-64.9%
-36.4%
0.8%
-41%
-25.9%
-10.6%
5.4%
30.6%
5.7%
17.2%
-27.8%
-19.5%
-11.4%
-34.7%
27.9%
May 2021/20 May 2021/19
31
Study Permits
32
Study Permit Applications—By Region—2018-21
17,500
35,000
52,500
70,000
2018-1 2018-4 2018-7 2018-10 2019-1 2019-4 2019-7 2019-10 2020-1 2020-4 2020-7 2020-10 2021-1 2021-4
Asia Africa Americas Europe Oceania
33
Study Permit Holders—By Level—2018-21
30,000
60,000
90,000
120,000
2018-1 2018-4 2018-7 2018-10 2019-1 2019-4 2019-7 2019-10 2020-1 2020-4 2020-7 2020-10 2021-1 2021-4
Secondary or less Post Secondary Other Studies
34
Study Permit Holders—By Region—2018-21
0%
25%
50%
75%
100%
2018-1 2018-4 2018-7 2018-10 2019-1 2019-4 2019-7 2019-10 2020-1 2020-4 2020-7 2020-10 2021-1 2021-4
Asia Africa Americas Europe Oceania
35
Study Permit Holders by Citizenship


April Comparison: 2021/20, 2021/19 

Top 10 Countries — Ordered by Number of Permits, 2018 base year
-200%
0%
200%
400%
600%
800%
India China Korea France Vietnam Brazil Iran Japan USA Nigeria
29.7%
15.6%
20.7%
33.6%
-55.3%
-20.4%
21.1%
-42.9%
-48%
8%
34.6%
766.7%
360.5%
24.8%
-39.3%
-29.9%
43.8%
-12.4%
-29.2%
172.5%
April 2021/20 April 2021/19
36
Study Permit Holders by Province


April Comparison: 2021/20, 2021/19
-90%
-42.5%
5%
52.5%
100%
Atlantic QC ON MB SK AB BC
-28.2%
-34.4%
-41.8%
-26.5%
-36.5%
-21.5%
-46.8%
-11.7%
7.4%
-11.7%
-2.6%
-1.4%
16.5%
-15.8%
39.5%
42.4%
100.0%
55.5%
89.8%
28.0%
58.8%
April 2021/20 April 2021/19 2020
37
Study Permits—Web Interest
40,000
80,000
120,000
160,000
2018-1 2018-4 2018-7 2018-10 2019-1 2019-4 2019-7 2019-10 2020-1 2020-4 2020-7 2020-10 2020-1 2021-4
Canada Asia Americas Africa Europe Oceania Not captured
38
Study Permits—Web Interest


May Comparison: 2021/20, 2021/19


Top 10 Countries by “Get your study permit” ordered by site visits, 2018 base year
-150%
-75%
0%
75%
150%
225%
300%
India USA China Nigeria Brazil PhilippinesColombia Mexico Iran Pakistan
33.5%
-90.7%
92.1%
158.3%
168.4%
14.9%
81.9%
-45.5%
33.7%
96.6%
58.9%
-81.6%
99.5%
239.8%
236.4%
81.8%
88.7%
9.4%
31.3%
149.5%
May 2021/20 May 2021/19
39
Settlement Services
40
Settlement—By Service—2018-20


In Canada Services—Top 25 Countries
20,000
40,000
60,000
80,000
2018-1 2018-4 2018-7 2018-10 2019-1 2019-4 2019-7 2019-10 2020-1 2020-4 2020-7 2020-10
Community Connections Employment Related Services Information and Orientation Services Language Assessment
Language Training Needs & Assets Assessment and Referrals Resettlement Assistance Program Service Delivery Improvement
41
Settlement Services


Year-over-year Comparison by Service—December 2020, Last Quarter
Community
Employment
Information/Orientation
Language Assessment
Language Training
Needs Assessment, Referrals
Resettlement Assistance
-100% -72.5% -45% -17.5% 10%
-88.2%
-30.5%
-13.3%
-71.1%
1.5%
-24.3%
-23.3%
-48.4%
-29.3%
-9.8%
-68.2%
-9.1%
-36.2%
-40.3%
December 2020 July-September
42
Settlement Services


Year-over-year Comparison by Province—December 2020, Last Quarter
-50%
-37.5%
-25%
-12.5%
0%
Atlantic QC ON MB SK AB BC
-18.4%
-23.2%
-24.8%
-26.5%
-7.4%
-28.4%
-45.8%
-19.7%
-13.4%
-24.1%
-35.8%
-15.9%
-28.9%
-21.8%
December 2020 July-September
43
Settlement Services by Citizenship


Year-over-year Comparison—December 2020, Last Quarter

Top 10, 2018 base year
-40%
-30%
-20%
-10%
0%
10%
Syria Eritrea Congo Somalia Afghanistan India Pakistan Korea Mexico Philippines
-14.3%
-15.4%
-29.3%
-16.6%
-15.6%
-15.9%
-28.1%
-24.5%
-17.4%
-23.5%
-38.3%
-26.1%
-17.3%
-18.8%
-2.2%
0.9%
-32.5%
-36.4%
-23.3%
-20.2%
December 2020 July-September
44
Settlement Services—Web Interest
12,500
25,000
37,500
50,000
2018-11
2019-2
2019-5
2019-8
2019-11
2020-2
2020-5
2020-8
2020-11
2021-2
2021-5
Canada Asia Americas Europe Africa Oceania Not speci
fi
ed
45
Settlement Services—Web Interest


May Comparison: 2021/20, 2021/19


Top 10 Countries by “Find immigrant services near you” ordered by site visits, 2018 base year
-50%
0%
50%
100%
150%
200%
India USA Brazil UAE Pakistan Nigeria Mexico UK ColombiaPhilippines
49.3%
195.2%
12.7%
37.4%
-4.8%
51.5%
2%
36.7%
-26.1%
21.5% 17.5%
167.1%
-14.5%
-9.3%
-11.9%
39.2%
-22%
-10.6%
-20.5%
24%
May 2021/20 May 2021/19
46
Citizenship
47
Citizenship Applications—2018-21
7,500
15,000
22,500
30,000
2018-1 2018-4 2018-7 2018-10 2019-1 2019-4 2019-7 2019-10 2020-1 2020-4 2020-7 2020-10 2021-1
48
New Citizens—By Region of Birth—2018-21
7,500
15,000
22,500
30,000
2018-1 2018-4 2018-7 2018-10 2019-1 2019-4 2019-7 2019-10 2020-1 2020-4 2020-7 2020-10 2021-1 2021-4
Asia Africa Americas Europe Oceania
49
Citizenship by Region of Birth


April Comparison: 2021/19 Top 10 Countries—Ordered by 2018 base year

2021/20 Comparison not calculable given complete shutdown April 2020
-80%
-60%
-40%
-20%
0%
Philippines India Iran China Pakistan Nigeria USA Egypt Iraq France
-66.2%
-67.8%
-63.4%
-64.3%
-63.8%
-70.2%
-74.1%
-74.8%
-59%
-56.7%
April 2021/20 April 2021/19
50
Citizenship—Web Interest


Note: Technical anomaly April - December 2019
45,000
90,000
135,000
180,000
2018-1 2018-4 2018-7 2018-10 2019-1 2019-4 2019-7 2019-10 2020-1 2020-4 2020-7 2020-10 2021-1 2021-4
Canada Americas Asia Europe Africa Oceania Not captured
51
Citizenship—Web Interest


May Comparison: 2021/20, 2021/19


Top 10 Countries by “Apply for Citizenship” ordered by site visits, 2018 base year
-75%
0%
75%
150%
225%
300%
USA India UK Pakistan UAE Nigeria China Brazil Turkey Bangladesh
255.5%
118%
88.1%
60.5%
68.3%
103.6%
157.1%
57.3%
150.4%
62.6%
-22.2%
48.3%
-23.8%
1.4%
13.7%
-1.1%
39.3%
-50.8%
24.6%
-51.5%
May 2021/20 May 2021/19
52
Approved Visitor Visas
53
Visitor Visas—By Source Country—2018-21
45,000
90,000
135,000
180,000
2018-1 2018-4 2018-7 2018-10 2019-1 2019-4 2019-7 2019-10 2020-1 2020-4 2020-7 2020-10 2021-1 2021-4
Asia Americas Africa Europe Oceania Other
54
Visitor Visas—By Source Country


April Comparison: 2021/20, 2021/19 

Top 10 Countries—Ordered by 2018 base year
-1,000%
0%
1,000%
2,000%
3,000%
4,000%
China India Philippines Iran Brazil Vietnam Colombia Algeria Pakistan Russia
-91.1%
-90.9%
-98.2%
-98.2%
-99%
-97.7%
-86.7%
-94.3%
-97.7%
-98.2%
1,022.2%
680%
-87.8%
-87.8%
18.5%
1,850%
3,158.3%
214.9%
833.3%
562.7%
April 2021/20 April 2021/20
55
Research Questions
56
• Which programs contracted most quickly and which source countries
were most a
ff
ected? Similarly, which programs and source countries
recovered more quickly?

• Did application success rates vary pre and post-COVID by source
country?

• Were exogenous factors such as US immigration restrictions or
tensions with China a factor?

• Did interest in immigrating to Canada increase or decrease and for
which countries?
Annex
57
Top Countries Share of Total (2018)
10 Countries 25 Countries
Permanent Residents 60.9% 77.7%
IMP 70.8% 86.4%
TFWP 85.2% 93.2%
Study Permits 70.3% 73.8%
Asylum Claimants 57.4% 77.4%
Citizenship 50.3% 71.5%
58
Top Countries (2018)
Permanent
Residents
IMP TFWP Students Settlement Citizenship
India 69,980 India 55,610 Mexico 28,860 India 107,105 Syria 15,530 Philippines 19,647
Philippines 35,050 USA 26,540 Jamaica 10,200 China 85,100 Eritrea 11,865 India 19,486
China 29,710 Finland 23,445 Guatemala 9,810 Korea 16,875 Congo 11,355 Iran 10,037
Syria 12,045 China 21,910 Philippines 8,750 Vietnam 12,370 Somalia 10,785 PRC 9,718
Nigeria 10,920 UK 11,205 India 7,380 Iran 7,040 Afghanistan 9,550 Pakistan 9,406
USA 10,905 Australia 8,850 Korea 1,960 Japan 6,685 India 9,035 Nigeria 4,398
Pakistan 9,490 Ireland 8,675 USA 1,850 Bangladesh 4,155 Pakistan 8,360 USA 4,229
France 6,175 Korea 8,105 UK 940 Philippines 4,075 Korea of 7,775 Egypt 4,115
Eritrea 5,695 Brazil 8,080 China 935 Taiwan 3,160 Mexico 7,640 Iraq 3,951
UK 5,660 Japan 7,250 France 915
Saudi
Arabia
2,870 Philippines 6,995 France 3,836
59
Data Sources
• PRs: Canada - Admissions of Permanent Residents by Province/Territory of Intended Destination and Immigration Category, Canada - Admissions
of Permanent Residents by Country of Citizenship, COVID Immigration Impact - PR Applications Source Countries

• TR to Permanent Resident transition: Canada – Admissions of Permanent Residents with Prior Post-graduate Work Permit Holder Status by Province/Territory of Intended Destination and
Immigration Category, Canada – Admissions of Permanent Residents with Prior International Mobility Program Work Permit Holder Status by Province/Territory of Intended Destination and
Immigration Category, Canada – Admissions of Permanent Residents with Prior Study Permit Holder Status by Province/Territory of Intended Destination and Immigration Category, Canada –
Admissions of Permanent Residents with Prior Temporary Foreign Worker Program Work Permit Holder Status by Province/Territory of Intended Destination and Immigration Category

• Asylum Claimants: Canada - Asylum Claimants by Claim O
ffi
ce Type, Province/Territory* of Claim and Claim Year, Canada - Asylum Claimants by Top Twenty-Five Countries of Citizenship
(2019 ranking), Claim O
ffi
ce Type and Claim Year 

• TRs: Canada - International Mobility Program (IMP) work permit holders by province/territory of intended destination, program and year in which
permit(s) became e
ff
ective, Canada - Temporary Foreign Worker Program (TFWP) work permit holders by province/territory of intended destination,
program and year in which permit(s) became e
ff
ective, Canada – International Mobility Program work permit holders by country of citizenship and
year in which permit(s) became e
ff
ective, Canada – Temporary Foreign Worker Program work permit holders by country of citizenship and year in
which permit(s) became e
ff
ective

• Study Permits: Canada - Study permit holders by country of citizenship and year in which permit(s) became e
ff
ective, Canada - Study permit
holders by province/territory of intended destination, study level and year in which permit(s) became e
ff
ective, Source Countries - Applications
Processed by IRCC for New Study Permit Applications

• Settlement Services: Special request IRCC data table

• Citizenship: Source Countries (Country of Birth) - New Canadian Citizens (in Persons) by Month 

• Web: Provided by IRCC
60

More Related Content

What's hot

Citizenship Modernization Case Study
Citizenship Modernization Case StudyCitizenship Modernization Case Study
Citizenship Modernization Case StudyAndrew Griffith
 
Covid 19 immigration effects - key slides - August 2020
Covid 19 immigration effects - key slides - August 2020Covid 19 immigration effects - key slides - August 2020
Covid 19 immigration effects - key slides - August 2020Andrew Griffith
 
Covid 19 Immigration Effects - November 2021
Covid 19 Immigration Effects - November 2021 Covid 19 Immigration Effects - November 2021
Covid 19 Immigration Effects - November 2021 Andrew Griffith
 
Covid 19 immigration effects - key slides - Updated February 2021
Covid 19 immigration effects - key slides - Updated February 2021Covid 19 immigration effects - key slides - Updated February 2021
Covid 19 immigration effects - key slides - Updated February 2021Andrew Griffith
 
Covid 19 immigration effects December 2020
Covid 19 immigration effects December 2020Covid 19 immigration effects December 2020
Covid 19 immigration effects December 2020Andrew Griffith
 
Impact of Covid-19 on Immigration to Canada - Working Deck- October 2020 Numb...
Impact of Covid-19 on Immigration to Canada - Working Deck- October 2020 Numb...Impact of Covid-19 on Immigration to Canada - Working Deck- October 2020 Numb...
Impact of Covid-19 on Immigration to Canada - Working Deck- October 2020 Numb...Andrew Griffith
 
3rd gdp quarter2020
3rd gdp quarter20203rd gdp quarter2020
3rd gdp quarter2020SABC News
 
Verification of measles and rubella elimination in the WHO European Region
Verification of measles and rubella elimination in the WHO European RegionVerification of measles and rubella elimination in the WHO European Region
Verification of measles and rubella elimination in the WHO European RegionWHO Regional Office for Europe
 
Fairfax County FY 2020 Advertised Budget Presentation
Fairfax County FY 2020 Advertised Budget PresentationFairfax County FY 2020 Advertised Budget Presentation
Fairfax County FY 2020 Advertised Budget PresentationFairfax County
 
Montgomery County Fiscal Plan and Expenditure Overview
Montgomery County Fiscal Plan and Expenditure OverviewMontgomery County Fiscal Plan and Expenditure Overview
Montgomery County Fiscal Plan and Expenditure OverviewMontgomery County
 
Agricultural Trade and the Transition to Sustainable Food Systems
Agricultural Trade and the Transition to Sustainable Food SystemsAgricultural Trade and the Transition to Sustainable Food Systems
Agricultural Trade and the Transition to Sustainable Food SystemsFrancois Stepman
 

What's hot (11)

Citizenship Modernization Case Study
Citizenship Modernization Case StudyCitizenship Modernization Case Study
Citizenship Modernization Case Study
 
Covid 19 immigration effects - key slides - August 2020
Covid 19 immigration effects - key slides - August 2020Covid 19 immigration effects - key slides - August 2020
Covid 19 immigration effects - key slides - August 2020
 
Covid 19 Immigration Effects - November 2021
Covid 19 Immigration Effects - November 2021 Covid 19 Immigration Effects - November 2021
Covid 19 Immigration Effects - November 2021
 
Covid 19 immigration effects - key slides - Updated February 2021
Covid 19 immigration effects - key slides - Updated February 2021Covid 19 immigration effects - key slides - Updated February 2021
Covid 19 immigration effects - key slides - Updated February 2021
 
Covid 19 immigration effects December 2020
Covid 19 immigration effects December 2020Covid 19 immigration effects December 2020
Covid 19 immigration effects December 2020
 
Impact of Covid-19 on Immigration to Canada - Working Deck- October 2020 Numb...
Impact of Covid-19 on Immigration to Canada - Working Deck- October 2020 Numb...Impact of Covid-19 on Immigration to Canada - Working Deck- October 2020 Numb...
Impact of Covid-19 on Immigration to Canada - Working Deck- October 2020 Numb...
 
3rd gdp quarter2020
3rd gdp quarter20203rd gdp quarter2020
3rd gdp quarter2020
 
Verification of measles and rubella elimination in the WHO European Region
Verification of measles and rubella elimination in the WHO European RegionVerification of measles and rubella elimination in the WHO European Region
Verification of measles and rubella elimination in the WHO European Region
 
Fairfax County FY 2020 Advertised Budget Presentation
Fairfax County FY 2020 Advertised Budget PresentationFairfax County FY 2020 Advertised Budget Presentation
Fairfax County FY 2020 Advertised Budget Presentation
 
Montgomery County Fiscal Plan and Expenditure Overview
Montgomery County Fiscal Plan and Expenditure OverviewMontgomery County Fiscal Plan and Expenditure Overview
Montgomery County Fiscal Plan and Expenditure Overview
 
Agricultural Trade and the Transition to Sustainable Food Systems
Agricultural Trade and the Transition to Sustainable Food SystemsAgricultural Trade and the Transition to Sustainable Food Systems
Agricultural Trade and the Transition to Sustainable Food Systems
 

Similar to Covid 19 immigration effects April 2021

Covid 19 Immigration Effects - May 2021 draft
Covid 19 Immigration Effects - May 2021 draftCovid 19 Immigration Effects - May 2021 draft
Covid 19 Immigration Effects - May 2021 draftAndrew Griffith
 
Covid-19 Immigration Effects - Key Slides - April 2022.pdf
Covid-19 Immigration Effects - Key Slides - April 2022.pdfCovid-19 Immigration Effects - Key Slides - April 2022.pdf
Covid-19 Immigration Effects - Key Slides - April 2022.pdfAndrew Griffith
 
Covid-19 Immigration Effects - Key Slides - March 2022
Covid-19 Immigration Effects - Key Slides - March 2022Covid-19 Immigration Effects - Key Slides - March 2022
Covid-19 Immigration Effects - Key Slides - March 2022Andrew Griffith
 
Canadian Immigration Tracker - Key Slides - April 2023.pdf
Canadian Immigration Tracker - Key Slides - April 2023.pdfCanadian Immigration Tracker - Key Slides - April 2023.pdf
Canadian Immigration Tracker - Key Slides - April 2023.pdfAndrew Griffith
 
Covid-19 Immigration Effects - Key Slides - June 2022
Covid-19 Immigration  Effects - Key Slides - June 2022Covid-19 Immigration  Effects - Key Slides - June 2022
Covid-19 Immigration Effects - Key Slides - June 2022Andrew Griffith
 
Covid-19 Immigration Effects - Key Slides - May 2022
Covid-19 Immigration Effects - Key Slides - May 2022Covid-19 Immigration Effects - Key Slides - May 2022
Covid-19 Immigration Effects - Key Slides - May 2022Andrew Griffith
 
Covid-19 Immigration Effects - Key Slides - February 2023.pdf
Covid-19 Immigration Effects - Key Slides - February 2023.pdfCovid-19 Immigration Effects - Key Slides - February 2023.pdf
Covid-19 Immigration Effects - Key Slides - February 2023.pdfAndrew Griffith
 
Canadian Immigration Tracker - January 2024.pdf
Canadian Immigration Tracker - January 2024.pdfCanadian Immigration Tracker - January 2024.pdf
Canadian Immigration Tracker - January 2024.pdfAndrew Griffith
 
Covid-19 Immigration Effects - Key Slides - March 2023
Covid-19 Immigration Effects - Key Slides - March 2023Covid-19 Immigration Effects - Key Slides - March 2023
Covid-19 Immigration Effects - Key Slides - March 2023Andrew Griffith
 
Covid-19 Immigration Effects - January 2022
Covid-19 Immigration Effects - January 2022Covid-19 Immigration Effects - January 2022
Covid-19 Immigration Effects - January 2022Andrew Griffith
 
Covid-19 Immigration Effects - Key Slides - January 2023.pdf
Covid-19 Immigration Effects - Key Slides - January 2023.pdfCovid-19 Immigration Effects - Key Slides - January 2023.pdf
Covid-19 Immigration Effects - Key Slides - January 2023.pdfAndrew Griffith
 
Covid-19 Immigration Effects - Key Slides - February 2022.pdf
Covid-19 Immigration Effects - Key Slides - February 2022.pdfCovid-19 Immigration Effects - Key Slides - February 2022.pdf
Covid-19 Immigration Effects - Key Slides - February 2022.pdfAndrew Griffith
 
Covid-19 Immigration Effects - Key Slides - July 2023 .pdf
Covid-19 Immigration Effects - Key Slides - July 2023 .pdfCovid-19 Immigration Effects - Key Slides - July 2023 .pdf
Covid-19 Immigration Effects - Key Slides - July 2023 .pdfAndrew Griffith
 
Canadian Immigration Tracker - Key Slides - February 2024.pdf
Canadian Immigration Tracker - Key Slides - February 2024.pdfCanadian Immigration Tracker - Key Slides - February 2024.pdf
Canadian Immigration Tracker - Key Slides - February 2024.pdfAndrew Griffith
 
Canadian Immigration Tracker - August 2023.pdf
Canadian Immigration Tracker - August 2023.pdfCanadian Immigration Tracker - August 2023.pdf
Canadian Immigration Tracker - August 2023.pdfAndrew Griffith
 
Covid-19 Immigration Effects - Key Slides - July 2022
Covid-19 Immigration Effects - Key Slides - July 2022Covid-19 Immigration Effects - Key Slides - July 2022
Covid-19 Immigration Effects - Key Slides - July 2022Andrew Griffith
 
Covid-19 Immigration Effects - Key Slides - October 2022
Covid-19 Immigration Effects - Key Slides - October 2022Covid-19 Immigration Effects - Key Slides - October 2022
Covid-19 Immigration Effects - Key Slides - October 2022Andrew Griffith
 
Covid-19 Immigration Effects - Key Slides - September 2022
Covid-19 Immigration Effects - Key Slides - September 2022Covid-19 Immigration Effects - Key Slides - September 2022
Covid-19 Immigration Effects - Key Slides - September 2022Andrew Griffith
 
Covid-19 Immigration Effects - Key Slides - June 2023 .pdf
Covid-19 Immigration Effects - Key Slides - June 2023 .pdfCovid-19 Immigration Effects - Key Slides - June 2023 .pdf
Covid-19 Immigration Effects - Key Slides - June 2023 .pdfAndrew Griffith
 
Covid-19 Immigration Effects - Key Slides - August 2022
Covid-19 Immigration Effects - Key Slides - August 2022Covid-19 Immigration Effects - Key Slides - August 2022
Covid-19 Immigration Effects - Key Slides - August 2022Andrew Griffith
 

Similar to Covid 19 immigration effects April 2021 (20)

Covid 19 Immigration Effects - May 2021 draft
Covid 19 Immigration Effects - May 2021 draftCovid 19 Immigration Effects - May 2021 draft
Covid 19 Immigration Effects - May 2021 draft
 
Covid-19 Immigration Effects - Key Slides - April 2022.pdf
Covid-19 Immigration Effects - Key Slides - April 2022.pdfCovid-19 Immigration Effects - Key Slides - April 2022.pdf
Covid-19 Immigration Effects - Key Slides - April 2022.pdf
 
Covid-19 Immigration Effects - Key Slides - March 2022
Covid-19 Immigration Effects - Key Slides - March 2022Covid-19 Immigration Effects - Key Slides - March 2022
Covid-19 Immigration Effects - Key Slides - March 2022
 
Canadian Immigration Tracker - Key Slides - April 2023.pdf
Canadian Immigration Tracker - Key Slides - April 2023.pdfCanadian Immigration Tracker - Key Slides - April 2023.pdf
Canadian Immigration Tracker - Key Slides - April 2023.pdf
 
Covid-19 Immigration Effects - Key Slides - June 2022
Covid-19 Immigration  Effects - Key Slides - June 2022Covid-19 Immigration  Effects - Key Slides - June 2022
Covid-19 Immigration Effects - Key Slides - June 2022
 
Covid-19 Immigration Effects - Key Slides - May 2022
Covid-19 Immigration Effects - Key Slides - May 2022Covid-19 Immigration Effects - Key Slides - May 2022
Covid-19 Immigration Effects - Key Slides - May 2022
 
Covid-19 Immigration Effects - Key Slides - February 2023.pdf
Covid-19 Immigration Effects - Key Slides - February 2023.pdfCovid-19 Immigration Effects - Key Slides - February 2023.pdf
Covid-19 Immigration Effects - Key Slides - February 2023.pdf
 
Canadian Immigration Tracker - January 2024.pdf
Canadian Immigration Tracker - January 2024.pdfCanadian Immigration Tracker - January 2024.pdf
Canadian Immigration Tracker - January 2024.pdf
 
Covid-19 Immigration Effects - Key Slides - March 2023
Covid-19 Immigration Effects - Key Slides - March 2023Covid-19 Immigration Effects - Key Slides - March 2023
Covid-19 Immigration Effects - Key Slides - March 2023
 
Covid-19 Immigration Effects - January 2022
Covid-19 Immigration Effects - January 2022Covid-19 Immigration Effects - January 2022
Covid-19 Immigration Effects - January 2022
 
Covid-19 Immigration Effects - Key Slides - January 2023.pdf
Covid-19 Immigration Effects - Key Slides - January 2023.pdfCovid-19 Immigration Effects - Key Slides - January 2023.pdf
Covid-19 Immigration Effects - Key Slides - January 2023.pdf
 
Covid-19 Immigration Effects - Key Slides - February 2022.pdf
Covid-19 Immigration Effects - Key Slides - February 2022.pdfCovid-19 Immigration Effects - Key Slides - February 2022.pdf
Covid-19 Immigration Effects - Key Slides - February 2022.pdf
 
Covid-19 Immigration Effects - Key Slides - July 2023 .pdf
Covid-19 Immigration Effects - Key Slides - July 2023 .pdfCovid-19 Immigration Effects - Key Slides - July 2023 .pdf
Covid-19 Immigration Effects - Key Slides - July 2023 .pdf
 
Canadian Immigration Tracker - Key Slides - February 2024.pdf
Canadian Immigration Tracker - Key Slides - February 2024.pdfCanadian Immigration Tracker - Key Slides - February 2024.pdf
Canadian Immigration Tracker - Key Slides - February 2024.pdf
 
Canadian Immigration Tracker - August 2023.pdf
Canadian Immigration Tracker - August 2023.pdfCanadian Immigration Tracker - August 2023.pdf
Canadian Immigration Tracker - August 2023.pdf
 
Covid-19 Immigration Effects - Key Slides - July 2022
Covid-19 Immigration Effects - Key Slides - July 2022Covid-19 Immigration Effects - Key Slides - July 2022
Covid-19 Immigration Effects - Key Slides - July 2022
 
Covid-19 Immigration Effects - Key Slides - October 2022
Covid-19 Immigration Effects - Key Slides - October 2022Covid-19 Immigration Effects - Key Slides - October 2022
Covid-19 Immigration Effects - Key Slides - October 2022
 
Covid-19 Immigration Effects - Key Slides - September 2022
Covid-19 Immigration Effects - Key Slides - September 2022Covid-19 Immigration Effects - Key Slides - September 2022
Covid-19 Immigration Effects - Key Slides - September 2022
 
Covid-19 Immigration Effects - Key Slides - June 2023 .pdf
Covid-19 Immigration Effects - Key Slides - June 2023 .pdfCovid-19 Immigration Effects - Key Slides - June 2023 .pdf
Covid-19 Immigration Effects - Key Slides - June 2023 .pdf
 
Covid-19 Immigration Effects - Key Slides - August 2022
Covid-19 Immigration Effects - Key Slides - August 2022Covid-19 Immigration Effects - Key Slides - August 2022
Covid-19 Immigration Effects - Key Slides - August 2022
 

More from Andrew Griffith

Canadian Immigration Tracker - Key Slides - December 2023
Canadian Immigration Tracker - Key Slides - December 2023Canadian Immigration Tracker - Key Slides - December 2023
Canadian Immigration Tracker - Key Slides - December 2023Andrew Griffith
 
Canadian Immigration Tracker - Key Slides - October 2023.pdf
Canadian Immigration Tracker - Key Slides - October 2023.pdfCanadian Immigration Tracker - Key Slides - October 2023.pdf
Canadian Immigration Tracker - Key Slides - October 2023.pdfAndrew Griffith
 
Covid-19 Immigration Effects - Key Slides - September 2023.pdf
Covid-19 Immigration Effects - Key Slides - September  2023.pdfCovid-19 Immigration Effects - Key Slides - September  2023.pdf
Covid-19 Immigration Effects - Key Slides - September 2023.pdfAndrew Griffith
 
Integration - General Deck 2022 data
Integration - General Deck 2022 dataIntegration - General Deck 2022 data
Integration - General Deck 2022 dataAndrew Griffith
 
Covid-19 Immigration Effects - Key Slides - December 2022 and full-year comp...
Covid-19 Immigration Effects - Key Slides - December  2022 and full-year comp...Covid-19 Immigration Effects - Key Slides - December  2022 and full-year comp...
Covid-19 Immigration Effects - Key Slides - December 2022 and full-year comp...Andrew Griffith
 
Covid-19 Immigration Effects - Key Slides - November 2022 .pdf
Covid-19 Immigration Effects - Key Slides - November 2022 .pdfCovid-19 Immigration Effects - Key Slides - November 2022 .pdf
Covid-19 Immigration Effects - Key Slides - November 2022 .pdfAndrew Griffith
 
Order of Canada 2013-22 Diversity
Order of Canada 2013-22 DiversityOrder of Canada 2013-22 Diversity
Order of Canada 2013-22 DiversityAndrew Griffith
 
Order of Canada Appointments 2013-21 - How Diverse Are They?
Order of Canada Appointments 2013-21 - How Diverse Are They?  Order of Canada Appointments 2013-21 - How Diverse Are They?
Order of Canada Appointments 2013-21 - How Diverse Are They? Andrew Griffith
 

More from Andrew Griffith (8)

Canadian Immigration Tracker - Key Slides - December 2023
Canadian Immigration Tracker - Key Slides - December 2023Canadian Immigration Tracker - Key Slides - December 2023
Canadian Immigration Tracker - Key Slides - December 2023
 
Canadian Immigration Tracker - Key Slides - October 2023.pdf
Canadian Immigration Tracker - Key Slides - October 2023.pdfCanadian Immigration Tracker - Key Slides - October 2023.pdf
Canadian Immigration Tracker - Key Slides - October 2023.pdf
 
Covid-19 Immigration Effects - Key Slides - September 2023.pdf
Covid-19 Immigration Effects - Key Slides - September  2023.pdfCovid-19 Immigration Effects - Key Slides - September  2023.pdf
Covid-19 Immigration Effects - Key Slides - September 2023.pdf
 
Integration - General Deck 2022 data
Integration - General Deck 2022 dataIntegration - General Deck 2022 data
Integration - General Deck 2022 data
 
Covid-19 Immigration Effects - Key Slides - December 2022 and full-year comp...
Covid-19 Immigration Effects - Key Slides - December  2022 and full-year comp...Covid-19 Immigration Effects - Key Slides - December  2022 and full-year comp...
Covid-19 Immigration Effects - Key Slides - December 2022 and full-year comp...
 
Covid-19 Immigration Effects - Key Slides - November 2022 .pdf
Covid-19 Immigration Effects - Key Slides - November 2022 .pdfCovid-19 Immigration Effects - Key Slides - November 2022 .pdf
Covid-19 Immigration Effects - Key Slides - November 2022 .pdf
 
Order of Canada 2013-22 Diversity
Order of Canada 2013-22 DiversityOrder of Canada 2013-22 Diversity
Order of Canada 2013-22 Diversity
 
Order of Canada Appointments 2013-21 - How Diverse Are They?
Order of Canada Appointments 2013-21 - How Diverse Are They?  Order of Canada Appointments 2013-21 - How Diverse Are They?
Order of Canada Appointments 2013-21 - How Diverse Are They?
 

Recently uploaded

Financing strategies for adaptation. Presentation for CANCC
Financing strategies for adaptation. Presentation for CANCCFinancing strategies for adaptation. Presentation for CANCC
Financing strategies for adaptation. Presentation for CANCCNAP Global Network
 
Get Premium Budhwar Peth Call Girls (8005736733) 24x7 Rate 15999 with A/c Roo...
Get Premium Budhwar Peth Call Girls (8005736733) 24x7 Rate 15999 with A/c Roo...Get Premium Budhwar Peth Call Girls (8005736733) 24x7 Rate 15999 with A/c Roo...
Get Premium Budhwar Peth Call Girls (8005736733) 24x7 Rate 15999 with A/c Roo...MOHANI PANDEY
 
VIP Model Call Girls Shikrapur ( Pune ) Call ON 8005736733 Starting From 5K t...
VIP Model Call Girls Shikrapur ( Pune ) Call ON 8005736733 Starting From 5K t...VIP Model Call Girls Shikrapur ( Pune ) Call ON 8005736733 Starting From 5K t...
VIP Model Call Girls Shikrapur ( Pune ) Call ON 8005736733 Starting From 5K t...SUHANI PANDEY
 
The Economic and Organised Crime Office (EOCO) has been advised by the Office...
The Economic and Organised Crime Office (EOCO) has been advised by the Office...The Economic and Organised Crime Office (EOCO) has been advised by the Office...
The Economic and Organised Crime Office (EOCO) has been advised by the Office...nservice241
 
Night 7k to 12k Call Girls Service In Navi Mumbai 👉 BOOK NOW 9833363713 👈 ♀️...
Night 7k to 12k  Call Girls Service In Navi Mumbai 👉 BOOK NOW 9833363713 👈 ♀️...Night 7k to 12k  Call Girls Service In Navi Mumbai 👉 BOOK NOW 9833363713 👈 ♀️...
Night 7k to 12k Call Girls Service In Navi Mumbai 👉 BOOK NOW 9833363713 👈 ♀️...aartirawatdelhi
 
Call Girls Chakan Call Me 7737669865 Budget Friendly No Advance Booking
Call Girls Chakan Call Me 7737669865 Budget Friendly No Advance BookingCall Girls Chakan Call Me 7737669865 Budget Friendly No Advance Booking
Call Girls Chakan Call Me 7737669865 Budget Friendly No Advance Bookingroncy bisnoi
 
Top Rated Pune Call Girls Dapodi ⟟ 6297143586 ⟟ Call Me For Genuine Sex Serv...
Top Rated  Pune Call Girls Dapodi ⟟ 6297143586 ⟟ Call Me For Genuine Sex Serv...Top Rated  Pune Call Girls Dapodi ⟟ 6297143586 ⟟ Call Me For Genuine Sex Serv...
Top Rated Pune Call Girls Dapodi ⟟ 6297143586 ⟟ Call Me For Genuine Sex Serv...Call Girls in Nagpur High Profile
 
PPT Item # 4 - 231 Encino Ave (Significance Only)
PPT Item # 4 - 231 Encino Ave (Significance Only)PPT Item # 4 - 231 Encino Ave (Significance Only)
PPT Item # 4 - 231 Encino Ave (Significance Only)ahcitycouncil
 
2024 Zoom Reinstein Legacy Asbestos Webinar
2024 Zoom Reinstein Legacy Asbestos Webinar2024 Zoom Reinstein Legacy Asbestos Webinar
2024 Zoom Reinstein Legacy Asbestos WebinarLinda Reinstein
 
Postal Ballots-For home voting step by step process 2024.pptx
Postal Ballots-For home voting step by step process 2024.pptxPostal Ballots-For home voting step by step process 2024.pptx
Postal Ballots-For home voting step by step process 2024.pptxSwastiRanjanNayak
 
Zechariah Boodey Farmstead Collaborative presentation - Humble Beginnings
Zechariah Boodey Farmstead Collaborative presentation -  Humble BeginningsZechariah Boodey Farmstead Collaborative presentation -  Humble Beginnings
Zechariah Boodey Farmstead Collaborative presentation - Humble Beginningsinfo695895
 
Government e Marketplace GeM Presentation
Government e Marketplace GeM PresentationGovernment e Marketplace GeM Presentation
Government e Marketplace GeM Presentationgememarket11
 
Just Call Vip call girls Wardha Escorts ☎️8617370543 Starting From 5K to 25K ...
Just Call Vip call girls Wardha Escorts ☎️8617370543 Starting From 5K to 25K ...Just Call Vip call girls Wardha Escorts ☎️8617370543 Starting From 5K to 25K ...
Just Call Vip call girls Wardha Escorts ☎️8617370543 Starting From 5K to 25K ...Dipal Arora
 
Call Girls Sangamwadi Call Me 7737669865 Budget Friendly No Advance Booking
Call Girls Sangamwadi Call Me 7737669865 Budget Friendly No Advance BookingCall Girls Sangamwadi Call Me 7737669865 Budget Friendly No Advance Booking
Call Girls Sangamwadi Call Me 7737669865 Budget Friendly No Advance Bookingroncy bisnoi
 
CBO’s Recent Appeals for New Research on Health-Related Topics
CBO’s Recent Appeals for New Research on Health-Related TopicsCBO’s Recent Appeals for New Research on Health-Related Topics
CBO’s Recent Appeals for New Research on Health-Related TopicsCongressional Budget Office
 
Human-AI Collaboration for Virtual Capacity in Emergency Operation Centers (E...
Human-AI Collaborationfor Virtual Capacity in Emergency Operation Centers (E...Human-AI Collaborationfor Virtual Capacity in Emergency Operation Centers (E...
Human-AI Collaboration for Virtual Capacity in Emergency Operation Centers (E...Hemant Purohit
 
Tuvalu Coastal Adaptation Project (TCAP)
Tuvalu Coastal Adaptation Project (TCAP)Tuvalu Coastal Adaptation Project (TCAP)
Tuvalu Coastal Adaptation Project (TCAP)NAP Global Network
 
The NAP process & South-South peer learning
The NAP process & South-South peer learningThe NAP process & South-South peer learning
The NAP process & South-South peer learningNAP Global Network
 
WORLD DEVELOPMENT REPORT 2024 - Economic Growth in Middle-Income Countries.
WORLD DEVELOPMENT REPORT 2024 - Economic Growth in Middle-Income Countries.WORLD DEVELOPMENT REPORT 2024 - Economic Growth in Middle-Income Countries.
WORLD DEVELOPMENT REPORT 2024 - Economic Growth in Middle-Income Countries.Christina Parmionova
 
Finance strategies for adaptation. Presentation for CANCC
Finance strategies for adaptation. Presentation for CANCCFinance strategies for adaptation. Presentation for CANCC
Finance strategies for adaptation. Presentation for CANCCNAP Global Network
 

Recently uploaded (20)

Financing strategies for adaptation. Presentation for CANCC
Financing strategies for adaptation. Presentation for CANCCFinancing strategies for adaptation. Presentation for CANCC
Financing strategies for adaptation. Presentation for CANCC
 
Get Premium Budhwar Peth Call Girls (8005736733) 24x7 Rate 15999 with A/c Roo...
Get Premium Budhwar Peth Call Girls (8005736733) 24x7 Rate 15999 with A/c Roo...Get Premium Budhwar Peth Call Girls (8005736733) 24x7 Rate 15999 with A/c Roo...
Get Premium Budhwar Peth Call Girls (8005736733) 24x7 Rate 15999 with A/c Roo...
 
VIP Model Call Girls Shikrapur ( Pune ) Call ON 8005736733 Starting From 5K t...
VIP Model Call Girls Shikrapur ( Pune ) Call ON 8005736733 Starting From 5K t...VIP Model Call Girls Shikrapur ( Pune ) Call ON 8005736733 Starting From 5K t...
VIP Model Call Girls Shikrapur ( Pune ) Call ON 8005736733 Starting From 5K t...
 
The Economic and Organised Crime Office (EOCO) has been advised by the Office...
The Economic and Organised Crime Office (EOCO) has been advised by the Office...The Economic and Organised Crime Office (EOCO) has been advised by the Office...
The Economic and Organised Crime Office (EOCO) has been advised by the Office...
 
Night 7k to 12k Call Girls Service In Navi Mumbai 👉 BOOK NOW 9833363713 👈 ♀️...
Night 7k to 12k  Call Girls Service In Navi Mumbai 👉 BOOK NOW 9833363713 👈 ♀️...Night 7k to 12k  Call Girls Service In Navi Mumbai 👉 BOOK NOW 9833363713 👈 ♀️...
Night 7k to 12k Call Girls Service In Navi Mumbai 👉 BOOK NOW 9833363713 👈 ♀️...
 
Call Girls Chakan Call Me 7737669865 Budget Friendly No Advance Booking
Call Girls Chakan Call Me 7737669865 Budget Friendly No Advance BookingCall Girls Chakan Call Me 7737669865 Budget Friendly No Advance Booking
Call Girls Chakan Call Me 7737669865 Budget Friendly No Advance Booking
 
Top Rated Pune Call Girls Dapodi ⟟ 6297143586 ⟟ Call Me For Genuine Sex Serv...
Top Rated  Pune Call Girls Dapodi ⟟ 6297143586 ⟟ Call Me For Genuine Sex Serv...Top Rated  Pune Call Girls Dapodi ⟟ 6297143586 ⟟ Call Me For Genuine Sex Serv...
Top Rated Pune Call Girls Dapodi ⟟ 6297143586 ⟟ Call Me For Genuine Sex Serv...
 
PPT Item # 4 - 231 Encino Ave (Significance Only)
PPT Item # 4 - 231 Encino Ave (Significance Only)PPT Item # 4 - 231 Encino Ave (Significance Only)
PPT Item # 4 - 231 Encino Ave (Significance Only)
 
2024 Zoom Reinstein Legacy Asbestos Webinar
2024 Zoom Reinstein Legacy Asbestos Webinar2024 Zoom Reinstein Legacy Asbestos Webinar
2024 Zoom Reinstein Legacy Asbestos Webinar
 
Postal Ballots-For home voting step by step process 2024.pptx
Postal Ballots-For home voting step by step process 2024.pptxPostal Ballots-For home voting step by step process 2024.pptx
Postal Ballots-For home voting step by step process 2024.pptx
 
Zechariah Boodey Farmstead Collaborative presentation - Humble Beginnings
Zechariah Boodey Farmstead Collaborative presentation -  Humble BeginningsZechariah Boodey Farmstead Collaborative presentation -  Humble Beginnings
Zechariah Boodey Farmstead Collaborative presentation - Humble Beginnings
 
Government e Marketplace GeM Presentation
Government e Marketplace GeM PresentationGovernment e Marketplace GeM Presentation
Government e Marketplace GeM Presentation
 
Just Call Vip call girls Wardha Escorts ☎️8617370543 Starting From 5K to 25K ...
Just Call Vip call girls Wardha Escorts ☎️8617370543 Starting From 5K to 25K ...Just Call Vip call girls Wardha Escorts ☎️8617370543 Starting From 5K to 25K ...
Just Call Vip call girls Wardha Escorts ☎️8617370543 Starting From 5K to 25K ...
 
Call Girls Sangamwadi Call Me 7737669865 Budget Friendly No Advance Booking
Call Girls Sangamwadi Call Me 7737669865 Budget Friendly No Advance BookingCall Girls Sangamwadi Call Me 7737669865 Budget Friendly No Advance Booking
Call Girls Sangamwadi Call Me 7737669865 Budget Friendly No Advance Booking
 
CBO’s Recent Appeals for New Research on Health-Related Topics
CBO’s Recent Appeals for New Research on Health-Related TopicsCBO’s Recent Appeals for New Research on Health-Related Topics
CBO’s Recent Appeals for New Research on Health-Related Topics
 
Human-AI Collaboration for Virtual Capacity in Emergency Operation Centers (E...
Human-AI Collaborationfor Virtual Capacity in Emergency Operation Centers (E...Human-AI Collaborationfor Virtual Capacity in Emergency Operation Centers (E...
Human-AI Collaboration for Virtual Capacity in Emergency Operation Centers (E...
 
Tuvalu Coastal Adaptation Project (TCAP)
Tuvalu Coastal Adaptation Project (TCAP)Tuvalu Coastal Adaptation Project (TCAP)
Tuvalu Coastal Adaptation Project (TCAP)
 
The NAP process & South-South peer learning
The NAP process & South-South peer learningThe NAP process & South-South peer learning
The NAP process & South-South peer learning
 
WORLD DEVELOPMENT REPORT 2024 - Economic Growth in Middle-Income Countries.
WORLD DEVELOPMENT REPORT 2024 - Economic Growth in Middle-Income Countries.WORLD DEVELOPMENT REPORT 2024 - Economic Growth in Middle-Income Countries.
WORLD DEVELOPMENT REPORT 2024 - Economic Growth in Middle-Income Countries.
 
Finance strategies for adaptation. Presentation for CANCC
Finance strategies for adaptation. Presentation for CANCCFinance strategies for adaptation. Presentation for CANCC
Finance strategies for adaptation. Presentation for CANCC
 

Covid 19 immigration effects April 2021

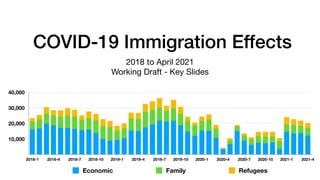
  • 1. COVID-19 Immigration Effects 2018 to April 2021 Working Draft - Key Slides 10,000 20,000 30,000 40,000 2018-1 2018-4 2018-7 2018-10 2019-1 2019-4 2019-7 2019-10 2020-1 2020-4 2020-7 2020-10 2021-1 2021-4 Economic Family Refugees
  • 2. Programs Examined • Permanent Residents/Immigrants (PRs): Economic, Family and Refugees • TR to Permanent Resident transition • Asylum Claimants • Temporary Residents/International Mobility Program (IMP): International Agreements (e.g., NAFTA, GATS), Canadian Interests (e.g., intra-corporate transfers, work exchange programs, post-graduate employment, spouses) • Temporary Residents/Temporary Foreign Worker Program (TFWP): caregivers, agriculture workers, other workers with Labour Market Impact Assessment (LMIA) • Study Permits (international students) • Settlement Services • Citizenship • Visitor Visas 2
  • 3. April 2021 Highlights • Given travel restrictions and initial shutdown, large gap between April 2021 and April 2020. Two year comparison (April 2019) more signi fi cant. • April immigration continued to come back closer to traditional levels, re fl ecting government decision to use inventory of temporary residents to transition to permanent residency: First four months 91,530 permanent resident admissions, annualized would be about 275,000 (but likely to be higher) • PRs: Admissions decreased slightly from 22,410 in March to 21,105 in April. April Year-over-year change (change from 2019 in parentheses): Economic 280.8% (-18.2%), Family 544.2% (-38.5%), Refugees 1,800% (-18.8%) • Applications: Increase from 24,195 in March to 26,048 in April. April year-over-year change (change from 2019): 31.7% (-21.7%) • Web “Immigrate to Canada”: Increase from 362,518 in April (outside Canada) to 440,452 in May. May year-over-year change (change from 2019): 20.4% (13.9%) • Provincial Nominee Program: Increase from 2,645 in March to 2,880 in April. April year-over-year change (change from 2019): 122.4% (-36.5%) • TR to PRs transition (i.e., those already in Canada): Decrease from 12,625 in March (some double counting) to 11,520 in April. April year-over-year change (change from 2019): 351.8% (49.0%) • Temporary Residents: • TRs/IMP: Sharp decline from 31,115 in March to 19,815 in April. April year-over-year (two year change): Agreements 121.9% (-34.2%), Canadian Interests: -16.7% (19.7%). Other IMP Participants (largely open work permits granted to Hong Kong residents who hold HSAR or BNO passports) 9,237.5% • TRs/TFWP: Increase from 14,545 in March to 17,140 in April. April year-over-year increase (two year change): Caregivers 246.4% (-18.5%), Agriculture 3.9% (0.7%) and Other LMIA 168% (29.5%). • Web “Get a work permit”: From 54,203 in April (outside Canada) to 60,050 in May. May year-over-year change (change from 2019): -2.9% (-26.2%) • Students: Increase from 22,790 in March to 31,200 in April. April year-over-year change (change from 2019): 63.9% (-2.6%) • Applications: Slight increase from 44,073 in March to 45,683 in April. April year-over-year change (change from 2019): 1,104.4% (37.8%) • Web “Get a study permit”: From 92,843 in April (outside Canada) to 122,865 in May Year-over-year change (change rom 2019): 88.1% (47.5%) • Asylum Claimants: Decrease from 1,280 in March (about 75% inland) to 1,110 in April. April year-over-year change (change from 2019): -29.3% (-74.3%) • Settlement Services (December): Decline from 48,700 in November to 42,890 in December. December year-over-year (change from 2019): 21.6% (-17.1%) • Web “Find immigrant services hear you”: From 8,608 in April (outside Canada) to 9,524 in May. May year-over-year change (change from 2019): -3.5% (7.2%) • Citizenship: Almost tripling from 2,561 in March to 6,825 in April. April year-over-year change (change from 2019): no number given April 2020 shutdown (-63.9%) • Applications: From 16,783 in February to 6,069 in March. March year-over-year change (change from 2019): -70.4% (-76.1%) • “Apply for citizenship”: From 19,161 in April (outside Canada) to 21,717 in May. May year-over-year change (change from 2019): -23.6% (95.0%) • Visitor Visas: Decrease from 4,431 in March to 4,199 in April. April year-over-year change (change from 2019): 164.1% (-96.4%) 3
  • 4. Overall Decline Across all Programs April-December 2019-20 Comparison 4 PR Applications PR Admissions Asylum Claimants Temporary Workers IMP Temporary Workers TFWP Study Permit Applications Study Permit Holders Citizenship Applications New Citizens Settlement Services Visitor Visas -120% -90% -60% -30% 0% -95.7% -21.4% -74.7% -30.1% -34.5% -59.1% -12.6% -3.8% -77.6% -58.1% -59.9%
  • 6. PR Applications: Region of Citizenship —2018-21 15,000 30,000 45,000 60,000 2018-1 2018-4 2018-7 2018-10 2019-1 2019-4 2019-7 2019-10 2020-1 2020-4 2020-7 2020-10 2021-1 2021-4 Asia Africa Americas Europe Oceania 6
  • 7. Admissions: PRs by Categories—2018-21 10,000 20,000 30,000 40,000 2018-1 2018-4 2018-7 2018-10 2019-1 2019-4 2019-7 2019-10 2020-1 2020-4 2020-7 2020-10 2021-1 2021-4 Economic Family Refugees 7
  • 8. Admissions: PRs Region of Citizenship—2018-21 25% 50% 75% 100% 2018-1 2018-4 2018-7 2018-10 2019-1 2019-4 2019-7 2019-10 2020-1 2020-4 2020-7 2020-10 2021-1 2021-4 Asia Africa Americas Europe Oceania 8
  • 9. Admissions: Provincial Nominee Program— 2018-21 2,250 4,500 6,750 9,000 2018-1 2018-4 2018-7 2018-10 2019-1 2019-4 2019-7 2019-10 2020-1 2020-4 2020-7 2020-10 2021-1 2021-4 9
  • 10. Admissions: PRs Total, Provincial Nominee Program Two-Year Comparison (monthly) -90% -67.5% -45% -22.5% 0% 22.5% 45% 67.5% 90% 2019-1 2019-3 2019-5 2019-7 2019-9 2019-11 2020-1 2020-3 2020-5 2020-7 2020-9 2020-11 2021-1 2021-3 -36.5% -50.4% -5.6% 26.7% -55.5% -40% -55.7% -49.9% -77.7% -61.4% -30.9% -50.2% -71.4% -32.7% 45.6% 64.7% 13.5% 43.2% 38.4% 36.8% 57.3% 43.2% 25.4% -1.6% -29.7% -18.7% -36.2% -32.4% -21.6% -17.2% -9.9% -0.3% -48.5% -39.1% -51.8% -57.7% -64.2% -62.7% -44.2% -66.8% -84.6% -29.4% 28.1% 32.7% -4.1% 9.5% 18.3% 27.1% 24.7% 26.1% 14.3% 14.8% -6.6% -12.2% -21.1% -20.9% PRs Total PNP 10
  • 11. Admissions: PRs Canada Total April Comparison: 2021/20, 2021/19 -450% 0% 450% 900% 1,350% 1,800% Economic Family Refugees 23% -28.8% 19.6% -18.8% -38.5% -18.2% 1,800% 544.2% 280.8% April 2021/20 April 2021/19 Q1 11
  • 12. Admissions: PNP Provinces April Comparison: 2021/20, 2021/19 -100% 75% 250% 425% 600% Atlantic ON MB SK AB BC -31.7% -29.7% -51.3% -53.3% -45.2% -49.6% -45.9% -27.8% -44.1% -14.3% -47.8% -61.8% 522.2% 40.5% 100% 228.6% 42.4% 160% April 2021/20 April 2021/19 2020 12
  • 13. Admissions: Permanent Residents by Citizenship April Comparison: 2021/20, 2021/19 Top 10 Countries — Ordered by 2018 base year -100% 150% 400% 650% 900% India Philippines China Syria Nigeria USA Pakistan France Eritrea UK -38.5% -62.6% -7.5% -42.6% -40% -49.6% -52.2% -44.7% -60.3% -49.7% 11.9% -53.1% 131.3% -39% -13.9% 8.9% -71.7% -29.1% -69% -18.3% 370% 411.1% 761.1% 170.3% 369.7% 816.7% 680% 312.4% 110.1% 520.6% April 2021/20 April 2021/19 2020 13
  • 14. Admissions: Temporary to Permanent Residents By Program—2018-21 3,500 7,000 10,500 14,000 2018-1 2018-4 2018-7 2018-10 2019-1 2019-4 2019-7 2019-10 2020-1 2020-4 2020-7 2020-10 2021-1 2021-4 IMP Post-Graduate WP Students TFWP 14
  • 15. Admissions by Province: TRs to PRs April Comparison: 2021/20, 2021/19 -80% 940% 1,960% 2,980% 4,000% Atlantic QC ON MB SK AB BC -28.1% -32.3% -51.9% -39.2% -27.3% -20.8% -41.2% 64.9% -6.3% 3% 142.9% 50.7% 215.7% -28.1% 1,622.2% 87.4% 353.3% 376% 239.6% 3,175% 1,433.3% April 2021/20 April 2021/19 2020 15
  • 16. Admissions: TRs to PRs April Comparison: 2021/20, 2021/19 -125% 0% 125% 250% 375% 500% IMP Post-Graduate WP Students TFWP -41.6% -32.6% -28.8% -29.9% 8.3% 35.8% 49.1% 55.8% 435.3% 465.1% 317% 348.5% April 2021/20 April 2021/19 2020 16
  • 17. Asylum Claimants: Of fi ce Type 2018-21 1,750 3,500 5,250 7,000 2018-1 2018-4 2018-7 2018-10 2019-1 2019-4 2019-7 2019-10 2020-1 2020-4 2020-7 2020-10 2021-1 2021-4 Airport Border Inland 17
  • 18. Asylum Claimants: Year-over-year April Comparison: 2021/20, 2021/19 -110% 142.5% 395% 647.5% 900% Airport Border Inland -54% -72.2% -77.1% -63.9% -84.2% -90.9% -45.9% 571.4% 900% April 2021/20 April 2021/19 2020 18
  • 19. Asylum Claimants: Year-over-year April Comparison: 2021/20, 2021/19 -100% -60% -20% 20% 60% India Mexico Iran Nigeria Colombia Pakistan China Turkey Haiti USA -85% -54.5% -53.8% -74.2% -90.9% -71.4% -93% -66.7% -71.4% -77.3% 50% -28.6% 0% 14.3% -75% 60% 25% -63.8% -31.3% -47.6% April 2021/20 April 2021/19 19
  • 20. Immigrate to Canada—Web Interest 250,000 500,000 750,000 1,000,000 2018-1 2018-4 2018-7 2018-10 2019-1 2019-4 2019-7 2019-10 2020-1 2020-4 2020-7 2020-10 2021-1 2021-4 Canada Asia Americas Africa Europe Oceania Not speci fi ed 20
  • 21. Immigrate to Canada—Web Interest May Comparison: 2021/20, 2021/19 Top 10 Countries by “Get a work permit” ordered by site visits, 2018 base year -70% -52.5% -35% -17.5% 0% 17.5% 35% 52.5% 70% India USA Nigeria UK UAE Pakistan Philippines Mexico Saudi Arabia Brazil -54.9% 23.3% 24.2% -55.4% -1.6% -5.5% -4% 11.3% -0.4% 24.5% -4.1% 12.9% -23.7% 41% 53.2% 4.4% -28.9% 17.3% -36.6% 66.7% May 2021/20 May 2021/19 21
  • 23. IMP & TFWP Work Permit Holders—2018-21 12,500 25,000 37,500 50,000 2018-1 2018-5 2018-9 2019-1 2019-5 2019-9 2020-1 2020-5 2020-9 2021-1 Agreements Cdn Interests Other IMP Not Stated Caregivers Agriculture LMIA 23
  • 24. IMP by Region of Citizenship—2018-21 0% 25% 50% 75% 100% 2018-1 2018-4 2018-7 2018-10 2019-1 2019-4 2019-7 2019-10 2020-1 2020-4 2020-7 2020-10 2021-1 2021-4 Asia Europe Americas Africa Oceania 24
  • 25. TFWP by Region of Citizenship—2018-21 0% 25% 50% 75% 100% 2018-1 2018-4 2018-7 2018-10 2019-1 2019-4 2019-7 2019-10 2020-1 2020-4 2020-7 2020-10 2021-1 2021-4 Americas Asia Europe Africa Oceania 25
  • 26. IMP & TFWP Work Permit Holders Total Year to Year Comparison (Monthly) -80% -40% 0% 40% 80% 120% 160% 2019-1 2019-3 2019-5 2019-7 2019-9 2019-11 2020-1 2020-3 2020-5 2020-7 2020-9 2020-11 2021-1 2021-3 IMP TFWP 26
  • 27. Temporary Residents by Program Canada April Comparison: 2021/20, 2021/19 -75% 0% 75% 150% 225% 300% Agreements Canadian Interests Caregivers Agriculture LMIA -12.7% -6.1% -49% -7.9% -31.1% 29.5% -0.7% -18.5% -19.7% -34.2% 168% 3.9% 246.4% -16.7% 121.9% April 2021/20 April 2021/19 2020 27
  • 28. IMP by Citizenship April Comparison: 2021/20, 2021/19 Top 10 Countries—Ordered by 2018 base year -175% 0% 175% 350% 525% 700% India USA France China UK Australia Ireland Korea Brazil Japan -84% -30.4% -54.8% -72.6% -80.8% -60.6% 19.7% -54.6% -53.5% 30.8% 113.3% -32% 17.2% 155.6% 92.3% 116.1% 28.3% 140.2% 671.4% -15.1% April 2021/20 April 2021/19 28
  • 29. TFWP by Citizenship April Comparison: 2021/20, 2021/19 Top 10 Countries—Ordered by 2018 base year -150% 187.5% 525% 862.5% 1,200% Mexico Jamaica Guatemala Philippines India Korea USA UK China France 33.3% -28.8% 22.2% -63.6% -13.9% 2.8% 22.6% 39% -14% 2.2% 600% 270% 633.3% 1,100% 47.6% 73.6% 171.3% 52% -10.4% 4.8% April 2021/20 April 2021/19 29
  • 30. Work Permits—Web Interest 40,000 80,000 120,000 160,000 2018-1 2018-4 2018-7 2018-10 2019-1 2019-4 2019-7 2019-10 2020-1 2020-4 2020-7 2020-10 2021-1 2021-4 Canada Asia Americas Europe Oceania Africa Not captured 30
  • 31. Work Permits—Web Interest May Comparison—2021/20, 2021/19 Top 10 Countries by “Get a work permit” ordered by site visits, 2018 base year -70% -52.5% -35% -17.5% 0% 17.5% 35% 52.5% India USA Mexico UK Australia Pakistan Brazil Philippines UAE Saudi Arabia -5.2% -24.7% 30.3% -11.5% -19.3% -64.9% -36.4% 0.8% -41% -25.9% -10.6% 5.4% 30.6% 5.7% 17.2% -27.8% -19.5% -11.4% -34.7% 27.9% May 2021/20 May 2021/19 31
  • 33. Study Permit Applications—By Region—2018-21 17,500 35,000 52,500 70,000 2018-1 2018-4 2018-7 2018-10 2019-1 2019-4 2019-7 2019-10 2020-1 2020-4 2020-7 2020-10 2021-1 2021-4 Asia Africa Americas Europe Oceania 33
  • 34. Study Permit Holders—By Level—2018-21 30,000 60,000 90,000 120,000 2018-1 2018-4 2018-7 2018-10 2019-1 2019-4 2019-7 2019-10 2020-1 2020-4 2020-7 2020-10 2021-1 2021-4 Secondary or less Post Secondary Other Studies 34
  • 35. Study Permit Holders—By Region—2018-21 0% 25% 50% 75% 100% 2018-1 2018-4 2018-7 2018-10 2019-1 2019-4 2019-7 2019-10 2020-1 2020-4 2020-7 2020-10 2021-1 2021-4 Asia Africa Americas Europe Oceania 35
  • 36. Study Permit Holders by Citizenship April Comparison: 2021/20, 2021/19 Top 10 Countries — Ordered by Number of Permits, 2018 base year -200% 0% 200% 400% 600% 800% India China Korea France Vietnam Brazil Iran Japan USA Nigeria 29.7% 15.6% 20.7% 33.6% -55.3% -20.4% 21.1% -42.9% -48% 8% 34.6% 766.7% 360.5% 24.8% -39.3% -29.9% 43.8% -12.4% -29.2% 172.5% April 2021/20 April 2021/19 36
  • 37. Study Permit Holders by Province April Comparison: 2021/20, 2021/19 -90% -42.5% 5% 52.5% 100% Atlantic QC ON MB SK AB BC -28.2% -34.4% -41.8% -26.5% -36.5% -21.5% -46.8% -11.7% 7.4% -11.7% -2.6% -1.4% 16.5% -15.8% 39.5% 42.4% 100.0% 55.5% 89.8% 28.0% 58.8% April 2021/20 April 2021/19 2020 37
  • 38. Study Permits—Web Interest 40,000 80,000 120,000 160,000 2018-1 2018-4 2018-7 2018-10 2019-1 2019-4 2019-7 2019-10 2020-1 2020-4 2020-7 2020-10 2020-1 2021-4 Canada Asia Americas Africa Europe Oceania Not captured 38
  • 39. Study Permits—Web Interest May Comparison: 2021/20, 2021/19 Top 10 Countries by “Get your study permit” ordered by site visits, 2018 base year -150% -75% 0% 75% 150% 225% 300% India USA China Nigeria Brazil PhilippinesColombia Mexico Iran Pakistan 33.5% -90.7% 92.1% 158.3% 168.4% 14.9% 81.9% -45.5% 33.7% 96.6% 58.9% -81.6% 99.5% 239.8% 236.4% 81.8% 88.7% 9.4% 31.3% 149.5% May 2021/20 May 2021/19 39
  • 41. Settlement—By Service—2018-20 In Canada Services—Top 25 Countries 20,000 40,000 60,000 80,000 2018-1 2018-4 2018-7 2018-10 2019-1 2019-4 2019-7 2019-10 2020-1 2020-4 2020-7 2020-10 Community Connections Employment Related Services Information and Orientation Services Language Assessment Language Training Needs & Assets Assessment and Referrals Resettlement Assistance Program Service Delivery Improvement 41
  • 42. Settlement Services Year-over-year Comparison by Service—December 2020, Last Quarter Community Employment Information/Orientation Language Assessment Language Training Needs Assessment, Referrals Resettlement Assistance -100% -72.5% -45% -17.5% 10% -88.2% -30.5% -13.3% -71.1% 1.5% -24.3% -23.3% -48.4% -29.3% -9.8% -68.2% -9.1% -36.2% -40.3% December 2020 July-September 42
  • 43. Settlement Services Year-over-year Comparison by Province—December 2020, Last Quarter -50% -37.5% -25% -12.5% 0% Atlantic QC ON MB SK AB BC -18.4% -23.2% -24.8% -26.5% -7.4% -28.4% -45.8% -19.7% -13.4% -24.1% -35.8% -15.9% -28.9% -21.8% December 2020 July-September 43
  • 44. Settlement Services by Citizenship Year-over-year Comparison—December 2020, Last Quarter Top 10, 2018 base year -40% -30% -20% -10% 0% 10% Syria Eritrea Congo Somalia Afghanistan India Pakistan Korea Mexico Philippines -14.3% -15.4% -29.3% -16.6% -15.6% -15.9% -28.1% -24.5% -17.4% -23.5% -38.3% -26.1% -17.3% -18.8% -2.2% 0.9% -32.5% -36.4% -23.3% -20.2% December 2020 July-September 44
  • 46. Settlement Services—Web Interest May Comparison: 2021/20, 2021/19 Top 10 Countries by “Find immigrant services near you” ordered by site visits, 2018 base year -50% 0% 50% 100% 150% 200% India USA Brazil UAE Pakistan Nigeria Mexico UK ColombiaPhilippines 49.3% 195.2% 12.7% 37.4% -4.8% 51.5% 2% 36.7% -26.1% 21.5% 17.5% 167.1% -14.5% -9.3% -11.9% 39.2% -22% -10.6% -20.5% 24% May 2021/20 May 2021/19 46
  • 48. Citizenship Applications—2018-21 7,500 15,000 22,500 30,000 2018-1 2018-4 2018-7 2018-10 2019-1 2019-4 2019-7 2019-10 2020-1 2020-4 2020-7 2020-10 2021-1 48
  • 49. New Citizens—By Region of Birth—2018-21 7,500 15,000 22,500 30,000 2018-1 2018-4 2018-7 2018-10 2019-1 2019-4 2019-7 2019-10 2020-1 2020-4 2020-7 2020-10 2021-1 2021-4 Asia Africa Americas Europe Oceania 49
  • 50. Citizenship by Region of Birth April Comparison: 2021/19 Top 10 Countries—Ordered by 2018 base year 2021/20 Comparison not calculable given complete shutdown April 2020 -80% -60% -40% -20% 0% Philippines India Iran China Pakistan Nigeria USA Egypt Iraq France -66.2% -67.8% -63.4% -64.3% -63.8% -70.2% -74.1% -74.8% -59% -56.7% April 2021/20 April 2021/19 50
  • 51. Citizenship—Web Interest Note: Technical anomaly April - December 2019 45,000 90,000 135,000 180,000 2018-1 2018-4 2018-7 2018-10 2019-1 2019-4 2019-7 2019-10 2020-1 2020-4 2020-7 2020-10 2021-1 2021-4 Canada Americas Asia Europe Africa Oceania Not captured 51
  • 52. Citizenship—Web Interest May Comparison: 2021/20, 2021/19 Top 10 Countries by “Apply for Citizenship” ordered by site visits, 2018 base year -75% 0% 75% 150% 225% 300% USA India UK Pakistan UAE Nigeria China Brazil Turkey Bangladesh 255.5% 118% 88.1% 60.5% 68.3% 103.6% 157.1% 57.3% 150.4% 62.6% -22.2% 48.3% -23.8% 1.4% 13.7% -1.1% 39.3% -50.8% 24.6% -51.5% May 2021/20 May 2021/19 52
  • 54. Visitor Visas—By Source Country—2018-21 45,000 90,000 135,000 180,000 2018-1 2018-4 2018-7 2018-10 2019-1 2019-4 2019-7 2019-10 2020-1 2020-4 2020-7 2020-10 2021-1 2021-4 Asia Americas Africa Europe Oceania Other 54
  • 55. Visitor Visas—By Source Country April Comparison: 2021/20, 2021/19 Top 10 Countries—Ordered by 2018 base year -1,000% 0% 1,000% 2,000% 3,000% 4,000% China India Philippines Iran Brazil Vietnam Colombia Algeria Pakistan Russia -91.1% -90.9% -98.2% -98.2% -99% -97.7% -86.7% -94.3% -97.7% -98.2% 1,022.2% 680% -87.8% -87.8% 18.5% 1,850% 3,158.3% 214.9% 833.3% 562.7% April 2021/20 April 2021/20 55
  • 56. Research Questions 56 • Which programs contracted most quickly and which source countries were most a ff ected? Similarly, which programs and source countries recovered more quickly? • Did application success rates vary pre and post-COVID by source country? • Were exogenous factors such as US immigration restrictions or tensions with China a factor? • Did interest in immigrating to Canada increase or decrease and for which countries?
  • 58. Top Countries Share of Total (2018) 10 Countries 25 Countries Permanent Residents 60.9% 77.7% IMP 70.8% 86.4% TFWP 85.2% 93.2% Study Permits 70.3% 73.8% Asylum Claimants 57.4% 77.4% Citizenship 50.3% 71.5% 58
  • 59. Top Countries (2018) Permanent Residents IMP TFWP Students Settlement Citizenship India 69,980 India 55,610 Mexico 28,860 India 107,105 Syria 15,530 Philippines 19,647 Philippines 35,050 USA 26,540 Jamaica 10,200 China 85,100 Eritrea 11,865 India 19,486 China 29,710 Finland 23,445 Guatemala 9,810 Korea 16,875 Congo 11,355 Iran 10,037 Syria 12,045 China 21,910 Philippines 8,750 Vietnam 12,370 Somalia 10,785 PRC 9,718 Nigeria 10,920 UK 11,205 India 7,380 Iran 7,040 Afghanistan 9,550 Pakistan 9,406 USA 10,905 Australia 8,850 Korea 1,960 Japan 6,685 India 9,035 Nigeria 4,398 Pakistan 9,490 Ireland 8,675 USA 1,850 Bangladesh 4,155 Pakistan 8,360 USA 4,229 France 6,175 Korea 8,105 UK 940 Philippines 4,075 Korea of 7,775 Egypt 4,115 Eritrea 5,695 Brazil 8,080 China 935 Taiwan 3,160 Mexico 7,640 Iraq 3,951 UK 5,660 Japan 7,250 France 915 Saudi Arabia 2,870 Philippines 6,995 France 3,836 59
  • 60. Data Sources • PRs: Canada - Admissions of Permanent Residents by Province/Territory of Intended Destination and Immigration Category, Canada - Admissions of Permanent Residents by Country of Citizenship, COVID Immigration Impact - PR Applications Source Countries • TR to Permanent Resident transition: Canada – Admissions of Permanent Residents with Prior Post-graduate Work Permit Holder Status by Province/Territory of Intended Destination and Immigration Category, Canada – Admissions of Permanent Residents with Prior International Mobility Program Work Permit Holder Status by Province/Territory of Intended Destination and Immigration Category, Canada – Admissions of Permanent Residents with Prior Study Permit Holder Status by Province/Territory of Intended Destination and Immigration Category, Canada – Admissions of Permanent Residents with Prior Temporary Foreign Worker Program Work Permit Holder Status by Province/Territory of Intended Destination and Immigration Category • Asylum Claimants: Canada - Asylum Claimants by Claim O ffi ce Type, Province/Territory* of Claim and Claim Year, Canada - Asylum Claimants by Top Twenty-Five Countries of Citizenship (2019 ranking), Claim O ffi ce Type and Claim Year • TRs: Canada - International Mobility Program (IMP) work permit holders by province/territory of intended destination, program and year in which permit(s) became e ff ective, Canada - Temporary Foreign Worker Program (TFWP) work permit holders by province/territory of intended destination, program and year in which permit(s) became e ff ective, Canada – International Mobility Program work permit holders by country of citizenship and year in which permit(s) became e ff ective, Canada – Temporary Foreign Worker Program work permit holders by country of citizenship and year in which permit(s) became e ff ective • Study Permits: Canada - Study permit holders by country of citizenship and year in which permit(s) became e ff ective, Canada - Study permit holders by province/territory of intended destination, study level and year in which permit(s) became e ff ective, Source Countries - Applications Processed by IRCC for New Study Permit Applications • Settlement Services: Special request IRCC data table • Citizenship: Source Countries (Country of Birth) - New Canadian Citizens (in Persons) by Month • Web: Provided by IRCC 60