SlideShare a Scribd company logo
1 of 60
Download to read offline
COVID-19 Immigration Effects
2018 to March 2022

Working Draft - Key Slides
12,500
25,000
37,500
50,000
2018-1 2018-4 2018-7 2018-10 2019-1 2019-4 2019-7 2019-10 2020-1 2020-4 2020-7 2020-10 2021-1 2021-4 2021-7 2021-10 2022-1
Economic - PNP Economic - Fed Family Refugees Other
Programs Examined
• Permanent Residents/Immigrants (PRs): Economic (PNP and Federal), Family and Refugees

• TR to Permanent Resident transition

• Asylum Claimants

• Temporary Residents/International Mobility Program (IMP): International Agreements (e.g., NAFTA, GATS),
Canadian Interests (e.g., intra-corporate transfers, work exchange programs, post-graduate employment,
spouses)

• Temporary Residents/Temporary Foreign Worker Program (TFWP): caregivers, agriculture workers, other
workers with Labour Market Impact Assessment (LMIA)

• Study Permits (international students)

• Settlement Services


• Citizenship 

• Visitor Visas
2
February 2021 Highlights
• PRs: Admissions Increase 37,130 in February to 40,765 in March. March Year-over-year change (change from 2020 in parentheses): Economic - PNP 146.0%
(82.6%), Economic - Federal 49.2% (135.0%), Family 109.7% (57.2%), Refugees 95.8% (204.8%)


• Applications: Decrease from 10,497 in February to 8,401 in March. March year-over-year change (change from 2020): -85.5% (-71.7%). Note: Given delays in entering applications in processing systems, the last few months understate the number of
applications


• Express Entry and Arrima Invitations to Apply: From 3,396 in March to 1,649 in April. April year-over-year change (change from 2020): -90.7% (-85.9%)


• Web “Immigrate to Canada”: Decrease from 420,017 in March (outside Canada) to 396,345 in April. April year-over-year change (change from 2020): 9.3% (48.9%)


• TR to PRs transition (i.e., those already in Canada): Decline from 22,185 in February (some double counting) to 20,725 in March. March year-over-year change (change from 2020): 64.2% (291.4%)


• Temporary Residents:


• TRs/IMP: Increase from 22,165 in February to 25,810 in March. March year-over-year (change from 2020): Agreements: -3.6% (54.7%), Canadian Interests: -22.7% (79.1%), Other IMP Participants -53.5% (5,411.1%), Not stated 265.5% (23.6%)


• TRs/TFWP: Near doubling from 7,235 in February to 13,295 in March (agriculture workers). March year-over-year change (change from 2020): Caregivers -50.4% (50.0%), Agriculture 1.3% (177.9%) and Other LMIA -20.6% (70.6%).


• Web “Get a work permit”: Increase from 79,971 in March (outside Canada) to 88,759 in April. April year-over-year change (change from 2020): 47% (83.4%)


• Students: Stable, from 25,235 in February to 25,780 in March. March year-over-year change (change from 2020): 13.1% (131.6%)


• Applications: Increase from 46,718 in February to 45,648 in March. March year-over-year change (change from 2020): 3.6% (145.2%)


• Web “Get a study permit”: Increase from 75,576 in March (outside Canada) to 87,699 in April. April Year-over-year change (change from 2020): -5.6% (101%)


• Asylum Claimants: Increase from 5,240 in February (half at border) to 6,080. March year-over-year change (change from 2020): 375.0% (69.8%)


• Irregular arrivals (Roxham Road etc) increased from 2,164 in February to 2,502 in March. March year-over-year change (change from 2020): 6,850.0% (169.0%)


• Settlement Services (December 2020 - awaiting more recent): Decline from 48,700 in November to 42,890 in December. December year-over-year (change from
2020): 21.6% (-17.1%)


• Web “Find immigrant services near you”: Increase from 4,345 in March (outside Canada) to 5,206 in April. April year-over-year change (change from 2020): -39.5% (-16.5%). In Canada: -41.8% (-11.3%)


• Citizenship: Increase from 30,195 in February to 41,678 in March. March year-over-year change (change from 2020): 1,527.4% (341.6%)


• Applications (awaiting more recent): From 19,005 in May to 18,189 in June. June year-over-year change (change from 2020): 21.6% (-11.7%)


• “Apply for citizenship”: Increase from 17,583 in March (outside Canada) to 20,204 in April. April year-over-year change (change from 2020): 5.4% (-11.8%). In Canada: 2.7% (64.3%)


• Visitor Visas: Increase from 65,989 in February to 88,615 in March driven by Ukrainians. March year-over-year change (change from 2020): 1,899.9% (117.3%).
Visas to Russians reverted to normal levels
3
Change Across Major Programs


2021 Compared to 2018 Baseline
4
PR Applications
PR Admissions - PNP
PR Admissions - Fed
Asylum Claimants
Temporary Workers IMP
Temporary Workers TFWP
Study Permit Applications
Study Permit Holders
Citizenship App. (Jan-June)
New Citizens
Settlement Services (2020/19)
Visitor Visas
-100% -57.5% -15% 27.5% 70%
-82.1%
-14.1%
-37.6%
-20.6%
27.3%
64.2%
24.1%
34.8%
-44.9%
60.2%
-14.3%
-43.1%
Permanent Residents
5
Express Entry & Arrima Invitations—2018-22
7,500
15,000
22,500
30,000
2018-1 2018-5 2018-9 2019-1 2019-5 2019-9 2020-1 2020-5 2020-9 2021-1 2021-5 2021-9 2022-1
CEC PNP No Program Federal Skilled Trades QC Arrima
6
PR Applications: Region of Citizenship —2018-22
30,000
60,000
90,000
120,000
2018-1 2018-4 2018-7 2018-10 2019-1 2019-4 2019-7 2019-10 2020-1 2020-4 2020-7 2020-10 2021-1 2021-4 2021-7 2021-10 2022-1
Asia Africa Americas Europe Oceania
7
Note: Given delays in entering applications in processing systems, the last few months understate the number of applications. May
2021 surge driven by applications from India
Admissions: PRs by Categories—2018-22
12,500
25,000
37,500
50,000
2018-1 2018-4 2018-7 2018-10 2019-1 2019-4 2019-7 2019-10 2020-1 2020-4 2020-7 2020-10 2021-1 2021-4 2021-7 2021-10 2022-1
Economic - PNP Economic - Fed Family Refugees Other
8
Admissions: PRs Region of Citizenship—2018-22
25%
50%
75%
100%
2018-1 2018-4 2018-7 2018-10 2019-1 2019-4 2019-7 2019-10 2020-1 2020-4 2020-7 2020-10 2021-1 2021-4 2021-7 2021-10 2022-1
Asia Africa Americas Europe Oceania
9
Admissions: Provincial Nominee Program—
2018-22
2,250
4,500
6,750
9,000
2018-1 2018-4 2018-7 2018-10 2019-1 2019-4 2019-7 2019-10 2020-1 2020-4 2020-7 2020-10 2021-1 2021-4 2021-7 2021-10 2022-1
10
Admissions: PRs Canada Total


March Comparison: 2022/21, 2022/20, Full year 2021/18
-75%
0%
75%
150%
225%
300%
Economic - PNP Economic - Fed Family Refugees
25.2%
-5.8%
60.2%
-14.3%
204.8%
57.2%
135%
82.6%
95.8%
109.7%
49.2%
146%
March 2022/21 March 2022/20 Full year 2021/18
11
Admissions: PNP Provinces


March Comparison: 2022/21, 2022/20, Full year 2021/18
-125%
0%
125%
250%
375%
500%
Atlantic ON MB SK AB BC
54.2%
-5.2%
-29.9%
8.6%
43.7%
33.3%
80%
113.3%
500%
190.6%
56.9%
116.9%
165.1%
97.9%
132.6%
84.2%
181.8%
321.7%
March 2022/21 March 2022-20 Full year 2021/18
12
Admissions: Permanent Residents by Citizenship


March Comparison: 2022/21, 2022/20, Full year 2021/18 

Top 10 Countries — Ordered by 2018 base year
-100%
0%
100%
200%
300%
India Philippines China Syria Nigeria USA Pakistan France Eritrea UK
15.5%
-6.2%
105.2%
-12.2%
9.1%
42.2%
-53.7%
4.2%
-48.8%
82.2%
63.5%
68.8%
262.1%
23.8%
55.6%
156.3%
33.3%
89.8%
66.9%
123.7%
21.2%
157.1%
25.8%
117.6%
37.4%
41%
77.8%
38.3%
199.3%
67.6%
March 2022/21 March 2022/20 Full year 2021/18
13
Admissions: Temporary to Permanent Residents

By Program—2018-22
10,000
20,000
30,000
40,000
2018-1 2018-4 2018-7 2018-10 2019-1 2019-4 2019-7 2019-10 2020-1 2020-4 2020-7 2020-10 2021-1 2021-4 2021-7 2021-10 2022-1
IMP Post-Graduate WP Students TFWP
14
Admissions by Province: TRs to PRs


March Comparison: 2022/21, 2022/20, Full year 2021/18 

-155%
59%
273%
486%
700%
Atlantic QC ON MB SK AB BC
204.9%
64.8%
24.6%
236.2%
313.3%
67.5%
205%
273.1%
104.3%
160.5%
325%
303.6%
605.8%
398.7%
105.6%
93.3%
67.8%
87%
25.7%
96.4%
312%
March 2022/21 March 2022/20 Full year 2021-18
15
Admissions: TRs to PRs


March Comparison: 2022/21, 2022/20, Full year 2021/18 

0%
100%
200%
300%
400%
IMP Post-Graduate WP Students TFWP
136.5%
106.5%
260%
204.5% 194.5%
253.2%
334.5%
287.5%
95.2%
72.4%
64.9%
60.5%
March 2022/21 March 2022/20 Full year 2021/18
16
Asylum Claimants: Of
fi
ce Type 2018-22
1,750
3,500
5,250
7,000
2018-1 2018-4 2018-7 2018-10 2019-1 2019-4 2019-7 2019-10 2020-1 2020-4 2020-7 2020-10 2021-1 2021-4 2021-7 2021-10 2022-1
Airport Border Inland
17
Asylum Claimants: Year-over-year


March Comparison: 2022/21, 2022/20, Full year 2021/18
-750%
0%
750%
1,500%
2,250%
3,000%
Airport Border Inland
-54.7%
-56.2%
-50.1%
5.4%
158.8%
145.6% 107.2%
1,375%
2,325%
March 2022/21 March 2022-20 Full year 2021/18
18
Asylum Claimants: Year-over-year


March Comparison: 2022/21, 2022/20, Full year 2021/18
-400%
0%
400%
800%
1,200%
1,600%
India Mexico Iran Nigeria Colombia Pakistan China Turkey Haiti USA
-78.4%
37.1%
-8.7%
-67.9%
-62.1%
-23.6%
-93.6%
-23.1%
-5.3%
-67%
-26.3%
276.3%
664.7%
-31.3%
9.7%
111.4%
11.1%
5.6%
97.7%
-30.7%
250%
1,488.9%
1,200%
22.2%
580%
365%
500%
192.3%
443.8%
73.3%
March 2022/21 March 2022-20 Full year 2021-18
19
Immigrate to Canada—Web Interest
250,000
500,000
750,000
1,000,000
2018-1 2018-4 2018-7 2018-10 2019-1 2019-4 2019-7 2019-10 2020-1 2020-4 2020-7 2020-10 2021-1 2021-4 2021-7 2021-10 2022-1 2022-4
Canada Asia Americas Africa Europe Oceania Not speci
fi
ed
20
Immigrate to Canada—Web Interest


April Comparison: 2022/21, 2022/20


Top 10 Countries by “Immigrate to Canada” ordered by site visits, 2018 base year
-45%
0%
45%
90%
135%
180%
India USA Nigeria UK UAE Pakistan Philippines Mexico Saudi Arabia Brazil
15.7%
63.3%
64.2%
178.8%
63%
56.5%
-14.2%
12.1%
-26.2%
15.7%
-33.4%
-2.5%
41.3%
14.5%
8.8%
3.2%
-2.8%
-8.2%
-0.3%
-20.1%
April 2022/21 April 2022/20
21
Temporary Residents
22
IMP & TFWP Work Permit Holders—2018-22
12,500
25,000
37,500
50,000
2018-1 2018-5 2018-9 2019-1 2019-5 2019-9 2020-1 2020-5 2020-9 2021-1 2021-5 2021-9 2022-1
Agreements Cdn Interests Other IMP Vulnerable Not Stated Caregivers
Agriculture LMIA 23
IMP by Region of Citizenship—2018-22
0%
25%
50%
75%
100%
2018-1 2018-4 2018-7 2018-10 2019-1 2019-4 2019-7 2019-10 2020-1 2020-4 2020-7 2020-10 2021-1 2021-4 2021-7 2021-10 2022-1
Asia Europe Americas Africa Oceania
24
TFWP by Region of Citizenship—2018-22
0%
25%
50%
75%
100%
2018-1 2018-4 2018-7 2018-10 2019-1 2019-4 2019-7 2019-10 2020-1 2020-4 2020-7 2020-10 2021-1 2021-4 2021-7 2021-10 2022-1
Americas Asia Europe Africa Oceania
25
IMP & TFWP Work Permit Holders Total


Year to Year Comparison (quarterly)
-80%
-40%
0%
40%
80%
120%
160%
2019-Q1 2019-Q2 2019-Q3 2019-Q4 2020-Q1 2020-Q2 2020-Q3 2020-Q4 2021-Q1 2021-Q2 2021-Q3 2021-Q4 2022-Q1
-19.4%
-19.8%
-1%
27.6%
72.3%
5.4%
-13.2%
-19.9%
-7%
39.3%
16.7%
15.8%
6.5%
-22.2%
-37.6%
146.6%
54.7%
57.6%
29.8%
-54.4%
-47.5%
2.6%
42.7%
10.6%
30.7%
1.5%
IMP TFWP
26
Temporary Residents by Program Canada


March Comparison: 2022/21, 2022/20, Full year 2022/18
-90%
-45%
0%
45%
90%
135%
180%
Agreements Canadian Interests Caregivers Agriculture LMIA
58.8%
13.6%
-26%
27.7%
-17.7%
70.6%
177.9%
50%
79.1%
54.7%
-20.6%
1.3%
-50.4%
-22.7%
-3.6%
March 2022/21 March 2022/20 Full year 2021/18
27
IMP by Citizenship


March Comparison: 2022/21, 2022/20

Top 10 Countries—Ordered by 2018 base year
-50%
-25%
0%
25%
50%
75%
100%
India USA France China UK Australia Ireland Korea Brazil Japan
5.6%
35.6%
-2.8%
2.1%
-16.7%
-0.8%
97.9%
23.3%
25.3%
87.7%
63%
-33.3%
-16%
75%
81.8%
26.6%
-47.5%
39.2%
11%
-43.6%
March 2022/21 March 2022/20
28
TFWP by Citizenship


March Comparison: 2022/21, 2022/20

Top 10 Countries—Ordered by 2018 base year
-75%
0%
75%
150%
225%
300%
Mexico Jamaica Guatemala Philippines India Korea USA UK China France
21.1%
50%
30%
42.9%
11.4%
24.5%
79.5%
296.6%
177.7%
221.7%
-11.5%
-53.8%
-45.8%
66.7%
-25%
-29.3%
-37.8%
30.2%
-23%
-6.3%
March 2022/21 March 2022/20
29
Work Permits—Web Interest
40,000
80,000
120,000
160,000
2018-1 2018-4 2018-7 2018-10 2019-1 2019-4 2019-7 2019-10 2020-1 2020-4 2020-7 2020-10 2021-1 2021-4 2021-7 2021-10 2022-1 2022-4
Canada Asia Americas Europe Oceania Africa Not captured
30
Work Permits—Web Interest


April Comparison: 2022/21, 2022/20


Top 10 Countries by “Get a work permit” ordered by site visits, 2018 base year
0%
150%
300%
450%
600%
India USA Mexico UK Australia Pakistan Brazil Philippines UAE Saudi Arabia
237.3%
312.5%
570.9%
69%
80.6%
53.7%
22.8%
121%
2.9%
55.5%
165.9%
149%
211.8%
1.2%
65.9%
108.7%
37.1%
63.1%
34.6%
15.1%
April 2022/21 April 2022/20
31
Study Permits
32
Study Permit Applications—By Region—2018-22
17,500
35,000
52,500
70,000
2018-1 2018-4 2018-7 2018-10 2019-1 2019-4 2019-7 2019-10 2020-1 2020-4 2020-7 2020-10 2021-1 2021-4 2021-7 2021-10 2022-2
Asia Africa Americas Europe Oceania
33
Study Permit Holders—By Level—2018-22
30,000
60,000
90,000
120,000
2018-1 2018-5 2018-9 2019-1 2019-5 2019-9 2020-1 2020-5 2020-9 2021-1 2021-5 2021-9 2022-1
Secondary or less Post Secondary Other Studies
34
Study Permit Holders—By Region—2018-22
0%
25%
50%
75%
100%
2018-1 2018-4 2018-7 2018-10 2019-1 2019-4 2019-7 2019-10 2020-1 2020-4 2020-7 2020-10 2021-1 2021-4 2021-7 2021-10 2022-1
Asia Africa Americas Europe Oceania
35
Study Permit Holders by Citizenship


March Comparison: 2022/21, 2022/20

Top 10 Countries — Ordered by Number of Permits, 2018 base year
-100%
0%
100%
200%
300%
400%
India China Korea France Vietnam Brazil Iran Japan USA Nigeria
180%
84%
351%
95%
71.2%
80%
87.5%
9.2%
31.5%
167.9%
28.4%
0%
97.3%
-2.5%
60.3%
8.6%
-25.6%
20.3%
-6.4%
5.5%
March 2022/21 March 2022/20
36
Study Permit Holders by Province


March Comparison: 2022/21, 2022/20, Full year 2021/18
-90%
7.5%
105%
202.5%
300%
Atlantic QC ON MB SK AB BC
16.1%
28.6%
13.0%
6.4%
27.3%
45.7%
18.5%
138.6%
166.7%
222.2%
101.4%
183.9%
2.9%
159.7%
15.9%
-0.4%
7.4%
-5.7%
15.7%
-3.8%
2.4%
March 2022/21 March 2022/20 Full year 2021/18
37
Study Permits—Web Interest
40,000
80,000
120,000
160,000
2018-1 2018-4 2018-7 2018-10 2019-1 2019-4 2019-7 2019-10 2020-1 2020-4 2020-7 2020-10 2020-1 2021-4 2021-7 2021-10 2022-1 2022-4
Canada Asia Americas Africa Europe Oceania Not captured
38
Study Permits—Web Interest


April Comparison: 2022/21, 2022/20


Top 10 Countries by “Get your study permit” ordered by site visits, 2018 base year
-175%
0%
175%
350%
525%
700%
India USA China Nigeria Brazil PhilippinesColombia Mexico Iran Pakistan
94.6%
-88.6%
68.4%
215.4%
403.5%
99.4%
197%
-16.5%
20.9%
131%
2.5%
647.6%
-35%
-16.1%
20.5%
-6.7%
31.2%
-22.8%
-14.8%
-34.7%
April 2022/21 April 2022/20
39
Settlement Services
40
Settlement—By Service—2018-20


In Canada Services—Top 25 Countries
20,000
40,000
60,000
80,000
2018-1 2018-4 2018-7 2018-10 2019-1 2019-4 2019-7 2019-10 2020-1 2020-4 2020-7 2020-10
Community Connections Employment Related Services Information and Orientation Services Language Assessment
Language Training Needs & Assets Assessment and Referrals Resettlement Assistance Program Service Delivery Improvement
41
Settlement Services


Year-over-year Comparison by Service—December 2020, Last Quarter
Community
Employment
Information/Orientation
Language Assessment
Language Training
Needs Assessment, Referrals
Resettlement Assistance
-100% -72.5% -45% -17.5% 10%
-88.2%
-30.5%
-13.3%
-71.1%
1.5%
-24.3%
-23.3%
-48.4%
-29.3%
-9.8%
-68.2%
-9.1%
-36.2%
-40.3%
December 2020 July-September
42
Settlement Services


Year-over-year Comparison by Province—December 2020, Last Quarter
-50%
-37.5%
-25%
-12.5%
0%
Atlantic QC ON MB SK AB BC
-18.4%
-23.2%
-24.8%
-26.5%
-7.4%
-28.4%
-45.8%
-19.7%
-13.4%
-24.1%
-35.8%
-15.9%
-28.9%
-21.8%
December 2020 July-September
43
Settlement Services by Citizenship


Year-over-year Comparison—December 2020, Last Quarter

Top 10, 2018 base year
-40%
-30%
-20%
-10%
0%
10%
Syria Eritrea Congo Somalia Afghanistan India Pakistan Korea Mexico Philippines
-14.3%
-15.4%
-29.3%
-16.6%
-15.6%
-15.9%
-28.1%
-24.5%
-17.4%
-23.5%
-38.3%
-26.1%
-17.3%
-18.8%
-2.2%
0.9%
-32.5%
-36.4%
-23.3%
-20.2%
December 2020 July-September
44
Settlement Services—Web Interest
12,500
25,000
37,500
50,000
2018-11 2019-3 2019-7 2019-11 2020-3 2020-7 2020-11 2021-3 2021-7 2021-11 2022-3
Canada Asia Americas Europe Africa Oceania Not speci
fi
ed
45
Settlement Services—Web Interest


April Comparison: 2022/21, 2022/20


Top 10 Countries by “Find immigrant services near you” ordered by site visits, 2018 base year
-100%
-50%
0%
50%
100%
150%
200%
India USA Brazil UAE Pakistan Nigeria Mexico UK ColombiaPhilippines
187.9%
8.6%
-11.8%
-34.6%
-26.2%
-30%
-19.3%
-50.4%
-40%
-29.4%
50.9%
-52.8%
-31.8%
-44.7%
-20.7%
-57.9%
-41%
-73.2%
-37.3%
-57.3%
April 2022/21 April 2022/20
46
Citizenship
47
Citizenship Applications—2018-21
7,500
15,000
22,500
30,000
2018-1 2018-4 2018-7 2018-10 2019-1 2019-4 2019-7 2019-10 2020-1 2020-4 2020-7 2020-10 2021-1 2021-4
48
New Citizens—By Region of Birth—2018-21
12,500
25,000
37,500
50,000
2018-1 2018-4 2018-7 2018-10 2019-1 2019-4 2019-7 2019-10 2020-1 2020-4 2020-7 2020-10 2021-1 2021-4 2021-7 2021-10 2022-1
Asia Africa Americas Europe Oceania
49
Citizenship by Region of Birth


March Comparison: 2022/21, 2022/20, Full year 2021/18
-200%
850%
1,900%
2,950%
4,000%
Philippines India Iran China Pakistan Nigeria USA Egypt Iraq France
-30.2%
-46.5%
-55.8%
-22.8%
-27.3%
-42.4%
-49.8%
-52.4%
4.9%
-9.8%
698.8%
510.2%
452.9%
487.6%
490.3%
395%
237.9%
394.6%
338.4%
174.3%
3,472.2%
1,837.5%
1,337.5%
1,018.3%
2,928.9%
1,828.7%
763.4%
1,134.8%
1,515.5%
920.8%
March 2022/21 March 2022/20 Full year 2021/18
50
Citizenship—Web Interest


Note: Technical anomaly April - December 2019
45,000
90,000
135,000
180,000
2018-1 2018-7 2019-1 2019-7 2020-1 2020-7 2021-1 2021-7 2022-1
Canada Americas Asia Europe Africa Oceania Not captured
51
Citizenship—Web Interest


April Comparison: 2022/21, 2022/20


Top 10 Countries by “Apply for Citizenship” ordered by site visits, 2018 base year
-60%
-30%
0%
30%
60%
90%
120%
USA India UK Pakistan UAE Nigeria China Brazil Turkey Bangladesh
-18.2%
110.6%
22.3%
45.3%
23.2%
31.4%
48.6%
-26.3%
-18.7%
-34.2%
-24.6%
3.1%
-16.7%
4.5%
15.4%
14.2%
6.3%
20.6%
-21%
8.9%
April 2022/21 April 2022/20
52
Approved Visitor Visas
53
Visitor Visas—By Source Country—2018-22
45,000
90,000
135,000
180,000
2018-1 2018-4 2018-7 2018-10 2019-1 2019-4 2019-7 2019-10 2020-1 2020-4 2020-7 2020-10 2021-1 2021-4 2021-7 2021-10 2022-1
Asia Americas Africa Europe Oceania Other
54
Note: Increase in Europe driven by Ukraine
Visitor Visas—By Source Country


March Comparison: 2022/21, 2022/20

Top 10 Countries—Ordered by 2018 base year
-500%
1,125%
2,750%
4,375%
6,000%
China India Philippines Iran Brazil Vietnam Colombia Algeria Pakistan Russia
-68.6%
64.4%
74.9%
88.6%
-15%
-0.1%
358.1%
-21.4%
119.2%
183.1%
380%
1,595.1%
1,258.1%
5,841.2%
4,803.7%
1,217.9%
594.6%
370.3%
3,262.8%
1,971.5%
March 2022-21 March 2022/20
55
Note: The most dramatic impact is the number of visas issued to Ukrainians under the Canada-Ukraine authorization for emergency travel, from a pre-
pandemic average of 648 per month in 2019 to 21,465 March 2022.
Research Questions
56
• Which programs contracted most quickly and which source countries
were most a
ff
ected? Similarly, which programs and source countries
recovered more quickly?

• Did application success rates vary pre and post-COVID by source
country?

• Were exogenous factors such as US immigration restrictions or
tensions with China a factor?

• Did interest in immigrating to Canada increase or decrease and for
which countries?
Annex
57
Top Countries Share of Total (2018)
10 Countries 25 Countries
Permanent Residents 60.9% 77.7%
IMP 70.8% 86.4%
TFWP 85.2% 93.2%
Study Permits 70.3% 73.8%
Asylum Claimants 57.4% 77.4%
Citizenship 50.3% 71.5%
58
Top Countries (2018)
Permanent
Residents
IMP TFWP Students Settlement Citizenship
India 69,980 India 55,610 Mexico 28,860 India 107,105 Syria 15,530 Philippines 19,647
Philippines 35,050 USA 26,540 Jamaica 10,200 China 85,100 Eritrea 11,865 India 19,486
China 29,710 Finland 23,445 Guatemala 9,810 Korea 16,875 Congo 11,355 Iran 10,037
Syria 12,045 China 21,910 Philippines 8,750 Vietnam 12,370 Somalia 10,785 PRC 9,718
Nigeria 10,920 UK 11,205 India 7,380 Iran 7,040 Afghanistan 9,550 Pakistan 9,406
USA 10,905 Australia 8,850 Korea 1,960 Japan 6,685 India 9,035 Nigeria 4,398
Pakistan 9,490 Ireland 8,675 USA 1,850 Bangladesh 4,155 Pakistan 8,360 USA 4,229
France 6,175 Korea 8,105 UK 940 Philippines 4,075 Korea of 7,775 Egypt 4,115
Eritrea 5,695 Brazil 8,080 China 935 Taiwan 3,160 Mexico 7,640 Iraq 3,951
UK 5,660 Japan 7,250 France 915
Saudi
Arabia
2,870 Philippines 6,995 France 3,836
59
Data Sources
• PRs: Canada - Admissions of Permanent Residents by Province/Territory of Intended Destination and Immigration Category, Canada - Admissions of
Permanent Residents by Country of Citizenship, COVID Immigration Impact - PR Applications Source Countries

• TR to Permanent Resident transition: Canada – Admissions of Permanent Residents with Prior Post-graduate Work Permit Holder Status by Province/Territory of Intended Destination and Immigration
Category, Canada – Admissions of Permanent Residents with Prior International Mobility Program Work Permit Holder Status by Province/Territory of Intended Destination and Immigration Category,
Canada – Admissions of Permanent Residents with Prior Study Permit Holder Status by Province/Territory of Intended Destination and Immigration Category, Canada – Admissions of Permanent
Residents with Prior Temporary Foreign Worker Program Work Permit Holder Status by Province/Territory of Intended Destination and Immigration Category

• Asylum Claimants: Canada - Asylum Claimants by Claim O
ffi
ce Type, Province/Territory* of Claim and Claim Year, Canada - Asylum Claimants by Top Twenty-Five Countries of Citizenship (2019 ranking),
Claim O
ffi
ce Type and Claim Year 

• TRs: Canada - International Mobility Program (IMP) work permit holders by province/territory of intended destination, program and year in which permit(s)
became e
ff
ective, Canada - Temporary Foreign Worker Program (TFWP) work permit holders by province/territory of intended destination, program and year
in which permit(s) became e
ff
ective, Canada – International Mobility Program work permit holders by country of citizenship and year in which permit(s)
became e
ff
ective, Canada – Temporary Foreign Worker Program work permit holders by country of citizenship and year in which permit(s) became e
ff
ective

• Study Permits: Canada - Study permit holders by country of citizenship and year in which permit(s) became e
ff
ective, Canada - Study permit holders by
province/territory of intended destination, study level and year in which permit(s) became e
ff
ective, Source Countries - Applications Processed by IRCC for
New Study Permit Applications

• Settlement Services: Special request IRCC data table

• Citizenship: Source Countries (Country of Birth) - New Canadian Citizens (in Persons) by Month 

• Web: Provided by IRCC

• 2018 is used as baseline
60

More Related Content

Similar to Covid-19 Immigration Effects - Key Slides - March 2022

Canadian Immigration Tracker - Key Slides - April 2023.pdf
Canadian Immigration Tracker - Key Slides - April 2023.pdfCanadian Immigration Tracker - Key Slides - April 2023.pdf
Canadian Immigration Tracker - Key Slides - April 2023.pdfAndrew Griffith
 
Covid-19 Immigration Effects - Key Slides - January 2023.pdf
Covid-19 Immigration Effects - Key Slides - January 2023.pdfCovid-19 Immigration Effects - Key Slides - January 2023.pdf
Covid-19 Immigration Effects - Key Slides - January 2023.pdfAndrew Griffith
 
Covid-19 Immigration Effects - Key Slides - July 2023 .pdf
Covid-19 Immigration Effects - Key Slides - July 2023 .pdfCovid-19 Immigration Effects - Key Slides - July 2023 .pdf
Covid-19 Immigration Effects - Key Slides - July 2023 .pdfAndrew Griffith
 
Covid-19 Immigration Effects - Key Slides - June 2023 .pdf
Covid-19 Immigration Effects - Key Slides - June 2023 .pdfCovid-19 Immigration Effects - Key Slides - June 2023 .pdf
Covid-19 Immigration Effects - Key Slides - June 2023 .pdfAndrew Griffith
 
Canadian Immigration Tracker - August 2023.pdf
Canadian Immigration Tracker - August 2023.pdfCanadian Immigration Tracker - August 2023.pdf
Canadian Immigration Tracker - August 2023.pdfAndrew Griffith
 
Covid 19 Immigration Effects - Key Slides - August 2021 update
Covid 19 Immigration Effects - Key Slides - August 2021 updateCovid 19 Immigration Effects - Key Slides - August 2021 update
Covid 19 Immigration Effects - Key Slides - August 2021 updateAndrew Griffith
 
Canadian Immigration Tracker - Key Slides - February 2024.pdf
Canadian Immigration Tracker - Key Slides - February 2024.pdfCanadian Immigration Tracker - Key Slides - February 2024.pdf
Canadian Immigration Tracker - Key Slides - February 2024.pdfAndrew Griffith
 
Canadian Immigration Tracker - January 2024.pdf
Canadian Immigration Tracker - January 2024.pdfCanadian Immigration Tracker - January 2024.pdf
Canadian Immigration Tracker - January 2024.pdfAndrew Griffith
 
Covid 19 Immigration Effects - Key Slides - June 2021
Covid 19 Immigration Effects - Key Slides - June 2021Covid 19 Immigration Effects - Key Slides - June 2021
Covid 19 Immigration Effects - Key Slides - June 2021Andrew Griffith
 
Covid-19 Immigration Effects - Key Slides - December 2022 and full-year comp...
Covid-19 Immigration Effects - Key Slides - December  2022 and full-year comp...Covid-19 Immigration Effects - Key Slides - December  2022 and full-year comp...
Covid-19 Immigration Effects - Key Slides - December 2022 and full-year comp...Andrew Griffith
 
Covid 19 Immigration Effects - May 2021 draft
Covid 19 Immigration Effects - May 2021 draftCovid 19 Immigration Effects - May 2021 draft
Covid 19 Immigration Effects - May 2021 draftAndrew Griffith
 
Covid-19 Immigration Effects - Key Slides - August 2022
Covid-19 Immigration Effects - Key Slides - August 2022Covid-19 Immigration Effects - Key Slides - August 2022
Covid-19 Immigration Effects - Key Slides - August 2022Andrew Griffith
 
Covid 19 immigration effects April 2021
Covid 19 immigration effects April 2021Covid 19 immigration effects April 2021
Covid 19 immigration effects April 2021Andrew Griffith
 
Canadian Immigration Tracker - Key Slides - October 2023.pdf
Canadian Immigration Tracker - Key Slides - October 2023.pdfCanadian Immigration Tracker - Key Slides - October 2023.pdf
Canadian Immigration Tracker - Key Slides - October 2023.pdfAndrew Griffith
 
Covid 19 Immigration Effects - Key Slides - July 2021
Covid 19 Immigration Effects - Key Slides - July 2021Covid 19 Immigration Effects - Key Slides - July 2021
Covid 19 Immigration Effects - Key Slides - July 2021Andrew Griffith
 
Covid-19 immigration effects - Key slides - March 2021 draft
Covid-19 immigration effects - Key slides - March 2021 draftCovid-19 immigration effects - Key slides - March 2021 draft
Covid-19 immigration effects - Key slides - March 2021 draftAndrew Griffith
 
Covid-19 Immigration Effects - Key Slides - October 2022
Covid-19 Immigration Effects - Key Slides - October 2022Covid-19 Immigration Effects - Key Slides - October 2022
Covid-19 Immigration Effects - Key Slides - October 2022Andrew Griffith
 
Covid-19 Immigration Effects - Key Slides - November 2022 .pdf
Covid-19 Immigration Effects - Key Slides - November 2022 .pdfCovid-19 Immigration Effects - Key Slides - November 2022 .pdf
Covid-19 Immigration Effects - Key Slides - November 2022 .pdfAndrew Griffith
 
Covid 19 immigration effects - key slides - october 2021 draft
Covid 19 immigration effects - key slides - october 2021 draft Covid 19 immigration effects - key slides - october 2021 draft
Covid 19 immigration effects - key slides - october 2021 draft Andrew Griffith
 
Covid 19 Immigration Effects - December 2021 Update with 2018 baseline compar...
Covid 19 Immigration Effects - December 2021 Update with 2018 baseline compar...Covid 19 Immigration Effects - December 2021 Update with 2018 baseline compar...
Covid 19 Immigration Effects - December 2021 Update with 2018 baseline compar...Andrew Griffith
 

Similar to Covid-19 Immigration Effects - Key Slides - March 2022 (20)

Canadian Immigration Tracker - Key Slides - April 2023.pdf
Canadian Immigration Tracker - Key Slides - April 2023.pdfCanadian Immigration Tracker - Key Slides - April 2023.pdf
Canadian Immigration Tracker - Key Slides - April 2023.pdf
 
Covid-19 Immigration Effects - Key Slides - January 2023.pdf
Covid-19 Immigration Effects - Key Slides - January 2023.pdfCovid-19 Immigration Effects - Key Slides - January 2023.pdf
Covid-19 Immigration Effects - Key Slides - January 2023.pdf
 
Covid-19 Immigration Effects - Key Slides - July 2023 .pdf
Covid-19 Immigration Effects - Key Slides - July 2023 .pdfCovid-19 Immigration Effects - Key Slides - July 2023 .pdf
Covid-19 Immigration Effects - Key Slides - July 2023 .pdf
 
Covid-19 Immigration Effects - Key Slides - June 2023 .pdf
Covid-19 Immigration Effects - Key Slides - June 2023 .pdfCovid-19 Immigration Effects - Key Slides - June 2023 .pdf
Covid-19 Immigration Effects - Key Slides - June 2023 .pdf
 
Canadian Immigration Tracker - August 2023.pdf
Canadian Immigration Tracker - August 2023.pdfCanadian Immigration Tracker - August 2023.pdf
Canadian Immigration Tracker - August 2023.pdf
 
Covid 19 Immigration Effects - Key Slides - August 2021 update
Covid 19 Immigration Effects - Key Slides - August 2021 updateCovid 19 Immigration Effects - Key Slides - August 2021 update
Covid 19 Immigration Effects - Key Slides - August 2021 update
 
Canadian Immigration Tracker - Key Slides - February 2024.pdf
Canadian Immigration Tracker - Key Slides - February 2024.pdfCanadian Immigration Tracker - Key Slides - February 2024.pdf
Canadian Immigration Tracker - Key Slides - February 2024.pdf
 
Canadian Immigration Tracker - January 2024.pdf
Canadian Immigration Tracker - January 2024.pdfCanadian Immigration Tracker - January 2024.pdf
Canadian Immigration Tracker - January 2024.pdf
 
Covid 19 Immigration Effects - Key Slides - June 2021
Covid 19 Immigration Effects - Key Slides - June 2021Covid 19 Immigration Effects - Key Slides - June 2021
Covid 19 Immigration Effects - Key Slides - June 2021
 
Covid-19 Immigration Effects - Key Slides - December 2022 and full-year comp...
Covid-19 Immigration Effects - Key Slides - December  2022 and full-year comp...Covid-19 Immigration Effects - Key Slides - December  2022 and full-year comp...
Covid-19 Immigration Effects - Key Slides - December 2022 and full-year comp...
 
Covid 19 Immigration Effects - May 2021 draft
Covid 19 Immigration Effects - May 2021 draftCovid 19 Immigration Effects - May 2021 draft
Covid 19 Immigration Effects - May 2021 draft
 
Covid-19 Immigration Effects - Key Slides - August 2022
Covid-19 Immigration Effects - Key Slides - August 2022Covid-19 Immigration Effects - Key Slides - August 2022
Covid-19 Immigration Effects - Key Slides - August 2022
 
Covid 19 immigration effects April 2021
Covid 19 immigration effects April 2021Covid 19 immigration effects April 2021
Covid 19 immigration effects April 2021
 
Canadian Immigration Tracker - Key Slides - October 2023.pdf
Canadian Immigration Tracker - Key Slides - October 2023.pdfCanadian Immigration Tracker - Key Slides - October 2023.pdf
Canadian Immigration Tracker - Key Slides - October 2023.pdf
 
Covid 19 Immigration Effects - Key Slides - July 2021
Covid 19 Immigration Effects - Key Slides - July 2021Covid 19 Immigration Effects - Key Slides - July 2021
Covid 19 Immigration Effects - Key Slides - July 2021
 
Covid-19 immigration effects - Key slides - March 2021 draft
Covid-19 immigration effects - Key slides - March 2021 draftCovid-19 immigration effects - Key slides - March 2021 draft
Covid-19 immigration effects - Key slides - March 2021 draft
 
Covid-19 Immigration Effects - Key Slides - October 2022
Covid-19 Immigration Effects - Key Slides - October 2022Covid-19 Immigration Effects - Key Slides - October 2022
Covid-19 Immigration Effects - Key Slides - October 2022
 
Covid-19 Immigration Effects - Key Slides - November 2022 .pdf
Covid-19 Immigration Effects - Key Slides - November 2022 .pdfCovid-19 Immigration Effects - Key Slides - November 2022 .pdf
Covid-19 Immigration Effects - Key Slides - November 2022 .pdf
 
Covid 19 immigration effects - key slides - october 2021 draft
Covid 19 immigration effects - key slides - october 2021 draft Covid 19 immigration effects - key slides - october 2021 draft
Covid 19 immigration effects - key slides - october 2021 draft
 
Covid 19 Immigration Effects - December 2021 Update with 2018 baseline compar...
Covid 19 Immigration Effects - December 2021 Update with 2018 baseline compar...Covid 19 Immigration Effects - December 2021 Update with 2018 baseline compar...
Covid 19 Immigration Effects - December 2021 Update with 2018 baseline compar...
 

More from Andrew Griffith

Canadian Immigration Tracker - Key Slides - December 2023
Canadian Immigration Tracker - Key Slides - December 2023Canadian Immigration Tracker - Key Slides - December 2023
Canadian Immigration Tracker - Key Slides - December 2023Andrew Griffith
 
Covid-19 Immigration Effects - Key Slides - September 2023.pdf
Covid-19 Immigration Effects - Key Slides - September  2023.pdfCovid-19 Immigration Effects - Key Slides - September  2023.pdf
Covid-19 Immigration Effects - Key Slides - September 2023.pdfAndrew Griffith
 
Integration - General Deck 2022 data
Integration - General Deck 2022 dataIntegration - General Deck 2022 data
Integration - General Deck 2022 dataAndrew Griffith
 
Order of Canada 2013-22 Diversity
Order of Canada 2013-22 DiversityOrder of Canada 2013-22 Diversity
Order of Canada 2013-22 DiversityAndrew Griffith
 
Covid-19 Immigration Effects - Key Slides - September 2022
Covid-19 Immigration Effects - Key Slides - September 2022Covid-19 Immigration Effects - Key Slides - September 2022
Covid-19 Immigration Effects - Key Slides - September 2022Andrew Griffith
 
Covid 19 Immigration Effects - November 2021
Covid 19 Immigration Effects - November 2021 Covid 19 Immigration Effects - November 2021
Covid 19 Immigration Effects - November 2021 Andrew Griffith
 
Order of Canada Appointments 2013-21 - How Diverse Are They?
Order of Canada Appointments 2013-21 - How Diverse Are They?  Order of Canada Appointments 2013-21 - How Diverse Are They?
Order of Canada Appointments 2013-21 - How Diverse Are They? Andrew Griffith
 
Covid-19 Immigration Effects - Key Slides - September 2021
Covid-19 Immigration Effects - Key Slides - September 2021Covid-19 Immigration Effects - Key Slides - September 2021
Covid-19 Immigration Effects - Key Slides - September 2021Andrew Griffith
 

More from Andrew Griffith (8)

Canadian Immigration Tracker - Key Slides - December 2023
Canadian Immigration Tracker - Key Slides - December 2023Canadian Immigration Tracker - Key Slides - December 2023
Canadian Immigration Tracker - Key Slides - December 2023
 
Covid-19 Immigration Effects - Key Slides - September 2023.pdf
Covid-19 Immigration Effects - Key Slides - September  2023.pdfCovid-19 Immigration Effects - Key Slides - September  2023.pdf
Covid-19 Immigration Effects - Key Slides - September 2023.pdf
 
Integration - General Deck 2022 data
Integration - General Deck 2022 dataIntegration - General Deck 2022 data
Integration - General Deck 2022 data
 
Order of Canada 2013-22 Diversity
Order of Canada 2013-22 DiversityOrder of Canada 2013-22 Diversity
Order of Canada 2013-22 Diversity
 
Covid-19 Immigration Effects - Key Slides - September 2022
Covid-19 Immigration Effects - Key Slides - September 2022Covid-19 Immigration Effects - Key Slides - September 2022
Covid-19 Immigration Effects - Key Slides - September 2022
 
Covid 19 Immigration Effects - November 2021
Covid 19 Immigration Effects - November 2021 Covid 19 Immigration Effects - November 2021
Covid 19 Immigration Effects - November 2021
 
Order of Canada Appointments 2013-21 - How Diverse Are They?
Order of Canada Appointments 2013-21 - How Diverse Are They?  Order of Canada Appointments 2013-21 - How Diverse Are They?
Order of Canada Appointments 2013-21 - How Diverse Are They?
 
Covid-19 Immigration Effects - Key Slides - September 2021
Covid-19 Immigration Effects - Key Slides - September 2021Covid-19 Immigration Effects - Key Slides - September 2021
Covid-19 Immigration Effects - Key Slides - September 2021
 

Recently uploaded

Just Call Vip call girls Wardha Escorts ☎️8617370543 Starting From 5K to 25K ...
Just Call Vip call girls Wardha Escorts ☎️8617370543 Starting From 5K to 25K ...Just Call Vip call girls Wardha Escorts ☎️8617370543 Starting From 5K to 25K ...
Just Call Vip call girls Wardha Escorts ☎️8617370543 Starting From 5K to 25K ...Dipal Arora
 
Get Premium Budhwar Peth Call Girls (8005736733) 24x7 Rate 15999 with A/c Roo...
Get Premium Budhwar Peth Call Girls (8005736733) 24x7 Rate 15999 with A/c Roo...Get Premium Budhwar Peth Call Girls (8005736733) 24x7 Rate 15999 with A/c Roo...
Get Premium Budhwar Peth Call Girls (8005736733) 24x7 Rate 15999 with A/c Roo...MOHANI PANDEY
 
Booking open Available Pune Call Girls Shukrawar Peth 6297143586 Call Hot In...
Booking open Available Pune Call Girls Shukrawar Peth  6297143586 Call Hot In...Booking open Available Pune Call Girls Shukrawar Peth  6297143586 Call Hot In...
Booking open Available Pune Call Girls Shukrawar Peth 6297143586 Call Hot In...tanu pandey
 
Scaling up coastal adaptation in Maldives through the NAP process
Scaling up coastal adaptation in Maldives through the NAP processScaling up coastal adaptation in Maldives through the NAP process
Scaling up coastal adaptation in Maldives through the NAP processNAP Global Network
 
Item # 4 - 231 Encino Ave (Significance Only).pdf
Item # 4 - 231 Encino Ave (Significance Only).pdfItem # 4 - 231 Encino Ave (Significance Only).pdf
Item # 4 - 231 Encino Ave (Significance Only).pdfahcitycouncil
 
Antisemitism Awareness Act: pénaliser la critique de l'Etat d'Israël
Antisemitism Awareness Act: pénaliser la critique de l'Etat d'IsraëlAntisemitism Awareness Act: pénaliser la critique de l'Etat d'Israël
Antisemitism Awareness Act: pénaliser la critique de l'Etat d'IsraëlEdouardHusson
 
Finance strategies for adaptation. Presentation for CANCC
Finance strategies for adaptation. Presentation for CANCCFinance strategies for adaptation. Presentation for CANCC
Finance strategies for adaptation. Presentation for CANCCNAP Global Network
 
Top Rated Pune Call Girls Dapodi ⟟ 6297143586 ⟟ Call Me For Genuine Sex Serv...
Top Rated  Pune Call Girls Dapodi ⟟ 6297143586 ⟟ Call Me For Genuine Sex Serv...Top Rated  Pune Call Girls Dapodi ⟟ 6297143586 ⟟ Call Me For Genuine Sex Serv...
Top Rated Pune Call Girls Dapodi ⟟ 6297143586 ⟟ Call Me For Genuine Sex Serv...Call Girls in Nagpur High Profile
 
The NAP process & South-South peer learning
The NAP process & South-South peer learningThe NAP process & South-South peer learning
The NAP process & South-South peer learningNAP Global Network
 
Pimpri Chinchwad ( Call Girls ) Pune 6297143586 Hot Model With Sexy Bhabi R...
Pimpri Chinchwad ( Call Girls ) Pune  6297143586  Hot Model With Sexy Bhabi R...Pimpri Chinchwad ( Call Girls ) Pune  6297143586  Hot Model With Sexy Bhabi R...
Pimpri Chinchwad ( Call Girls ) Pune 6297143586 Hot Model With Sexy Bhabi R...tanu pandey
 
Call On 6297143586 Viman Nagar Call Girls In All Pune 24/7 Provide Call With...
Call On 6297143586  Viman Nagar Call Girls In All Pune 24/7 Provide Call With...Call On 6297143586  Viman Nagar Call Girls In All Pune 24/7 Provide Call With...
Call On 6297143586 Viman Nagar Call Girls In All Pune 24/7 Provide Call With...tanu pandey
 
PPT BIJNOR COUNTING Counting of Votes on ETPBs (FOR SERVICE ELECTORS
PPT BIJNOR COUNTING Counting of Votes on ETPBs (FOR SERVICE ELECTORSPPT BIJNOR COUNTING Counting of Votes on ETPBs (FOR SERVICE ELECTORS
PPT BIJNOR COUNTING Counting of Votes on ETPBs (FOR SERVICE ELECTORSgovindsharma81649
 
CBO’s Recent Appeals for New Research on Health-Related Topics
CBO’s Recent Appeals for New Research on Health-Related TopicsCBO’s Recent Appeals for New Research on Health-Related Topics
CBO’s Recent Appeals for New Research on Health-Related TopicsCongressional Budget Office
 
VIP Model Call Girls Shikrapur ( Pune ) Call ON 8005736733 Starting From 5K t...
VIP Model Call Girls Shikrapur ( Pune ) Call ON 8005736733 Starting From 5K t...VIP Model Call Girls Shikrapur ( Pune ) Call ON 8005736733 Starting From 5K t...
VIP Model Call Girls Shikrapur ( Pune ) Call ON 8005736733 Starting From 5K t...SUHANI PANDEY
 
Election 2024 Presiding Duty Keypoints_01.pdf
Election 2024 Presiding Duty Keypoints_01.pdfElection 2024 Presiding Duty Keypoints_01.pdf
Election 2024 Presiding Duty Keypoints_01.pdfSamirsinh Parmar
 
celebrity 💋 Agra Escorts Just Dail 8250092165 service available anytime 24 hour
celebrity 💋 Agra Escorts Just Dail 8250092165 service available anytime 24 hourcelebrity 💋 Agra Escorts Just Dail 8250092165 service available anytime 24 hour
celebrity 💋 Agra Escorts Just Dail 8250092165 service available anytime 24 hourCall Girls in Nagpur High Profile
 
Postal Ballots-For home voting step by step process 2024.pptx
Postal Ballots-For home voting step by step process 2024.pptxPostal Ballots-For home voting step by step process 2024.pptx
Postal Ballots-For home voting step by step process 2024.pptxSwastiRanjanNayak
 
A Press for the Planet: Journalism in the face of the Environmental Crisis
A Press for the Planet: Journalism in the face of the Environmental CrisisA Press for the Planet: Journalism in the face of the Environmental Crisis
A Press for the Planet: Journalism in the face of the Environmental CrisisChristina Parmionova
 
The Most Attractive Pune Call Girls Handewadi Road 8250192130 Will You Miss T...
The Most Attractive Pune Call Girls Handewadi Road 8250192130 Will You Miss T...The Most Attractive Pune Call Girls Handewadi Road 8250192130 Will You Miss T...
The Most Attractive Pune Call Girls Handewadi Road 8250192130 Will You Miss T...ranjana rawat
 
WORLD DEVELOPMENT REPORT 2024 - Economic Growth in Middle-Income Countries.
WORLD DEVELOPMENT REPORT 2024 - Economic Growth in Middle-Income Countries.WORLD DEVELOPMENT REPORT 2024 - Economic Growth in Middle-Income Countries.
WORLD DEVELOPMENT REPORT 2024 - Economic Growth in Middle-Income Countries.Christina Parmionova
 

Recently uploaded (20)

Just Call Vip call girls Wardha Escorts ☎️8617370543 Starting From 5K to 25K ...
Just Call Vip call girls Wardha Escorts ☎️8617370543 Starting From 5K to 25K ...Just Call Vip call girls Wardha Escorts ☎️8617370543 Starting From 5K to 25K ...
Just Call Vip call girls Wardha Escorts ☎️8617370543 Starting From 5K to 25K ...
 
Get Premium Budhwar Peth Call Girls (8005736733) 24x7 Rate 15999 with A/c Roo...
Get Premium Budhwar Peth Call Girls (8005736733) 24x7 Rate 15999 with A/c Roo...Get Premium Budhwar Peth Call Girls (8005736733) 24x7 Rate 15999 with A/c Roo...
Get Premium Budhwar Peth Call Girls (8005736733) 24x7 Rate 15999 with A/c Roo...
 
Booking open Available Pune Call Girls Shukrawar Peth 6297143586 Call Hot In...
Booking open Available Pune Call Girls Shukrawar Peth  6297143586 Call Hot In...Booking open Available Pune Call Girls Shukrawar Peth  6297143586 Call Hot In...
Booking open Available Pune Call Girls Shukrawar Peth 6297143586 Call Hot In...
 
Scaling up coastal adaptation in Maldives through the NAP process
Scaling up coastal adaptation in Maldives through the NAP processScaling up coastal adaptation in Maldives through the NAP process
Scaling up coastal adaptation in Maldives through the NAP process
 
Item # 4 - 231 Encino Ave (Significance Only).pdf
Item # 4 - 231 Encino Ave (Significance Only).pdfItem # 4 - 231 Encino Ave (Significance Only).pdf
Item # 4 - 231 Encino Ave (Significance Only).pdf
 
Antisemitism Awareness Act: pénaliser la critique de l'Etat d'Israël
Antisemitism Awareness Act: pénaliser la critique de l'Etat d'IsraëlAntisemitism Awareness Act: pénaliser la critique de l'Etat d'Israël
Antisemitism Awareness Act: pénaliser la critique de l'Etat d'Israël
 
Finance strategies for adaptation. Presentation for CANCC
Finance strategies for adaptation. Presentation for CANCCFinance strategies for adaptation. Presentation for CANCC
Finance strategies for adaptation. Presentation for CANCC
 
Top Rated Pune Call Girls Dapodi ⟟ 6297143586 ⟟ Call Me For Genuine Sex Serv...
Top Rated  Pune Call Girls Dapodi ⟟ 6297143586 ⟟ Call Me For Genuine Sex Serv...Top Rated  Pune Call Girls Dapodi ⟟ 6297143586 ⟟ Call Me For Genuine Sex Serv...
Top Rated Pune Call Girls Dapodi ⟟ 6297143586 ⟟ Call Me For Genuine Sex Serv...
 
The NAP process & South-South peer learning
The NAP process & South-South peer learningThe NAP process & South-South peer learning
The NAP process & South-South peer learning
 
Pimpri Chinchwad ( Call Girls ) Pune 6297143586 Hot Model With Sexy Bhabi R...
Pimpri Chinchwad ( Call Girls ) Pune  6297143586  Hot Model With Sexy Bhabi R...Pimpri Chinchwad ( Call Girls ) Pune  6297143586  Hot Model With Sexy Bhabi R...
Pimpri Chinchwad ( Call Girls ) Pune 6297143586 Hot Model With Sexy Bhabi R...
 
Call On 6297143586 Viman Nagar Call Girls In All Pune 24/7 Provide Call With...
Call On 6297143586  Viman Nagar Call Girls In All Pune 24/7 Provide Call With...Call On 6297143586  Viman Nagar Call Girls In All Pune 24/7 Provide Call With...
Call On 6297143586 Viman Nagar Call Girls In All Pune 24/7 Provide Call With...
 
PPT BIJNOR COUNTING Counting of Votes on ETPBs (FOR SERVICE ELECTORS
PPT BIJNOR COUNTING Counting of Votes on ETPBs (FOR SERVICE ELECTORSPPT BIJNOR COUNTING Counting of Votes on ETPBs (FOR SERVICE ELECTORS
PPT BIJNOR COUNTING Counting of Votes on ETPBs (FOR SERVICE ELECTORS
 
CBO’s Recent Appeals for New Research on Health-Related Topics
CBO’s Recent Appeals for New Research on Health-Related TopicsCBO’s Recent Appeals for New Research on Health-Related Topics
CBO’s Recent Appeals for New Research on Health-Related Topics
 
VIP Model Call Girls Shikrapur ( Pune ) Call ON 8005736733 Starting From 5K t...
VIP Model Call Girls Shikrapur ( Pune ) Call ON 8005736733 Starting From 5K t...VIP Model Call Girls Shikrapur ( Pune ) Call ON 8005736733 Starting From 5K t...
VIP Model Call Girls Shikrapur ( Pune ) Call ON 8005736733 Starting From 5K t...
 
Election 2024 Presiding Duty Keypoints_01.pdf
Election 2024 Presiding Duty Keypoints_01.pdfElection 2024 Presiding Duty Keypoints_01.pdf
Election 2024 Presiding Duty Keypoints_01.pdf
 
celebrity 💋 Agra Escorts Just Dail 8250092165 service available anytime 24 hour
celebrity 💋 Agra Escorts Just Dail 8250092165 service available anytime 24 hourcelebrity 💋 Agra Escorts Just Dail 8250092165 service available anytime 24 hour
celebrity 💋 Agra Escorts Just Dail 8250092165 service available anytime 24 hour
 
Postal Ballots-For home voting step by step process 2024.pptx
Postal Ballots-For home voting step by step process 2024.pptxPostal Ballots-For home voting step by step process 2024.pptx
Postal Ballots-For home voting step by step process 2024.pptx
 
A Press for the Planet: Journalism in the face of the Environmental Crisis
A Press for the Planet: Journalism in the face of the Environmental CrisisA Press for the Planet: Journalism in the face of the Environmental Crisis
A Press for the Planet: Journalism in the face of the Environmental Crisis
 
The Most Attractive Pune Call Girls Handewadi Road 8250192130 Will You Miss T...
The Most Attractive Pune Call Girls Handewadi Road 8250192130 Will You Miss T...The Most Attractive Pune Call Girls Handewadi Road 8250192130 Will You Miss T...
The Most Attractive Pune Call Girls Handewadi Road 8250192130 Will You Miss T...
 
WORLD DEVELOPMENT REPORT 2024 - Economic Growth in Middle-Income Countries.
WORLD DEVELOPMENT REPORT 2024 - Economic Growth in Middle-Income Countries.WORLD DEVELOPMENT REPORT 2024 - Economic Growth in Middle-Income Countries.
WORLD DEVELOPMENT REPORT 2024 - Economic Growth in Middle-Income Countries.
 

Covid-19 Immigration Effects - Key Slides - March 2022

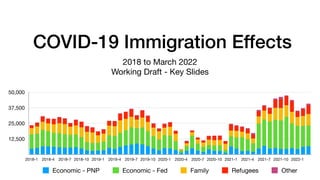
  • 1. COVID-19 Immigration Effects 2018 to March 2022 Working Draft - Key Slides 12,500 25,000 37,500 50,000 2018-1 2018-4 2018-7 2018-10 2019-1 2019-4 2019-7 2019-10 2020-1 2020-4 2020-7 2020-10 2021-1 2021-4 2021-7 2021-10 2022-1 Economic - PNP Economic - Fed Family Refugees Other
  • 2. Programs Examined • Permanent Residents/Immigrants (PRs): Economic (PNP and Federal), Family and Refugees • TR to Permanent Resident transition • Asylum Claimants • Temporary Residents/International Mobility Program (IMP): International Agreements (e.g., NAFTA, GATS), Canadian Interests (e.g., intra-corporate transfers, work exchange programs, post-graduate employment, spouses) • Temporary Residents/Temporary Foreign Worker Program (TFWP): caregivers, agriculture workers, other workers with Labour Market Impact Assessment (LMIA) • Study Permits (international students) • Settlement Services • Citizenship • Visitor Visas 2
  • 3. February 2021 Highlights • PRs: Admissions Increase 37,130 in February to 40,765 in March. March Year-over-year change (change from 2020 in parentheses): Economic - PNP 146.0% (82.6%), Economic - Federal 49.2% (135.0%), Family 109.7% (57.2%), Refugees 95.8% (204.8%) • Applications: Decrease from 10,497 in February to 8,401 in March. March year-over-year change (change from 2020): -85.5% (-71.7%). Note: Given delays in entering applications in processing systems, the last few months understate the number of applications • Express Entry and Arrima Invitations to Apply: From 3,396 in March to 1,649 in April. April year-over-year change (change from 2020): -90.7% (-85.9%) • Web “Immigrate to Canada”: Decrease from 420,017 in March (outside Canada) to 396,345 in April. April year-over-year change (change from 2020): 9.3% (48.9%) • TR to PRs transition (i.e., those already in Canada): Decline from 22,185 in February (some double counting) to 20,725 in March. March year-over-year change (change from 2020): 64.2% (291.4%) • Temporary Residents: • TRs/IMP: Increase from 22,165 in February to 25,810 in March. March year-over-year (change from 2020): Agreements: -3.6% (54.7%), Canadian Interests: -22.7% (79.1%), Other IMP Participants -53.5% (5,411.1%), Not stated 265.5% (23.6%) • TRs/TFWP: Near doubling from 7,235 in February to 13,295 in March (agriculture workers). March year-over-year change (change from 2020): Caregivers -50.4% (50.0%), Agriculture 1.3% (177.9%) and Other LMIA -20.6% (70.6%). • Web “Get a work permit”: Increase from 79,971 in March (outside Canada) to 88,759 in April. April year-over-year change (change from 2020): 47% (83.4%) • Students: Stable, from 25,235 in February to 25,780 in March. March year-over-year change (change from 2020): 13.1% (131.6%) • Applications: Increase from 46,718 in February to 45,648 in March. March year-over-year change (change from 2020): 3.6% (145.2%) • Web “Get a study permit”: Increase from 75,576 in March (outside Canada) to 87,699 in April. April Year-over-year change (change from 2020): -5.6% (101%) • Asylum Claimants: Increase from 5,240 in February (half at border) to 6,080. March year-over-year change (change from 2020): 375.0% (69.8%) • Irregular arrivals (Roxham Road etc) increased from 2,164 in February to 2,502 in March. March year-over-year change (change from 2020): 6,850.0% (169.0%) • Settlement Services (December 2020 - awaiting more recent): Decline from 48,700 in November to 42,890 in December. December year-over-year (change from 2020): 21.6% (-17.1%) • Web “Find immigrant services near you”: Increase from 4,345 in March (outside Canada) to 5,206 in April. April year-over-year change (change from 2020): -39.5% (-16.5%). In Canada: -41.8% (-11.3%) • Citizenship: Increase from 30,195 in February to 41,678 in March. March year-over-year change (change from 2020): 1,527.4% (341.6%) • Applications (awaiting more recent): From 19,005 in May to 18,189 in June. June year-over-year change (change from 2020): 21.6% (-11.7%) • “Apply for citizenship”: Increase from 17,583 in March (outside Canada) to 20,204 in April. April year-over-year change (change from 2020): 5.4% (-11.8%). In Canada: 2.7% (64.3%) • Visitor Visas: Increase from 65,989 in February to 88,615 in March driven by Ukrainians. March year-over-year change (change from 2020): 1,899.9% (117.3%). Visas to Russians reverted to normal levels 3
  • 4. Change Across Major Programs 2021 Compared to 2018 Baseline 4 PR Applications PR Admissions - PNP PR Admissions - Fed Asylum Claimants Temporary Workers IMP Temporary Workers TFWP Study Permit Applications Study Permit Holders Citizenship App. (Jan-June) New Citizens Settlement Services (2020/19) Visitor Visas -100% -57.5% -15% 27.5% 70% -82.1% -14.1% -37.6% -20.6% 27.3% 64.2% 24.1% 34.8% -44.9% 60.2% -14.3% -43.1%
  • 6. Express Entry & Arrima Invitations—2018-22 7,500 15,000 22,500 30,000 2018-1 2018-5 2018-9 2019-1 2019-5 2019-9 2020-1 2020-5 2020-9 2021-1 2021-5 2021-9 2022-1 CEC PNP No Program Federal Skilled Trades QC Arrima 6
  • 7. PR Applications: Region of Citizenship —2018-22 30,000 60,000 90,000 120,000 2018-1 2018-4 2018-7 2018-10 2019-1 2019-4 2019-7 2019-10 2020-1 2020-4 2020-7 2020-10 2021-1 2021-4 2021-7 2021-10 2022-1 Asia Africa Americas Europe Oceania 7 Note: Given delays in entering applications in processing systems, the last few months understate the number of applications. May 2021 surge driven by applications from India
  • 8. Admissions: PRs by Categories—2018-22 12,500 25,000 37,500 50,000 2018-1 2018-4 2018-7 2018-10 2019-1 2019-4 2019-7 2019-10 2020-1 2020-4 2020-7 2020-10 2021-1 2021-4 2021-7 2021-10 2022-1 Economic - PNP Economic - Fed Family Refugees Other 8
  • 9. Admissions: PRs Region of Citizenship—2018-22 25% 50% 75% 100% 2018-1 2018-4 2018-7 2018-10 2019-1 2019-4 2019-7 2019-10 2020-1 2020-4 2020-7 2020-10 2021-1 2021-4 2021-7 2021-10 2022-1 Asia Africa Americas Europe Oceania 9
  • 10. Admissions: Provincial Nominee Program— 2018-22 2,250 4,500 6,750 9,000 2018-1 2018-4 2018-7 2018-10 2019-1 2019-4 2019-7 2019-10 2020-1 2020-4 2020-7 2020-10 2021-1 2021-4 2021-7 2021-10 2022-1 10
  • 11. Admissions: PRs Canada Total March Comparison: 2022/21, 2022/20, Full year 2021/18 -75% 0% 75% 150% 225% 300% Economic - PNP Economic - Fed Family Refugees 25.2% -5.8% 60.2% -14.3% 204.8% 57.2% 135% 82.6% 95.8% 109.7% 49.2% 146% March 2022/21 March 2022/20 Full year 2021/18 11
  • 12. Admissions: PNP Provinces March Comparison: 2022/21, 2022/20, Full year 2021/18 -125% 0% 125% 250% 375% 500% Atlantic ON MB SK AB BC 54.2% -5.2% -29.9% 8.6% 43.7% 33.3% 80% 113.3% 500% 190.6% 56.9% 116.9% 165.1% 97.9% 132.6% 84.2% 181.8% 321.7% March 2022/21 March 2022-20 Full year 2021/18 12
  • 13. Admissions: Permanent Residents by Citizenship March Comparison: 2022/21, 2022/20, Full year 2021/18 Top 10 Countries — Ordered by 2018 base year -100% 0% 100% 200% 300% India Philippines China Syria Nigeria USA Pakistan France Eritrea UK 15.5% -6.2% 105.2% -12.2% 9.1% 42.2% -53.7% 4.2% -48.8% 82.2% 63.5% 68.8% 262.1% 23.8% 55.6% 156.3% 33.3% 89.8% 66.9% 123.7% 21.2% 157.1% 25.8% 117.6% 37.4% 41% 77.8% 38.3% 199.3% 67.6% March 2022/21 March 2022/20 Full year 2021/18 13
  • 14. Admissions: Temporary to Permanent Residents By Program—2018-22 10,000 20,000 30,000 40,000 2018-1 2018-4 2018-7 2018-10 2019-1 2019-4 2019-7 2019-10 2020-1 2020-4 2020-7 2020-10 2021-1 2021-4 2021-7 2021-10 2022-1 IMP Post-Graduate WP Students TFWP 14
  • 15. Admissions by Province: TRs to PRs March Comparison: 2022/21, 2022/20, Full year 2021/18 -155% 59% 273% 486% 700% Atlantic QC ON MB SK AB BC 204.9% 64.8% 24.6% 236.2% 313.3% 67.5% 205% 273.1% 104.3% 160.5% 325% 303.6% 605.8% 398.7% 105.6% 93.3% 67.8% 87% 25.7% 96.4% 312% March 2022/21 March 2022/20 Full year 2021-18 15
  • 16. Admissions: TRs to PRs March Comparison: 2022/21, 2022/20, Full year 2021/18 0% 100% 200% 300% 400% IMP Post-Graduate WP Students TFWP 136.5% 106.5% 260% 204.5% 194.5% 253.2% 334.5% 287.5% 95.2% 72.4% 64.9% 60.5% March 2022/21 March 2022/20 Full year 2021/18 16
  • 17. Asylum Claimants: Of fi ce Type 2018-22 1,750 3,500 5,250 7,000 2018-1 2018-4 2018-7 2018-10 2019-1 2019-4 2019-7 2019-10 2020-1 2020-4 2020-7 2020-10 2021-1 2021-4 2021-7 2021-10 2022-1 Airport Border Inland 17
  • 18. Asylum Claimants: Year-over-year March Comparison: 2022/21, 2022/20, Full year 2021/18 -750% 0% 750% 1,500% 2,250% 3,000% Airport Border Inland -54.7% -56.2% -50.1% 5.4% 158.8% 145.6% 107.2% 1,375% 2,325% March 2022/21 March 2022-20 Full year 2021/18 18
  • 19. Asylum Claimants: Year-over-year March Comparison: 2022/21, 2022/20, Full year 2021/18 -400% 0% 400% 800% 1,200% 1,600% India Mexico Iran Nigeria Colombia Pakistan China Turkey Haiti USA -78.4% 37.1% -8.7% -67.9% -62.1% -23.6% -93.6% -23.1% -5.3% -67% -26.3% 276.3% 664.7% -31.3% 9.7% 111.4% 11.1% 5.6% 97.7% -30.7% 250% 1,488.9% 1,200% 22.2% 580% 365% 500% 192.3% 443.8% 73.3% March 2022/21 March 2022-20 Full year 2021-18 19
  • 20. Immigrate to Canada—Web Interest 250,000 500,000 750,000 1,000,000 2018-1 2018-4 2018-7 2018-10 2019-1 2019-4 2019-7 2019-10 2020-1 2020-4 2020-7 2020-10 2021-1 2021-4 2021-7 2021-10 2022-1 2022-4 Canada Asia Americas Africa Europe Oceania Not speci fi ed 20
  • 21. Immigrate to Canada—Web Interest April Comparison: 2022/21, 2022/20 Top 10 Countries by “Immigrate to Canada” ordered by site visits, 2018 base year -45% 0% 45% 90% 135% 180% India USA Nigeria UK UAE Pakistan Philippines Mexico Saudi Arabia Brazil 15.7% 63.3% 64.2% 178.8% 63% 56.5% -14.2% 12.1% -26.2% 15.7% -33.4% -2.5% 41.3% 14.5% 8.8% 3.2% -2.8% -8.2% -0.3% -20.1% April 2022/21 April 2022/20 21
  • 23. IMP & TFWP Work Permit Holders—2018-22 12,500 25,000 37,500 50,000 2018-1 2018-5 2018-9 2019-1 2019-5 2019-9 2020-1 2020-5 2020-9 2021-1 2021-5 2021-9 2022-1 Agreements Cdn Interests Other IMP Vulnerable Not Stated Caregivers Agriculture LMIA 23
  • 24. IMP by Region of Citizenship—2018-22 0% 25% 50% 75% 100% 2018-1 2018-4 2018-7 2018-10 2019-1 2019-4 2019-7 2019-10 2020-1 2020-4 2020-7 2020-10 2021-1 2021-4 2021-7 2021-10 2022-1 Asia Europe Americas Africa Oceania 24
  • 25. TFWP by Region of Citizenship—2018-22 0% 25% 50% 75% 100% 2018-1 2018-4 2018-7 2018-10 2019-1 2019-4 2019-7 2019-10 2020-1 2020-4 2020-7 2020-10 2021-1 2021-4 2021-7 2021-10 2022-1 Americas Asia Europe Africa Oceania 25
  • 26. IMP & TFWP Work Permit Holders Total Year to Year Comparison (quarterly) -80% -40% 0% 40% 80% 120% 160% 2019-Q1 2019-Q2 2019-Q3 2019-Q4 2020-Q1 2020-Q2 2020-Q3 2020-Q4 2021-Q1 2021-Q2 2021-Q3 2021-Q4 2022-Q1 -19.4% -19.8% -1% 27.6% 72.3% 5.4% -13.2% -19.9% -7% 39.3% 16.7% 15.8% 6.5% -22.2% -37.6% 146.6% 54.7% 57.6% 29.8% -54.4% -47.5% 2.6% 42.7% 10.6% 30.7% 1.5% IMP TFWP 26
  • 27. Temporary Residents by Program Canada March Comparison: 2022/21, 2022/20, Full year 2022/18 -90% -45% 0% 45% 90% 135% 180% Agreements Canadian Interests Caregivers Agriculture LMIA 58.8% 13.6% -26% 27.7% -17.7% 70.6% 177.9% 50% 79.1% 54.7% -20.6% 1.3% -50.4% -22.7% -3.6% March 2022/21 March 2022/20 Full year 2021/18 27
  • 28. IMP by Citizenship March Comparison: 2022/21, 2022/20 Top 10 Countries—Ordered by 2018 base year -50% -25% 0% 25% 50% 75% 100% India USA France China UK Australia Ireland Korea Brazil Japan 5.6% 35.6% -2.8% 2.1% -16.7% -0.8% 97.9% 23.3% 25.3% 87.7% 63% -33.3% -16% 75% 81.8% 26.6% -47.5% 39.2% 11% -43.6% March 2022/21 March 2022/20 28
  • 29. TFWP by Citizenship March Comparison: 2022/21, 2022/20 Top 10 Countries—Ordered by 2018 base year -75% 0% 75% 150% 225% 300% Mexico Jamaica Guatemala Philippines India Korea USA UK China France 21.1% 50% 30% 42.9% 11.4% 24.5% 79.5% 296.6% 177.7% 221.7% -11.5% -53.8% -45.8% 66.7% -25% -29.3% -37.8% 30.2% -23% -6.3% March 2022/21 March 2022/20 29
  • 30. Work Permits—Web Interest 40,000 80,000 120,000 160,000 2018-1 2018-4 2018-7 2018-10 2019-1 2019-4 2019-7 2019-10 2020-1 2020-4 2020-7 2020-10 2021-1 2021-4 2021-7 2021-10 2022-1 2022-4 Canada Asia Americas Europe Oceania Africa Not captured 30
  • 31. Work Permits—Web Interest April Comparison: 2022/21, 2022/20 Top 10 Countries by “Get a work permit” ordered by site visits, 2018 base year 0% 150% 300% 450% 600% India USA Mexico UK Australia Pakistan Brazil Philippines UAE Saudi Arabia 237.3% 312.5% 570.9% 69% 80.6% 53.7% 22.8% 121% 2.9% 55.5% 165.9% 149% 211.8% 1.2% 65.9% 108.7% 37.1% 63.1% 34.6% 15.1% April 2022/21 April 2022/20 31
  • 33. Study Permit Applications—By Region—2018-22 17,500 35,000 52,500 70,000 2018-1 2018-4 2018-7 2018-10 2019-1 2019-4 2019-7 2019-10 2020-1 2020-4 2020-7 2020-10 2021-1 2021-4 2021-7 2021-10 2022-2 Asia Africa Americas Europe Oceania 33
  • 34. Study Permit Holders—By Level—2018-22 30,000 60,000 90,000 120,000 2018-1 2018-5 2018-9 2019-1 2019-5 2019-9 2020-1 2020-5 2020-9 2021-1 2021-5 2021-9 2022-1 Secondary or less Post Secondary Other Studies 34
  • 35. Study Permit Holders—By Region—2018-22 0% 25% 50% 75% 100% 2018-1 2018-4 2018-7 2018-10 2019-1 2019-4 2019-7 2019-10 2020-1 2020-4 2020-7 2020-10 2021-1 2021-4 2021-7 2021-10 2022-1 Asia Africa Americas Europe Oceania 35
  • 36. Study Permit Holders by Citizenship March Comparison: 2022/21, 2022/20 Top 10 Countries — Ordered by Number of Permits, 2018 base year -100% 0% 100% 200% 300% 400% India China Korea France Vietnam Brazil Iran Japan USA Nigeria 180% 84% 351% 95% 71.2% 80% 87.5% 9.2% 31.5% 167.9% 28.4% 0% 97.3% -2.5% 60.3% 8.6% -25.6% 20.3% -6.4% 5.5% March 2022/21 March 2022/20 36
  • 37. Study Permit Holders by Province March Comparison: 2022/21, 2022/20, Full year 2021/18 -90% 7.5% 105% 202.5% 300% Atlantic QC ON MB SK AB BC 16.1% 28.6% 13.0% 6.4% 27.3% 45.7% 18.5% 138.6% 166.7% 222.2% 101.4% 183.9% 2.9% 159.7% 15.9% -0.4% 7.4% -5.7% 15.7% -3.8% 2.4% March 2022/21 March 2022/20 Full year 2021/18 37
  • 38. Study Permits—Web Interest 40,000 80,000 120,000 160,000 2018-1 2018-4 2018-7 2018-10 2019-1 2019-4 2019-7 2019-10 2020-1 2020-4 2020-7 2020-10 2020-1 2021-4 2021-7 2021-10 2022-1 2022-4 Canada Asia Americas Africa Europe Oceania Not captured 38
  • 39. Study Permits—Web Interest April Comparison: 2022/21, 2022/20 Top 10 Countries by “Get your study permit” ordered by site visits, 2018 base year -175% 0% 175% 350% 525% 700% India USA China Nigeria Brazil PhilippinesColombia Mexico Iran Pakistan 94.6% -88.6% 68.4% 215.4% 403.5% 99.4% 197% -16.5% 20.9% 131% 2.5% 647.6% -35% -16.1% 20.5% -6.7% 31.2% -22.8% -14.8% -34.7% April 2022/21 April 2022/20 39
  • 41. Settlement—By Service—2018-20 In Canada Services—Top 25 Countries 20,000 40,000 60,000 80,000 2018-1 2018-4 2018-7 2018-10 2019-1 2019-4 2019-7 2019-10 2020-1 2020-4 2020-7 2020-10 Community Connections Employment Related Services Information and Orientation Services Language Assessment Language Training Needs & Assets Assessment and Referrals Resettlement Assistance Program Service Delivery Improvement 41
  • 42. Settlement Services Year-over-year Comparison by Service—December 2020, Last Quarter Community Employment Information/Orientation Language Assessment Language Training Needs Assessment, Referrals Resettlement Assistance -100% -72.5% -45% -17.5% 10% -88.2% -30.5% -13.3% -71.1% 1.5% -24.3% -23.3% -48.4% -29.3% -9.8% -68.2% -9.1% -36.2% -40.3% December 2020 July-September 42
  • 43. Settlement Services Year-over-year Comparison by Province—December 2020, Last Quarter -50% -37.5% -25% -12.5% 0% Atlantic QC ON MB SK AB BC -18.4% -23.2% -24.8% -26.5% -7.4% -28.4% -45.8% -19.7% -13.4% -24.1% -35.8% -15.9% -28.9% -21.8% December 2020 July-September 43
  • 44. Settlement Services by Citizenship Year-over-year Comparison—December 2020, Last Quarter Top 10, 2018 base year -40% -30% -20% -10% 0% 10% Syria Eritrea Congo Somalia Afghanistan India Pakistan Korea Mexico Philippines -14.3% -15.4% -29.3% -16.6% -15.6% -15.9% -28.1% -24.5% -17.4% -23.5% -38.3% -26.1% -17.3% -18.8% -2.2% 0.9% -32.5% -36.4% -23.3% -20.2% December 2020 July-September 44
  • 45. Settlement Services—Web Interest 12,500 25,000 37,500 50,000 2018-11 2019-3 2019-7 2019-11 2020-3 2020-7 2020-11 2021-3 2021-7 2021-11 2022-3 Canada Asia Americas Europe Africa Oceania Not speci fi ed 45
  • 46. Settlement Services—Web Interest April Comparison: 2022/21, 2022/20 Top 10 Countries by “Find immigrant services near you” ordered by site visits, 2018 base year -100% -50% 0% 50% 100% 150% 200% India USA Brazil UAE Pakistan Nigeria Mexico UK ColombiaPhilippines 187.9% 8.6% -11.8% -34.6% -26.2% -30% -19.3% -50.4% -40% -29.4% 50.9% -52.8% -31.8% -44.7% -20.7% -57.9% -41% -73.2% -37.3% -57.3% April 2022/21 April 2022/20 46
  • 48. Citizenship Applications—2018-21 7,500 15,000 22,500 30,000 2018-1 2018-4 2018-7 2018-10 2019-1 2019-4 2019-7 2019-10 2020-1 2020-4 2020-7 2020-10 2021-1 2021-4 48
  • 49. New Citizens—By Region of Birth—2018-21 12,500 25,000 37,500 50,000 2018-1 2018-4 2018-7 2018-10 2019-1 2019-4 2019-7 2019-10 2020-1 2020-4 2020-7 2020-10 2021-1 2021-4 2021-7 2021-10 2022-1 Asia Africa Americas Europe Oceania 49
  • 50. Citizenship by Region of Birth March Comparison: 2022/21, 2022/20, Full year 2021/18 -200% 850% 1,900% 2,950% 4,000% Philippines India Iran China Pakistan Nigeria USA Egypt Iraq France -30.2% -46.5% -55.8% -22.8% -27.3% -42.4% -49.8% -52.4% 4.9% -9.8% 698.8% 510.2% 452.9% 487.6% 490.3% 395% 237.9% 394.6% 338.4% 174.3% 3,472.2% 1,837.5% 1,337.5% 1,018.3% 2,928.9% 1,828.7% 763.4% 1,134.8% 1,515.5% 920.8% March 2022/21 March 2022/20 Full year 2021/18 50
  • 51. Citizenship—Web Interest Note: Technical anomaly April - December 2019 45,000 90,000 135,000 180,000 2018-1 2018-7 2019-1 2019-7 2020-1 2020-7 2021-1 2021-7 2022-1 Canada Americas Asia Europe Africa Oceania Not captured 51
  • 52. Citizenship—Web Interest April Comparison: 2022/21, 2022/20 Top 10 Countries by “Apply for Citizenship” ordered by site visits, 2018 base year -60% -30% 0% 30% 60% 90% 120% USA India UK Pakistan UAE Nigeria China Brazil Turkey Bangladesh -18.2% 110.6% 22.3% 45.3% 23.2% 31.4% 48.6% -26.3% -18.7% -34.2% -24.6% 3.1% -16.7% 4.5% 15.4% 14.2% 6.3% 20.6% -21% 8.9% April 2022/21 April 2022/20 52
  • 54. Visitor Visas—By Source Country—2018-22 45,000 90,000 135,000 180,000 2018-1 2018-4 2018-7 2018-10 2019-1 2019-4 2019-7 2019-10 2020-1 2020-4 2020-7 2020-10 2021-1 2021-4 2021-7 2021-10 2022-1 Asia Americas Africa Europe Oceania Other 54 Note: Increase in Europe driven by Ukraine
  • 55. Visitor Visas—By Source Country March Comparison: 2022/21, 2022/20 Top 10 Countries—Ordered by 2018 base year -500% 1,125% 2,750% 4,375% 6,000% China India Philippines Iran Brazil Vietnam Colombia Algeria Pakistan Russia -68.6% 64.4% 74.9% 88.6% -15% -0.1% 358.1% -21.4% 119.2% 183.1% 380% 1,595.1% 1,258.1% 5,841.2% 4,803.7% 1,217.9% 594.6% 370.3% 3,262.8% 1,971.5% March 2022-21 March 2022/20 55 Note: The most dramatic impact is the number of visas issued to Ukrainians under the Canada-Ukraine authorization for emergency travel, from a pre- pandemic average of 648 per month in 2019 to 21,465 March 2022.
  • 56. Research Questions 56 • Which programs contracted most quickly and which source countries were most a ff ected? Similarly, which programs and source countries recovered more quickly? • Did application success rates vary pre and post-COVID by source country? • Were exogenous factors such as US immigration restrictions or tensions with China a factor? • Did interest in immigrating to Canada increase or decrease and for which countries?
  • 58. Top Countries Share of Total (2018) 10 Countries 25 Countries Permanent Residents 60.9% 77.7% IMP 70.8% 86.4% TFWP 85.2% 93.2% Study Permits 70.3% 73.8% Asylum Claimants 57.4% 77.4% Citizenship 50.3% 71.5% 58
  • 59. Top Countries (2018) Permanent Residents IMP TFWP Students Settlement Citizenship India 69,980 India 55,610 Mexico 28,860 India 107,105 Syria 15,530 Philippines 19,647 Philippines 35,050 USA 26,540 Jamaica 10,200 China 85,100 Eritrea 11,865 India 19,486 China 29,710 Finland 23,445 Guatemala 9,810 Korea 16,875 Congo 11,355 Iran 10,037 Syria 12,045 China 21,910 Philippines 8,750 Vietnam 12,370 Somalia 10,785 PRC 9,718 Nigeria 10,920 UK 11,205 India 7,380 Iran 7,040 Afghanistan 9,550 Pakistan 9,406 USA 10,905 Australia 8,850 Korea 1,960 Japan 6,685 India 9,035 Nigeria 4,398 Pakistan 9,490 Ireland 8,675 USA 1,850 Bangladesh 4,155 Pakistan 8,360 USA 4,229 France 6,175 Korea 8,105 UK 940 Philippines 4,075 Korea of 7,775 Egypt 4,115 Eritrea 5,695 Brazil 8,080 China 935 Taiwan 3,160 Mexico 7,640 Iraq 3,951 UK 5,660 Japan 7,250 France 915 Saudi Arabia 2,870 Philippines 6,995 France 3,836 59
  • 60. Data Sources • PRs: Canada - Admissions of Permanent Residents by Province/Territory of Intended Destination and Immigration Category, Canada - Admissions of Permanent Residents by Country of Citizenship, COVID Immigration Impact - PR Applications Source Countries • TR to Permanent Resident transition: Canada – Admissions of Permanent Residents with Prior Post-graduate Work Permit Holder Status by Province/Territory of Intended Destination and Immigration Category, Canada – Admissions of Permanent Residents with Prior International Mobility Program Work Permit Holder Status by Province/Territory of Intended Destination and Immigration Category, Canada – Admissions of Permanent Residents with Prior Study Permit Holder Status by Province/Territory of Intended Destination and Immigration Category, Canada – Admissions of Permanent Residents with Prior Temporary Foreign Worker Program Work Permit Holder Status by Province/Territory of Intended Destination and Immigration Category • Asylum Claimants: Canada - Asylum Claimants by Claim O ffi ce Type, Province/Territory* of Claim and Claim Year, Canada - Asylum Claimants by Top Twenty-Five Countries of Citizenship (2019 ranking), Claim O ffi ce Type and Claim Year • TRs: Canada - International Mobility Program (IMP) work permit holders by province/territory of intended destination, program and year in which permit(s) became e ff ective, Canada - Temporary Foreign Worker Program (TFWP) work permit holders by province/territory of intended destination, program and year in which permit(s) became e ff ective, Canada – International Mobility Program work permit holders by country of citizenship and year in which permit(s) became e ff ective, Canada – Temporary Foreign Worker Program work permit holders by country of citizenship and year in which permit(s) became e ff ective • Study Permits: Canada - Study permit holders by country of citizenship and year in which permit(s) became e ff ective, Canada - Study permit holders by province/territory of intended destination, study level and year in which permit(s) became e ff ective, Source Countries - Applications Processed by IRCC for New Study Permit Applications • Settlement Services: Special request IRCC data table • Citizenship: Source Countries (Country of Birth) - New Canadian Citizens (in Persons) by Month • Web: Provided by IRCC • 2018 is used as baseline 60