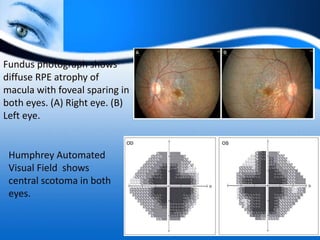
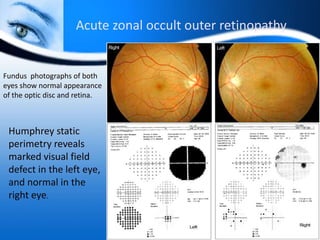
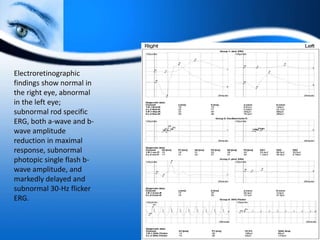
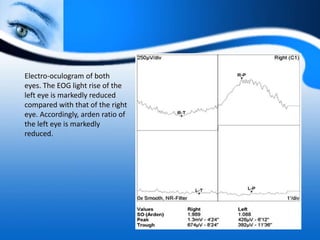
Downloaded 101 times

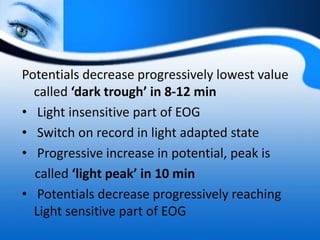
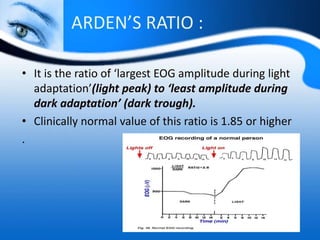
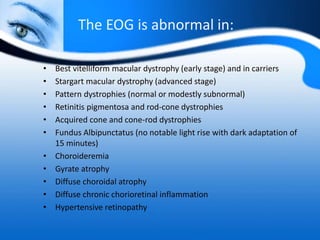
![• Light sensitive – [ Light peak ]
- Contributed by rods and cones
• Light insensitive – [ Dark trough ]
• - Contributed by RPE ,
Photoreceptors ,inner nuclear layer](https://image.slidesharecdn.com/electrooculogrameog3-181229151957/85/Electrooculogram-EOG-18-320.jpg)

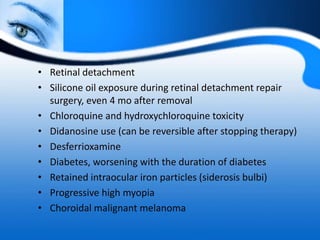
![Reporting
• According to the 2017 ISCEV standards,[2] the report of
EOG should include
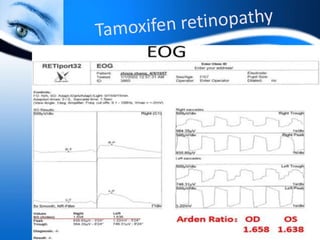
• Light peak: dark trough ratio (this terminology is
preferred over conventional Arden ratio)
• Amplitude of dark trough (mv)
• Time from the start of light phase to light peak (when
present)
• type of adapting light source
• pupil size
• Difficulties/deviation from protocol including patient
compliance, inconsistent eye movements](https://image.slidesharecdn.com/electrooculogrameog3-181229151957/85/Electrooculogram-EOG-25-320.jpg)

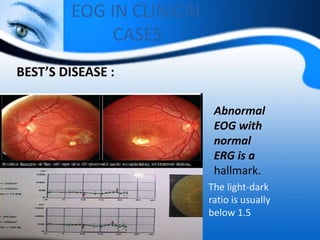

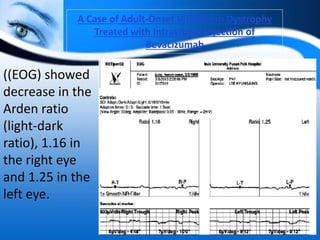
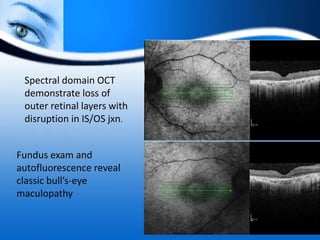
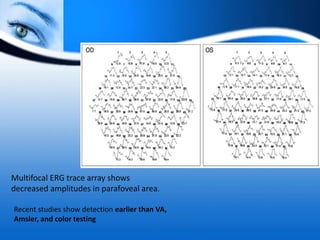
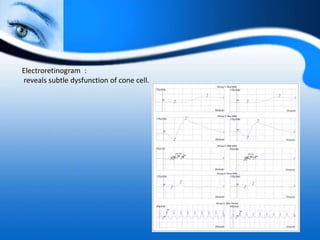
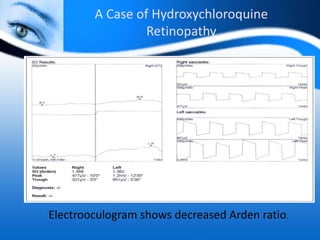


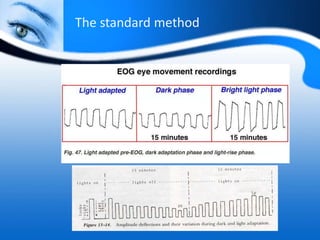
The document provides information on electrooculogram (EOG) testing guidelines from the International Society for Clinical Electrophysiology of Vision (ISCEV). It describes the standard EOG testing method which involves recording the electrical potential between the cornea and retina during dark and light adaptation over 15 minutes each. Abnormal EOG results can indicate diseases affecting the outer retina and retinal pigment epithelium. Specific conditions that cause EOG abnormalities and the diagnostic significance of EOG testing are discussed. Case examples demonstrate how EOG may be useful in evaluating and monitoring certain retinal diseases.


