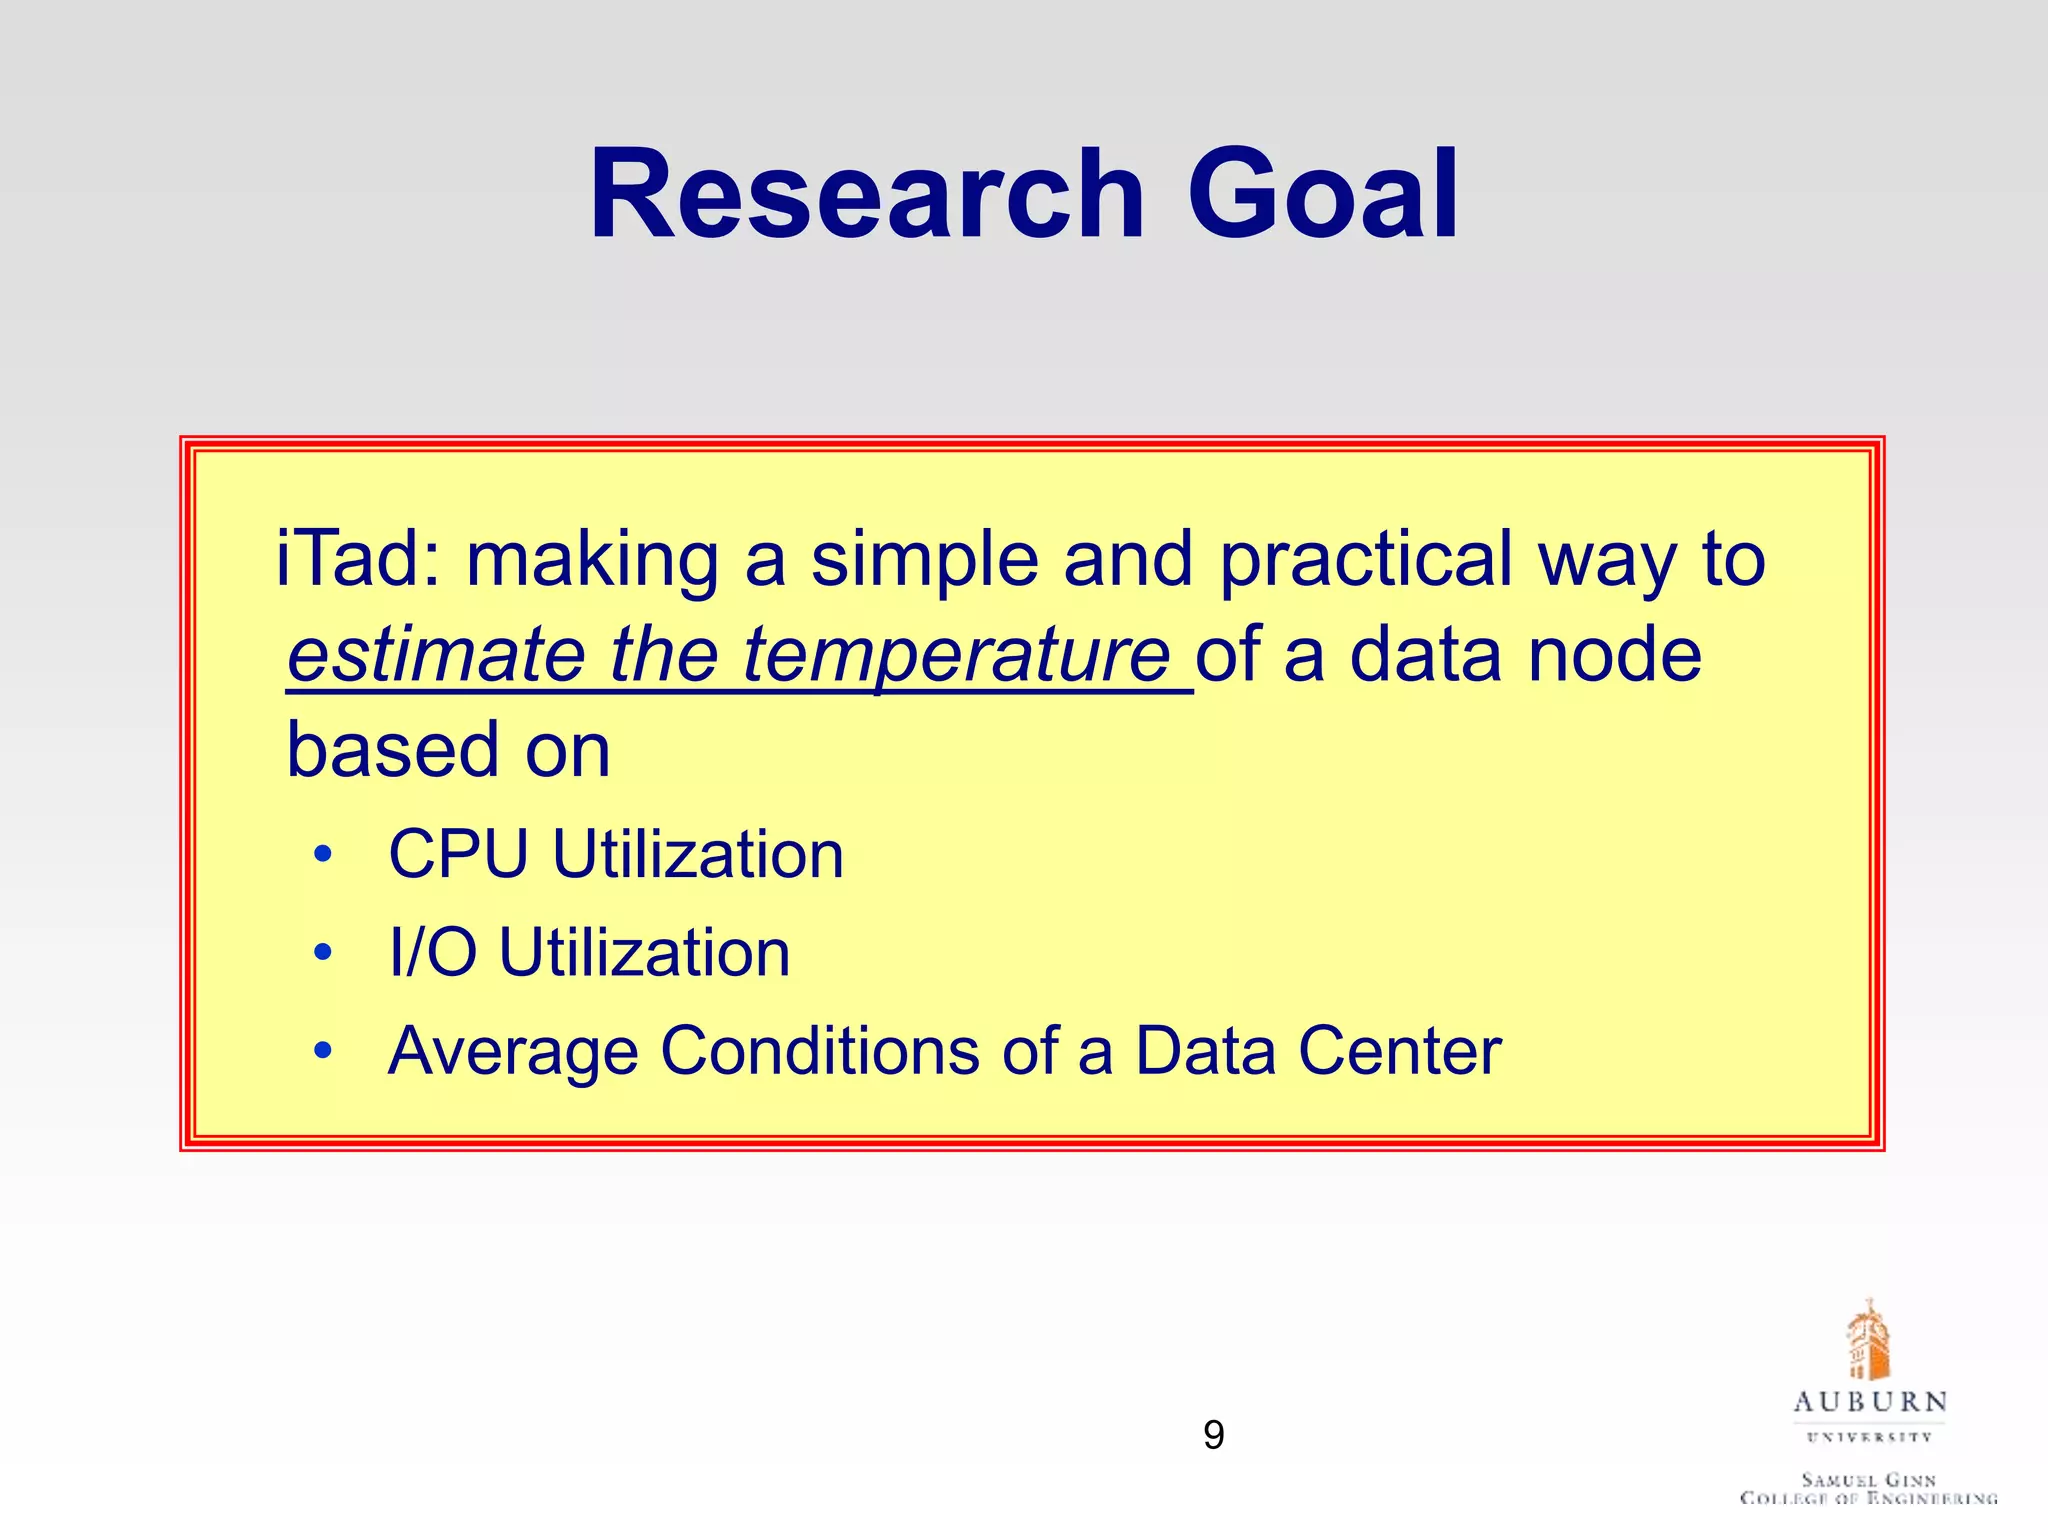
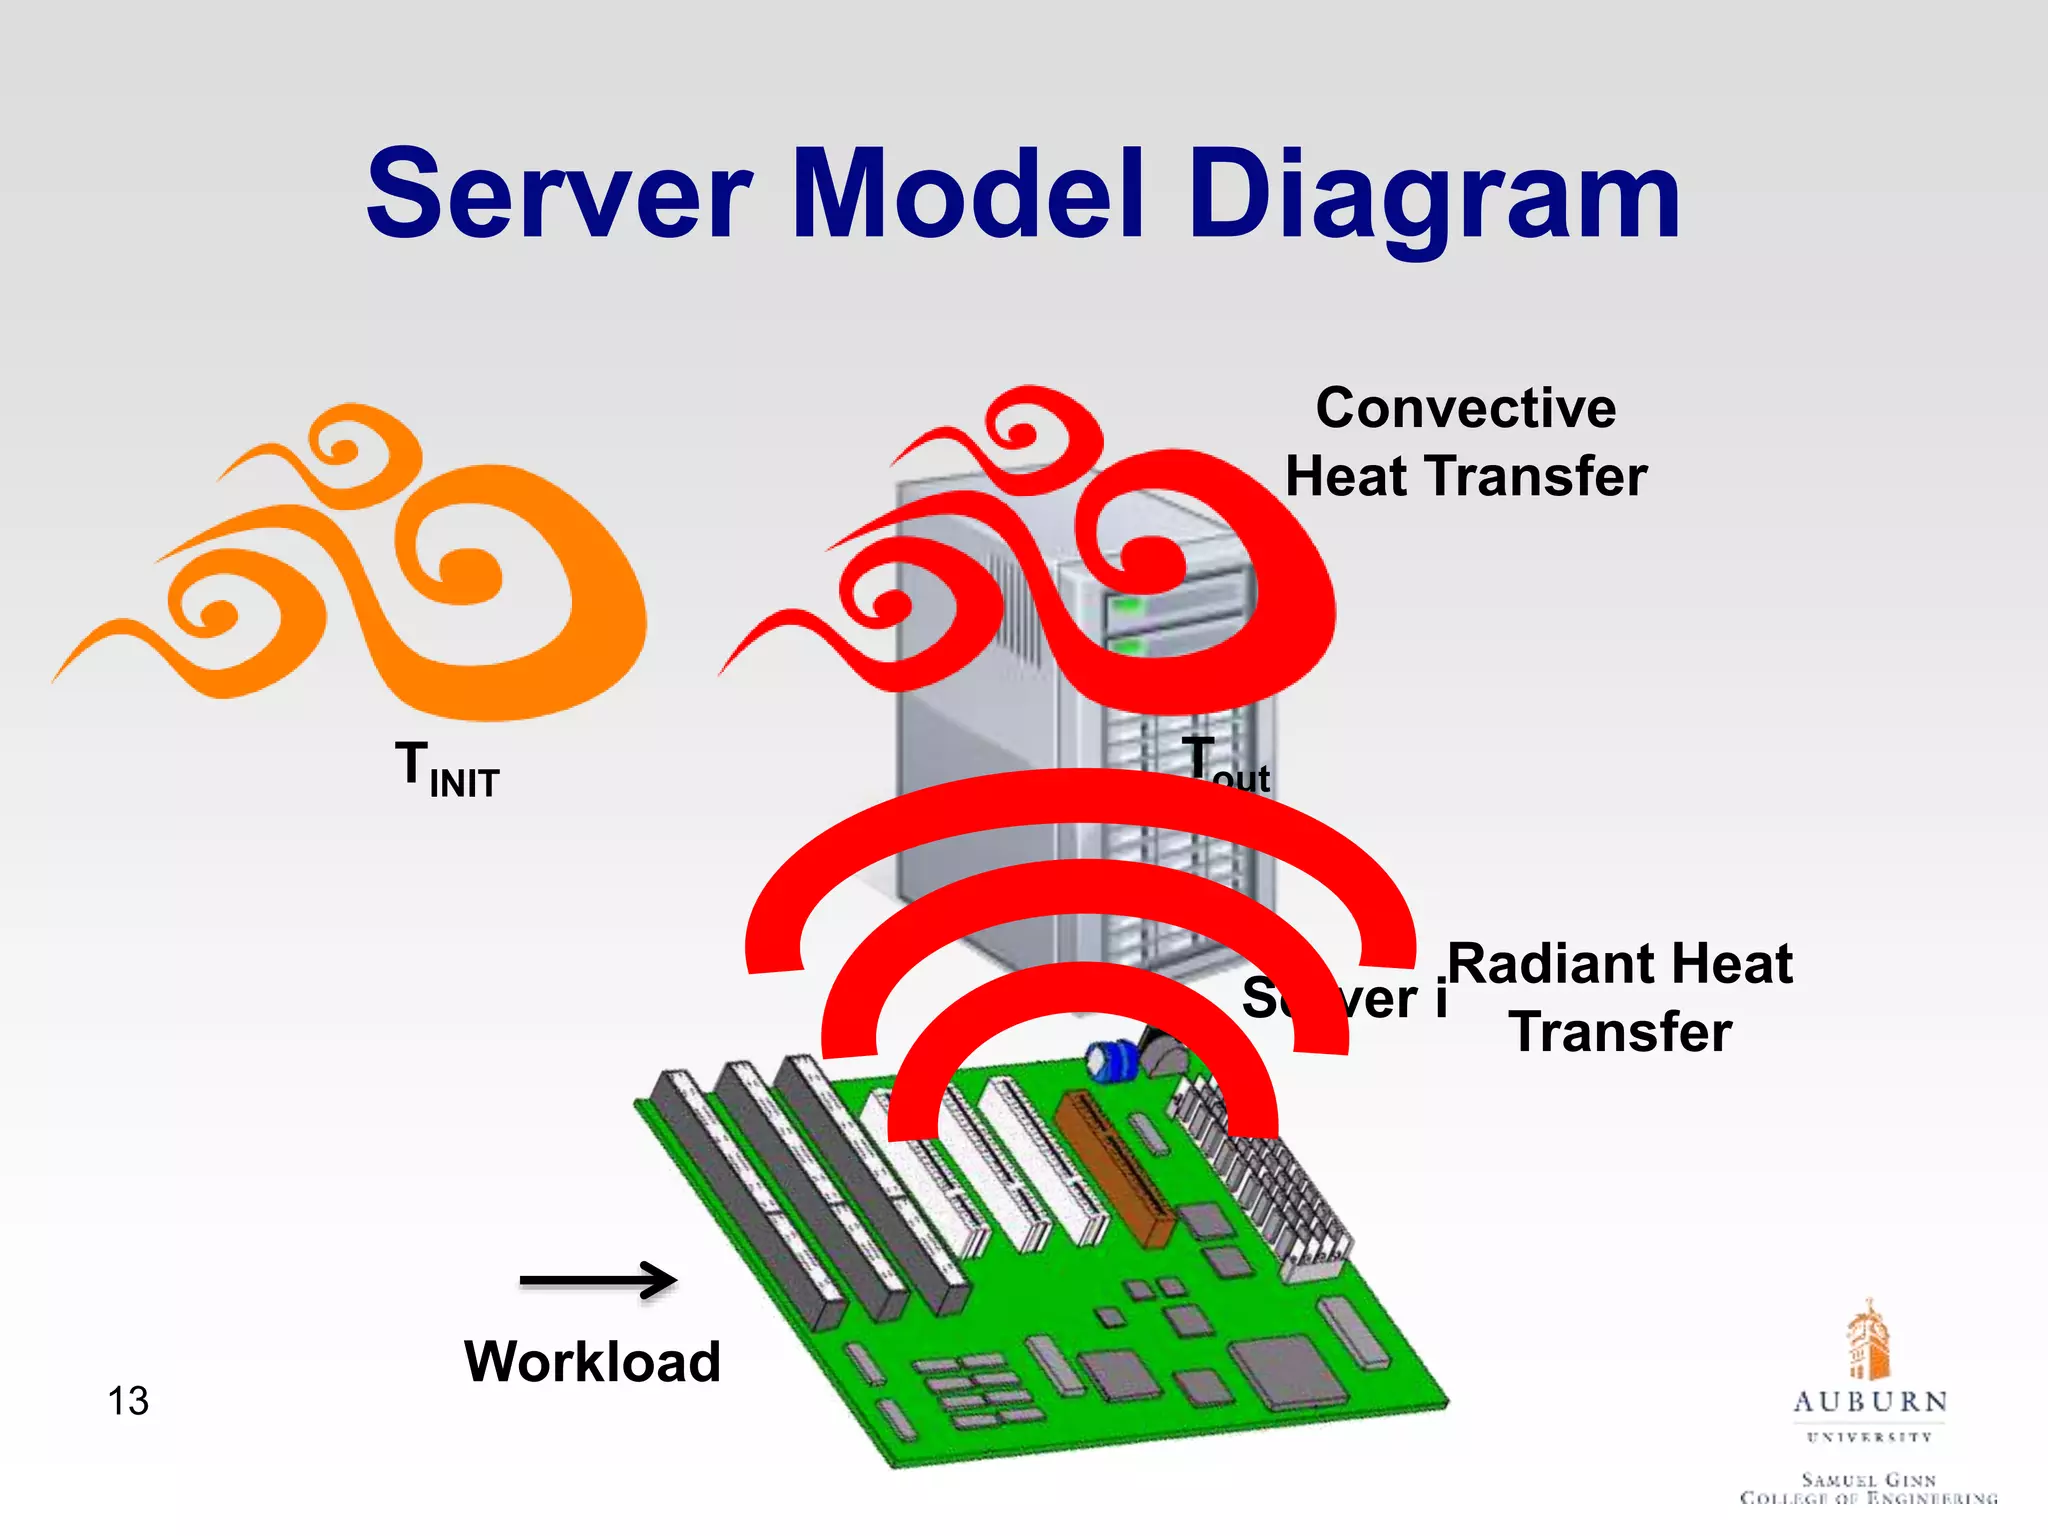
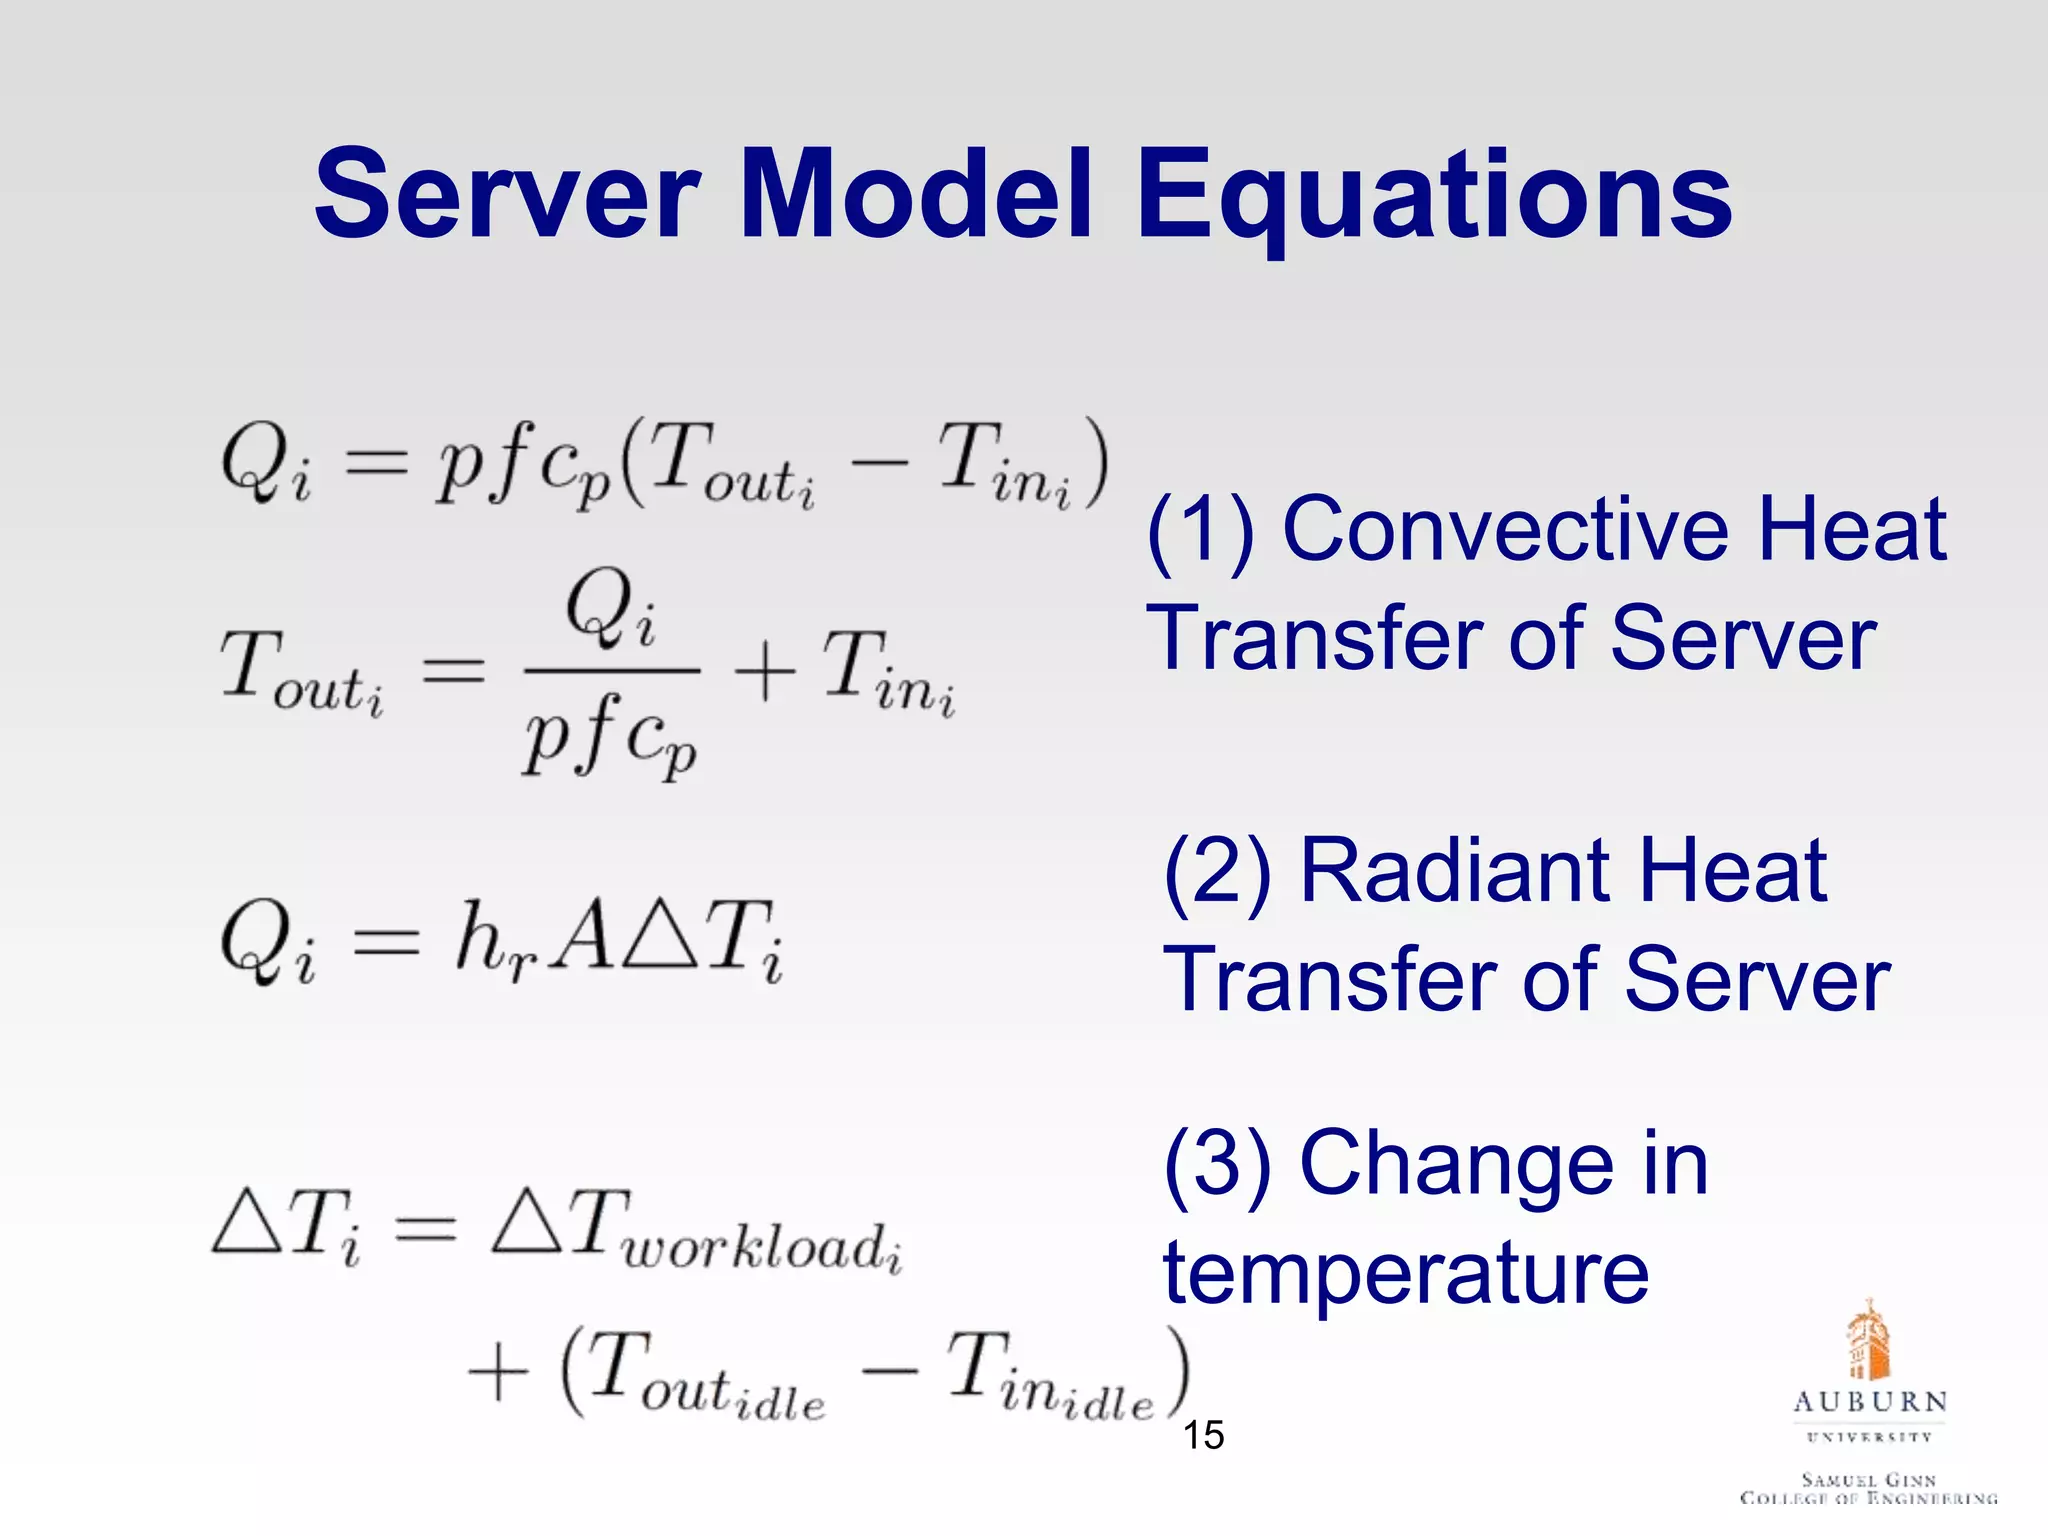
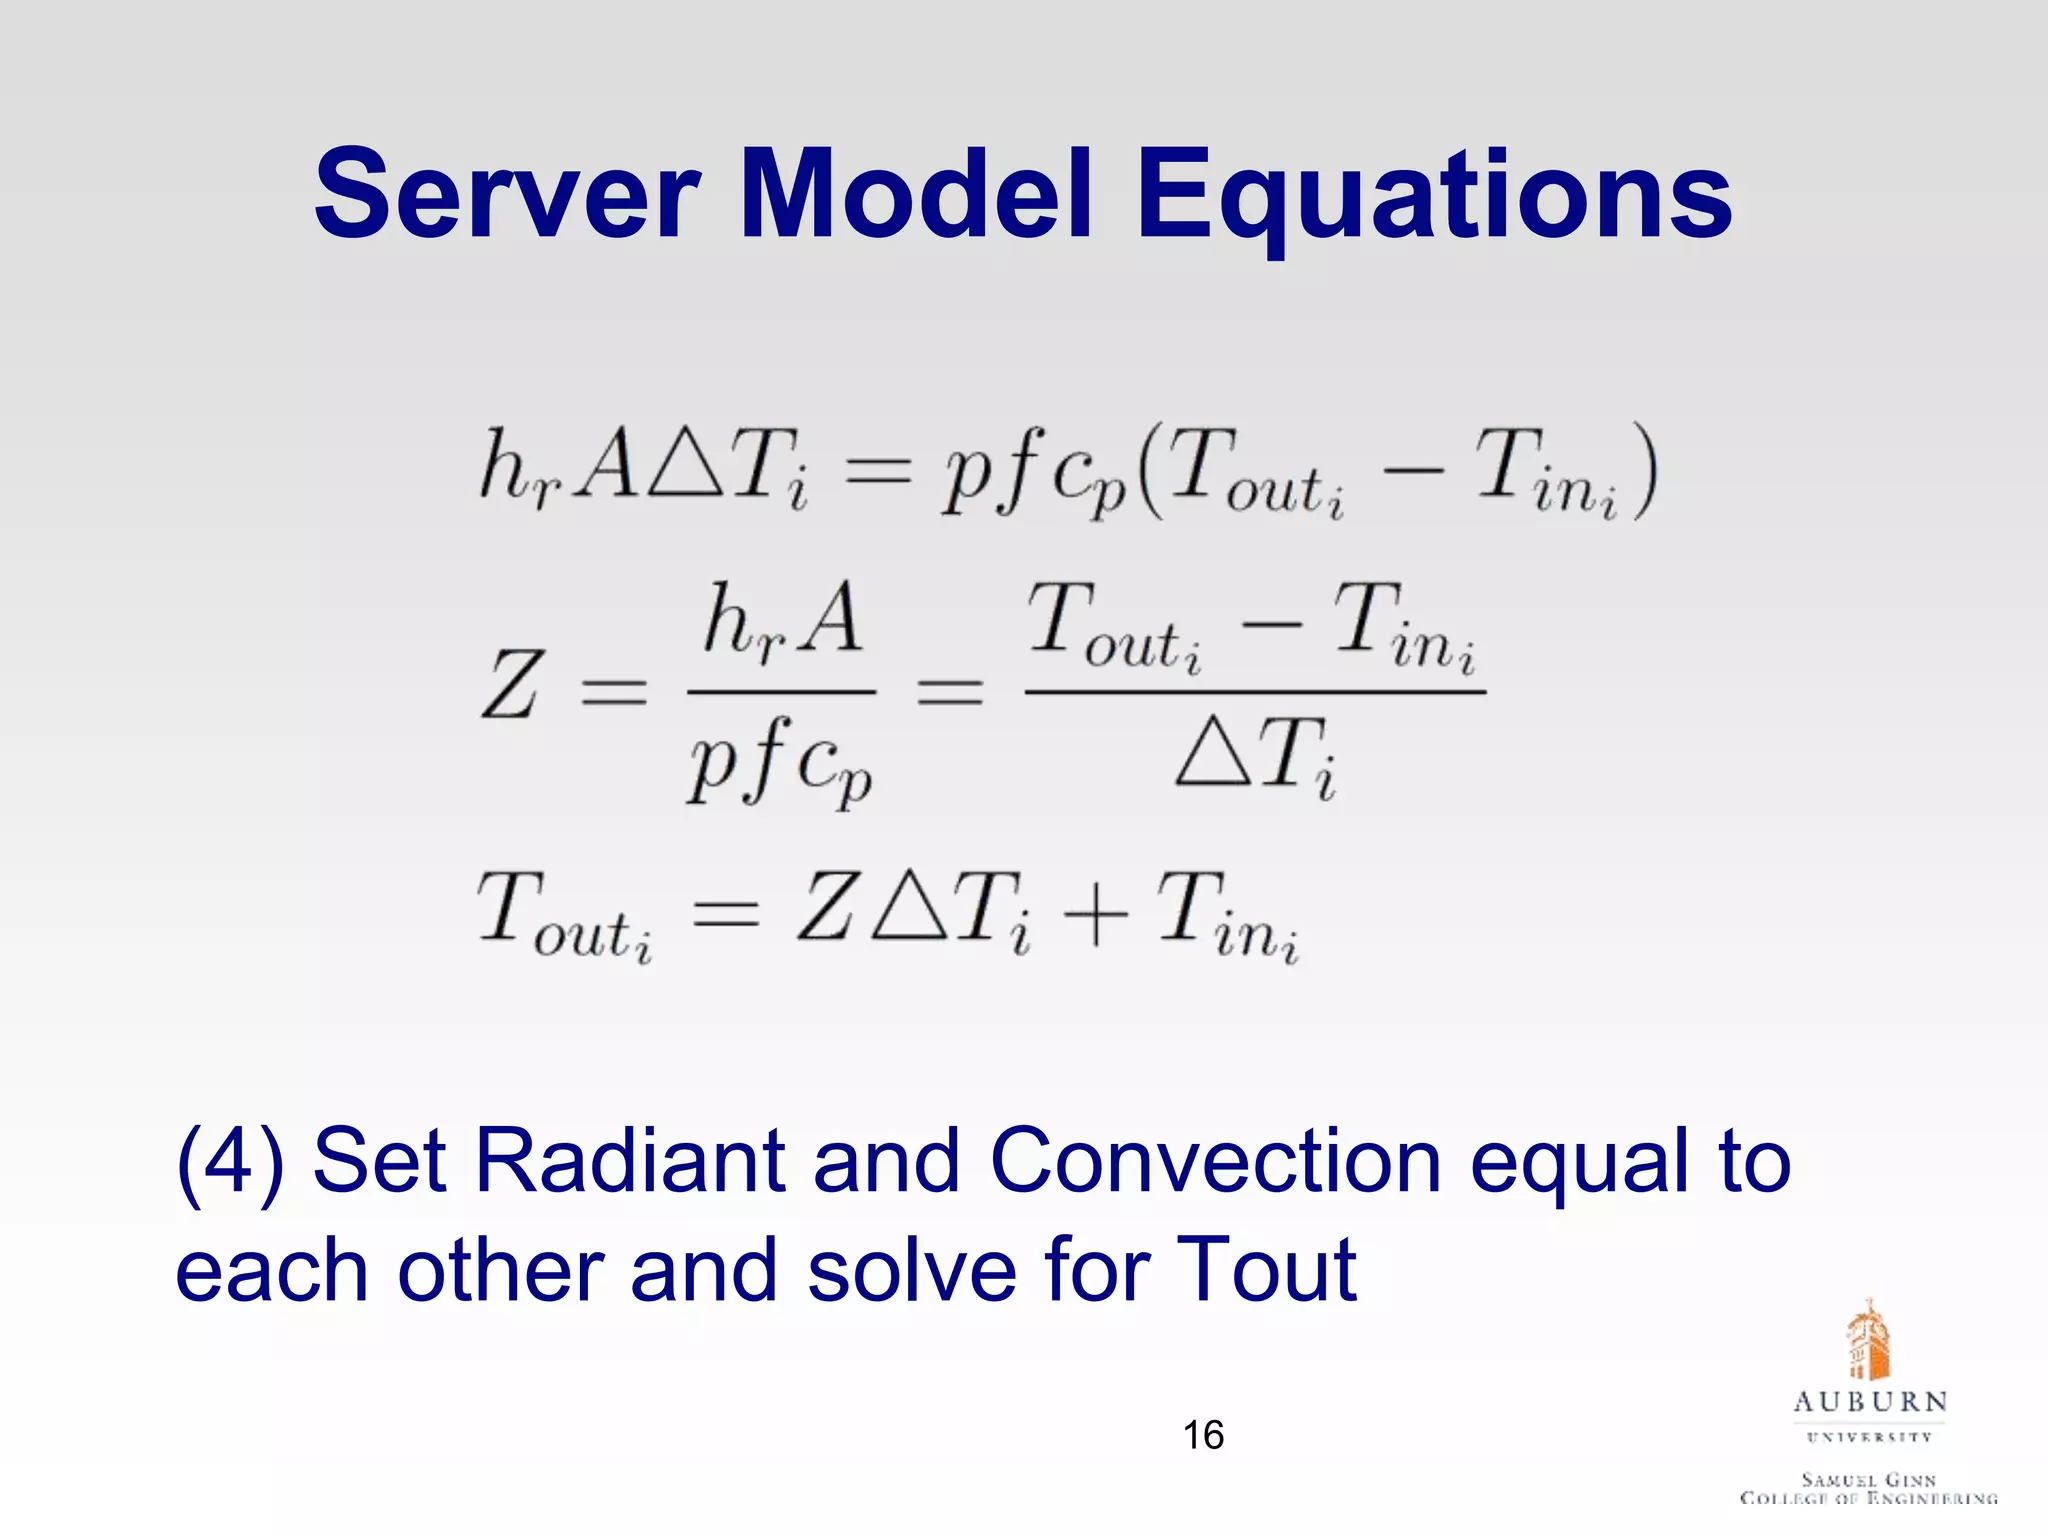
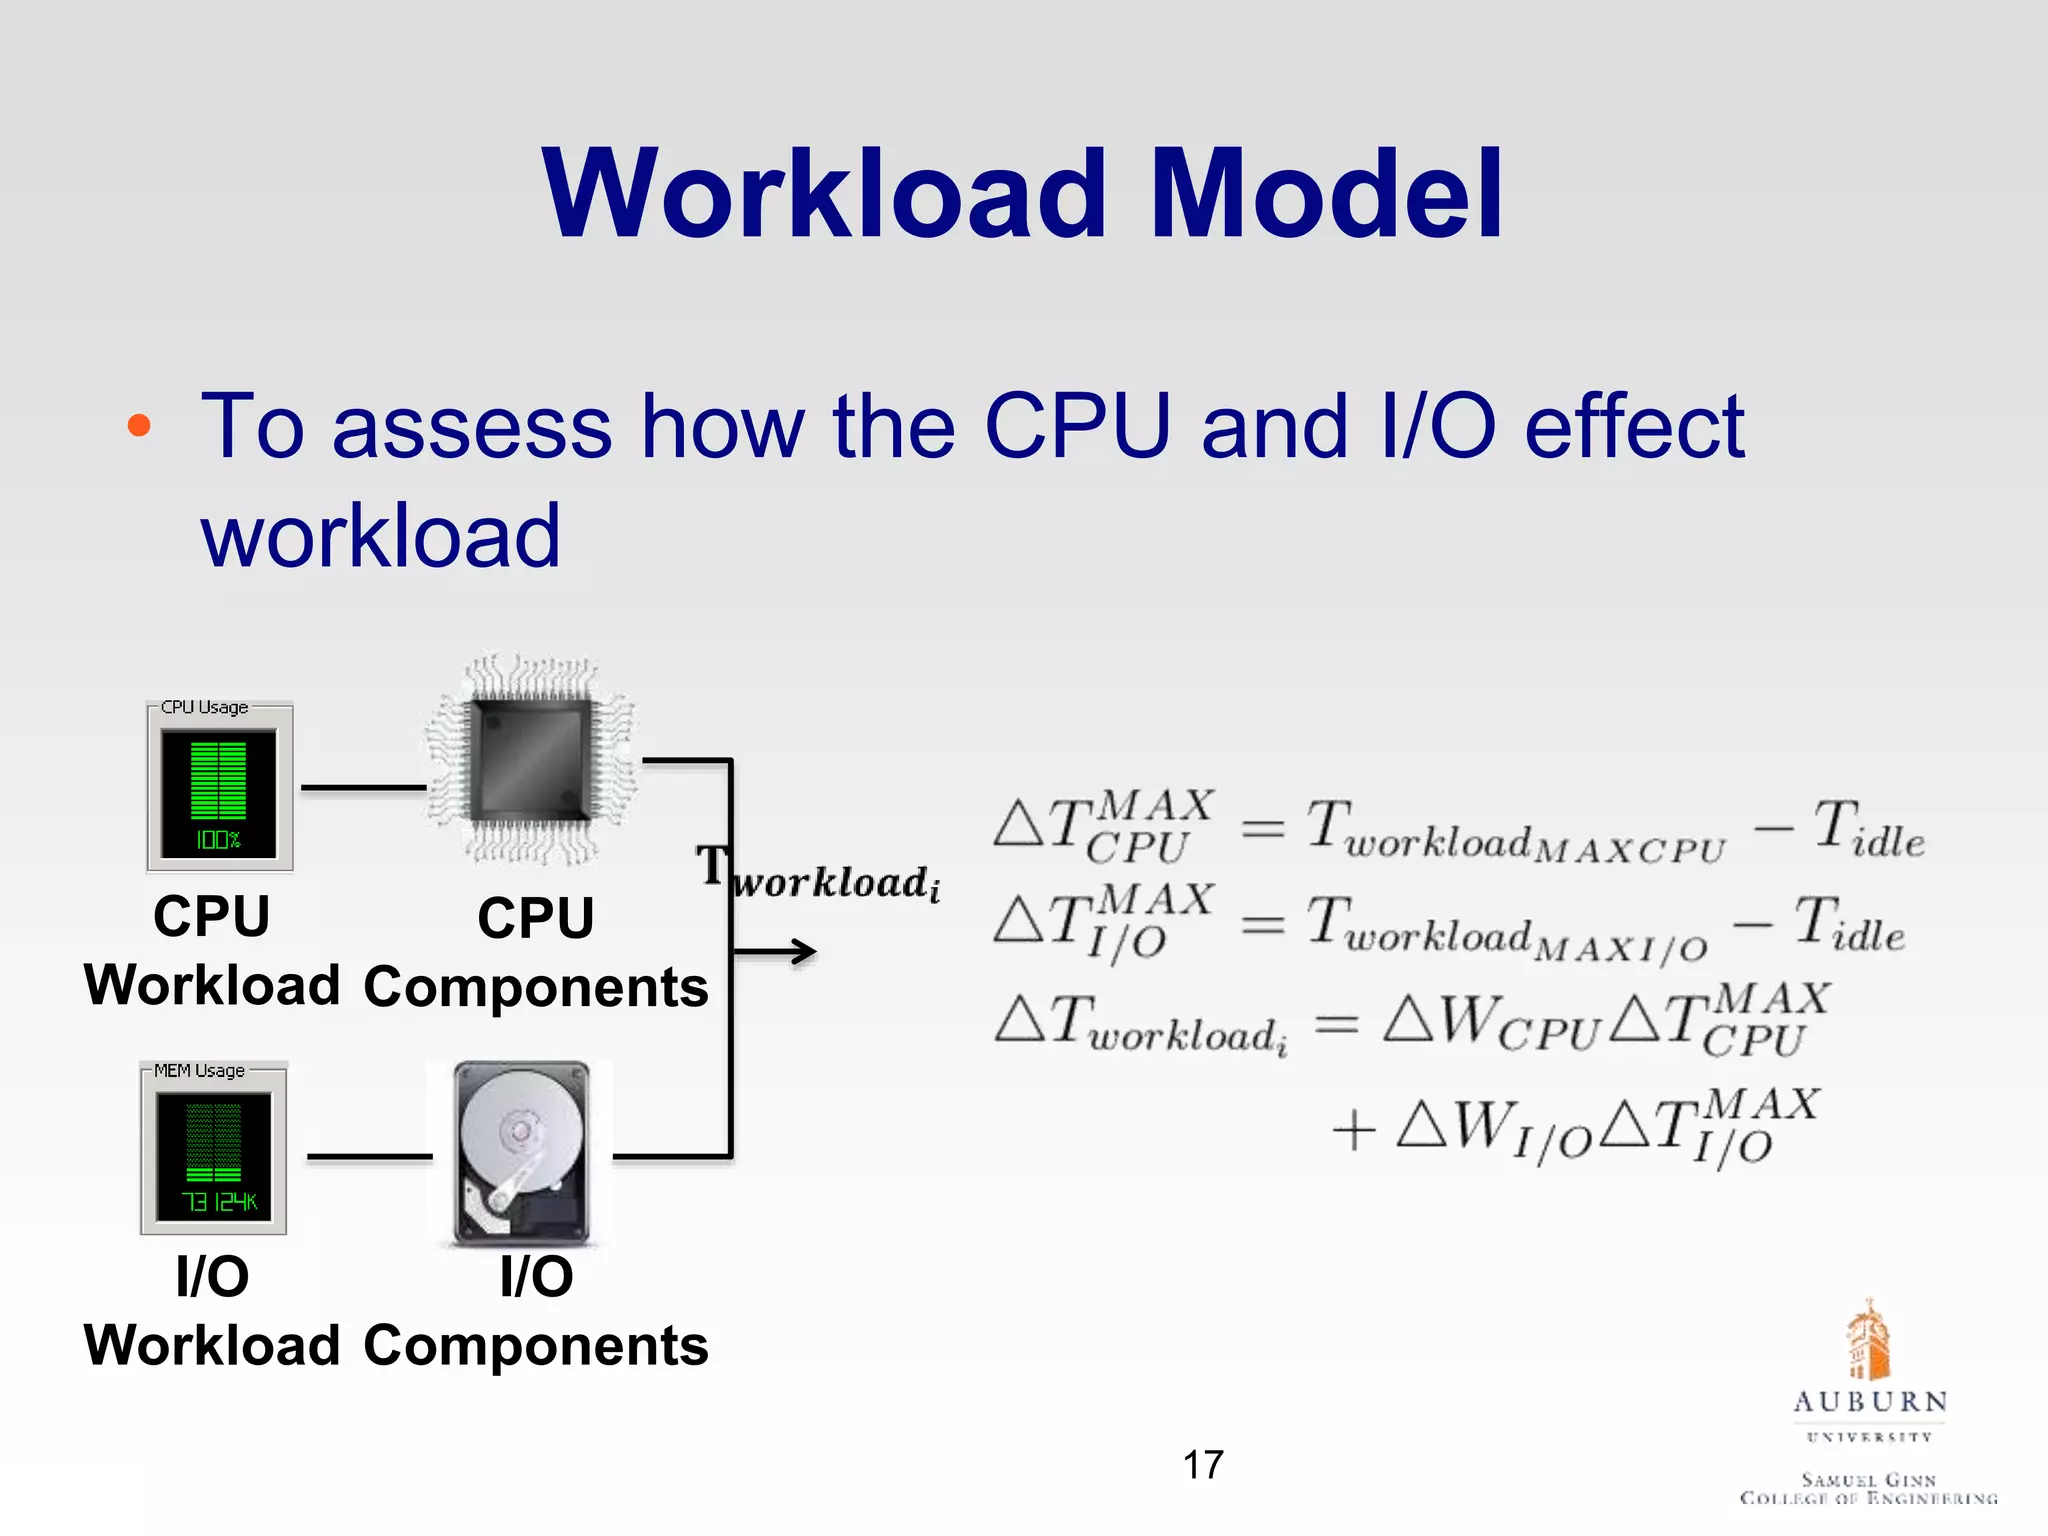
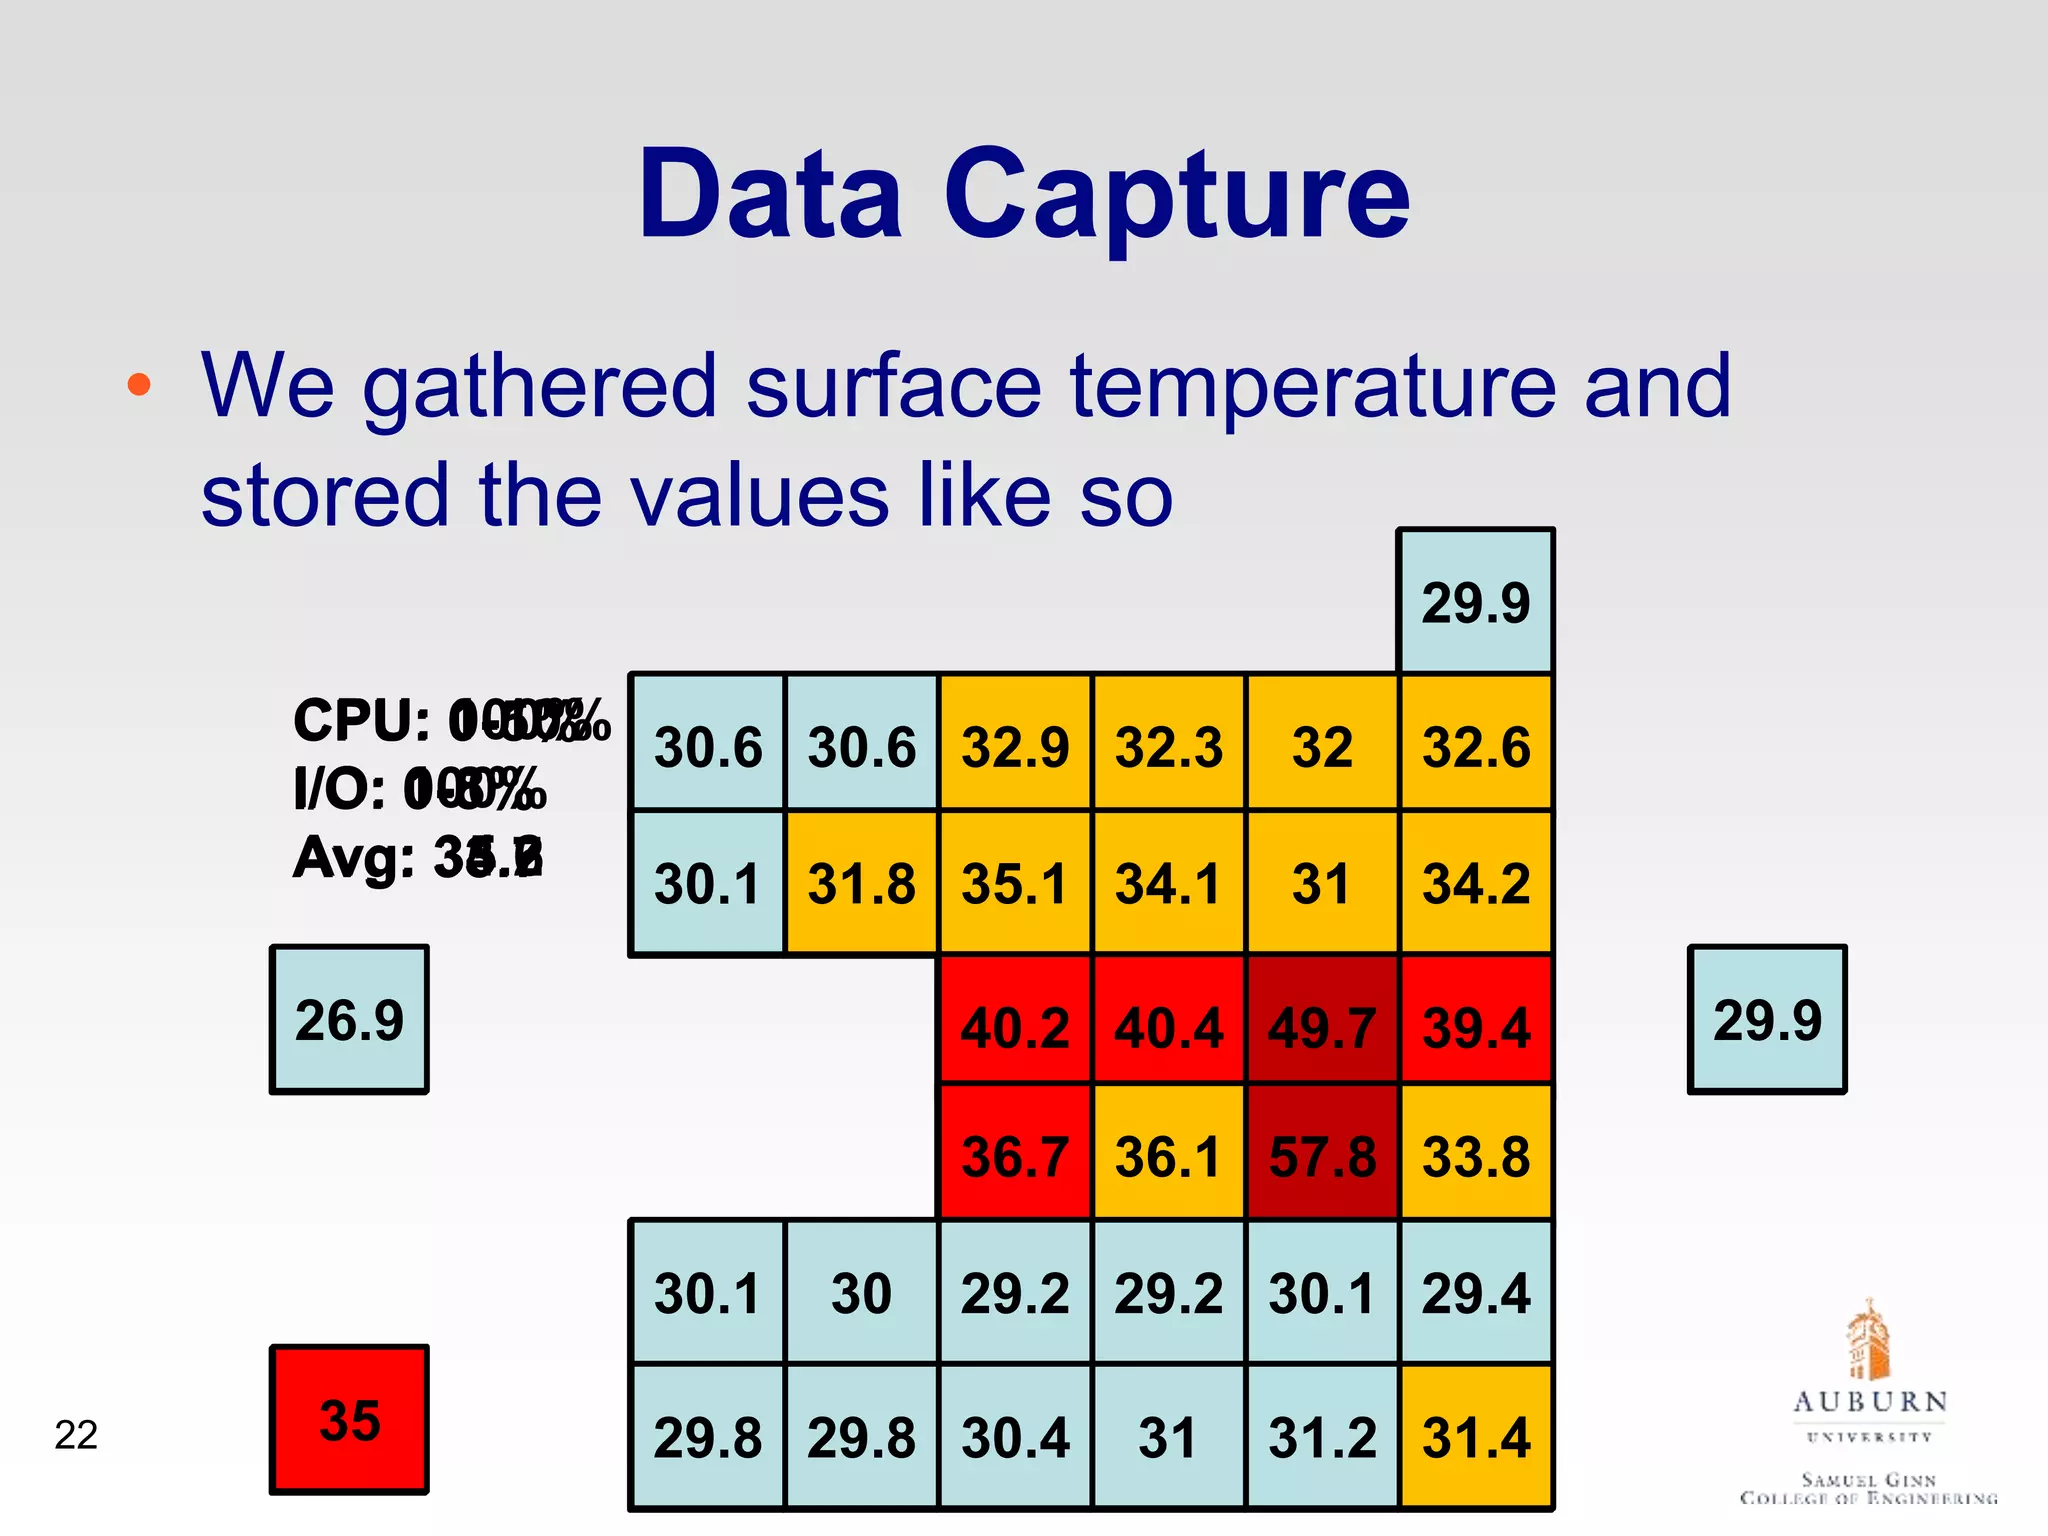
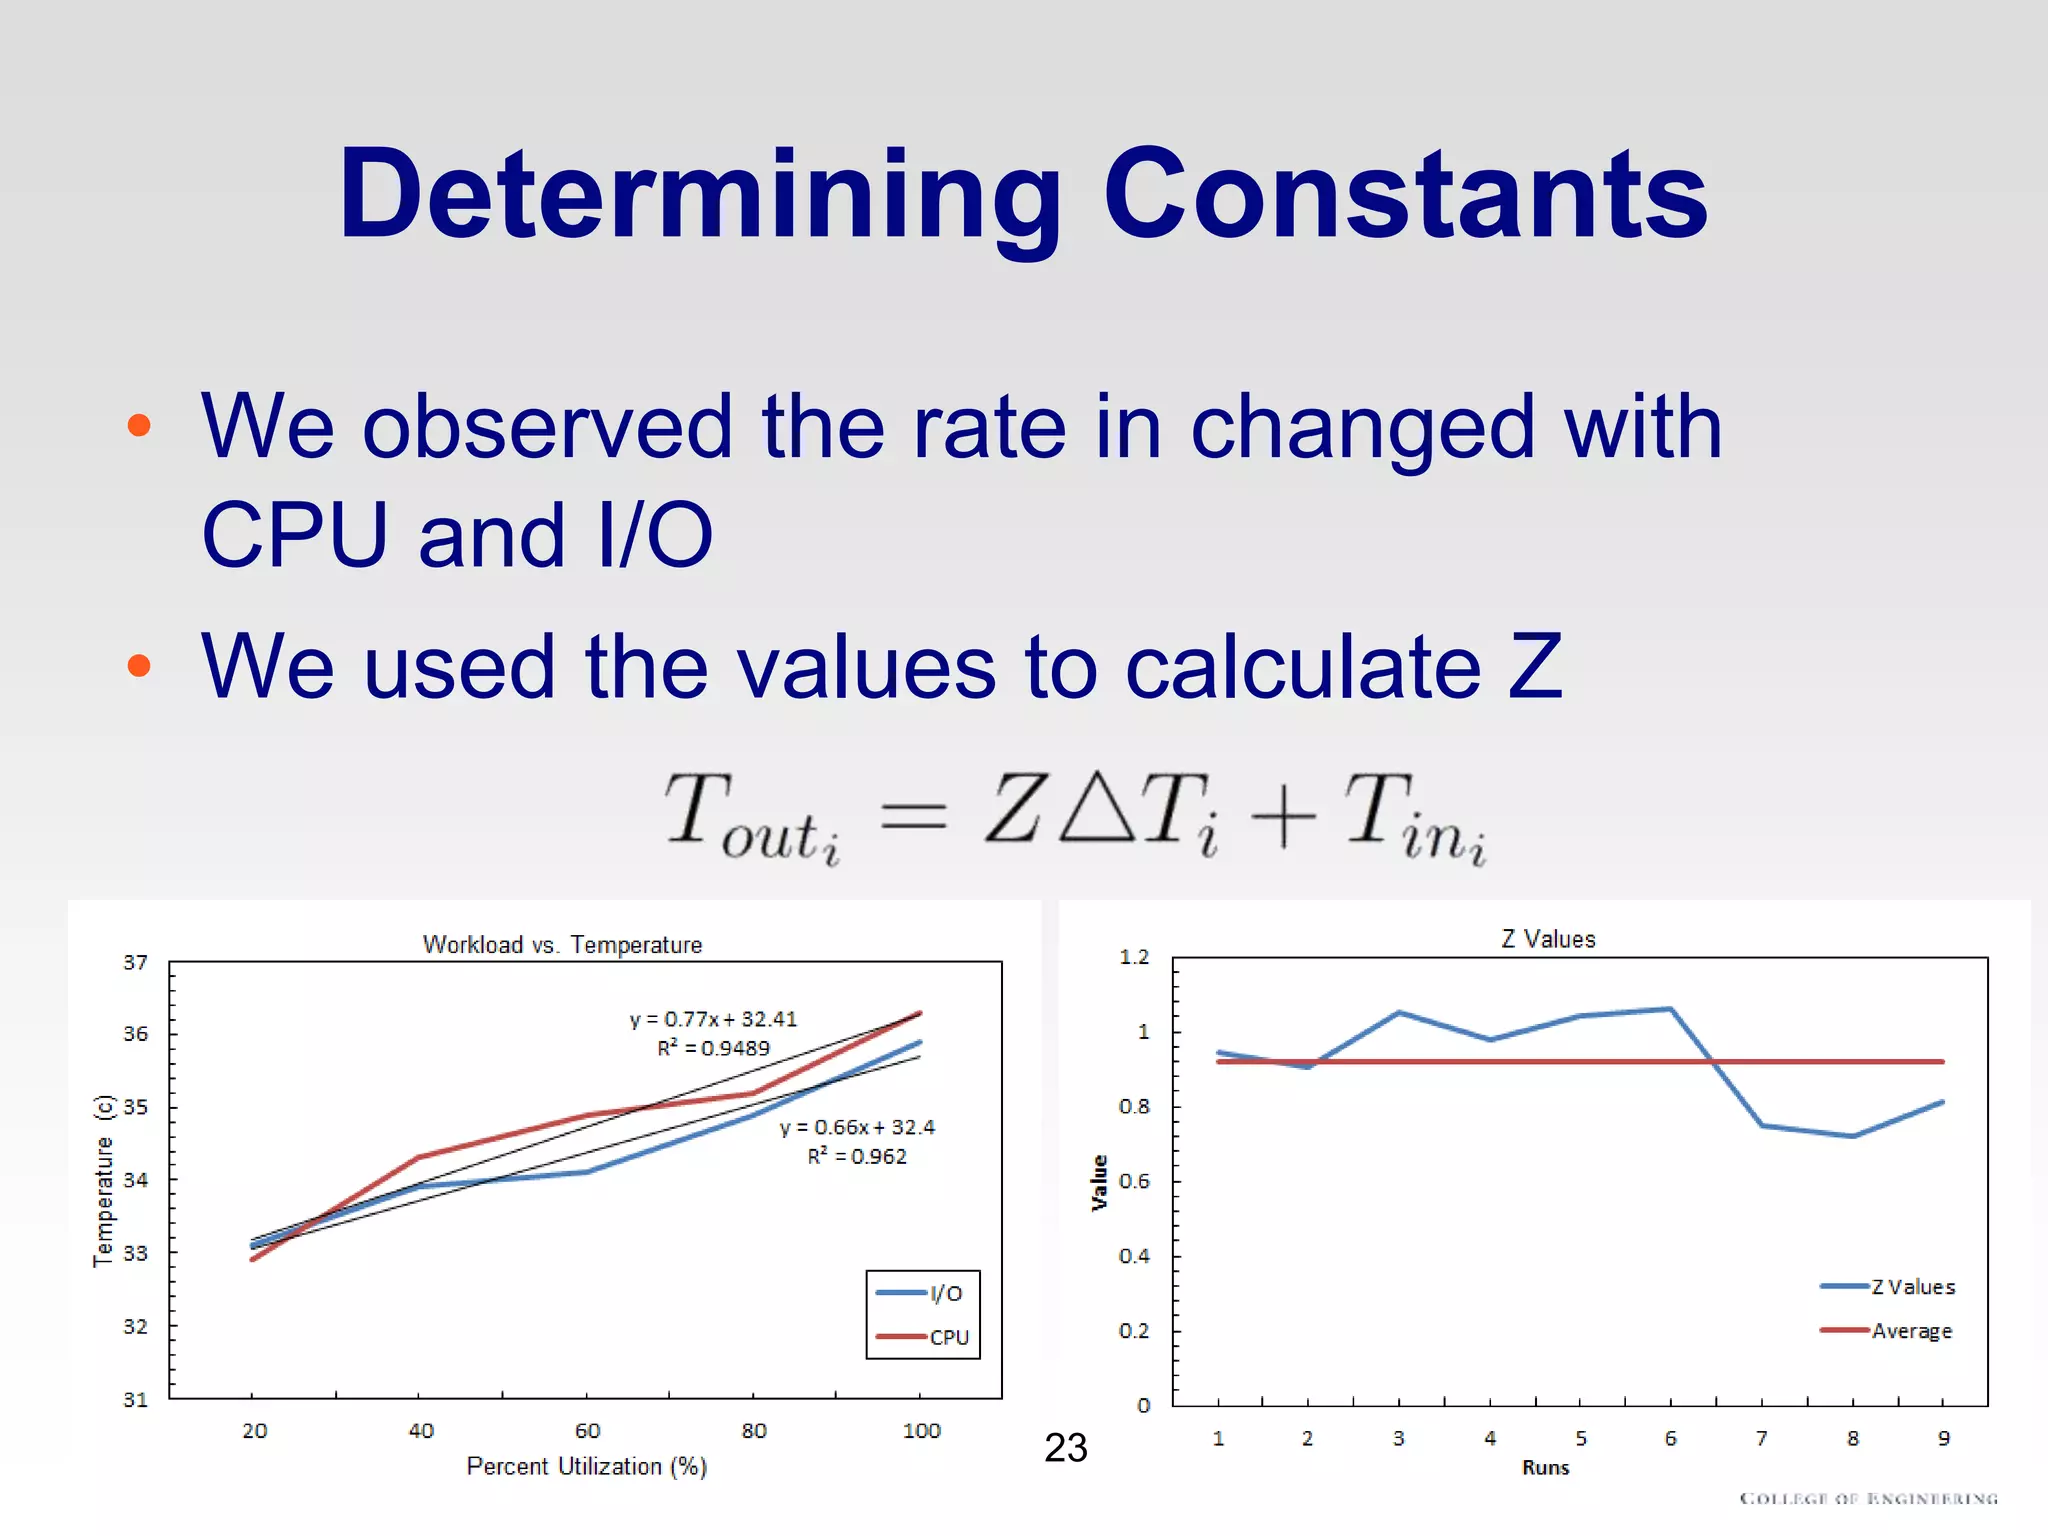
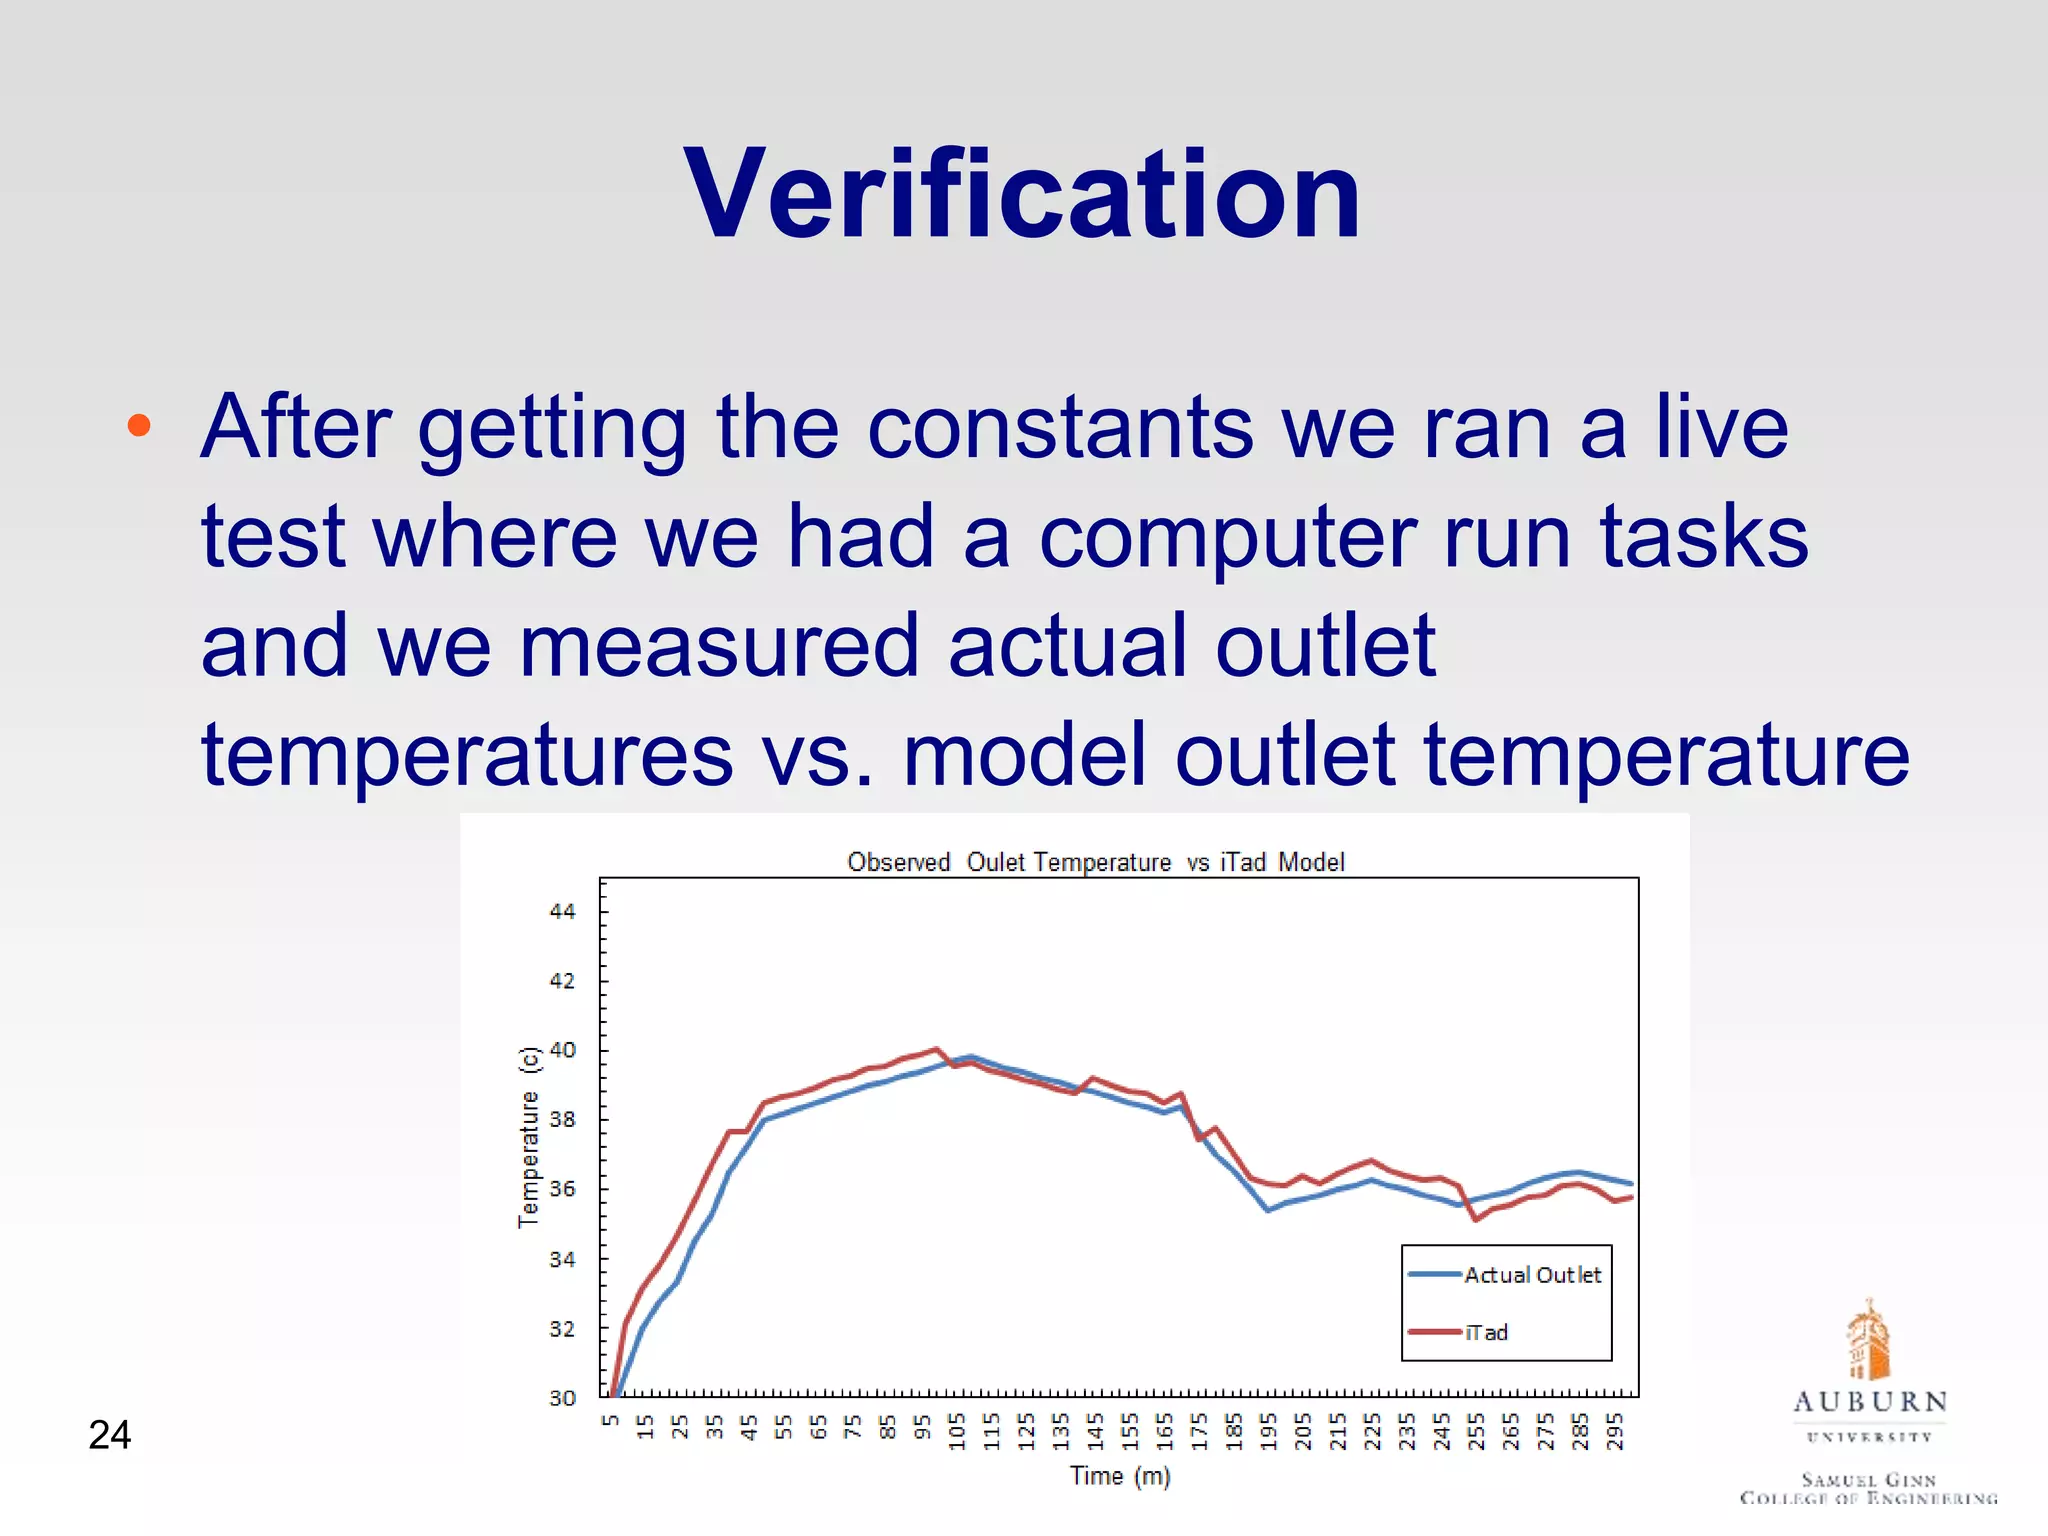
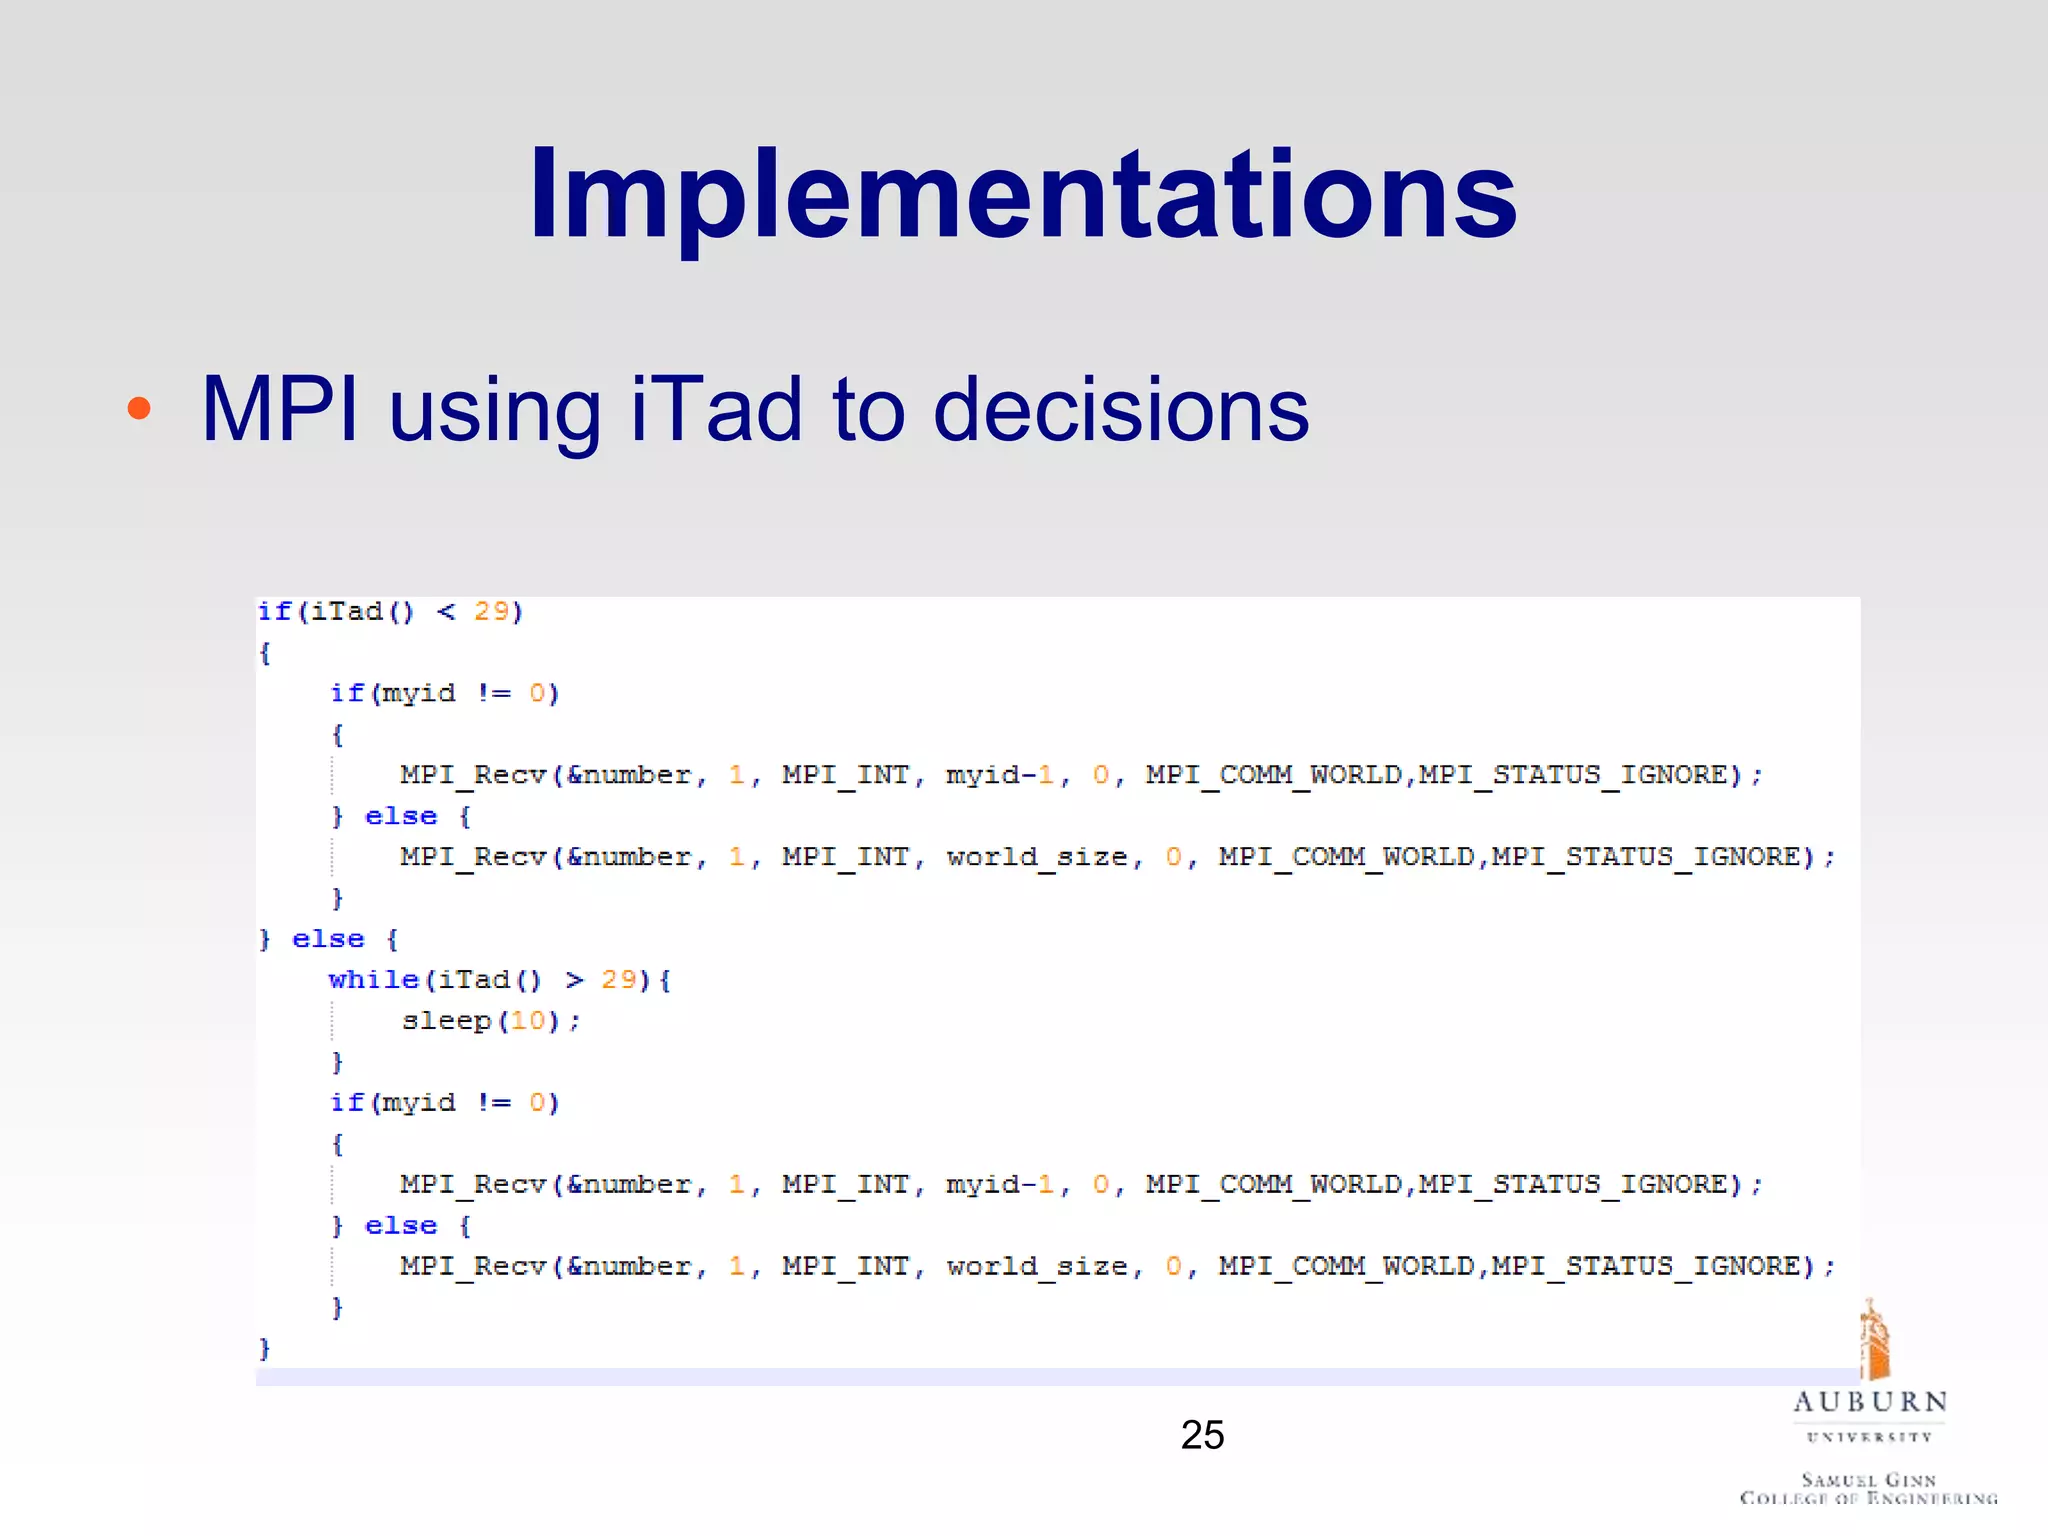
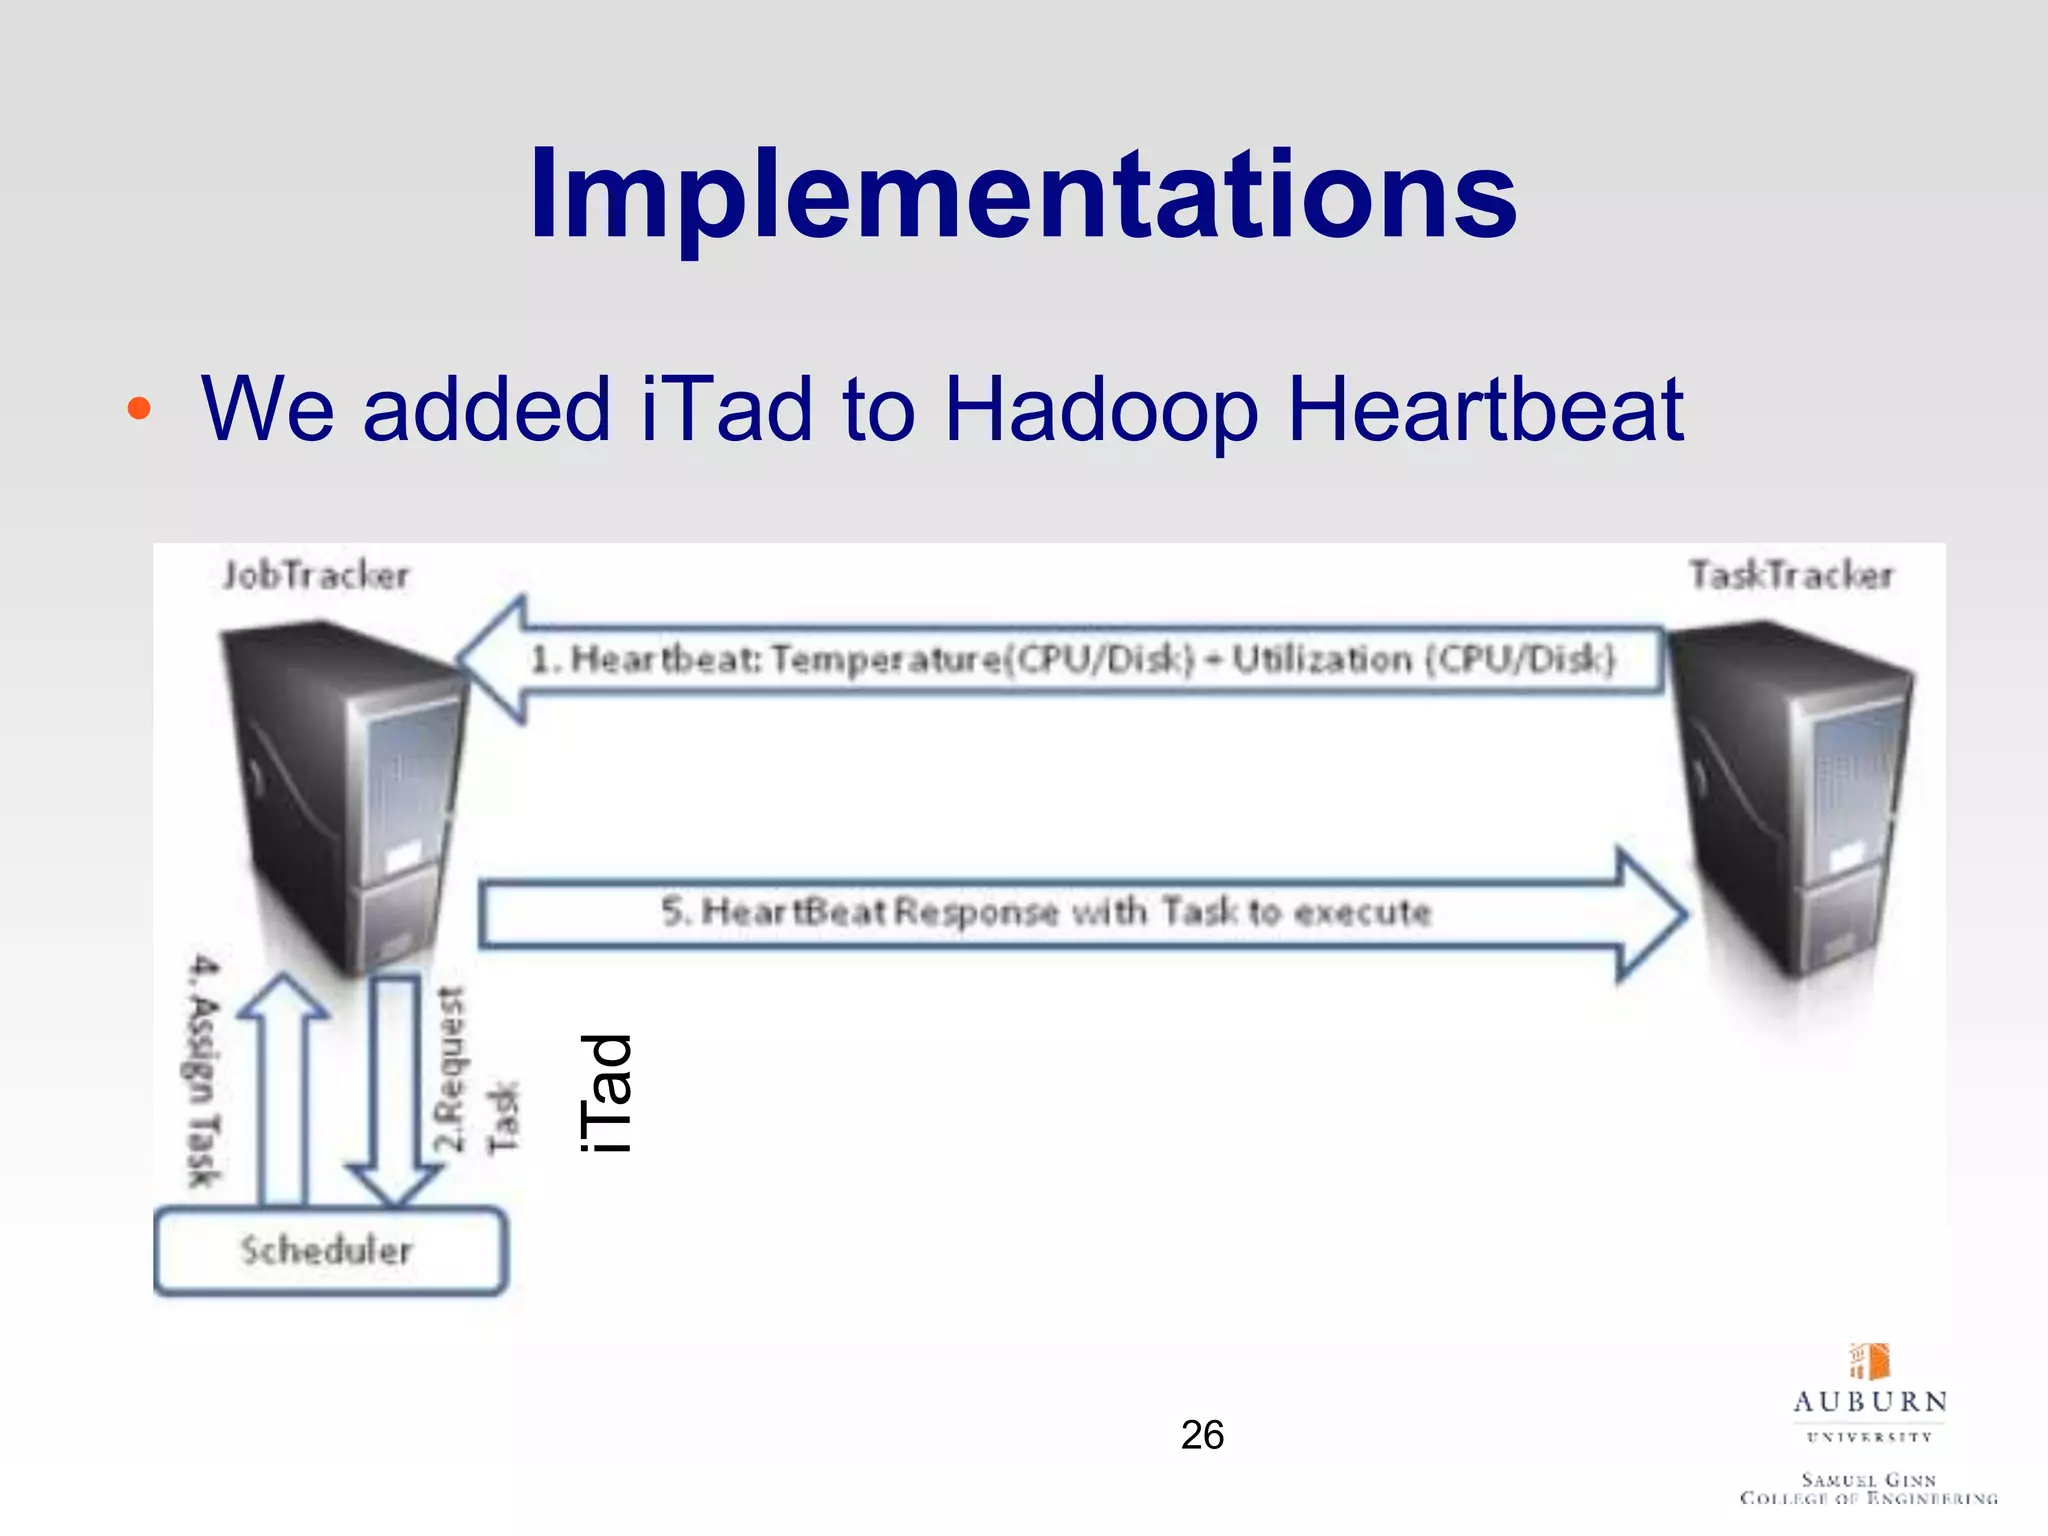
Data Center Specific Thermal
and Energy Saving Techniques
Tausif Muzaffar and Xiao Qin
Department of Computer Science and
Software Engineering
Auburn University
1
Big Data
2
Data Centers
• In 2013, there are over 700 million square
feet of data centers in united states
• Data centers account for 1.2% of all data
power consumed in United States
3
THERMAL MODEL
Part 1
4
Data Center Power Usage
45%
25%
15%
15%
Server
Cooling
Utilities
Network
5
𝐈𝐧𝐭𝐢𝐚𝐥 𝐓𝐞𝐦𝐩𝐭𝐞𝐫𝐚𝐭𝐮𝐫𝐞
Server i+1
Server i
Server i-1
CRAC
𝐎𝐮𝐭𝐥𝐞𝐭 𝐓𝐞𝐦𝐩𝐭𝐞𝐫𝐚𝐭𝐮𝐫𝐞
𝐒𝐮𝐩𝐩𝐥𝐢𝐞𝐝 𝐓𝐞𝐦𝐩𝐭𝐞𝐫𝐚𝐭𝐮𝐫𝐞
Thermal Recirculation
Workload
𝐈𝐧𝐥𝐞𝐭 𝐓𝐞𝐦𝐩𝐭𝐞𝐫𝐚𝐭𝐮𝐫𝐞
6
Thermal Recirculation
Management
• Sensor Monitoring
• Thermal Simulations
• Thermal Model
7
Prior Thermal Models
• Some are based on power rather than
workload
• Ignore I/O heavy applications
• Requires some sensor support
• Not easily ported to different platforms
8
Research Goal
iTad: making a simple and practical way to
estimate the temperature of a data node
based on
• CPU Utilization
• I/O Utilization
• Average Conditions of a Data Center
9
Our Focus
• To focus on each server separately and
find the outlet temperature
• To estimate inlet temperature based on
that outlet temperature
Server iTINIT
Server Model Inlet Model
Outlet
Inlet
11
Server Model
• Three factors affect the output temperature
of a single node
– Inlet Temperature
– CPU Workload
– I/O Workload
Server i
TINIT
CPU Workload I/O Workload
Tout
12
Server Model Diagram
TINIT
Server i
Tout
Workload
Convective
Heat Transfer
Radiant Heat
Transfer
13
Server Model Equations
(1) Convective Heat
Transfer of Server
(2) Radiant Heat
Transfer of Server
(3) Change in
temperature
15
Server Model Equations
(4) Set Radiant and Convection equal to
each other and solve for Tout
16
Workload Model
• To assess how the CPU and I/O effect
workload
CPU
Workload
I/O
Workload
CPU
Components
I/O
Components
17
Inlet Model
• After the first run we need to update the
inlet temperature to do that we developed
this model
TINIT
Tout
Ts
Tin
18
Determining Parameters
• To implement this model we need to get
the following constants
– Maximum I/O and CPU can affect the outlet
temperature
– Z which is a collection of constants
19
Gathering Values
• We thermometers
to gather inlet and
outlet temperatures
• We used infrared
thermometers to
get the surface
temperature
20
Test Machines
21
Data Capture
• We gathered surface temperature and
stored the values like so
29.9 29.7 32.1 32 31.4 33.6
29.8 29.9 30.3 34.2 34.9 33.4
24.3 36.9 40.2 46.4 39.4
31.9
38 37 37.3 34.7
30.5 30,2 29.8 30.2 30.5 30.1
25.5
28.2
CPU: 0-5%
I/O: 0-5%
Avg: 33.7
29.8 29.9 29.7 29.8 29.9 30.1
30.6 32.6 33.1 33 33.2 33.2
30.1 32.5 37.1 37.2 32 34.5
27.9 45.2 44.4 59.6 39.4
33
46.7 43.2 47.3 35.1
30.1 30.1 31.6 29.4 30.9 31.2
30.4
29.9
CPU: 100%
I/O: 0-8%
Avg: 35.2
29.2 30.2 29.7 29.9 29.9 30.1
30.6 30.6 32.9 32.3 32 32.6
30.1 31.8 35.1 34.1 31 34.2
26.9 40.2 40.4 49.7 39.4
35
36.7 36.1 57.8 33.8
30.1 30 29.2 29.2 30.1 29.4
29.9
29.9
CPU: 0-10%
I/O: 100%
Avg: 34.6
29.8 29.8 30.4 31 31.2 31.422
Determining Constants
• We observed the rate in changed with
CPU and I/O
• We used the values to calculate Z
23
Verification
• After getting the constants we ran a live
test where we had a computer run tasks
and we measured actual outlet
temperatures vs. model outlet temperature
24
Implementations
• MPI using iTad to decisions
25
Implementations
• We added iTad to Hadoop Heartbeat
iTad
26
HADOOP DISK ENERGY
EFFICIENCY
Part 2
Disk Energy
• Disk drives varies in energy
• Disks can be a significant part of a server
29
Single-Disk Server Power
Usage
33%
5%
22%
10%
30%
Power Usage
CPU
Networking
Power Supply
Disks
DRAM
30
Scaling Server Disk #
• With every added disk, hard drive energy
plays a bigger role
31
Disk Dynamic Power
• Disks tend to have different consumption
modes
– Active
– Idle
– Standby
32
Hadoop Overview
• Parallel Processing
– Map Reduce
• Distributed Data
33
Hadoop Benefits
• Industry Standard
• Large Research Community
• I/O Heavy
34
Hadoop Architecture
• Hadoop creates
multiple replicas
• Metadata is
managed on
name node
• Nodes can have
multiple disks
35
Research Goal
36
NAP – E(N)ergy (A)ware Disks for Hadoo(P)
• Built for high energy efficiency
• Designed for Hadoop clusters
Setup
• 3-node cluster
• Each node identical
– 4 disks
– 4gb RAM
• Cloudera Hadoop
• Power meter
37
Optimizations
• We group disks together
– I/O Limits
– More time for disks to sleep
38
Naïve (Reactive) Algorithm
• Simply turn off
all drive until
needed
39
Proactive Algorithm
• Turn on next
drive before its
needed
Threshold
40
Comparing the Algorithms
PredictiveReactive
41
Speed
• Reactive does worse than proactive
• Time increase low
42
Block Size
• Effects how HDFS stores files
• Effects how fast it processes
43
File Size
• Effects how blocks are made
• Effect data locality
44
Map vs. Reduce
• Map is more I/O intensive usually
• Reduce was usually shorter
45
Map Heavy vs. Reduce Heavy
• Map Heavy is more I/O intensive
• Map and Reduce Heavy gets no gain
46
PRE-BUD Model
• Prefetching Energy-Efficient Parallel I/O
Systems with buffer Disk
47
NAP Energy Model
• Find added energy by disks
• Group can either be standby or active
• Read and writes assumed same
48
Energy Saving Simulation
49
Summary
• iTad: a simple and practical way to
estimate the temperature of a data node
• NAP: an energy-saving technique for disks
in Hadoop clusters
50
Questions
51

Data center specific thermal and energy saving techniques

Editor's Notes

  • #10 iTad – I/O Thermal Aware Data-Center Our goal was to make a simple and practical way to estimate the temperature of a data node based on CPU Utilization I/O Utilization Average Conditions of Data Center Our model is based on theory of heat transfer and our experiments are based on actual implementation rather than simulation
  • #12 Instead of modeling the entire data center as a whole we focus on each server separately and find the outlet temperature
  • #16 Hr: heat transfer coefficient A: surface area
  • #18 We also developed a workload model that will assess how the CPU and I/O effect work load
  • #19 di is hight Floor: di=0 Top: di=d
  • #50 Group size 1: 1 active disk at a time Group size 4: 4 active disks at a time
  • #51 iTad – I/O Thermal Aware Data-Center Our goal was to make a simple and practical way to estimate the temperature of a data node based on CPU Utilization I/O Utilization Average Conditions of Data Center Our model is based on theory of heat transfer and our experiments are based on actual implementation rather than simulation