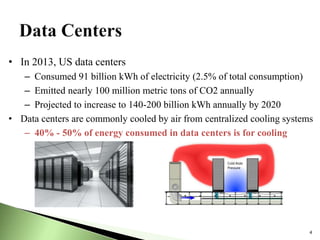
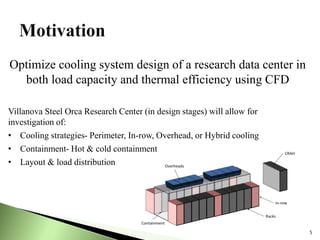
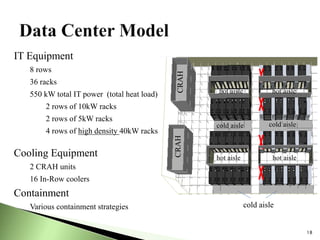
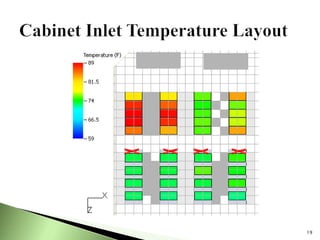
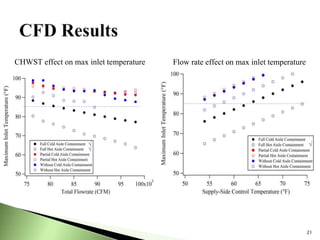
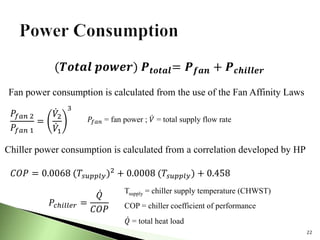
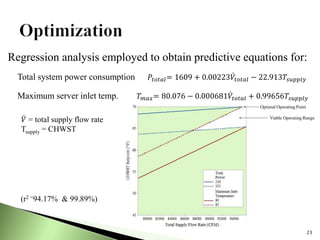
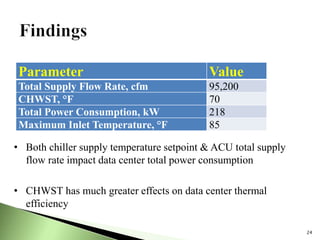
Joseph Schaadt
Undergraduate, Senior
Villanova University
• A data center is a large group of networked computer
servers typically used by organizations for the remote
storage, processing, or distribution of large amounts of
data
• In 2007, 1.5% of the electricity consumption in the
United States was used for data centers
• Of the 1.5%, one-third to one-half of this energy was used
for cooling
• Data centers are most commonly cooled by air delivered
to electronic equipment from centralized cooling systems.
2
• Data centers are one of the largest and fastest growing
consumers of electricity in the world
• Data centers, which power the internet, are a key part
of the infrastructure in the United States
• There has been a push in recent years to improve their
energy efficiency
• The Villanova Steel Orca Research Center is a research
data center that will be built in Princeton, New Jersey
that will allow for testing of improved energy efficient
cooling strategies
3
4
• In 2013, US data centers
– Consumed 91 billion kWh of electricity (2.5% of total consumption)
– Emitted nearly 100 million metric tons of CO2 annually
– Projected to increase to 140-200 billion kWh annually by 2020
• Data centers are commonly cooled by air from centralized cooling systems
– 40% - 50% of energy consumed in data centers is for cooling
5
Optimize cooling system design of a research data center in
both load capacity and thermal efficiency using CFD
Villanova Steel Orca Research Center (in design stages) will allow for
investigation of:
• Cooling strategies- Perimeter, In-row, Overhead, or Hybrid cooling
• Containment- Hot & cold containment
• Layout & load distribution
6
Determine optimal operating conditions & design layout while
meeting thermal constraints
• Minimization function: Total energy consumed for cooling
• Design variables:
• Air conditioning units (ACU) air flow rate
• Chiller supply temperature setpoint (CHWST)
• Constraint: Racks’ maximum inlet temperature < 85˚F
• Investigate effects of containment
• This research is motivated by a push for improved
energy efficiency for data centers
• State of the art data center cooling strategies will
be investigated
• CFD software 6SigmaRoom provides ability to
easily test various strategies such as high density
zones and hot and cold aisle containment
• Efficient strategies will be validated at VSORC
facility
7
8
Enclosures to control travel path of airflow
CRAH
Containments:
• Enclose hot or cold aisles
• Prevent premature mixing of hot & cold streams – reduce cooling load
• Requires racks layout & height uniformity
• Are difficult to install and remove
Both hot & cold containment strategies
were investigated
• Containment enclosures are installed in data
centers to control the path of airflow travel
• Containment helps in reducing the air inlet
temperatures to the IT equipment
• Containment does not change air movement, it
can be difficult to install and remove, and it
requires uniformity in the server cabinet layout
and height
9
• Addition of containment (hot or cold) does not
directly alter power usage effectiveness (PUE), a
popular measure of the energy efficiency of a
data center:
• Containment reduces premature mixing of hot
and cold air streams, resulting in reduced cooling
load
10
PUE =
𝑇𝑜𝑡𝑎𝑙 𝐹𝑎𝑐𝑖𝑙𝑖𝑡𝑦 𝑃𝑜𝑤𝑒𝑟
𝐼𝑇 𝐸𝑞𝑢𝑖𝑝𝑚𝑒𝑛𝑡 𝑃𝑜𝑤𝑒𝑟
The Center for Energy-Smart Electronic Systems
• Containment prevents the mixing of different airflow
paths and damage to the IT equipment
• Containment can help reduce the inlet temperatures of
the IT equipment and the needed cooling power
Without Hot Aisle Containment Full Hot Aisle Containment
12
High power server/racks (high kW)
are clustered together in one zone
– Allows for higher computing
power per unit area
High density zones cause cooling
issues requiring additional cooling
Additional cooling accomplished
through In-row coolers
high density zones in-row
13
1. Two distinct VSORC design configurations
have been modeled
 Each model required extensive clean up of initial
layout by removing numerous collision and cooling
errors
2. Optimization model
Design variables: total supply flow rate and chiller
supply temperature
Design constraint: maximum rack inlet temperature
no greater than 85°F
14
3. The baseline model must be used to create
different containment configurations
4. Perform CFD simulations to find most efficient
containment configuration
5. Create matrix based on power, max inlet
temperature, and total supply flow rate
6. Utilize Minitab© to create predictive equations
and identify optimal operating point
7. Based on results, either validate or reoptimize
15
16
Combination of CFD &
DOE (w/factorial analysis)
17
Without Hot Aisle Containment
Full Hot Aisle Containment
Hot aisle containment
Full
Partial*
None
Cold aisle containment
Full
Partial*
None
6 Models
• Industry’s best practices employed to create models
Containment leakage
Equipment gaps & interferences
Supply tile locations
Chiller supply temperature setpoint range
Total flow rate range
* Partial configurations enclosed only high density zones
18
IT Equipment
8 rows
36 racks
550 kW total IT power (total heat load)
2 rows of 10kW racks
2 rows of 5kW racks
4 rows of high density 40kW racks
Cooling Equipment
2 CRAH units
16 In-Row coolers
Containment
Various containment strategies
hot aisle
cold aisle cold aisle
hot aisle
cold aisle
hot aisle
CRAHCRAH
hot aisle
19
20
21
Flow rate effect on max inlet temperature
√
CHWST effect on max inlet temperature
√
√
22
𝑃𝑓𝑎𝑛 2
𝑃𝑓𝑎𝑛 1
=
𝑉2
𝑉1
3
Tsupply = chiller supply temperature (CHWST)
COP = chiller coefficient of performance
𝑄 = total heat load
Fan power consumption is calculated from the use of the Fan Affinity Laws
𝑃𝑓𝑎𝑛 = fan power ; 𝑉 = total supply flow rate
Chiller power consumption is calculated from a correlation developed by HP
𝐶𝑂𝑃 = 0.0068 (𝑇𝑠𝑢𝑝𝑝𝑙𝑦)2
+ 0.0008 (𝑇𝑠𝑢𝑝𝑝𝑙𝑦) + 0.458
𝑃𝑐ℎ𝑖𝑙𝑙𝑒𝑟 =
𝑄
𝐶𝑂𝑃
(𝑻𝒐𝒕𝒂𝒍 𝒑𝒐𝒘𝒆𝒓) 𝑷 𝒕𝒐𝒕𝒂𝒍= 𝑷 𝒇𝒂𝒏 + 𝑷 𝒄𝒉𝒊𝒍𝒍𝒆𝒓
23
Regression analysis employed to obtain predictive equations for:
Total system power consumption 𝑃𝑡𝑜𝑡𝑎𝑙= 1609 + 0.00223 𝑉𝑡𝑜𝑡𝑎𝑙 − 22.913𝑇𝑠𝑢𝑝𝑝𝑙𝑦
Maximum server inlet temp. 𝑇 𝑚𝑎𝑥= 80.076 − 0.000681 𝑉𝑡𝑜𝑡𝑎𝑙 + 0.99656𝑇𝑠𝑢𝑝𝑝𝑙𝑦
(r2 =94.17% & 99.89%)
𝑉 = total supply flow rate
Tsupply = CHWST
24
• Both chiller supply temperature setpoint & ACU total supply
flow rate impact data center total power consumption
• CHWST has much greater effects on data center thermal
efficiency
Parameter Value
Total Supply Flow Rate, cfm 95,200
CHWST, °F 70
Total Power Consumption, kW 218
Maximum Inlet Temperature, °F 85
• The supply temperature setpoint of the chiller was found
to significantly change the power consumption of the data
center
• The total supply flow rate was found to only slightly
change the power consumption of the data center
• A combined CFD & DOE (w/factorial analysis)
methodology was developed for design & optimization of
a data center
• 1st law analysis was employed to determine cooling
system’s optimal setting for improved energy efficiency
25
• Containment is beneficial in reducing air inlet
temperatures, leading to an improvement in
energy efficiency
• CFD programs like 6SigmaRoom can be
effectively used to identify optimal operating
points of total supply flow rate and chilled water
supply temperature setpoint for a data center
• Hybrid cooling is effective in handling high
density IT zones of a data center
26
• My research advisors, Dr. Kamran Fouladi and Dr.
Aaron Wemhoff of the Mechanical Engineering
Department along with Dr. Joseph Pigeon from the
Mathematics and Statistics Department
• Thomas Wu and Aitor Zabalegui from Future
Facilites Inc.
• The National Science Foundation (NSF) Research
Experience for Undergraduates (REU)
• NSF I/UCRC in Energy-Smart Electronic Systems

Showcase ppt ver 8

  • 1.
  • 2.
    • A datacenter is a large group of networked computer servers typically used by organizations for the remote storage, processing, or distribution of large amounts of data • In 2007, 1.5% of the electricity consumption in the United States was used for data centers • Of the 1.5%, one-third to one-half of this energy was used for cooling • Data centers are most commonly cooled by air delivered to electronic equipment from centralized cooling systems. 2
  • 3.
    • Data centersare one of the largest and fastest growing consumers of electricity in the world • Data centers, which power the internet, are a key part of the infrastructure in the United States • There has been a push in recent years to improve their energy efficiency • The Villanova Steel Orca Research Center is a research data center that will be built in Princeton, New Jersey that will allow for testing of improved energy efficient cooling strategies 3
  • 4.
    4 • In 2013,US data centers – Consumed 91 billion kWh of electricity (2.5% of total consumption) – Emitted nearly 100 million metric tons of CO2 annually – Projected to increase to 140-200 billion kWh annually by 2020 • Data centers are commonly cooled by air from centralized cooling systems – 40% - 50% of energy consumed in data centers is for cooling
  • 5.
    5 Optimize cooling systemdesign of a research data center in both load capacity and thermal efficiency using CFD Villanova Steel Orca Research Center (in design stages) will allow for investigation of: • Cooling strategies- Perimeter, In-row, Overhead, or Hybrid cooling • Containment- Hot & cold containment • Layout & load distribution
  • 6.
    6 Determine optimal operatingconditions & design layout while meeting thermal constraints • Minimization function: Total energy consumed for cooling • Design variables: • Air conditioning units (ACU) air flow rate • Chiller supply temperature setpoint (CHWST) • Constraint: Racks’ maximum inlet temperature < 85˚F • Investigate effects of containment
  • 7.
    • This researchis motivated by a push for improved energy efficiency for data centers • State of the art data center cooling strategies will be investigated • CFD software 6SigmaRoom provides ability to easily test various strategies such as high density zones and hot and cold aisle containment • Efficient strategies will be validated at VSORC facility 7
  • 8.
    8 Enclosures to controltravel path of airflow CRAH Containments: • Enclose hot or cold aisles • Prevent premature mixing of hot & cold streams – reduce cooling load • Requires racks layout & height uniformity • Are difficult to install and remove Both hot & cold containment strategies were investigated
  • 9.
    • Containment enclosuresare installed in data centers to control the path of airflow travel • Containment helps in reducing the air inlet temperatures to the IT equipment • Containment does not change air movement, it can be difficult to install and remove, and it requires uniformity in the server cabinet layout and height 9
  • 10.
    • Addition ofcontainment (hot or cold) does not directly alter power usage effectiveness (PUE), a popular measure of the energy efficiency of a data center: • Containment reduces premature mixing of hot and cold air streams, resulting in reduced cooling load 10 PUE = 𝑇𝑜𝑡𝑎𝑙 𝐹𝑎𝑐𝑖𝑙𝑖𝑡𝑦 𝑃𝑜𝑤𝑒𝑟 𝐼𝑇 𝐸𝑞𝑢𝑖𝑝𝑚𝑒𝑛𝑡 𝑃𝑜𝑤𝑒𝑟
  • 11.
    The Center forEnergy-Smart Electronic Systems • Containment prevents the mixing of different airflow paths and damage to the IT equipment • Containment can help reduce the inlet temperatures of the IT equipment and the needed cooling power Without Hot Aisle Containment Full Hot Aisle Containment
  • 12.
    12 High power server/racks(high kW) are clustered together in one zone – Allows for higher computing power per unit area High density zones cause cooling issues requiring additional cooling Additional cooling accomplished through In-row coolers high density zones in-row
  • 13.
  • 14.
    1. Two distinctVSORC design configurations have been modeled  Each model required extensive clean up of initial layout by removing numerous collision and cooling errors 2. Optimization model Design variables: total supply flow rate and chiller supply temperature Design constraint: maximum rack inlet temperature no greater than 85°F 14
  • 15.
    3. The baselinemodel must be used to create different containment configurations 4. Perform CFD simulations to find most efficient containment configuration 5. Create matrix based on power, max inlet temperature, and total supply flow rate 6. Utilize Minitab© to create predictive equations and identify optimal operating point 7. Based on results, either validate or reoptimize 15
  • 16.
    16 Combination of CFD& DOE (w/factorial analysis)
  • 17.
    17 Without Hot AisleContainment Full Hot Aisle Containment Hot aisle containment Full Partial* None Cold aisle containment Full Partial* None 6 Models • Industry’s best practices employed to create models Containment leakage Equipment gaps & interferences Supply tile locations Chiller supply temperature setpoint range Total flow rate range * Partial configurations enclosed only high density zones
  • 18.
    18 IT Equipment 8 rows 36racks 550 kW total IT power (total heat load) 2 rows of 10kW racks 2 rows of 5kW racks 4 rows of high density 40kW racks Cooling Equipment 2 CRAH units 16 In-Row coolers Containment Various containment strategies hot aisle cold aisle cold aisle hot aisle cold aisle hot aisle CRAHCRAH hot aisle
  • 19.
  • 20.
  • 21.
    21 Flow rate effecton max inlet temperature √ CHWST effect on max inlet temperature √ √
  • 22.
    22 𝑃𝑓𝑎𝑛 2 𝑃𝑓𝑎𝑛 1 = 𝑉2 𝑉1 3 Tsupply= chiller supply temperature (CHWST) COP = chiller coefficient of performance 𝑄 = total heat load Fan power consumption is calculated from the use of the Fan Affinity Laws 𝑃𝑓𝑎𝑛 = fan power ; 𝑉 = total supply flow rate Chiller power consumption is calculated from a correlation developed by HP 𝐶𝑂𝑃 = 0.0068 (𝑇𝑠𝑢𝑝𝑝𝑙𝑦)2 + 0.0008 (𝑇𝑠𝑢𝑝𝑝𝑙𝑦) + 0.458 𝑃𝑐ℎ𝑖𝑙𝑙𝑒𝑟 = 𝑄 𝐶𝑂𝑃 (𝑻𝒐𝒕𝒂𝒍 𝒑𝒐𝒘𝒆𝒓) 𝑷 𝒕𝒐𝒕𝒂𝒍= 𝑷 𝒇𝒂𝒏 + 𝑷 𝒄𝒉𝒊𝒍𝒍𝒆𝒓
  • 23.
    23 Regression analysis employedto obtain predictive equations for: Total system power consumption 𝑃𝑡𝑜𝑡𝑎𝑙= 1609 + 0.00223 𝑉𝑡𝑜𝑡𝑎𝑙 − 22.913𝑇𝑠𝑢𝑝𝑝𝑙𝑦 Maximum server inlet temp. 𝑇 𝑚𝑎𝑥= 80.076 − 0.000681 𝑉𝑡𝑜𝑡𝑎𝑙 + 0.99656𝑇𝑠𝑢𝑝𝑝𝑙𝑦 (r2 =94.17% & 99.89%) 𝑉 = total supply flow rate Tsupply = CHWST
  • 24.
    24 • Both chillersupply temperature setpoint & ACU total supply flow rate impact data center total power consumption • CHWST has much greater effects on data center thermal efficiency Parameter Value Total Supply Flow Rate, cfm 95,200 CHWST, °F 70 Total Power Consumption, kW 218 Maximum Inlet Temperature, °F 85
  • 25.
    • The supplytemperature setpoint of the chiller was found to significantly change the power consumption of the data center • The total supply flow rate was found to only slightly change the power consumption of the data center • A combined CFD & DOE (w/factorial analysis) methodology was developed for design & optimization of a data center • 1st law analysis was employed to determine cooling system’s optimal setting for improved energy efficiency 25
  • 26.
    • Containment isbeneficial in reducing air inlet temperatures, leading to an improvement in energy efficiency • CFD programs like 6SigmaRoom can be effectively used to identify optimal operating points of total supply flow rate and chilled water supply temperature setpoint for a data center • Hybrid cooling is effective in handling high density IT zones of a data center 26
  • 27.
    • My researchadvisors, Dr. Kamran Fouladi and Dr. Aaron Wemhoff of the Mechanical Engineering Department along with Dr. Joseph Pigeon from the Mathematics and Statistics Department • Thomas Wu and Aitor Zabalegui from Future Facilites Inc. • The National Science Foundation (NSF) Research Experience for Undergraduates (REU) • NSF I/UCRC in Energy-Smart Electronic Systems