SlideShare a Scribd company logo
1 of 24
Ryuichi Kaneko
Population Changes of the World and Japan
in the 21st Century
2From: Joseph A. McFalls, Jr. Population: A Lively Introduction. Third edition. Population Reference Bureau 53(3); 1998: 38
Historical development of the World population
0
2
4
6
8
10
12
14
600 800 1000 1200 1400 1600 1800 2000 2200 2400
0
2
4
6
8
10
12
14
600 800 1000 1200 1400 1600 1800 2000 2200 2400
1872
34.8 mil
1721
31.3 mil
1600
12.3 mil
800
5.51 mil
1280
5.95 mil
2100
49.6 mil
2110
42.9 mil
Low variant
High variant
3
Historical development of the population in Japan
Source: -1846: Kito(2000), 1847-1870: Morita(1944), 1872-1919: Statistics Bureau, 1920-2010: Census, 2011-2110: National Institute of
Population and Social Security Research(2012), Population Projection for Japan:2011-2060.
2010
128 million
2060
86.7 mil
Tokugawa era
Year
Population(million)
?
4
1961
Universal pension
health insurance
2000
Nursing care
insurance law
Source: Ministry of Internal Affairs and Communications, Statistics Bureau, Census, National Institute of Population and Social Security
Research(2012), Population Projection for Japan:2011-2060.
2010
128 million
Trends of Japan's population and age structure:
1880 - 2110
130 120 110 100 90 80 70 60 50 40 30 20 10 0 0 10 20 30 40 50 60 70 80 90 100 110 120 130
0
10
20
30
40
50
60
70
80
90
100
130 120 110 100 90 80 70 60 50 40 30 20 10 0 0 10 20 30 40 50 60 70 80 90 100 110 120 130
0
10
20
30
40
50
60
70
80
90
100
130 120 110 100 90 80 70 60 50 40 30 20 10 0 0 10 20 30 40 50 60 70 80 90 100 110 120 130
0
10
20
30
40
50
60
70
80
90
100
5
World population by major region : 1950-2050
Sources: United Nations (2015), World Population Prospects: The 2014 Revision. Statistics Bureau, Census, National Institute of Population and Social
Security Research(2012), Population Projection for Japan:2011-2060.
Population(inbillion)
Year
3.2 %
10
1.9 %
United Nations (2011), World Population Prospects: The 2010 Revision.
17
1.0 %
6
Japan
7
Sources: United Nations (2015), World Population Prospects: The 2014 Revision. Statistics Bureau, Census, National Institute of Population and Social
Security Research(2012), Population Projection for Japan:2011-2060.
Trends of China's population and age structure:
1950 - 2100
Projection
Elderly
Working age
Children
China
Japan
8
Sources: United Nations (2015), World Population Prospects: The 2014 Revision. Statistics Bureau, Census, National Institute of Population and Social
Security Research(2012), Population Projection for Japan:2011-2060.
Trends of India's population and age structure:
1950 - 2100
Projection
Elderly
Working age
Children
India
2100
9
Relative population sizes,
when population in 2015 = 100
2100
39.0 %
Trends of relative population size (100 in 2015) of the world countries:
1950 - 2100
ProjectionEstimation
Italy
Korea Japan(IPSS)
Japan(UN)
Germany
Year
Relativepopulationsize(P2015=100)
Sources: United Nations (2015), World Population Prospects: The 2014 Revision. Statistics Bureau, Census, National Institute of Population and Social
Security Research(2012), Population Projection for Japan:2011-2060.
-1.5
-1.0
-0.5
0.0
0.5
1.0
1.5
2.0
2.5
3.0
1950 1960 1970 1980 1990 2000 2010 2020 2030 2040 2050
United Nations (2009), World Population Prospects: The 2010 Revision.
2010 2050
10
Sources: United Nations (2015), World Population Prospects: The 2014 Revision. Statistics Bureau, Census, National Institute of Population and Social
Security Research(2012), Population Projection for Japan:2011-2060.
11
Trends of proportion elderly (%) of the world countries:
1950 - 2100
0.0
1.0
2.0
3.0
4.0
5.0
6.0
7.0
8.0
40 45 50 55 60 65 70 75 80 85
0.0
1.0
2.0
3.0
4.0
5.0
6.0
7.0
8.0
55 60 65 70 75 80 85 90 95
International Comparison of the LE and the TFR
12
Countries with population >= 10 million in 2005
Life expectancy
Totalfertilityrate(TFR)
Life expectancy
Totalfertilityrate(TFR)
Japan Japan
Sources: United Nations (2011), World Population Prospects: The 2010 Revision. Statistics Bureau, Census, National Institute of Population and Social
Security Research(2012), Population Projection for Japan:2011-2060.
0
20
40
60
80
100
120
140
1950 1970 1990 2010 2030 2050 2070 2090 2110
13
2100
4,959
2100
10,221
2010
12,806
2050
11,142
2050
9,708
2030
11,662
2030
12,289
2012
24
0
20
40
60
80
100
120
1880 1900 1920 1940 1960 1980 2000 2020 2040 2060 2080 2100
21
14
Comparison of the dependency ratio
Some Asian countries
Source: United Nations (2011) World Population Prospects: The 2010 Revision. NIPSSR (2012), Population Projection for Japan:2010-2060 15
Source: United Nations (2009) World Population Prospects: The 2008 Revision. NIPSSR (2006), Population Projection for Japan:2006-2055
2050
1950
2000
Direction of
PBO Waves
2010
2060
47
17
2100
266 thous
Trends of number of birth, death in Japan
2060
467 thous
2030
732 thous
Latest(2013)
1,029,816
Baby boom (1947-49)
Max. 22,696,638 (1949)
2nd Baby boom (1971-74)
Max: 22,091,983 (1973)
Death
Peak
2039
1.66 million
Projection
Sources: Ministry of Health, Labour and Welfare, The Vital Statistics, National Institute of Population and Social Security
Research(2012), Population Projection for Japan:2011-2060. (medium variant)
18Source: Esteban Ortiz-Ospina and Max Roser (2016) – ‘World Population Growth’. Published online at OurWorldInData.org. Retrieved from:
https://ourworldindata.org/world-population-growth/.
Schematic process of the demographic transition
Death rate
Birth rate
19Source: United Nations, 2015, World Population Prospects: The 2015 Revision.
Trajectories of the demographic transition of the world countries
20
Source: United Nations, 2015, World Population Prospects: The 2015 Revision.
Latin America
North America
Post DT period
Post modern
regime
Modernization
regime
Pre modern
regime
Life expectancy (year)
Totalfertilityrate
Trajectories of the demographic transition by region of the world
21
Note: Canada, which has remained middle of the two groups. is omitted in the chart to clarify distinction of two groups of fertility levels.
From: Rindfuss,Choe,Brauner-Otto(2016), "The Emergence of Two Distinct Fertility Regimes in Economically Advanced Countries."
Popul.Res.Policy Rev 35:287-304.
TFR’s trends for economically advanced countries:
1981–2012
22
Comparison of population pyramids in future 2050
Source: United Nations (2011), World Population Prospects: The 2010 Revision. NIPSSR(2012), Population Projection for Japan:2011-2060
2.0 1.5 1.0 0.5 0.0 0.5 1.0 1.5 2.0 2.0 1.5 1.0 0.5 0.0 0.5 1.0 1.5 2.0
2.0 1.5 1.0 0.5 0.0 0.5 1.0 1.5 2.0 2.0 1.5 1.0 0.5 0.0 0.5 1.0 1.5 2.0
23
Germany Japan
FranceUSA
Male
Male Male
MaleFemale
Female Female
Female
24
Schematic chart of DT revised from the experiences in Japan
25
-20
-15
-10
-5
0
5
10
15
20
0
5
10
15
20
25
30
35
40
1850 1900 1950 2000 2050 2100
Year
Vitalrate(perthousand)
Crude death rate
Crude birth rate
Rateofnaturalincrease(perthousand)
Rate of natural increase
( see right scale )
-20
-15
-10
-5
0
5
10
15
20
0
5
10
15
20
25
30
35
40
1850 1900 1950 2000 2050 2100
Year
Vitalrate(perthousand)
Crude death rate
Crude birth rate
Rateofnaturalincrease(perthousand)
Rate of natural increase
( see right scale )
Schematic chart of DT revised from the experiences in Japan
26Data sources: Human mortality database
0
50
100
150
200
250
300
350
400
Population(million)
Year
Total Population
27
28United Nations, International migration report 2015 ( Advance copy ),
http://www.un.org/en/development/desa/population/migration/publications/migrationreport/docs/MigrationReport2015_Highlights.pdf
29
Notes:
“China, Hong Kong SAR” stands for
China, Hong Kong Special Administrative
Region, “Iran” for the Islamic Republic of
Iran, “United Kingdom” for the United
Kingdom of Great Britain and Northern
Ireland and “United States” for United
States of America. ‘‘LAC’’ stands for
Latin America and the Caribbean.
Connecting lines indicate that the ranking
of a country or area changed by five
positions or more.
United Nations, International migration report
2015 ( Advance copy ),
http://www.un.org/en/development/desa/population/migrat
ion/publications/migrationreport/docs/MigrationReport20
15_Highlights.pdf
30United Nations, International migration report 2015 ( Advance copy )
2010
2010
2000 2015
31
United Nations, International migration report 2015 ( Advance copy ),
http://www.un.org/en/development/desa/population/migration/publications/migrationreport/docs/MigrationReport2015_Highlights.pdf
32
1960 59.7 41.5 42.9 47.5 9.6 2.9
1990 73.1 47.2 27.0 56.5 16.5 6.6
2010 81.0 52.7 20.9 50.8 28.3 13.6
2030 83.4 57.5 16.8 45.6 37.6 23.3
2050 83.5 60.4 14.3 39.9 45.7 29.1
2060 83.6 61.5 14.2 39.1 46.7 31.7
33
34
35
36
Proportion of women having no child
Sources: National Institute of Population and Social Security Research(2012), Population Projection for Japan:2011-2060.
%
Birth
process
completed
Birth
process
projected
%
Average number
of children
By Cohort
37
Proportion of women having no grand-child
Sources: National Institute of Population and Social Security Research(2012), Population Projection for Japan:2011-2060.
%
Birth process
completed
Birth
process
projected
%
Average number
of grand-children
By Cohort
0 20 40 60 80 100 120
15
20
25
30
35
40
45
50
55
60
65
70
75
80
85
90
95
100
105+
( )Female Population
2055
10 thousands
Age
0 20 40 60 80 100 120
15
20
25
30
35
40
45
50
55
60
65
70
75
80
85
90
95
100
105+
( )Female Population
2030
10 thousands
Age
0 20 40 60 80 100 120
15
20
25
30
35
40
45
50
55
60
65
70
75
80
85
90
95
100
105+
( )Female Population
2005
Female population pyramids composed by family status
38
Increase of women having no spouse, and no child in Japan
10 thousands
Never married
No-child (married)
Sources: Calculated from National Institute of Population and Social Security Research(2008), Population Projection for
Japan:2006-2055.
Age
39
40
41
•
•
•
•
42
2010 2030 2060 24 1
43
2010 2030 2060 24 1 44
45
46
Thank you !
SciREX

More Related Content

Viewers also liked

Pres3 09116017
Pres3 09116017Pres3 09116017
Pres3 09116017GRECIA77
 
研究大学の展望 地域イノベーションと大学の役割
研究大学の展望 地域イノベーションと大学の役割研究大学の展望 地域イノベーションと大学の役割
研究大学の展望 地域イノベーションと大学の役割scirexcenter
 
Threatmetrix rスレットメトリックス・グローバル共有インテリジェンスによる VISA 顧客認証サービス(VCAS)のサポート
Threatmetrix rスレットメトリックス・グローバル共有インテリジェンスによる VISA 顧客認証サービス(VCAS)のサポートThreatmetrix rスレットメトリックス・グローバル共有インテリジェンスによる VISA 顧客認証サービス(VCAS)のサポート
Threatmetrix rスレットメトリックス・グローバル共有インテリジェンスによる VISA 顧客認証サービス(VCAS)のサポートKen Lam
 
科学的助言者と政策担当者の役割
科学的助言者と政策担当者の役割科学的助言者と政策担当者の役割
科学的助言者と政策担当者の役割scirexcenter
 
ThreatMetrix のデジタル・ アイデンティティ
ThreatMetrix のデジタル・ アイデンティティThreatMetrix のデジタル・ アイデンティティ
ThreatMetrix のデジタル・ アイデンティティKen Lam
 
パネルディスカッション: Bigdata の利用と産業連関分析
パネルディスカッション: Bigdata の利用と産業連関分析パネルディスカッション: Bigdata の利用と産業連関分析
パネルディスカッション: Bigdata の利用と産業連関分析scirexcenter
 
「欧米におけるデータ基盤拡充の動き: SciSIPとRISIS」
「欧米におけるデータ基盤拡充の動き: SciSIPとRISIS」「欧米におけるデータ基盤拡充の動き: SciSIPとRISIS」
「欧米におけるデータ基盤拡充の動き: SciSIPとRISIS」scirexcenter
 
エビデンスベースの科学技術イノベーション政策に向けて
エビデンスベースの科学技術イノベーション政策に向けてエビデンスベースの科学技術イノベーション政策に向けて
エビデンスベースの科学技術イノベーション政策に向けてscirexcenter
 
科学的助言の歴史と概念的構造
科学的助言の歴史と概念的構造科学的助言の歴史と概念的構造
科学的助言の歴史と概念的構造scirexcenter
 
科学技術イノベーション政策におけるBig-Dataの利活用促進 SPIAS: SciREX 政策形成インテリジェント支援システムの構想
科学技術イノベーション政策におけるBig-Dataの利活用促進 SPIAS: SciREX 政策形成インテリジェント支援システムの構想科学技術イノベーション政策におけるBig-Dataの利活用促進 SPIAS: SciREX 政策形成インテリジェント支援システムの構想
科学技術イノベーション政策におけるBig-Dataの利活用促進 SPIAS: SciREX 政策形成インテリジェント支援システムの構想scirexcenter
 
科学技術イノベーション政策における「政策のための 科学」推進事業の人材育成に関する調査分析
科学技術イノベーション政策における「政策のための 科学」推進事業の人材育成に関する調査分析科学技術イノベーション政策における「政策のための 科学」推進事業の人材育成に関する調査分析
科学技術イノベーション政策における「政策のための 科学」推進事業の人材育成に関する調査分析scirexcenter
 
科学技術イノベーション政策における「政策のための科学」推進に関する政策課題についての調査分析 報告書/政府研究開発投資目標の設定・投資効果の分析
科学技術イノベーション政策における「政策のための科学」推進に関する政策課題についての調査分析 報告書/政府研究開発投資目標の設定・投資効果の分析科学技術イノベーション政策における「政策のための科学」推進に関する政策課題についての調査分析 報告書/政府研究開発投資目標の設定・投資効果の分析
科学技術イノベーション政策における「政策のための科学」推進に関する政策課題についての調査分析 報告書/政府研究開発投資目標の設定・投資効果の分析scirexcenter
 
科学技術イノベーション政策における「政策のための科学」推進に関する政策課題についての調査分析 報告書/ 科学技術イノベーションにかかる制度の調査分析
科学技術イノベーション政策における「政策のための科学」推進に関する政策課題についての調査分析 報告書/ 科学技術イノベーションにかかる制度の調査分析科学技術イノベーション政策における「政策のための科学」推進に関する政策課題についての調査分析 報告書/ 科学技術イノベーションにかかる制度の調査分析
科学技術イノベーション政策における「政策のための科学」推進に関する政策課題についての調査分析 報告書/ 科学技術イノベーションにかかる制度の調査分析scirexcenter
 
医薬品の評価における科学的助言-特性とPMDAの最近の取組み-
医薬品の評価における科学的助言-特性とPMDAの最近の取組み-医薬品の評価における科学的助言-特性とPMDAの最近の取組み-
医薬品の評価における科学的助言-特性とPMDAの最近の取組み-scirexcenter
 
食品安全分野における科学的助言の現状
食品安全分野における科学的助言の現状食品安全分野における科学的助言の現状
食品安全分野における科学的助言の現状scirexcenter
 
北海道大学における博士人材の育成、輩出のためのデータ分析事例の紹介
北海道大学における博士人材の育成、輩出のためのデータ分析事例の紹介北海道大学における博士人材の育成、輩出のためのデータ分析事例の紹介
北海道大学における博士人材の育成、輩出のためのデータ分析事例の紹介scirexcenter
 
変動する世界における科学技術外交の役割と課題
変動する世界における科学技術外交の役割と課題変動する世界における科学技術外交の役割と課題
変動する世界における科学技術外交の役割と課題scirexcenter
 

Viewers also liked (17)

Pres3 09116017
Pres3 09116017Pres3 09116017
Pres3 09116017
 
研究大学の展望 地域イノベーションと大学の役割
研究大学の展望 地域イノベーションと大学の役割研究大学の展望 地域イノベーションと大学の役割
研究大学の展望 地域イノベーションと大学の役割
 
Threatmetrix rスレットメトリックス・グローバル共有インテリジェンスによる VISA 顧客認証サービス(VCAS)のサポート
Threatmetrix rスレットメトリックス・グローバル共有インテリジェンスによる VISA 顧客認証サービス(VCAS)のサポートThreatmetrix rスレットメトリックス・グローバル共有インテリジェンスによる VISA 顧客認証サービス(VCAS)のサポート
Threatmetrix rスレットメトリックス・グローバル共有インテリジェンスによる VISA 顧客認証サービス(VCAS)のサポート
 
科学的助言者と政策担当者の役割
科学的助言者と政策担当者の役割科学的助言者と政策担当者の役割
科学的助言者と政策担当者の役割
 
ThreatMetrix のデジタル・ アイデンティティ
ThreatMetrix のデジタル・ アイデンティティThreatMetrix のデジタル・ アイデンティティ
ThreatMetrix のデジタル・ アイデンティティ
 
パネルディスカッション: Bigdata の利用と産業連関分析
パネルディスカッション: Bigdata の利用と産業連関分析パネルディスカッション: Bigdata の利用と産業連関分析
パネルディスカッション: Bigdata の利用と産業連関分析
 
「欧米におけるデータ基盤拡充の動き: SciSIPとRISIS」
「欧米におけるデータ基盤拡充の動き: SciSIPとRISIS」「欧米におけるデータ基盤拡充の動き: SciSIPとRISIS」
「欧米におけるデータ基盤拡充の動き: SciSIPとRISIS」
 
エビデンスベースの科学技術イノベーション政策に向けて
エビデンスベースの科学技術イノベーション政策に向けてエビデンスベースの科学技術イノベーション政策に向けて
エビデンスベースの科学技術イノベーション政策に向けて
 
科学的助言の歴史と概念的構造
科学的助言の歴史と概念的構造科学的助言の歴史と概念的構造
科学的助言の歴史と概念的構造
 
科学技術イノベーション政策におけるBig-Dataの利活用促進 SPIAS: SciREX 政策形成インテリジェント支援システムの構想
科学技術イノベーション政策におけるBig-Dataの利活用促進 SPIAS: SciREX 政策形成インテリジェント支援システムの構想科学技術イノベーション政策におけるBig-Dataの利活用促進 SPIAS: SciREX 政策形成インテリジェント支援システムの構想
科学技術イノベーション政策におけるBig-Dataの利活用促進 SPIAS: SciREX 政策形成インテリジェント支援システムの構想
 
科学技術イノベーション政策における「政策のための 科学」推進事業の人材育成に関する調査分析
科学技術イノベーション政策における「政策のための 科学」推進事業の人材育成に関する調査分析科学技術イノベーション政策における「政策のための 科学」推進事業の人材育成に関する調査分析
科学技術イノベーション政策における「政策のための 科学」推進事業の人材育成に関する調査分析
 
科学技術イノベーション政策における「政策のための科学」推進に関する政策課題についての調査分析 報告書/政府研究開発投資目標の設定・投資効果の分析
科学技術イノベーション政策における「政策のための科学」推進に関する政策課題についての調査分析 報告書/政府研究開発投資目標の設定・投資効果の分析科学技術イノベーション政策における「政策のための科学」推進に関する政策課題についての調査分析 報告書/政府研究開発投資目標の設定・投資効果の分析
科学技術イノベーション政策における「政策のための科学」推進に関する政策課題についての調査分析 報告書/政府研究開発投資目標の設定・投資効果の分析
 
科学技術イノベーション政策における「政策のための科学」推進に関する政策課題についての調査分析 報告書/ 科学技術イノベーションにかかる制度の調査分析
科学技術イノベーション政策における「政策のための科学」推進に関する政策課題についての調査分析 報告書/ 科学技術イノベーションにかかる制度の調査分析科学技術イノベーション政策における「政策のための科学」推進に関する政策課題についての調査分析 報告書/ 科学技術イノベーションにかかる制度の調査分析
科学技術イノベーション政策における「政策のための科学」推進に関する政策課題についての調査分析 報告書/ 科学技術イノベーションにかかる制度の調査分析
 
医薬品の評価における科学的助言-特性とPMDAの最近の取組み-
医薬品の評価における科学的助言-特性とPMDAの最近の取組み-医薬品の評価における科学的助言-特性とPMDAの最近の取組み-
医薬品の評価における科学的助言-特性とPMDAの最近の取組み-
 
食品安全分野における科学的助言の現状
食品安全分野における科学的助言の現状食品安全分野における科学的助言の現状
食品安全分野における科学的助言の現状
 
北海道大学における博士人材の育成、輩出のためのデータ分析事例の紹介
北海道大学における博士人材の育成、輩出のためのデータ分析事例の紹介北海道大学における博士人材の育成、輩出のためのデータ分析事例の紹介
北海道大学における博士人材の育成、輩出のためのデータ分析事例の紹介
 
変動する世界における科学技術外交の役割と課題
変動する世界における科学技術外交の役割と課題変動する世界における科学技術外交の役割と課題
変動する世界における科学技術外交の役割と課題
 

Similar to 21世紀、世界の人口構造変化と日本

Population Headlines
Population HeadlinesPopulation Headlines
Population Headlinesjacksonthree
 
Chapter 1PopulationPrudent men should judge of future
Chapter 1PopulationPrudent men should judge of future Chapter 1PopulationPrudent men should judge of future
Chapter 1PopulationPrudent men should judge of future EstelaJeffery653
 
Global population
Global populationGlobal population
Global populationpreeom1234
 
VN stelt vervangingsmigratie als superoplossing voor
VN stelt vervangingsmigratie als superoplossing voorVN stelt vervangingsmigratie als superoplossing voor
VN stelt vervangingsmigratie als superoplossing voorThierry Debels
 
World population prospects the 2017 revision
World population prospects the 2017 revisionWorld population prospects the 2017 revision
World population prospects the 2017 revisionjohneiver
 
Population
PopulationPopulation
Populationmrbruns
 
2_0606_Prof-TAKEMI_JICA_course_lecture.pdf
2_0606_Prof-TAKEMI_JICA_course_lecture.pdf2_0606_Prof-TAKEMI_JICA_course_lecture.pdf
2_0606_Prof-TAKEMI_JICA_course_lecture.pdfssuser01a66e
 
Trends in population 2011
Trends in population 2011Trends in population 2011
Trends in population 2011Lakshmikutty P
 
Malthus theory and population growth through human history
Malthus theory and population growth through human historyMalthus theory and population growth through human history
Malthus theory and population growth through human historyJintubania
 
Annual report eng 2015 mhlw jpn
Annual report eng 2015 mhlw jpnAnnual report eng 2015 mhlw jpn
Annual report eng 2015 mhlw jpnGo Tsuyoshi Ota
 
Globālās ekonomikas tendences
Globālās ekonomikas tendencesGlobālās ekonomikas tendences
Globālās ekonomikas tendencesLatvijas Banka
 
Senior project
Senior projectSenior project
Senior projectAmy Ko
 
Q1. Describe your extended self – the possessions and their attrib.docx
Q1. Describe your extended self – the possessions and their attrib.docxQ1. Describe your extended self – the possessions and their attrib.docx
Q1. Describe your extended self – the possessions and their attrib.docxmakdul
 
populacion de el mundo
populacion de el mundopopulacion de el mundo
populacion de el mundoPeio10
 
Population Class, Section Ia
Population Class, Section IaPopulation Class, Section Ia
Population Class, Section Iajcarlson1
 
The Importance of Immigrants to Boston's Continued prosperity
The Importance of Immigrants to Boston's Continued prosperityThe Importance of Immigrants to Boston's Continued prosperity
The Importance of Immigrants to Boston's Continued prosperityInstituto Diáspora Brasil (IDB)
 
The Human Population Challenge: From “Population Bomb” to “Demographic Crisis”
The Human Population Challenge: From “Population Bomb” to “Demographic Crisis”The Human Population Challenge: From “Population Bomb” to “Demographic Crisis”
The Human Population Challenge: From “Population Bomb” to “Demographic Crisis”Toni Menninger
 

Similar to 21世紀、世界の人口構造変化と日本 (20)

Population Headlines
Population HeadlinesPopulation Headlines
Population Headlines
 
Chapter 1PopulationPrudent men should judge of future
Chapter 1PopulationPrudent men should judge of future Chapter 1PopulationPrudent men should judge of future
Chapter 1PopulationPrudent men should judge of future
 
Global population
Global populationGlobal population
Global population
 
VN stelt vervangingsmigratie als superoplossing voor
VN stelt vervangingsmigratie als superoplossing voorVN stelt vervangingsmigratie als superoplossing voor
VN stelt vervangingsmigratie als superoplossing voor
 
World population prospects the 2017 revision
World population prospects the 2017 revisionWorld population prospects the 2017 revision
World population prospects the 2017 revision
 
Population
PopulationPopulation
Population
 
2_0606_Prof-TAKEMI_JICA_course_lecture.pdf
2_0606_Prof-TAKEMI_JICA_course_lecture.pdf2_0606_Prof-TAKEMI_JICA_course_lecture.pdf
2_0606_Prof-TAKEMI_JICA_course_lecture.pdf
 
Trends in population 2011
Trends in population 2011Trends in population 2011
Trends in population 2011
 
Malthus theory and population growth through human history
Malthus theory and population growth through human historyMalthus theory and population growth through human history
Malthus theory and population growth through human history
 
To Minh Huong.pptx
To Minh Huong.pptxTo Minh Huong.pptx
To Minh Huong.pptx
 
Annual report eng 2015 mhlw jpn
Annual report eng 2015 mhlw jpnAnnual report eng 2015 mhlw jpn
Annual report eng 2015 mhlw jpn
 
Globālās ekonomikas tendences
Globālās ekonomikas tendencesGlobālās ekonomikas tendences
Globālās ekonomikas tendences
 
Senior project
Senior projectSenior project
Senior project
 
Q1. Describe your extended self – the possessions and their attrib.docx
Q1. Describe your extended self – the possessions and their attrib.docxQ1. Describe your extended self – the possessions and their attrib.docx
Q1. Describe your extended self – the possessions and their attrib.docx
 
populacion de el mundo
populacion de el mundopopulacion de el mundo
populacion de el mundo
 
Population Class, Section Ia
Population Class, Section IaPopulation Class, Section Ia
Population Class, Section Ia
 
0615_china_2020.pdf
0615_china_2020.pdf0615_china_2020.pdf
0615_china_2020.pdf
 
The Importance of Immigrants to Boston's Continued prosperity
The Importance of Immigrants to Boston's Continued prosperityThe Importance of Immigrants to Boston's Continued prosperity
The Importance of Immigrants to Boston's Continued prosperity
 
The Human Population Challenge: From “Population Bomb” to “Demographic Crisis”
The Human Population Challenge: From “Population Bomb” to “Demographic Crisis”The Human Population Challenge: From “Population Bomb” to “Demographic Crisis”
The Human Population Challenge: From “Population Bomb” to “Demographic Crisis”
 
Population
PopulationPopulation
Population
 

More from scirexcenter

科学技術イノベーション政策における 「政策のための科学」推進事業における オープンサイエンスに関する 海外動向の調査分析
科学技術イノベーション政策における 「政策のための科学」推進事業における オープンサイエンスに関する 海外動向の調査分析科学技術イノベーション政策における 「政策のための科学」推進事業における オープンサイエンスに関する 海外動向の調査分析
科学技術イノベーション政策における 「政策のための科学」推進事業における オープンサイエンスに関する 海外動向の調査分析scirexcenter
 
政策研究大学院大学科学技術イノベーション政策研究センター(SciREXセンター)
政策研究大学院大学科学技術イノベーション政策研究センター(SciREXセンター)政策研究大学院大学科学技術イノベーション政策研究センター(SciREXセンター)
政策研究大学院大学科学技術イノベーション政策研究センター(SciREXセンター)scirexcenter
 
医療政策の観点から見たビッグデータの活用と課題
医療政策の観点から見たビッグデータの活用と課題医療政策の観点から見たビッグデータの活用と課題
医療政策の観点から見たビッグデータの活用と課題scirexcenter
 
『政策のための科学』の発展にむけて
『政策のための科学』の発展にむけて『政策のための科学』の発展にむけて
『政策のための科学』の発展にむけてscirexcenter
 
話題提供(NISTEP 富澤)
話題提供(NISTEP 富澤)話題提供(NISTEP 富澤)
話題提供(NISTEP 富澤)scirexcenter
 
研究成果の広報にあたって生じうるリスクと、そのマネジメントに対するURAの役割
研究成果の広報にあたって生じうるリスクと、そのマネジメントに対するURAの役割研究成果の広報にあたって生じうるリスクと、そのマネジメントに対するURAの役割
研究成果の広報にあたって生じうるリスクと、そのマネジメントに対するURAの役割scirexcenter
 
研究と個人情報保護法制
研究と個人情報保護法制研究と個人情報保護法制
研究と個人情報保護法制scirexcenter
 
University integrity management 「データの知財保護」と「利益相反」を例に
University integrity management 「データの知財保護」と「利益相反」を例にUniversity integrity management 「データの知財保護」と「利益相反」を例に
University integrity management 「データの知財保護」と「利益相反」を例にscirexcenter
 
「イノベーション創出に向けた産学官連携」:知識マネジメントと制度設計」のこれまでの取り組みから得られたこと
「イノベーション創出に向けた産学官連携」:知識マネジメントと制度設計」のこれまでの取り組みから得られたこと「イノベーション創出に向けた産学官連携」:知識マネジメントと制度設計」のこれまでの取り組みから得られたこと
「イノベーション創出に向けた産学官連携」:知識マネジメントと制度設計」のこれまでの取り組みから得られたことscirexcenter
 
科学的助言をめぐる全体的動向
科学的助言をめぐる全体的動向科学的助言をめぐる全体的動向
科学的助言をめぐる全体的動向scirexcenter
 
地震分野における科学的助言の現状
地震分野における科学的助言の現状地震分野における科学的助言の現状
地震分野における科学的助言の現状scirexcenter
 
戦略的創造研究推進事業の戦略目標策定におけるサイエンスマップ等のデータ活用例の紹介
戦略的創造研究推進事業の戦略目標策定におけるサイエンスマップ等のデータ活用例の紹介戦略的創造研究推進事業の戦略目標策定におけるサイエンスマップ等のデータ活用例の紹介
戦略的創造研究推進事業の戦略目標策定におけるサイエンスマップ等のデータ活用例の紹介scirexcenter
 
政策当局、大学、研究機関等の政策、戦略、を支えるエビデンスの充実に向けて―データの接続と活用の新たな展開―
政策当局、大学、研究機関等の政策、戦略、を支えるエビデンスの充実に向けて―データの接続と活用の新たな展開― 政策当局、大学、研究機関等の政策、戦略、を支えるエビデンスの充実に向けて―データの接続と活用の新たな展開―
政策当局、大学、研究機関等の政策、戦略、を支えるエビデンスの充実に向けて―データの接続と活用の新たな展開― scirexcenter
 
研究開発型大学等発ベンチャー―データベースの構築と活用―
研究開発型大学等発ベンチャー―データベースの構築と活用―研究開発型大学等発ベンチャー―データベースの構築と活用―
研究開発型大学等発ベンチャー―データベースの構築と活用―scirexcenter
 
イノベーションプロセスデータを用いた政策分析の可能性
イノベーションプロセスデータを用いた政策分析の可能性イノベーションプロセスデータを用いた政策分析の可能性
イノベーションプロセスデータを用いた政策分析の可能性scirexcenter
 
⾃治体のもつ⾏政健康資料を可視化して、次世代の政策、産業や健康社会へ役⽴てる-学校健診・⺟⼦保健情報のデータベース化とその利活⽤-
⾃治体のもつ⾏政健康資料を可視化して、次世代の政策、産業や健康社会へ役⽴てる-学校健診・⺟⼦保健情報のデータベース化とその利活⽤-⾃治体のもつ⾏政健康資料を可視化して、次世代の政策、産業や健康社会へ役⽴てる-学校健診・⺟⼦保健情報のデータベース化とその利活⽤-
⾃治体のもつ⾏政健康資料を可視化して、次世代の政策、産業や健康社会へ役⽴てる-学校健診・⺟⼦保健情報のデータベース化とその利活⽤-scirexcenter
 
医療政策と医療データの蓄積・共有
医療政策と医療データの蓄積・共有医療政策と医療データの蓄積・共有
医療政策と医療データの蓄積・共有scirexcenter
 
未来の社会像と科学技術イノベーション政策
未来の社会像と科学技術イノベーション政策未来の社会像と科学技術イノベーション政策
未来の社会像と科学技術イノベーション政策scirexcenter
 
21世紀からの日本への問いかけ (ディスカッションペーパー)
21世紀からの日本への問いかけ (ディスカッションペーパー)21世紀からの日本への問いかけ (ディスカッションペーパー)
21世紀からの日本への問いかけ (ディスカッションペーパー)scirexcenter
 
地域経済分析システム (RESAS) について
地域経済分析システム (RESAS) について地域経済分析システム (RESAS) について
地域経済分析システム (RESAS) についてscirexcenter
 

More from scirexcenter (20)

科学技術イノベーション政策における 「政策のための科学」推進事業における オープンサイエンスに関する 海外動向の調査分析
科学技術イノベーション政策における 「政策のための科学」推進事業における オープンサイエンスに関する 海外動向の調査分析科学技術イノベーション政策における 「政策のための科学」推進事業における オープンサイエンスに関する 海外動向の調査分析
科学技術イノベーション政策における 「政策のための科学」推進事業における オープンサイエンスに関する 海外動向の調査分析
 
政策研究大学院大学科学技術イノベーション政策研究センター(SciREXセンター)
政策研究大学院大学科学技術イノベーション政策研究センター(SciREXセンター)政策研究大学院大学科学技術イノベーション政策研究センター(SciREXセンター)
政策研究大学院大学科学技術イノベーション政策研究センター(SciREXセンター)
 
医療政策の観点から見たビッグデータの活用と課題
医療政策の観点から見たビッグデータの活用と課題医療政策の観点から見たビッグデータの活用と課題
医療政策の観点から見たビッグデータの活用と課題
 
『政策のための科学』の発展にむけて
『政策のための科学』の発展にむけて『政策のための科学』の発展にむけて
『政策のための科学』の発展にむけて
 
話題提供(NISTEP 富澤)
話題提供(NISTEP 富澤)話題提供(NISTEP 富澤)
話題提供(NISTEP 富澤)
 
研究成果の広報にあたって生じうるリスクと、そのマネジメントに対するURAの役割
研究成果の広報にあたって生じうるリスクと、そのマネジメントに対するURAの役割研究成果の広報にあたって生じうるリスクと、そのマネジメントに対するURAの役割
研究成果の広報にあたって生じうるリスクと、そのマネジメントに対するURAの役割
 
研究と個人情報保護法制
研究と個人情報保護法制研究と個人情報保護法制
研究と個人情報保護法制
 
University integrity management 「データの知財保護」と「利益相反」を例に
University integrity management 「データの知財保護」と「利益相反」を例にUniversity integrity management 「データの知財保護」と「利益相反」を例に
University integrity management 「データの知財保護」と「利益相反」を例に
 
「イノベーション創出に向けた産学官連携」:知識マネジメントと制度設計」のこれまでの取り組みから得られたこと
「イノベーション創出に向けた産学官連携」:知識マネジメントと制度設計」のこれまでの取り組みから得られたこと「イノベーション創出に向けた産学官連携」:知識マネジメントと制度設計」のこれまでの取り組みから得られたこと
「イノベーション創出に向けた産学官連携」:知識マネジメントと制度設計」のこれまでの取り組みから得られたこと
 
科学的助言をめぐる全体的動向
科学的助言をめぐる全体的動向科学的助言をめぐる全体的動向
科学的助言をめぐる全体的動向
 
地震分野における科学的助言の現状
地震分野における科学的助言の現状地震分野における科学的助言の現状
地震分野における科学的助言の現状
 
戦略的創造研究推進事業の戦略目標策定におけるサイエンスマップ等のデータ活用例の紹介
戦略的創造研究推進事業の戦略目標策定におけるサイエンスマップ等のデータ活用例の紹介戦略的創造研究推進事業の戦略目標策定におけるサイエンスマップ等のデータ活用例の紹介
戦略的創造研究推進事業の戦略目標策定におけるサイエンスマップ等のデータ活用例の紹介
 
政策当局、大学、研究機関等の政策、戦略、を支えるエビデンスの充実に向けて―データの接続と活用の新たな展開―
政策当局、大学、研究機関等の政策、戦略、を支えるエビデンスの充実に向けて―データの接続と活用の新たな展開― 政策当局、大学、研究機関等の政策、戦略、を支えるエビデンスの充実に向けて―データの接続と活用の新たな展開―
政策当局、大学、研究機関等の政策、戦略、を支えるエビデンスの充実に向けて―データの接続と活用の新たな展開―
 
研究開発型大学等発ベンチャー―データベースの構築と活用―
研究開発型大学等発ベンチャー―データベースの構築と活用―研究開発型大学等発ベンチャー―データベースの構築と活用―
研究開発型大学等発ベンチャー―データベースの構築と活用―
 
イノベーションプロセスデータを用いた政策分析の可能性
イノベーションプロセスデータを用いた政策分析の可能性イノベーションプロセスデータを用いた政策分析の可能性
イノベーションプロセスデータを用いた政策分析の可能性
 
⾃治体のもつ⾏政健康資料を可視化して、次世代の政策、産業や健康社会へ役⽴てる-学校健診・⺟⼦保健情報のデータベース化とその利活⽤-
⾃治体のもつ⾏政健康資料を可視化して、次世代の政策、産業や健康社会へ役⽴てる-学校健診・⺟⼦保健情報のデータベース化とその利活⽤-⾃治体のもつ⾏政健康資料を可視化して、次世代の政策、産業や健康社会へ役⽴てる-学校健診・⺟⼦保健情報のデータベース化とその利活⽤-
⾃治体のもつ⾏政健康資料を可視化して、次世代の政策、産業や健康社会へ役⽴てる-学校健診・⺟⼦保健情報のデータベース化とその利活⽤-
 
医療政策と医療データの蓄積・共有
医療政策と医療データの蓄積・共有医療政策と医療データの蓄積・共有
医療政策と医療データの蓄積・共有
 
未来の社会像と科学技術イノベーション政策
未来の社会像と科学技術イノベーション政策未来の社会像と科学技術イノベーション政策
未来の社会像と科学技術イノベーション政策
 
21世紀からの日本への問いかけ (ディスカッションペーパー)
21世紀からの日本への問いかけ (ディスカッションペーパー)21世紀からの日本への問いかけ (ディスカッションペーパー)
21世紀からの日本への問いかけ (ディスカッションペーパー)
 
地域経済分析システム (RESAS) について
地域経済分析システム (RESAS) について地域経済分析システム (RESAS) について
地域経済分析システム (RESAS) について
 

Recently uploaded

Holdier Curriculum Vitae (April 2024).pdf
Holdier Curriculum Vitae (April 2024).pdfHoldier Curriculum Vitae (April 2024).pdf
Holdier Curriculum Vitae (April 2024).pdfagholdier
 
SECOND SEMESTER TOPIC COVERAGE SY 2023-2024 Trends, Networks, and Critical Th...
SECOND SEMESTER TOPIC COVERAGE SY 2023-2024 Trends, Networks, and Critical Th...SECOND SEMESTER TOPIC COVERAGE SY 2023-2024 Trends, Networks, and Critical Th...
SECOND SEMESTER TOPIC COVERAGE SY 2023-2024 Trends, Networks, and Critical Th...KokoStevan
 
Unit-V; Pricing (Pharma Marketing Management).pptx
Unit-V; Pricing (Pharma Marketing Management).pptxUnit-V; Pricing (Pharma Marketing Management).pptx
Unit-V; Pricing (Pharma Marketing Management).pptxVishalSingh1417
 
Introduction to Nonprofit Accounting: The Basics
Introduction to Nonprofit Accounting: The BasicsIntroduction to Nonprofit Accounting: The Basics
Introduction to Nonprofit Accounting: The BasicsTechSoup
 
How to Give a Domain for a Field in Odoo 17
How to Give a Domain for a Field in Odoo 17How to Give a Domain for a Field in Odoo 17
How to Give a Domain for a Field in Odoo 17Celine George
 
This PowerPoint helps students to consider the concept of infinity.
This PowerPoint helps students to consider the concept of infinity.This PowerPoint helps students to consider the concept of infinity.
This PowerPoint helps students to consider the concept of infinity.christianmathematics
 
Measures of Central Tendency: Mean, Median and Mode
Measures of Central Tendency: Mean, Median and ModeMeasures of Central Tendency: Mean, Median and Mode
Measures of Central Tendency: Mean, Median and ModeThiyagu K
 
Mixin Classes in Odoo 17 How to Extend Models Using Mixin Classes
Mixin Classes in Odoo 17  How to Extend Models Using Mixin ClassesMixin Classes in Odoo 17  How to Extend Models Using Mixin Classes
Mixin Classes in Odoo 17 How to Extend Models Using Mixin ClassesCeline George
 
Nutritional Needs Presentation - HLTH 104
Nutritional Needs Presentation - HLTH 104Nutritional Needs Presentation - HLTH 104
Nutritional Needs Presentation - HLTH 104misteraugie
 
Gardella_PRCampaignConclusion Pitch Letter
Gardella_PRCampaignConclusion Pitch LetterGardella_PRCampaignConclusion Pitch Letter
Gardella_PRCampaignConclusion Pitch LetterMateoGardella
 
Unit-IV; Professional Sales Representative (PSR).pptx
Unit-IV; Professional Sales Representative (PSR).pptxUnit-IV; Professional Sales Representative (PSR).pptx
Unit-IV; Professional Sales Representative (PSR).pptxVishalSingh1417
 
APM Welcome, APM North West Network Conference, Synergies Across Sectors
APM Welcome, APM North West Network Conference, Synergies Across SectorsAPM Welcome, APM North West Network Conference, Synergies Across Sectors
APM Welcome, APM North West Network Conference, Synergies Across SectorsAssociation for Project Management
 
Measures of Dispersion and Variability: Range, QD, AD and SD
Measures of Dispersion and Variability: Range, QD, AD and SDMeasures of Dispersion and Variability: Range, QD, AD and SD
Measures of Dispersion and Variability: Range, QD, AD and SDThiyagu K
 
Web & Social Media Analytics Previous Year Question Paper.pdf
Web & Social Media Analytics Previous Year Question Paper.pdfWeb & Social Media Analytics Previous Year Question Paper.pdf
Web & Social Media Analytics Previous Year Question Paper.pdfJayanti Pande
 
Beyond the EU: DORA and NIS 2 Directive's Global Impact
Beyond the EU: DORA and NIS 2 Directive's Global ImpactBeyond the EU: DORA and NIS 2 Directive's Global Impact
Beyond the EU: DORA and NIS 2 Directive's Global ImpactPECB
 
Basic Civil Engineering first year Notes- Chapter 4 Building.pptx
Basic Civil Engineering first year Notes- Chapter 4 Building.pptxBasic Civil Engineering first year Notes- Chapter 4 Building.pptx
Basic Civil Engineering first year Notes- Chapter 4 Building.pptxDenish Jangid
 
1029-Danh muc Sach Giao Khoa khoi 6.pdf
1029-Danh muc Sach Giao Khoa khoi  6.pdf1029-Danh muc Sach Giao Khoa khoi  6.pdf
1029-Danh muc Sach Giao Khoa khoi 6.pdfQucHHunhnh
 
ICT Role in 21st Century Education & its Challenges.pptx
ICT Role in 21st Century Education & its Challenges.pptxICT Role in 21st Century Education & its Challenges.pptx
ICT Role in 21st Century Education & its Challenges.pptxAreebaZafar22
 
microwave assisted reaction. General introduction
microwave assisted reaction. General introductionmicrowave assisted reaction. General introduction
microwave assisted reaction. General introductionMaksud Ahmed
 

Recently uploaded (20)

Holdier Curriculum Vitae (April 2024).pdf
Holdier Curriculum Vitae (April 2024).pdfHoldier Curriculum Vitae (April 2024).pdf
Holdier Curriculum Vitae (April 2024).pdf
 
SECOND SEMESTER TOPIC COVERAGE SY 2023-2024 Trends, Networks, and Critical Th...
SECOND SEMESTER TOPIC COVERAGE SY 2023-2024 Trends, Networks, and Critical Th...SECOND SEMESTER TOPIC COVERAGE SY 2023-2024 Trends, Networks, and Critical Th...
SECOND SEMESTER TOPIC COVERAGE SY 2023-2024 Trends, Networks, and Critical Th...
 
Unit-V; Pricing (Pharma Marketing Management).pptx
Unit-V; Pricing (Pharma Marketing Management).pptxUnit-V; Pricing (Pharma Marketing Management).pptx
Unit-V; Pricing (Pharma Marketing Management).pptx
 
Mattingly "AI & Prompt Design: Structured Data, Assistants, & RAG"
Mattingly "AI & Prompt Design: Structured Data, Assistants, & RAG"Mattingly "AI & Prompt Design: Structured Data, Assistants, & RAG"
Mattingly "AI & Prompt Design: Structured Data, Assistants, & RAG"
 
Introduction to Nonprofit Accounting: The Basics
Introduction to Nonprofit Accounting: The BasicsIntroduction to Nonprofit Accounting: The Basics
Introduction to Nonprofit Accounting: The Basics
 
How to Give a Domain for a Field in Odoo 17
How to Give a Domain for a Field in Odoo 17How to Give a Domain for a Field in Odoo 17
How to Give a Domain for a Field in Odoo 17
 
This PowerPoint helps students to consider the concept of infinity.
This PowerPoint helps students to consider the concept of infinity.This PowerPoint helps students to consider the concept of infinity.
This PowerPoint helps students to consider the concept of infinity.
 
Measures of Central Tendency: Mean, Median and Mode
Measures of Central Tendency: Mean, Median and ModeMeasures of Central Tendency: Mean, Median and Mode
Measures of Central Tendency: Mean, Median and Mode
 
Mixin Classes in Odoo 17 How to Extend Models Using Mixin Classes
Mixin Classes in Odoo 17  How to Extend Models Using Mixin ClassesMixin Classes in Odoo 17  How to Extend Models Using Mixin Classes
Mixin Classes in Odoo 17 How to Extend Models Using Mixin Classes
 
Nutritional Needs Presentation - HLTH 104
Nutritional Needs Presentation - HLTH 104Nutritional Needs Presentation - HLTH 104
Nutritional Needs Presentation - HLTH 104
 
Gardella_PRCampaignConclusion Pitch Letter
Gardella_PRCampaignConclusion Pitch LetterGardella_PRCampaignConclusion Pitch Letter
Gardella_PRCampaignConclusion Pitch Letter
 
Unit-IV; Professional Sales Representative (PSR).pptx
Unit-IV; Professional Sales Representative (PSR).pptxUnit-IV; Professional Sales Representative (PSR).pptx
Unit-IV; Professional Sales Representative (PSR).pptx
 
APM Welcome, APM North West Network Conference, Synergies Across Sectors
APM Welcome, APM North West Network Conference, Synergies Across SectorsAPM Welcome, APM North West Network Conference, Synergies Across Sectors
APM Welcome, APM North West Network Conference, Synergies Across Sectors
 
Measures of Dispersion and Variability: Range, QD, AD and SD
Measures of Dispersion and Variability: Range, QD, AD and SDMeasures of Dispersion and Variability: Range, QD, AD and SD
Measures of Dispersion and Variability: Range, QD, AD and SD
 
Web & Social Media Analytics Previous Year Question Paper.pdf
Web & Social Media Analytics Previous Year Question Paper.pdfWeb & Social Media Analytics Previous Year Question Paper.pdf
Web & Social Media Analytics Previous Year Question Paper.pdf
 
Beyond the EU: DORA and NIS 2 Directive's Global Impact
Beyond the EU: DORA and NIS 2 Directive's Global ImpactBeyond the EU: DORA and NIS 2 Directive's Global Impact
Beyond the EU: DORA and NIS 2 Directive's Global Impact
 
Basic Civil Engineering first year Notes- Chapter 4 Building.pptx
Basic Civil Engineering first year Notes- Chapter 4 Building.pptxBasic Civil Engineering first year Notes- Chapter 4 Building.pptx
Basic Civil Engineering first year Notes- Chapter 4 Building.pptx
 
1029-Danh muc Sach Giao Khoa khoi 6.pdf
1029-Danh muc Sach Giao Khoa khoi  6.pdf1029-Danh muc Sach Giao Khoa khoi  6.pdf
1029-Danh muc Sach Giao Khoa khoi 6.pdf
 
ICT Role in 21st Century Education & its Challenges.pptx
ICT Role in 21st Century Education & its Challenges.pptxICT Role in 21st Century Education & its Challenges.pptx
ICT Role in 21st Century Education & its Challenges.pptx
 
microwave assisted reaction. General introduction
microwave assisted reaction. General introductionmicrowave assisted reaction. General introduction
microwave assisted reaction. General introduction
 

21世紀、世界の人口構造変化と日本

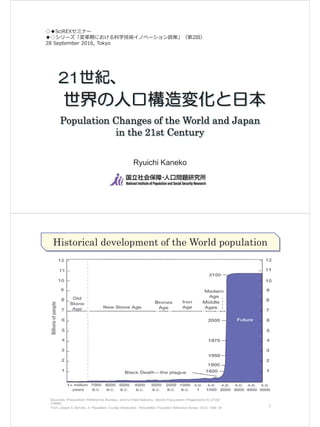
  • 1. Ryuichi Kaneko Population Changes of the World and Japan in the 21st Century 2From: Joseph A. McFalls, Jr. Population: A Lively Introduction. Third edition. Population Reference Bureau 53(3); 1998: 38 Historical development of the World population
  • 2. 0 2 4 6 8 10 12 14 600 800 1000 1200 1400 1600 1800 2000 2200 2400 0 2 4 6 8 10 12 14 600 800 1000 1200 1400 1600 1800 2000 2200 2400 1872 34.8 mil 1721 31.3 mil 1600 12.3 mil 800 5.51 mil 1280 5.95 mil 2100 49.6 mil 2110 42.9 mil Low variant High variant 3 Historical development of the population in Japan Source: -1846: Kito(2000), 1847-1870: Morita(1944), 1872-1919: Statistics Bureau, 1920-2010: Census, 2011-2110: National Institute of Population and Social Security Research(2012), Population Projection for Japan:2011-2060. 2010 128 million 2060 86.7 mil Tokugawa era Year Population(million) ? 4 1961 Universal pension health insurance 2000 Nursing care insurance law Source: Ministry of Internal Affairs and Communications, Statistics Bureau, Census, National Institute of Population and Social Security Research(2012), Population Projection for Japan:2011-2060. 2010 128 million Trends of Japan's population and age structure: 1880 - 2110 130 120 110 100 90 80 70 60 50 40 30 20 10 0 0 10 20 30 40 50 60 70 80 90 100 110 120 130 0 10 20 30 40 50 60 70 80 90 100 130 120 110 100 90 80 70 60 50 40 30 20 10 0 0 10 20 30 40 50 60 70 80 90 100 110 120 130 0 10 20 30 40 50 60 70 80 90 100 130 120 110 100 90 80 70 60 50 40 30 20 10 0 0 10 20 30 40 50 60 70 80 90 100 110 120 130 0 10 20 30 40 50 60 70 80 90 100
  • 3. 5 World population by major region : 1950-2050 Sources: United Nations (2015), World Population Prospects: The 2014 Revision. Statistics Bureau, Census, National Institute of Population and Social Security Research(2012), Population Projection for Japan:2011-2060. Population(inbillion) Year 3.2 % 10 1.9 % United Nations (2011), World Population Prospects: The 2010 Revision. 17 1.0 % 6
  • 4. Japan 7 Sources: United Nations (2015), World Population Prospects: The 2014 Revision. Statistics Bureau, Census, National Institute of Population and Social Security Research(2012), Population Projection for Japan:2011-2060. Trends of China's population and age structure: 1950 - 2100 Projection Elderly Working age Children China Japan 8 Sources: United Nations (2015), World Population Prospects: The 2014 Revision. Statistics Bureau, Census, National Institute of Population and Social Security Research(2012), Population Projection for Japan:2011-2060. Trends of India's population and age structure: 1950 - 2100 Projection Elderly Working age Children India
  • 5. 2100 9 Relative population sizes, when population in 2015 = 100 2100 39.0 % Trends of relative population size (100 in 2015) of the world countries: 1950 - 2100 ProjectionEstimation Italy Korea Japan(IPSS) Japan(UN) Germany Year Relativepopulationsize(P2015=100) Sources: United Nations (2015), World Population Prospects: The 2014 Revision. Statistics Bureau, Census, National Institute of Population and Social Security Research(2012), Population Projection for Japan:2011-2060. -1.5 -1.0 -0.5 0.0 0.5 1.0 1.5 2.0 2.5 3.0 1950 1960 1970 1980 1990 2000 2010 2020 2030 2040 2050 United Nations (2009), World Population Prospects: The 2010 Revision. 2010 2050 10
  • 6. Sources: United Nations (2015), World Population Prospects: The 2014 Revision. Statistics Bureau, Census, National Institute of Population and Social Security Research(2012), Population Projection for Japan:2011-2060. 11 Trends of proportion elderly (%) of the world countries: 1950 - 2100 0.0 1.0 2.0 3.0 4.0 5.0 6.0 7.0 8.0 40 45 50 55 60 65 70 75 80 85 0.0 1.0 2.0 3.0 4.0 5.0 6.0 7.0 8.0 55 60 65 70 75 80 85 90 95 International Comparison of the LE and the TFR 12 Countries with population >= 10 million in 2005 Life expectancy Totalfertilityrate(TFR) Life expectancy Totalfertilityrate(TFR) Japan Japan Sources: United Nations (2011), World Population Prospects: The 2010 Revision. Statistics Bureau, Census, National Institute of Population and Social Security Research(2012), Population Projection for Japan:2011-2060.
  • 7. 0 20 40 60 80 100 120 140 1950 1970 1990 2010 2030 2050 2070 2090 2110 13 2100 4,959 2100 10,221 2010 12,806 2050 11,142 2050 9,708 2030 11,662 2030 12,289 2012 24 0 20 40 60 80 100 120 1880 1900 1920 1940 1960 1980 2000 2020 2040 2060 2080 2100 21 14
  • 8. Comparison of the dependency ratio Some Asian countries Source: United Nations (2011) World Population Prospects: The 2010 Revision. NIPSSR (2012), Population Projection for Japan:2010-2060 15 Source: United Nations (2009) World Population Prospects: The 2008 Revision. NIPSSR (2006), Population Projection for Japan:2006-2055 2050 1950 2000 Direction of PBO Waves 2010
  • 9. 2060 47 17 2100 266 thous Trends of number of birth, death in Japan 2060 467 thous 2030 732 thous Latest(2013) 1,029,816 Baby boom (1947-49) Max. 22,696,638 (1949) 2nd Baby boom (1971-74) Max: 22,091,983 (1973) Death Peak 2039 1.66 million Projection Sources: Ministry of Health, Labour and Welfare, The Vital Statistics, National Institute of Population and Social Security Research(2012), Population Projection for Japan:2011-2060. (medium variant) 18Source: Esteban Ortiz-Ospina and Max Roser (2016) – ‘World Population Growth’. Published online at OurWorldInData.org. Retrieved from: https://ourworldindata.org/world-population-growth/. Schematic process of the demographic transition Death rate Birth rate
  • 10. 19Source: United Nations, 2015, World Population Prospects: The 2015 Revision. Trajectories of the demographic transition of the world countries 20 Source: United Nations, 2015, World Population Prospects: The 2015 Revision. Latin America North America Post DT period Post modern regime Modernization regime Pre modern regime Life expectancy (year) Totalfertilityrate Trajectories of the demographic transition by region of the world
  • 11. 21 Note: Canada, which has remained middle of the two groups. is omitted in the chart to clarify distinction of two groups of fertility levels. From: Rindfuss,Choe,Brauner-Otto(2016), "The Emergence of Two Distinct Fertility Regimes in Economically Advanced Countries." Popul.Res.Policy Rev 35:287-304. TFR’s trends for economically advanced countries: 1981–2012 22
  • 12. Comparison of population pyramids in future 2050 Source: United Nations (2011), World Population Prospects: The 2010 Revision. NIPSSR(2012), Population Projection for Japan:2011-2060 2.0 1.5 1.0 0.5 0.0 0.5 1.0 1.5 2.0 2.0 1.5 1.0 0.5 0.0 0.5 1.0 1.5 2.0 2.0 1.5 1.0 0.5 0.0 0.5 1.0 1.5 2.0 2.0 1.5 1.0 0.5 0.0 0.5 1.0 1.5 2.0 23 Germany Japan FranceUSA Male Male Male MaleFemale Female Female Female 24
  • 13. Schematic chart of DT revised from the experiences in Japan 25 -20 -15 -10 -5 0 5 10 15 20 0 5 10 15 20 25 30 35 40 1850 1900 1950 2000 2050 2100 Year Vitalrate(perthousand) Crude death rate Crude birth rate Rateofnaturalincrease(perthousand) Rate of natural increase ( see right scale ) -20 -15 -10 -5 0 5 10 15 20 0 5 10 15 20 25 30 35 40 1850 1900 1950 2000 2050 2100 Year Vitalrate(perthousand) Crude death rate Crude birth rate Rateofnaturalincrease(perthousand) Rate of natural increase ( see right scale ) Schematic chart of DT revised from the experiences in Japan 26Data sources: Human mortality database 0 50 100 150 200 250 300 350 400 Population(million) Year Total Population
  • 14. 27 28United Nations, International migration report 2015 ( Advance copy ), http://www.un.org/en/development/desa/population/migration/publications/migrationreport/docs/MigrationReport2015_Highlights.pdf
  • 15. 29 Notes: “China, Hong Kong SAR” stands for China, Hong Kong Special Administrative Region, “Iran” for the Islamic Republic of Iran, “United Kingdom” for the United Kingdom of Great Britain and Northern Ireland and “United States” for United States of America. ‘‘LAC’’ stands for Latin America and the Caribbean. Connecting lines indicate that the ranking of a country or area changed by five positions or more. United Nations, International migration report 2015 ( Advance copy ), http://www.un.org/en/development/desa/population/migrat ion/publications/migrationreport/docs/MigrationReport20 15_Highlights.pdf 30United Nations, International migration report 2015 ( Advance copy ) 2010 2010 2000 2015
  • 16. 31 United Nations, International migration report 2015 ( Advance copy ), http://www.un.org/en/development/desa/population/migration/publications/migrationreport/docs/MigrationReport2015_Highlights.pdf 32
  • 17. 1960 59.7 41.5 42.9 47.5 9.6 2.9 1990 73.1 47.2 27.0 56.5 16.5 6.6 2010 81.0 52.7 20.9 50.8 28.3 13.6 2030 83.4 57.5 16.8 45.6 37.6 23.3 2050 83.5 60.4 14.3 39.9 45.7 29.1 2060 83.6 61.5 14.2 39.1 46.7 31.7 33 34
  • 18. 35 36 Proportion of women having no child Sources: National Institute of Population and Social Security Research(2012), Population Projection for Japan:2011-2060. % Birth process completed Birth process projected % Average number of children By Cohort
  • 19. 37 Proportion of women having no grand-child Sources: National Institute of Population and Social Security Research(2012), Population Projection for Japan:2011-2060. % Birth process completed Birth process projected % Average number of grand-children By Cohort 0 20 40 60 80 100 120 15 20 25 30 35 40 45 50 55 60 65 70 75 80 85 90 95 100 105+ ( )Female Population 2055 10 thousands Age 0 20 40 60 80 100 120 15 20 25 30 35 40 45 50 55 60 65 70 75 80 85 90 95 100 105+ ( )Female Population 2030 10 thousands Age 0 20 40 60 80 100 120 15 20 25 30 35 40 45 50 55 60 65 70 75 80 85 90 95 100 105+ ( )Female Population 2005 Female population pyramids composed by family status 38 Increase of women having no spouse, and no child in Japan 10 thousands Never married No-child (married) Sources: Calculated from National Institute of Population and Social Security Research(2008), Population Projection for Japan:2006-2055. Age
  • 20. 39 40
  • 22. 2010 2030 2060 24 1 43 2010 2030 2060 24 1 44
  • 23. 45 46