SlideShare a Scribd company logo
1 of 34
Chapter 1
Population
Prudent men should judge of future events by what has taken
place in the past,
and what is taking place in the present.
Miguel de Cervantes (1547–1616), Persiles and Sigismunda
The Changing Population of the World
The population of the world is growing. No one will be startled
by that sentence,
but what is startling is the rate of growth, and the fact that the
present growth of
population is unprecedented in human history. The best
historical evidence we have
today indicates that there were about 5 million people in the
world about 8000 bc.
By ad 1 there were about 200 million, and by 1650 the
population had grown to
about 500 million. The world reached its first billion people
about 1800; the second
billion came about 1930. The third billion was reached about
1960, the fourth about
1974, and the fifth about 1987. The sixth came in 1999 and the
seventh in 2011.
These figures indicate how rapidly the population is increasing.
Table 1.1 shows how
long it took the world to add each billion of its total population.
A projection is also
given for the next billion.
There is another way to look at population growth, one that
helps us understand
the uniqueness of our situation and its staggering possibilities
for harm to life on this
planet. Because most people born can have children of their
own, the human popula-
tion can – until certain limits are reached – grow exponentially:
1 to 2; 2 to 4; 4 to
8; 8 to 16; 16 to 32; 32 to 64; 64 to 128; and so on. When
something grows expo-
nentially, there is hardly discernible growth in the early stages
and then the numbers
shoot up. The French have a riddle they use to help teach the
nature of exponential
growth to children. It goes like this: if you have a pond with
one lily in it that doubles
its size every day, and which will completely cover the pond in
30 days, on what day
will the lily cover half the pond? The answer is the twenty-ninth
day. What this riddle
Global Issues: An Introduction, Fourth Edition. John L. Seitz,
Kristen A. Hite.
© 2012 John Wiley & Sons, Ltd. Published 2012 by John Wiley
& Sons, Ltd.
4 Global Issues
tells you is that if you wait until the lily covers half the pond
before cutting it back,
you will have only one day to do this – the twenty-ninth day –
because it will cover
the whole pond the next day.
If you plot on a graph anything that has an exponential growth,
you get a J-curve.
For a long time there is not much growth but when the bend of
the curve in the
“J” is reached, the growth becomes dramatic. Figure 1.1 shows
what the earth’s
population growth curve looks like.
The growth of the earth’s population has been compared to a
long fuse on a
bomb: once the fuse is lit, it sputters along for a long while and
then suddenly the
bomb explodes. This is what is meant by the phrases
“population explosion” and
“population bomb.” The analogy is not a bad one. The world’s
population has passed
Table 1.1 Time taken to add each billion to the world
population,
1800–2046 (projection)
Date Estimated world
population (billions)
Years to add
1 billion people
1800 1 2,000,000
1930 2 130
1960 3 30
1974 4 14
1987 5 13
1999 6 12
2011 7 12
2024 (projected) 8 13
2046 (projected) 9 22
Source: UN World Population Prospects: The 2008 Revision
Figure 1.1 Population growth from 8000 BC to 2011 AD
6
7
5
4
3
2
1
1999
2011
1987
1974
1960
1930
1800
8000
BC
7000
BC
6000
BC
5000
BC
4000
BC
3000
BC
2000
BC
1000
BC
1
AD
1000
AD
2000
AD
B
ill
io
n
s
o
f
pe
o
pl
e
Year
0
Population 5
the bend of the J-curve and is now rapidly expanding. The
United Nations estimates
the world’s population reached 7 billion in 2011, shooting up
from the estimated 2
billion in 1930.
Figure 1.2 shows that the largest growth in the future will be in
the less developed
countries of the world, with India, Africa, and China leading the
way. At the end of
the twentieth century about 80 percent of the people in the
world lived in the devel-
oping countries. During the present century, nearly all of the
growth in population
will occur in the less developed countries. An ever-larger
percentage of the world’s
population will be relatively poor. In 1950 about two-thirds of
the world’s people
lived in the less developed countries. By 2000 this percentage
had increased to about
80 percent and the United Nations projects that by 2050 about
85 percent of the
earth’s population will be residing in the poorer nations.
Because no one knows for sure what the size of the earth’s
population will be in
the future, the United Nations gives three projections: a high,
medium, and low one,
based on the possible number of children the average woman
will have. Projections
are educated guesses. The United Nations believes the middle
projection is the most
likely and most authors writing on the subject use that number.
The population in
the developed regions is expected to slowly grow to 1.3 billion
in 2050 from 1.2
billion in 2008, with most of that growth in the United States
and Canada due to
immigration from less developed countries. The less developed
countries are expected
to increase from 5.5 billion in 2008 to 8.1 billion in 2050.1
From 2010 to 2050
about one-half of the annual growth is expected to occur in nine
countries – India,
Pakistan, Nigeria, Ethiopia, the United States, the Democratic
Republic of the
Congo, Tanzania, China, and Bangladesh. (These countries are
listed according to
Figure 1.2 Population growth in less developed and more
developed countries, 1950–2050
(projected)
Source: United Nations Population Division, World Population
Prospects: The 2006 Revision, Medium
Variant (2007).
10
9
8
7
6
5
4
3
2
1
0
1950 1970 1990 2010 2030
(projected)
Other less developed countries
Africa
China
India
Population (billions)
2050
(projected)
More developed countries
6 Global Issues
the size of their contribution to world population growth.) The
largest growth is
expected in India, which is likely to pass China by 2028 to be
the largest country in
the world, with 1.5 billion people. At that time India and China
will account for
about one-third of the world’s population. Figure 1.3 gives the
three growth projec-
tions by the United Nations up to 2050.
High growth rates will take place in the less developed
countries because a large
percentage of their population consists of children under the age
of 15 who will be
growing older and having children themselves. If we plot the
number of people in a
country according to their ages, we can see clearly the
difference between rapidly
growing populations, which most less developed nations have,
and relatively stable
or slowly growing populations, which the more developed
nations have. Figure 1.4
shows the difference between the populations of the more
developed countries and
less developed countries. The age structure of the more
developed countries is gener-
ally column shaped, while the age structure of the less
developed countries is usually
pyramid shaped.
Another major change occurring in the world’s population is the
movement of
people from rural areas to urban areas. Although this is
happening throughout the
world, the trend is especially dramatic in the developing world,
where people are
fleeing rural areas to escape the extreme poverty that is
common in those areas, and
because the cities seem to offer a more stimulating life. Mostly
it is the young people
who go to the cities, hoping to find work and better living
conditions. But all too
often jobs are not available in the cities either. These rural
migrants usually settle in
Figure 1.3 World population projections to 2050: three
scenarios
Source: United Nations Population Division, World Population
Prospects: The 2008 Revision (2009).
B
ill
io
n
s
12
10
0
2000 2005 2010 2015 2020 2025 2030 2035 2040
High 10.5
9.1
8.0
Medium
Low
2045 2050
8
6
4
2
Population 7
slums on the edges of the big cities. At current rates the
populations in these informal
settlements will double every 10 to 15 years. It is hard to
imagine a city like Calcutta
getting any bigger. In 1950, when I visited it, it had a
population of about 4 million,
and thousands of these people lived permanently on the streets;
in 1990 it had a
population of about 13 million and an estimated 400,000 lived
on the streets.2 If
the present rate of growth continues, it will have a population of
about 17 million
by 2015. Table 1.2 gives the world’s ten largest cities in 1950
and 2000 and the
Figure 1.4 Population by age and sex in developed and less
developed countries 2010
(projected)
Source: United Nations Population Division, World Population
Prospects: The 2008 Revision (2009).
85+
80–84
75–79
70–74
65–69
60–64
55–59
50–54
45–49
40–44
35–39
30–34
25–29
20–24
15–19
10–14
5–9
0–4
85+
80–84
75–79
70–74
65–69
60–64
55–59
50–54
45–49
40–44
35–39
30–34
25–29
20–24
15–19
10–14
5–9
0–4
Males
Population (millions), 2010
300 200 100 0 100 200 300
Age DEVELOPED COUNTRIES
Females Males
Population (millions), 2010
300 200 100 0 100 200 300
Age DEVELOPING COUNTRIES
Females
Table 1.2 Ten largest citiesa in the world, 1950, 2000, and 2015
(projection)
Population in 1950 (millions) Population in 2000
(millions)
Population in 2015
(projected) (millions)
New York, US 12 Tokyo, Japan 26 Tokyo, Japan 27
London, UK 9 Mexico City,
Mexico
18 Delhi, India 24
Tokyo, Japan 7 São Paolo, Brazil 18 Mumbai (Bombay),
India
22
Paris, France 5 New York, US 17 Sao Paulo, Brazil 21
Moscow, USSR 5 Buenos Aires, 16 Mexico City, Mexico 20
Shanghai, China 5 Los Angeles, US 13 New York-Newark, US
20
Essen, Germany 5 Calcutta, India 13 Shanghai, China 18
Buenos Aires, Argentina 5 Shanghai, China 13 Calcutta, India
17
Chicago, US 5 Dhaka, Bangladesh 13 Dhaka, Bangladesh 17
Calcutta, India 4 Delhi, India 12 Karachi, Pakistan 15
a Formally called “urban agglomerations” in UN publications.
Source: (for 2015 projections) UN Population Division, World
Urbanization Prospects: The 2009 Revision
Plate 1.2 Growing cities in less developed nations often have a
mixture of modern and
substandard housing (United Nations)
Plate 1.1 Rural migrants often settle in urban slums in
developing nations (United Nations)
Population 9
The most innovative city in the world: Curitiba, Brazil
Curitiba, Brazil, has been called the most innovative city in the
world. City
officials from around the world visit Curitiba to learn how this
city, with rela-
tively limited funds, has been tackling urban problems. By
using imaginative,
low-cost solutions and low technology, Curitiba has created a
pleasant urban
life that many cities in the more developed nations have yet to
achieve. Here
is how the city achieved this.
Transportation The city has made public transportation
attractive, afford-
able, and efficient. Instead of building a subway, which the city
could not afford,
it established a system of extended, high-speed buses, some
carrying as many
as 275 passengers, on express routes, connecting the city center
with outlying
areas. Many people own cars in Curitiba but 85 percent of the
commuters use
public transportation. This has reduced traffic congestion and
air pollution.
There are 30 percent fewer cars on city streets than you would
expect from the
number of cars owned by its residents.
Trash collection Poor people are encouraged to collect
recyclable trash in
the areas where they live and turn it in for food. In 1995 the
city gave out
about 350,000 Easter eggs, 25,000 Christmas cakes, and 2
million pounds of
food in exchange for trash. About 70 percent of its trash is
recycled, one of the
highest rates in the world.
Education Small libraries have been built throughout the city in
the shape
of a lighthouse. Called Lighthouses of Learning, they provide
books (many
schools in Brazil have no books), an attractive study room, and,
in a tower, a
strong light and guard to make the area safe.
Health Curitiba has more health clinics – that are open 24 hours
a day –
per person than any other city in Brazil.
Environmental education The Free University for the
Environment was
built out of recycled old utility poles next to a lake made from
an old quarry.
Short courses on how to make better use of the environment
have been
designed for contractors, merchants, and housewives. Taxi
drivers are required
to take a course there in order to get their licenses.
(Continued)
projected ten largest for the year 2015.3 Note that eight of the
ten largest cities in
the year 2015 are expected to be in the less developed countries
– Tokyo and New
York are the exceptions – whereas in 1950 only three of the ten
were in the poorer
countries (Shanghai, Buenos Aires, and Calcutta).
Note also the increased size of the cities. Cities with over 5
million people are
sometimes called “megacities.” In 1950 Buenos Aires and
Shanghai were the only
cities in the developing world with at least 5 million people. By
2005 there were
about 60 megacities in the world with the majority of them
being in the less devel-
oped nations. Many of these cities had vast areas of substandard
housing and serious
urban pollution, and many of their residents lived without
sanitation facilities, safe
drinking water, or adequate healthcare facilities.
Chapter 1
Population
Prudent men should judge of future events by what has taken
place in the past,
and what is taking place in the present.
Miguel de Cervantes (1547–1616), Persiles and Sigismunda
The Changing Population of the World
The population of the world is growing. No one will be startled
by that sentence,
but what is startling is the rate of growth, and the fact that the
present growth of
population is unprecedented in human history. The best
historical evidence we have
today indicates that there were about 5 million people in the
world about 8000 bc.
By ad 1 there were about 200 million, and by 1650 the
population had grown to
about 500 million. The world reached its first billion people
about 1800; the second
billion came about 1930. The third billion was reached about
1960, the fourth about
1974, and the fifth about 1987. The sixth came in 1999 and the
seventh in 2011.
These figures indicate how rapidly the population is increasing.
Table 1.1 shows how
long it took the world to add each billion of its total population.
A projection is also
given for the next billion.
There is another way to look at population growth, one that
helps us understand
the uniqueness of our situation and its staggering possibilities
for harm to life on this
planet. Because most people born can have children of their
own, the human popula-
tion can – until certain limits are reached – grow exponentially:
1 to 2; 2 to 4; 4 to
8; 8 to 16; 16 to 32; 32 to 64; 64 to 128; and so on. When
something grows expo-
nentially, there is hardly discernible growth in the early stages
and then the numbers
shoot up. The French have a riddle they use to help teach the
nature of exponential
growth to children. It goes like this: if you have a pond with
one lily in it that doubles
its size every day, and which will completely cover the pond in
30 days, on what day
will the lily cover half the pond? The answer is the twenty-ninth
day. What this riddle
Global Issues: An Introduction, Fourth Edition. John L. Seitz,
Kristen A. Hite.
© 2012 John Wiley & Sons, Ltd. Published 2012 by John Wiley
& Sons, Ltd.
4 Global Issues
tells you is that if you wait until the lily covers half the pond
before cutting it back,
you will have only one day to do this – the twenty-ninth day –
because it will cover
the whole pond the next day.
If you plot on a graph anything that has an exponential growth,
you get a J-curve.
For a long time there is not much growth but when the bend of
the curve in the
“J” is reached, the growth becomes dramatic. Figure 1.1 shows
what the earth’s
population growth curve looks like.
The growth of the earth’s population has been compared to a
long fuse on a
bomb: once the fuse is lit, it sputters along for a long while and
then suddenly the
bomb explodes. This is what is meant by the phrases
“population explosion” and
“population bomb.” The analogy is not a bad one. The world’s
population has passed
Table 1.1 Time taken to add each billion to the world
population,
1800–2046 (projection)
Date Estimated world
population (billions)
Years to add
1 billion people
1800 1 2,000,000
1930 2 130
1960 3 30
1974 4 14
1987 5 13
1999 6 12
2011 7 12
2024 (projected) 8 13
2046 (projected) 9 22
Source: UN World Population Prospects: The 2008 Revision
Figure 1.1 Population growth from 8000 BC to 2011 AD
6
7
5
4
3
2
1
1999
2011
1987
1974
1960
1930
1800
8000
BC
7000
BC
6000
BC
5000
BC
4000
BC
3000
BC
2000
BC
1000
BC
1
AD
1000
AD
2000
AD
B
ill
io
n
s
o
f
pe
o
pl
e
Year
0
Population 5
the bend of the J-curve and is now rapidly expanding. The
United Nations estimates
the world’s population reached 7 billion in 2011, shooting up
from the estimated 2
billion in 1930.
Figure 1.2 shows that the largest growth in the future will be in
the less developed
countries of the world, with India, Africa, and China leading the
way. At the end of
the twentieth century about 80 percent of the people in the
world lived in the devel-
oping countries. During the present century, nearly all of the
growth in population
will occur in the less developed countries. An ever-larger
percentage of the world’s
population will be relatively poor. In 1950 about two-thirds of
the world’s people
lived in the less developed countries. By 2000 this percentage
had increased to about
80 percent and the United Nations projects that by 2050 about
85 percent of the
earth’s population will be residing in the poorer nations.
Because no one knows for sure what the size of the earth’s
population will be in
the future, the United Nations gives three projections: a high,
medium, and low one,
based on the possible number of children the average woman
will have. Projections
are educated guesses. The United Nations believes the middle
projection is the most
likely and most authors writing on the subject use that number.
The population in
the developed regions is expected to slowly grow to 1.3 billion
in 2050 from 1.2
billion in 2008, with most of that growth in the United States
and Canada due to
immigration from less developed countries. The less developed
countries are expected
to increase from 5.5 billion in 2008 to 8.1 billion in 2050.1
From 2010 to 2050
about one-half of the annual growth is expected to occur in nine
countries – India,
Pakistan, Nigeria, Ethiopia, the United States, the Democratic
Republic of the
Congo, Tanzania, China, and Bangladesh. (These countries are
listed according to
Figure 1.2 Population growth in less developed and more
developed countries, 1950–2050
(projected)
Source: United Nations Population Division, World Population
Prospects: The 2006 Revision, Medium
Variant (2007).
10
9
8
7
6
5
4
3
2
1
0
1950 1970 1990 2010 2030
(projected)
Other less developed countries
Africa
China
India
Population (billions)
2050
(projected)
More developed countries
6 Global Issues
the size of their contribution to world population growth.) The
largest growth is
expected in India, which is likely to pass China by 2028 to be
the largest country in
the world, with 1.5 billion people. At that time India and China
will account for
about one-third of the world’s population. Figure 1.3 gives the
three growth projec-
tions by the United Nations up to 2050.
High growth rates will take place in the less developed
countries because a large
percentage of their population consists of children under the age
of 15 who will be
growing older and having children themselves. If we plot the
number of people in a
country according to their ages, we can see clearly the
difference between rapidly
growing populations, which most less developed nations have,
and relatively stable
or slowly growing populations, which the more developed
nations have. Figure 1.4
shows the difference between the populations of the more
developed countries and
less developed countries. The age structure of the more
developed countries is gener-
ally column shaped, while the age structure of the less
developed countries is usually
pyramid shaped.
Another major change occurring in the world’s population is the
movement of
people from rural areas to urban areas. Although this is
happening throughout the
world, the trend is especially dramatic in the developing world,
where people are
fleeing rural areas to escape the extreme poverty that is
common in those areas, and
because the cities seem to offer a more stimulating life. Mostly
it is the young people
who go to the cities, hoping to find work and better living
conditions. But all too
often jobs are not available in the cities either. These rural
migrants usually settle in
Figure 1.3 World population projections to 2050: three
scenarios
Source: United Nations Population Division, World Population
Prospects: The 2008 Revision (2009).
B
ill
io
n
s
12
10
0
2000 2005 2010 2015 2020 2025 2030 2035 2040
High 10.5
9.1
8.0
Medium
Low
2045 2050
8
6
4
2
Population 7
slums on the edges of the big cities. At current rates the
populations in these informal
settlements will double every 10 to 15 years. It is hard to
imagine a city like Calcutta
getting any bigger. In 1950, when I visited it, it had a
population of about 4 million,
and thousands of these people lived permanently on the streets;
in 1990 it had a
population of about 13 million and an estimated 400,000 lived
on the streets.2 If
the present rate of growth continues, it will have a population of
about 17 million
by 2015. Table 1.2 gives the world’s ten largest cities in 1950
and 2000 and the
Figure 1.4 Population by age and sex in developed and less
developed countries 2010
(projected)
Source: United Nations Population Division, World Population
Prospects: The 2008 Revision (2009).
85+
80–84
75–79
70–74
65–69
60–64
55–59
50–54
45–49
40–44
35–39
30–34
25–29
20–24
15–19
10–14
5–9
0–4
85+
80–84
75–79
70–74
65–69
60–64
55–59
50–54
45–49
40–44
35–39
30–34
25–29
20–24
15–19
10–14
5–9
0–4
Males
Population (millions), 2010
300 200 100 0 100 200 300
Age DEVELOPED COUNTRIES
Females Males
Population (millions), 2010
300 200 100 0 100 200 300
Age DEVELOPING COUNTRIES
Females
Table 1.2 Ten largest citiesa in the world, 1950, 2000, and 2015
(projection)
Population in 1950 (millions) Population in 2000
(millions)
Population in 2015
(projected) (millions)
New York, US 12 Tokyo, Japan 26 Tokyo, Japan 27
London, UK 9 Mexico City,
Mexico
18 Delhi, India 24
Tokyo, Japan 7 São Paolo, Brazil 18 Mumbai (Bombay),
India
22
Paris, France 5 New York, US 17 Sao Paulo, Brazil 21
Moscow, USSR 5 Buenos Aires, 16 Mexico City, Mexico 20
Shanghai, China 5 Los Angeles, US 13 New York-Newark, US
20
Essen, Germany 5 Calcutta, India 13 Shanghai, China 18
Buenos Aires, Argentina 5 Shanghai, China 13 Calcutta, India
17
Chicago, US 5 Dhaka, Bangladesh 13 Dhaka, Bangladesh 17
Calcutta, India 4 Delhi, India 12 Karachi, Pakistan 15
a Formally called “urban agglomerations” in UN publications.
Source: (for 2015 projections) UN Population Division, World
Urbanization Prospects: The 2009 Revision
Plate 1.2 Growing cities in less developed nations often have a
mixture of modern and
substandard housing (United Nations)
Plate 1.1 Rural migrants often settle in urban slums in
developing nations (United Nations)
Population 9
The most innovative city in the world: Curitiba, Brazil
Curitiba, Brazil, has been called the most innovative city in the
world. City
officials from around the world visit Curitiba to learn how this
city, with rela-
tively limited funds, has been tackling urban problems. By
using imaginative,
low-cost solutions and low technology, Curitiba has created a
pleasant urban
life that many cities in the more developed nations have yet to
achieve. Here
is how the city achieved this.
Transportation The city has made public transportation
attractive, afford-
able, and efficient. Instead of building a subway, which the city
could not afford,
it established a system of extended, high-speed buses, some
carrying as many
as 275 passengers, on express routes, connecting the city center
with outlying
areas. Many people own cars in Curitiba but 85 percent of the
commuters use
public transportation. This has reduced traffic congestion and
air pollution.
There are 30 percent fewer cars on city streets than you would
expect from the
number of cars owned by its residents.
Trash collection Poor people are encouraged to collect
recyclable trash in
the areas where they live and turn it in for food. In 1995 the
city gave out
about 350,000 Easter eggs, 25,000 Christmas cakes, and 2
million pounds of
food in exchange for trash. About 70 percent of its trash is
recycled, one of the
highest rates in the world.
Education Small libraries have been built throughout the city in
the shape
of a lighthouse. Called Lighthouses of Learning, they provide
books (many
schools in Brazil have no books), an attractive study room, and,
in a tower, a
strong light and guard to make the area safe.
Health Curitiba has more health clinics – that are open 24 hours
a day –
per person than any other city in Brazil.
Environmental education The Free University for the
Environment was
built out of recycled old utility poles next to a lake made from
an old quarry.
Short courses on how to make better use of the environment
have been
designed for contractors, merchants, and housewives. Taxi
drivers are required
to take a course there in order to get their licenses.
(Continued)
projected ten largest for the year 2015.3 Note that eight of the
ten largest cities in
the year 2015 are expected to be in the less developed countri es
– Tokyo and New
York are the exceptions – whereas in 1950 only three of the ten
were in the poorer
countries (Shanghai, Buenos Aires, and Calcutta).
Note also the increased size of the cities. Cities with over 5
million people are
sometimes called “megacities.” In 1950 Buenos Aires and
Shanghai were the only
cities in the developing world with at least 5 million people. By
2005 there were
about 60 megacities in the world with the majority of them
being in the less devel-
oped nations. Many of these cities had vast areas of substandard
housing and serious
urban pollution, and many of their residents lived without
sanitation facilities, safe
drinking water, or adequate healthcare facilities.

More Related Content

Similar to Chapter 1PopulationPrudent men should judge of future

World population prospects the 2017 revision
World population prospects the 2017 revisionWorld population prospects the 2017 revision
World population prospects the 2017 revisionjohneiver
 
World Population 2024 (trends, growth)pptx
World Population 2024 (trends, growth)pptxWorld Population 2024 (trends, growth)pptx
World Population 2024 (trends, growth)pptxmihajlokarna1
 
Global population
Global populationGlobal population
Global populationpreeom1234
 
Honors geo. ch 5 p.p.
Honors geo. ch 5 p.p.Honors geo. ch 5 p.p.
Honors geo. ch 5 p.p.tobin15
 
Chapter 20 Lecture Notes.pptx
Chapter 20 Lecture Notes.pptxChapter 20 Lecture Notes.pptx
Chapter 20 Lecture Notes.pptxssuserd14842
 
World human population growth through history
World human population growth through historyWorld human population growth through history
World human population growth through historyBiswajit Das
 
Population Growth Essay
Population Growth EssayPopulation Growth Essay
Population Growth EssayManchester24
 
The Human Population Challenge: From “Population Bomb” to “Demographic Crisis”
The Human Population Challenge: From “Population Bomb” to “Demographic Crisis”The Human Population Challenge: From “Population Bomb” to “Demographic Crisis”
The Human Population Challenge: From “Population Bomb” to “Demographic Crisis”Toni Menninger
 
VN stelt vervangingsmigratie als superoplossing voor
VN stelt vervangingsmigratie als superoplossing voorVN stelt vervangingsmigratie als superoplossing voor
VN stelt vervangingsmigratie als superoplossing voorThierry Debels
 
global demography ctw.pdf report
global demography ctw.pdf reportglobal demography ctw.pdf report
global demography ctw.pdf reportManuelGasparillo
 
21世紀、世界の人口構造変化と日本
21世紀、世界の人口構造変化と日本21世紀、世界の人口構造変化と日本
21世紀、世界の人口構造変化と日本scirexcenter
 
The Global Issue Of Population Growth
The Global Issue Of Population GrowthThe Global Issue Of Population Growth
The Global Issue Of Population GrowthKaren Oliver
 

Similar to Chapter 1PopulationPrudent men should judge of future (19)

World population prospects the 2017 revision
World population prospects the 2017 revisionWorld population prospects the 2017 revision
World population prospects the 2017 revision
 
#Editorialcartoon yamantao
#Editorialcartoon yamantao#Editorialcartoon yamantao
#Editorialcartoon yamantao
 
World Population 2024 (trends, growth)pptx
World Population 2024 (trends, growth)pptxWorld Population 2024 (trends, growth)pptx
World Population 2024 (trends, growth)pptx
 
Global population
Global populationGlobal population
Global population
 
Essay Of Population Growth
Essay Of Population GrowthEssay Of Population Growth
Essay Of Population Growth
 
World Population Growth
World Population GrowthWorld Population Growth
World Population Growth
 
Increasing Population Uncertainty Essay
Increasing Population Uncertainty EssayIncreasing Population Uncertainty Essay
Increasing Population Uncertainty Essay
 
Essay On World Population
Essay On World PopulationEssay On World Population
Essay On World Population
 
Honors geo. ch 5 p.p.
Honors geo. ch 5 p.p.Honors geo. ch 5 p.p.
Honors geo. ch 5 p.p.
 
Population
PopulationPopulation
Population
 
Chapter 20 Lecture Notes.pptx
Chapter 20 Lecture Notes.pptxChapter 20 Lecture Notes.pptx
Chapter 20 Lecture Notes.pptx
 
World human population growth through history
World human population growth through historyWorld human population growth through history
World human population growth through history
 
Population Growth Essay
Population Growth EssayPopulation Growth Essay
Population Growth Essay
 
The Human Population Challenge: From “Population Bomb” to “Demographic Crisis”
The Human Population Challenge: From “Population Bomb” to “Demographic Crisis”The Human Population Challenge: From “Population Bomb” to “Demographic Crisis”
The Human Population Challenge: From “Population Bomb” to “Demographic Crisis”
 
VN stelt vervangingsmigratie als superoplossing voor
VN stelt vervangingsmigratie als superoplossing voorVN stelt vervangingsmigratie als superoplossing voor
VN stelt vervangingsmigratie als superoplossing voor
 
global demography ctw.pdf report
global demography ctw.pdf reportglobal demography ctw.pdf report
global demography ctw.pdf report
 
Overpopulation Essays
Overpopulation EssaysOverpopulation Essays
Overpopulation Essays
 
21世紀、世界の人口構造変化と日本
21世紀、世界の人口構造変化と日本21世紀、世界の人口構造変化と日本
21世紀、世界の人口構造変化と日本
 
The Global Issue Of Population Growth
The Global Issue Of Population GrowthThe Global Issue Of Population Growth
The Global Issue Of Population Growth
 

More from EstelaJeffery653

Individual ProjectMedical TechnologyWed, 9617Num.docx
Individual ProjectMedical TechnologyWed, 9617Num.docxIndividual ProjectMedical TechnologyWed, 9617Num.docx
Individual ProjectMedical TechnologyWed, 9617Num.docxEstelaJeffery653
 
Individual ProjectThe Post-Watergate EraWed, 3817Numeric.docx
Individual ProjectThe Post-Watergate EraWed, 3817Numeric.docxIndividual ProjectThe Post-Watergate EraWed, 3817Numeric.docx
Individual ProjectThe Post-Watergate EraWed, 3817Numeric.docxEstelaJeffery653
 
Individual ProjectArticulating the Integrated PlanWed, 31.docx
Individual ProjectArticulating the Integrated PlanWed, 31.docxIndividual ProjectArticulating the Integrated PlanWed, 31.docx
Individual ProjectArticulating the Integrated PlanWed, 31.docxEstelaJeffery653
 
Individual Multilingualism Guidelines1)Where did the a.docx
Individual Multilingualism Guidelines1)Where did the a.docxIndividual Multilingualism Guidelines1)Where did the a.docx
Individual Multilingualism Guidelines1)Where did the a.docxEstelaJeffery653
 
Individual Implementation Strategiesno new messagesObjectives.docx
Individual Implementation Strategiesno new messagesObjectives.docxIndividual Implementation Strategiesno new messagesObjectives.docx
Individual Implementation Strategiesno new messagesObjectives.docxEstelaJeffery653
 
Individual Refine and Finalize WebsiteDueJul 02View m.docx
Individual Refine and Finalize WebsiteDueJul 02View m.docxIndividual Refine and Finalize WebsiteDueJul 02View m.docx
Individual Refine and Finalize WebsiteDueJul 02View m.docxEstelaJeffery653
 
Individual Cultural Communication Written Assignment  (Worth 20 of .docx
Individual Cultural Communication Written Assignment  (Worth 20 of .docxIndividual Cultural Communication Written Assignment  (Worth 20 of .docx
Individual Cultural Communication Written Assignment  (Worth 20 of .docxEstelaJeffery653
 
Individual ProjectThe Basic Marketing PlanWed, 3117N.docx
Individual ProjectThe Basic Marketing PlanWed, 3117N.docxIndividual ProjectThe Basic Marketing PlanWed, 3117N.docx
Individual ProjectThe Basic Marketing PlanWed, 3117N.docxEstelaJeffery653
 
Individual ProjectFinancial Procedures in a Health Care Organiza.docx
Individual ProjectFinancial Procedures in a Health Care Organiza.docxIndividual ProjectFinancial Procedures in a Health Care Organiza.docx
Individual ProjectFinancial Procedures in a Health Care Organiza.docxEstelaJeffery653
 
Individual Expanded Website PlanView more »Expand view.docx
Individual Expanded Website PlanView more  »Expand view.docxIndividual Expanded Website PlanView more  »Expand view.docx
Individual Expanded Website PlanView more »Expand view.docxEstelaJeffery653
 
Individual Expanded Website PlanDueJul 02View more .docx
Individual Expanded Website PlanDueJul 02View more .docxIndividual Expanded Website PlanDueJul 02View more .docx
Individual Expanded Website PlanDueJul 02View more .docxEstelaJeffery653
 
Individual Communicating to Management Concerning Information Syste.docx
Individual Communicating to Management Concerning Information Syste.docxIndividual Communicating to Management Concerning Information Syste.docx
Individual Communicating to Management Concerning Information Syste.docxEstelaJeffery653
 
Individual Case Analysis-MatavIn max 4 single-spaced total pag.docx
Individual Case Analysis-MatavIn max 4 single-spaced total pag.docxIndividual Case Analysis-MatavIn max 4 single-spaced total pag.docx
Individual Case Analysis-MatavIn max 4 single-spaced total pag.docxEstelaJeffery653
 
Individual Assignment Report Format• Report should contain not m.docx
Individual Assignment Report Format• Report should contain not m.docxIndividual Assignment Report Format• Report should contain not m.docx
Individual Assignment Report Format• Report should contain not m.docxEstelaJeffery653
 
Include LOCO api that allows user to key in an address and get the d.docx
Include LOCO api that allows user to key in an address and get the d.docxInclude LOCO api that allows user to key in an address and get the d.docx
Include LOCO api that allows user to key in an address and get the d.docxEstelaJeffery653
 
Include the title, the name of the composer (if known) and of the .docx
Include the title, the name of the composer (if known) and of the .docxInclude the title, the name of the composer (if known) and of the .docx
Include the title, the name of the composer (if known) and of the .docxEstelaJeffery653
 
include as many events as possible to support your explanation of th.docx
include as many events as possible to support your explanation of th.docxinclude as many events as possible to support your explanation of th.docx
include as many events as possible to support your explanation of th.docxEstelaJeffery653
 
Incorporate the suggestions that were provided by your fellow projec.docx
Incorporate the suggestions that were provided by your fellow projec.docxIncorporate the suggestions that were provided by your fellow projec.docx
Incorporate the suggestions that were provided by your fellow projec.docxEstelaJeffery653
 
inal ProjectDUE Jun 25, 2017 1155 PMGrade DetailsGradeNA.docx
inal ProjectDUE Jun 25, 2017 1155 PMGrade DetailsGradeNA.docxinal ProjectDUE Jun 25, 2017 1155 PMGrade DetailsGradeNA.docx
inal ProjectDUE Jun 25, 2017 1155 PMGrade DetailsGradeNA.docxEstelaJeffery653
 
include 1page proposal- short introduction to research paper and yo.docx
include 1page proposal- short introduction to research paper and yo.docxinclude 1page proposal- short introduction to research paper and yo.docx
include 1page proposal- short introduction to research paper and yo.docxEstelaJeffery653
 

More from EstelaJeffery653 (20)

Individual ProjectMedical TechnologyWed, 9617Num.docx
Individual ProjectMedical TechnologyWed, 9617Num.docxIndividual ProjectMedical TechnologyWed, 9617Num.docx
Individual ProjectMedical TechnologyWed, 9617Num.docx
 
Individual ProjectThe Post-Watergate EraWed, 3817Numeric.docx
Individual ProjectThe Post-Watergate EraWed, 3817Numeric.docxIndividual ProjectThe Post-Watergate EraWed, 3817Numeric.docx
Individual ProjectThe Post-Watergate EraWed, 3817Numeric.docx
 
Individual ProjectArticulating the Integrated PlanWed, 31.docx
Individual ProjectArticulating the Integrated PlanWed, 31.docxIndividual ProjectArticulating the Integrated PlanWed, 31.docx
Individual ProjectArticulating the Integrated PlanWed, 31.docx
 
Individual Multilingualism Guidelines1)Where did the a.docx
Individual Multilingualism Guidelines1)Where did the a.docxIndividual Multilingualism Guidelines1)Where did the a.docx
Individual Multilingualism Guidelines1)Where did the a.docx
 
Individual Implementation Strategiesno new messagesObjectives.docx
Individual Implementation Strategiesno new messagesObjectives.docxIndividual Implementation Strategiesno new messagesObjectives.docx
Individual Implementation Strategiesno new messagesObjectives.docx
 
Individual Refine and Finalize WebsiteDueJul 02View m.docx
Individual Refine and Finalize WebsiteDueJul 02View m.docxIndividual Refine and Finalize WebsiteDueJul 02View m.docx
Individual Refine and Finalize WebsiteDueJul 02View m.docx
 
Individual Cultural Communication Written Assignment  (Worth 20 of .docx
Individual Cultural Communication Written Assignment  (Worth 20 of .docxIndividual Cultural Communication Written Assignment  (Worth 20 of .docx
Individual Cultural Communication Written Assignment  (Worth 20 of .docx
 
Individual ProjectThe Basic Marketing PlanWed, 3117N.docx
Individual ProjectThe Basic Marketing PlanWed, 3117N.docxIndividual ProjectThe Basic Marketing PlanWed, 3117N.docx
Individual ProjectThe Basic Marketing PlanWed, 3117N.docx
 
Individual ProjectFinancial Procedures in a Health Care Organiza.docx
Individual ProjectFinancial Procedures in a Health Care Organiza.docxIndividual ProjectFinancial Procedures in a Health Care Organiza.docx
Individual ProjectFinancial Procedures in a Health Care Organiza.docx
 
Individual Expanded Website PlanView more »Expand view.docx
Individual Expanded Website PlanView more  »Expand view.docxIndividual Expanded Website PlanView more  »Expand view.docx
Individual Expanded Website PlanView more »Expand view.docx
 
Individual Expanded Website PlanDueJul 02View more .docx
Individual Expanded Website PlanDueJul 02View more .docxIndividual Expanded Website PlanDueJul 02View more .docx
Individual Expanded Website PlanDueJul 02View more .docx
 
Individual Communicating to Management Concerning Information Syste.docx
Individual Communicating to Management Concerning Information Syste.docxIndividual Communicating to Management Concerning Information Syste.docx
Individual Communicating to Management Concerning Information Syste.docx
 
Individual Case Analysis-MatavIn max 4 single-spaced total pag.docx
Individual Case Analysis-MatavIn max 4 single-spaced total pag.docxIndividual Case Analysis-MatavIn max 4 single-spaced total pag.docx
Individual Case Analysis-MatavIn max 4 single-spaced total pag.docx
 
Individual Assignment Report Format• Report should contain not m.docx
Individual Assignment Report Format• Report should contain not m.docxIndividual Assignment Report Format• Report should contain not m.docx
Individual Assignment Report Format• Report should contain not m.docx
 
Include LOCO api that allows user to key in an address and get the d.docx
Include LOCO api that allows user to key in an address and get the d.docxInclude LOCO api that allows user to key in an address and get the d.docx
Include LOCO api that allows user to key in an address and get the d.docx
 
Include the title, the name of the composer (if known) and of the .docx
Include the title, the name of the composer (if known) and of the .docxInclude the title, the name of the composer (if known) and of the .docx
Include the title, the name of the composer (if known) and of the .docx
 
include as many events as possible to support your explanation of th.docx
include as many events as possible to support your explanation of th.docxinclude as many events as possible to support your explanation of th.docx
include as many events as possible to support your explanation of th.docx
 
Incorporate the suggestions that were provided by your fellow projec.docx
Incorporate the suggestions that were provided by your fellow projec.docxIncorporate the suggestions that were provided by your fellow projec.docx
Incorporate the suggestions that were provided by your fellow projec.docx
 
inal ProjectDUE Jun 25, 2017 1155 PMGrade DetailsGradeNA.docx
inal ProjectDUE Jun 25, 2017 1155 PMGrade DetailsGradeNA.docxinal ProjectDUE Jun 25, 2017 1155 PMGrade DetailsGradeNA.docx
inal ProjectDUE Jun 25, 2017 1155 PMGrade DetailsGradeNA.docx
 
include 1page proposal- short introduction to research paper and yo.docx
include 1page proposal- short introduction to research paper and yo.docxinclude 1page proposal- short introduction to research paper and yo.docx
include 1page proposal- short introduction to research paper and yo.docx
 

Recently uploaded

ROOT CAUSE ANALYSIS PowerPoint Presentation
ROOT CAUSE ANALYSIS PowerPoint PresentationROOT CAUSE ANALYSIS PowerPoint Presentation
ROOT CAUSE ANALYSIS PowerPoint PresentationAadityaSharma884161
 
DATA STRUCTURE AND ALGORITHM for beginners
DATA STRUCTURE AND ALGORITHM for beginnersDATA STRUCTURE AND ALGORITHM for beginners
DATA STRUCTURE AND ALGORITHM for beginnersSabitha Banu
 
Proudly South Africa powerpoint Thorisha.pptx
Proudly South Africa powerpoint Thorisha.pptxProudly South Africa powerpoint Thorisha.pptx
Proudly South Africa powerpoint Thorisha.pptxthorishapillay1
 
AmericanHighSchoolsprezentacijaoskolama.
AmericanHighSchoolsprezentacijaoskolama.AmericanHighSchoolsprezentacijaoskolama.
AmericanHighSchoolsprezentacijaoskolama.arsicmarija21
 
Crayon Activity Handout For the Crayon A
Crayon Activity Handout For the Crayon ACrayon Activity Handout For the Crayon A
Crayon Activity Handout For the Crayon AUnboundStockton
 
Planning a health career 4th Quarter.pptx
Planning a health career 4th Quarter.pptxPlanning a health career 4th Quarter.pptx
Planning a health career 4th Quarter.pptxLigayaBacuel1
 
Earth Day Presentation wow hello nice great
Earth Day Presentation wow hello nice greatEarth Day Presentation wow hello nice great
Earth Day Presentation wow hello nice greatYousafMalik24
 
Alper Gobel In Media Res Media Component
Alper Gobel In Media Res Media ComponentAlper Gobel In Media Res Media Component
Alper Gobel In Media Res Media ComponentInMediaRes1
 
Full Stack Web Development Course for Beginners
Full Stack Web Development Course  for BeginnersFull Stack Web Development Course  for Beginners
Full Stack Web Development Course for BeginnersSabitha Banu
 
Gas measurement O2,Co2,& ph) 04/2024.pptx
Gas measurement O2,Co2,& ph) 04/2024.pptxGas measurement O2,Co2,& ph) 04/2024.pptx
Gas measurement O2,Co2,& ph) 04/2024.pptxDr.Ibrahim Hassaan
 
Framing an Appropriate Research Question 6b9b26d93da94caf993c038d9efcdedb.pdf
Framing an Appropriate Research Question 6b9b26d93da94caf993c038d9efcdedb.pdfFraming an Appropriate Research Question 6b9b26d93da94caf993c038d9efcdedb.pdf
Framing an Appropriate Research Question 6b9b26d93da94caf993c038d9efcdedb.pdfUjwalaBharambe
 
Computed Fields and api Depends in the Odoo 17
Computed Fields and api Depends in the Odoo 17Computed Fields and api Depends in the Odoo 17
Computed Fields and api Depends in the Odoo 17Celine George
 
HỌC TỐT TIẾNG ANH 11 THEO CHƯƠNG TRÌNH GLOBAL SUCCESS ĐÁP ÁN CHI TIẾT - CẢ NĂ...
HỌC TỐT TIẾNG ANH 11 THEO CHƯƠNG TRÌNH GLOBAL SUCCESS ĐÁP ÁN CHI TIẾT - CẢ NĂ...HỌC TỐT TIẾNG ANH 11 THEO CHƯƠNG TRÌNH GLOBAL SUCCESS ĐÁP ÁN CHI TIẾT - CẢ NĂ...
HỌC TỐT TIẾNG ANH 11 THEO CHƯƠNG TRÌNH GLOBAL SUCCESS ĐÁP ÁN CHI TIẾT - CẢ NĂ...Nguyen Thanh Tu Collection
 
Introduction to ArtificiaI Intelligence in Higher Education
Introduction to ArtificiaI Intelligence in Higher EducationIntroduction to ArtificiaI Intelligence in Higher Education
Introduction to ArtificiaI Intelligence in Higher Educationpboyjonauth
 
ECONOMIC CONTEXT - LONG FORM TV DRAMA - PPT
ECONOMIC CONTEXT - LONG FORM TV DRAMA - PPTECONOMIC CONTEXT - LONG FORM TV DRAMA - PPT
ECONOMIC CONTEXT - LONG FORM TV DRAMA - PPTiammrhaywood
 
Field Attribute Index Feature in Odoo 17
Field Attribute Index Feature in Odoo 17Field Attribute Index Feature in Odoo 17
Field Attribute Index Feature in Odoo 17Celine George
 
What is Model Inheritance in Odoo 17 ERP
What is Model Inheritance in Odoo 17 ERPWhat is Model Inheritance in Odoo 17 ERP
What is Model Inheritance in Odoo 17 ERPCeline George
 

Recently uploaded (20)

ROOT CAUSE ANALYSIS PowerPoint Presentation
ROOT CAUSE ANALYSIS PowerPoint PresentationROOT CAUSE ANALYSIS PowerPoint Presentation
ROOT CAUSE ANALYSIS PowerPoint Presentation
 
DATA STRUCTURE AND ALGORITHM for beginners
DATA STRUCTURE AND ALGORITHM for beginnersDATA STRUCTURE AND ALGORITHM for beginners
DATA STRUCTURE AND ALGORITHM for beginners
 
Proudly South Africa powerpoint Thorisha.pptx
Proudly South Africa powerpoint Thorisha.pptxProudly South Africa powerpoint Thorisha.pptx
Proudly South Africa powerpoint Thorisha.pptx
 
AmericanHighSchoolsprezentacijaoskolama.
AmericanHighSchoolsprezentacijaoskolama.AmericanHighSchoolsprezentacijaoskolama.
AmericanHighSchoolsprezentacijaoskolama.
 
Crayon Activity Handout For the Crayon A
Crayon Activity Handout For the Crayon ACrayon Activity Handout For the Crayon A
Crayon Activity Handout For the Crayon A
 
Planning a health career 4th Quarter.pptx
Planning a health career 4th Quarter.pptxPlanning a health career 4th Quarter.pptx
Planning a health career 4th Quarter.pptx
 
Earth Day Presentation wow hello nice great
Earth Day Presentation wow hello nice greatEarth Day Presentation wow hello nice great
Earth Day Presentation wow hello nice great
 
Alper Gobel In Media Res Media Component
Alper Gobel In Media Res Media ComponentAlper Gobel In Media Res Media Component
Alper Gobel In Media Res Media Component
 
Full Stack Web Development Course for Beginners
Full Stack Web Development Course  for BeginnersFull Stack Web Development Course  for Beginners
Full Stack Web Development Course for Beginners
 
Gas measurement O2,Co2,& ph) 04/2024.pptx
Gas measurement O2,Co2,& ph) 04/2024.pptxGas measurement O2,Co2,& ph) 04/2024.pptx
Gas measurement O2,Co2,& ph) 04/2024.pptx
 
TataKelola dan KamSiber Kecerdasan Buatan v022.pdf
TataKelola dan KamSiber Kecerdasan Buatan v022.pdfTataKelola dan KamSiber Kecerdasan Buatan v022.pdf
TataKelola dan KamSiber Kecerdasan Buatan v022.pdf
 
Framing an Appropriate Research Question 6b9b26d93da94caf993c038d9efcdedb.pdf
Framing an Appropriate Research Question 6b9b26d93da94caf993c038d9efcdedb.pdfFraming an Appropriate Research Question 6b9b26d93da94caf993c038d9efcdedb.pdf
Framing an Appropriate Research Question 6b9b26d93da94caf993c038d9efcdedb.pdf
 
Rapple "Scholarly Communications and the Sustainable Development Goals"
Rapple "Scholarly Communications and the Sustainable Development Goals"Rapple "Scholarly Communications and the Sustainable Development Goals"
Rapple "Scholarly Communications and the Sustainable Development Goals"
 
Computed Fields and api Depends in the Odoo 17
Computed Fields and api Depends in the Odoo 17Computed Fields and api Depends in the Odoo 17
Computed Fields and api Depends in the Odoo 17
 
Raw materials used in Herbal Cosmetics.pptx
Raw materials used in Herbal Cosmetics.pptxRaw materials used in Herbal Cosmetics.pptx
Raw materials used in Herbal Cosmetics.pptx
 
HỌC TỐT TIẾNG ANH 11 THEO CHƯƠNG TRÌNH GLOBAL SUCCESS ĐÁP ÁN CHI TIẾT - CẢ NĂ...
HỌC TỐT TIẾNG ANH 11 THEO CHƯƠNG TRÌNH GLOBAL SUCCESS ĐÁP ÁN CHI TIẾT - CẢ NĂ...HỌC TỐT TIẾNG ANH 11 THEO CHƯƠNG TRÌNH GLOBAL SUCCESS ĐÁP ÁN CHI TIẾT - CẢ NĂ...
HỌC TỐT TIẾNG ANH 11 THEO CHƯƠNG TRÌNH GLOBAL SUCCESS ĐÁP ÁN CHI TIẾT - CẢ NĂ...
 
Introduction to ArtificiaI Intelligence in Higher Education
Introduction to ArtificiaI Intelligence in Higher EducationIntroduction to ArtificiaI Intelligence in Higher Education
Introduction to ArtificiaI Intelligence in Higher Education
 
ECONOMIC CONTEXT - LONG FORM TV DRAMA - PPT
ECONOMIC CONTEXT - LONG FORM TV DRAMA - PPTECONOMIC CONTEXT - LONG FORM TV DRAMA - PPT
ECONOMIC CONTEXT - LONG FORM TV DRAMA - PPT
 
Field Attribute Index Feature in Odoo 17
Field Attribute Index Feature in Odoo 17Field Attribute Index Feature in Odoo 17
Field Attribute Index Feature in Odoo 17
 
What is Model Inheritance in Odoo 17 ERP
What is Model Inheritance in Odoo 17 ERPWhat is Model Inheritance in Odoo 17 ERP
What is Model Inheritance in Odoo 17 ERP
 

Chapter 1PopulationPrudent men should judge of future

  • 1. Chapter 1 Population Prudent men should judge of future events by what has taken place in the past, and what is taking place in the present. Miguel de Cervantes (1547–1616), Persiles and Sigismunda The Changing Population of the World The population of the world is growing. No one will be startled by that sentence, but what is startling is the rate of growth, and the fact that the present growth of population is unprecedented in human history. The best historical evidence we have today indicates that there were about 5 million people in the world about 8000 bc. By ad 1 there were about 200 million, and by 1650 the population had grown to about 500 million. The world reached its first billion people about 1800; the second billion came about 1930. The third billion was reached about 1960, the fourth about 1974, and the fifth about 1987. The sixth came in 1999 and the seventh in 2011. These figures indicate how rapidly the population is increasing. Table 1.1 shows how long it took the world to add each billion of its total population. A projection is also
  • 2. given for the next billion. There is another way to look at population growth, one that helps us understand the uniqueness of our situation and its staggering possibilities for harm to life on this planet. Because most people born can have children of their own, the human popula- tion can – until certain limits are reached – grow exponentially: 1 to 2; 2 to 4; 4 to 8; 8 to 16; 16 to 32; 32 to 64; 64 to 128; and so on. When something grows expo- nentially, there is hardly discernible growth in the early stages and then the numbers shoot up. The French have a riddle they use to help teach the nature of exponential growth to children. It goes like this: if you have a pond with one lily in it that doubles its size every day, and which will completely cover the pond in 30 days, on what day will the lily cover half the pond? The answer is the twenty-ninth day. What this riddle Global Issues: An Introduction, Fourth Edition. John L. Seitz, Kristen A. Hite. © 2012 John Wiley & Sons, Ltd. Published 2012 by John Wiley & Sons, Ltd. 4 Global Issues tells you is that if you wait until the lily covers half the pond before cutting it back, you will have only one day to do this – the twenty-ninth day – because it will cover
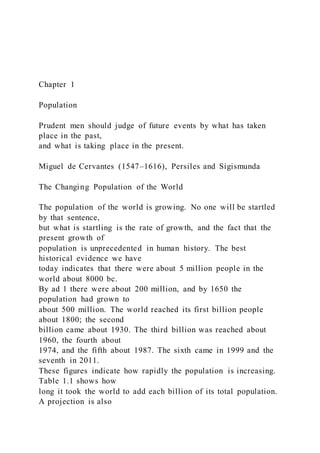
  • 3. the whole pond the next day. If you plot on a graph anything that has an exponential growth, you get a J-curve. For a long time there is not much growth but when the bend of the curve in the “J” is reached, the growth becomes dramatic. Figure 1.1 shows what the earth’s population growth curve looks like. The growth of the earth’s population has been compared to a long fuse on a bomb: once the fuse is lit, it sputters along for a long while and then suddenly the bomb explodes. This is what is meant by the phrases “population explosion” and “population bomb.” The analogy is not a bad one. The world’s population has passed Table 1.1 Time taken to add each billion to the world population, 1800–2046 (projection) Date Estimated world population (billions) Years to add 1 billion people 1800 1 2,000,000 1930 2 130 1960 3 30 1974 4 14 1987 5 13 1999 6 12 2011 7 12
  • 4. 2024 (projected) 8 13 2046 (projected) 9 22 Source: UN World Population Prospects: The 2008 Revision Figure 1.1 Population growth from 8000 BC to 2011 AD 6 7 5 4 3 2 1 1999 2011 1987 1974 1960 1930 1800 8000
  • 6. n s o f pe o pl e Year 0 Population 5 the bend of the J-curve and is now rapidly expanding. The United Nations estimates the world’s population reached 7 billion in 2011, shooting up from the estimated 2 billion in 1930. Figure 1.2 shows that the largest growth in the future will be in the less developed countries of the world, with India, Africa, and China leading the way. At the end of the twentieth century about 80 percent of the people in the world lived in the devel- oping countries. During the present century, nearly all of the growth in population will occur in the less developed countries. An ever-larger
  • 7. percentage of the world’s population will be relatively poor. In 1950 about two-thirds of the world’s people lived in the less developed countries. By 2000 this percentage had increased to about 80 percent and the United Nations projects that by 2050 about 85 percent of the earth’s population will be residing in the poorer nations. Because no one knows for sure what the size of the earth’s population will be in the future, the United Nations gives three projections: a high, medium, and low one, based on the possible number of children the average woman will have. Projections are educated guesses. The United Nations believes the middle projection is the most likely and most authors writing on the subject use that number. The population in the developed regions is expected to slowly grow to 1.3 billion in 2050 from 1.2 billion in 2008, with most of that growth in the United States and Canada due to immigration from less developed countries. The less developed countries are expected to increase from 5.5 billion in 2008 to 8.1 billion in 2050.1 From 2010 to 2050 about one-half of the annual growth is expected to occur in nine countries – India, Pakistan, Nigeria, Ethiopia, the United States, the Democratic Republic of the Congo, Tanzania, China, and Bangladesh. (These countries are listed according to Figure 1.2 Population growth in less developed and more developed countries, 1950–2050
  • 8. (projected) Source: United Nations Population Division, World Population Prospects: The 2006 Revision, Medium Variant (2007). 10 9 8 7 6 5 4 3 2 1 0 1950 1970 1990 2010 2030 (projected) Other less developed countries Africa China
  • 9. India Population (billions) 2050 (projected) More developed countries 6 Global Issues the size of their contribution to world population growth.) The largest growth is expected in India, which is likely to pass China by 2028 to be the largest country in the world, with 1.5 billion people. At that time India and China will account for about one-third of the world’s population. Figure 1.3 gives the three growth projec- tions by the United Nations up to 2050. High growth rates will take place in the less developed countries because a large percentage of their population consists of children under the age of 15 who will be growing older and having children themselves. If we plot the number of people in a country according to their ages, we can see clearly the difference between rapidly growing populations, which most less developed nations have, and relatively stable or slowly growing populations, which the more developed nations have. Figure 1.4 shows the difference between the populations of the more
  • 10. developed countries and less developed countries. The age structure of the more developed countries is gener- ally column shaped, while the age structure of the less developed countries is usually pyramid shaped. Another major change occurring in the world’s population is the movement of people from rural areas to urban areas. Although this is happening throughout the world, the trend is especially dramatic in the developing world, where people are fleeing rural areas to escape the extreme poverty that is common in those areas, and because the cities seem to offer a more stimulating life. Mostly it is the young people who go to the cities, hoping to find work and better living conditions. But all too often jobs are not available in the cities either. These rural migrants usually settle in Figure 1.3 World population projections to 2050: three scenarios Source: United Nations Population Division, World Population Prospects: The 2008 Revision (2009). B ill io n s 12
  • 11. 10 0 2000 2005 2010 2015 2020 2025 2030 2035 2040 High 10.5 9.1 8.0 Medium Low 2045 2050 8 6 4 2 Population 7 slums on the edges of the big cities. At current rates the populations in these informal settlements will double every 10 to 15 years. It is hard to imagine a city like Calcutta getting any bigger. In 1950, when I visited it, it had a population of about 4 million, and thousands of these people lived permanently on the streets;
  • 12. in 1990 it had a population of about 13 million and an estimated 400,000 lived on the streets.2 If the present rate of growth continues, it will have a population of about 17 million by 2015. Table 1.2 gives the world’s ten largest cities in 1950 and 2000 and the Figure 1.4 Population by age and sex in developed and less developed countries 2010 (projected) Source: United Nations Population Division, World Population Prospects: The 2008 Revision (2009). 85+ 80–84 75–79 70–74 65–69 60–64 55–59 50–54 45–49 40–44 35–39 30–34 25–29 20–24 15–19 10–14 5–9 0–4 85+ 80–84
  • 13. 75–79 70–74 65–69 60–64 55–59 50–54 45–49 40–44 35–39 30–34 25–29 20–24 15–19 10–14 5–9 0–4 Males Population (millions), 2010 300 200 100 0 100 200 300 Age DEVELOPED COUNTRIES Females Males Population (millions), 2010 300 200 100 0 100 200 300 Age DEVELOPING COUNTRIES Females Table 1.2 Ten largest citiesa in the world, 1950, 2000, and 2015 (projection)
  • 14. Population in 1950 (millions) Population in 2000 (millions) Population in 2015 (projected) (millions) New York, US 12 Tokyo, Japan 26 Tokyo, Japan 27 London, UK 9 Mexico City, Mexico 18 Delhi, India 24 Tokyo, Japan 7 São Paolo, Brazil 18 Mumbai (Bombay), India 22 Paris, France 5 New York, US 17 Sao Paulo, Brazil 21 Moscow, USSR 5 Buenos Aires, 16 Mexico City, Mexico 20 Shanghai, China 5 Los Angeles, US 13 New York-Newark, US 20 Essen, Germany 5 Calcutta, India 13 Shanghai, China 18 Buenos Aires, Argentina 5 Shanghai, China 13 Calcutta, India 17 Chicago, US 5 Dhaka, Bangladesh 13 Dhaka, Bangladesh 17 Calcutta, India 4 Delhi, India 12 Karachi, Pakistan 15 a Formally called “urban agglomerations” in UN publications. Source: (for 2015 projections) UN Population Division, World Urbanization Prospects: The 2009 Revision Plate 1.2 Growing cities in less developed nations often have a mixture of modern and
  • 15. substandard housing (United Nations) Plate 1.1 Rural migrants often settle in urban slums in developing nations (United Nations) Population 9 The most innovative city in the world: Curitiba, Brazil Curitiba, Brazil, has been called the most innovative city in the world. City officials from around the world visit Curitiba to learn how this city, with rela- tively limited funds, has been tackling urban problems. By using imaginative, low-cost solutions and low technology, Curitiba has created a pleasant urban life that many cities in the more developed nations have yet to achieve. Here is how the city achieved this. Transportation The city has made public transportation attractive, afford- able, and efficient. Instead of building a subway, which the city could not afford, it established a system of extended, high-speed buses, some carrying as many as 275 passengers, on express routes, connecting the city center with outlying areas. Many people own cars in Curitiba but 85 percent of the commuters use public transportation. This has reduced traffic congestion and air pollution. There are 30 percent fewer cars on city streets than you would
  • 16. expect from the number of cars owned by its residents. Trash collection Poor people are encouraged to collect recyclable trash in the areas where they live and turn it in for food. In 1995 the city gave out about 350,000 Easter eggs, 25,000 Christmas cakes, and 2 million pounds of food in exchange for trash. About 70 percent of its trash is recycled, one of the highest rates in the world. Education Small libraries have been built throughout the city in the shape of a lighthouse. Called Lighthouses of Learning, they provide books (many schools in Brazil have no books), an attractive study room, and, in a tower, a strong light and guard to make the area safe. Health Curitiba has more health clinics – that are open 24 hours a day – per person than any other city in Brazil. Environmental education The Free University for the Environment was built out of recycled old utility poles next to a lake made from an old quarry. Short courses on how to make better use of the environment have been designed for contractors, merchants, and housewives. Taxi drivers are required to take a course there in order to get their licenses. (Continued)
  • 17. projected ten largest for the year 2015.3 Note that eight of the ten largest cities in the year 2015 are expected to be in the less developed countries – Tokyo and New York are the exceptions – whereas in 1950 only three of the ten were in the poorer countries (Shanghai, Buenos Aires, and Calcutta). Note also the increased size of the cities. Cities with over 5 million people are sometimes called “megacities.” In 1950 Buenos Aires and Shanghai were the only cities in the developing world with at least 5 million people. By 2005 there were about 60 megacities in the world with the majority of them being in the less devel- oped nations. Many of these cities had vast areas of substandard housing and serious urban pollution, and many of their residents lived without sanitation facilities, safe drinking water, or adequate healthcare facilities. Chapter 1 Population Prudent men should judge of future events by what has taken place in the past, and what is taking place in the present. Miguel de Cervantes (1547–1616), Persiles and Sigismunda
  • 18. The Changing Population of the World The population of the world is growing. No one will be startled by that sentence, but what is startling is the rate of growth, and the fact that the present growth of population is unprecedented in human history. The best historical evidence we have today indicates that there were about 5 million people in the world about 8000 bc. By ad 1 there were about 200 million, and by 1650 the population had grown to about 500 million. The world reached its first billion people about 1800; the second billion came about 1930. The third billion was reached about 1960, the fourth about 1974, and the fifth about 1987. The sixth came in 1999 and the seventh in 2011. These figures indicate how rapidly the population is increasing. Table 1.1 shows how long it took the world to add each billion of its total population. A projection is also given for the next billion. There is another way to look at population growth, one that helps us understand the uniqueness of our situation and its staggering possibilities for harm to life on this planet. Because most people born can have children of their own, the human popula- tion can – until certain limits are reached – grow exponentially: 1 to 2; 2 to 4; 4 to 8; 8 to 16; 16 to 32; 32 to 64; 64 to 128; and so on. When something grows expo- nentially, there is hardly discernible growth in the early stages and then the numbers
  • 19. shoot up. The French have a riddle they use to help teach the nature of exponential growth to children. It goes like this: if you have a pond with one lily in it that doubles its size every day, and which will completely cover the pond in 30 days, on what day will the lily cover half the pond? The answer is the twenty-ninth day. What this riddle Global Issues: An Introduction, Fourth Edition. John L. Seitz, Kristen A. Hite. © 2012 John Wiley & Sons, Ltd. Published 2012 by John Wiley & Sons, Ltd. 4 Global Issues tells you is that if you wait until the lily covers half the pond before cutting it back, you will have only one day to do this – the twenty-ninth day – because it will cover the whole pond the next day. If you plot on a graph anything that has an exponential growth, you get a J-curve. For a long time there is not much growth but when the bend of the curve in the “J” is reached, the growth becomes dramatic. Figure 1.1 shows what the earth’s population growth curve looks like. The growth of the earth’s population has been compared to a long fuse on a bomb: once the fuse is lit, it sputters along for a long while and then suddenly the
  • 20. bomb explodes. This is what is meant by the phrases “population explosion” and “population bomb.” The analogy is not a bad one. The world’s population has passed Table 1.1 Time taken to add each billion to the world population, 1800–2046 (projection) Date Estimated world population (billions) Years to add 1 billion people 1800 1 2,000,000 1930 2 130 1960 3 30 1974 4 14 1987 5 13 1999 6 12 2011 7 12 2024 (projected) 8 13 2046 (projected) 9 22 Source: UN World Population Prospects: The 2008 Revision Figure 1.1 Population growth from 8000 BC to 2011 AD 6 7 5 4
  • 23. 0 Population 5 the bend of the J-curve and is now rapidly expanding. The United Nations estimates the world’s population reached 7 billion in 2011, shooting up from the estimated 2 billion in 1930. Figure 1.2 shows that the largest growth in the future will be in the less developed countries of the world, with India, Africa, and China leading the way. At the end of the twentieth century about 80 percent of the people in the world lived in the devel- oping countries. During the present century, nearly all of the growth in population will occur in the less developed countries. An ever-larger percentage of the world’s population will be relatively poor. In 1950 about two-thirds of the world’s people lived in the less developed countries. By 2000 this percentage had increased to about 80 percent and the United Nations projects that by 2050 about 85 percent of the earth’s population will be residing in the poorer nations. Because no one knows for sure what the size of the earth’s population will be in the future, the United Nations gives three projections: a high, medium, and low one, based on the possible number of children the average woman
  • 24. will have. Projections are educated guesses. The United Nations believes the middle projection is the most likely and most authors writing on the subject use that number. The population in the developed regions is expected to slowly grow to 1.3 billion in 2050 from 1.2 billion in 2008, with most of that growth in the United States and Canada due to immigration from less developed countries. The less developed countries are expected to increase from 5.5 billion in 2008 to 8.1 billion in 2050.1 From 2010 to 2050 about one-half of the annual growth is expected to occur in nine countries – India, Pakistan, Nigeria, Ethiopia, the United States, the Democratic Republic of the Congo, Tanzania, China, and Bangladesh. (These countries are listed according to Figure 1.2 Population growth in less developed and more developed countries, 1950–2050 (projected) Source: United Nations Population Division, World Population Prospects: The 2006 Revision, Medium Variant (2007). 10 9 8 7 6
  • 25. 5 4 3 2 1 0 1950 1970 1990 2010 2030 (projected) Other less developed countries Africa China India Population (billions) 2050 (projected) More developed countries 6 Global Issues the size of their contribution to world population growth.) The
  • 26. largest growth is expected in India, which is likely to pass China by 2028 to be the largest country in the world, with 1.5 billion people. At that time India and China will account for about one-third of the world’s population. Figure 1.3 gives the three growth projec- tions by the United Nations up to 2050. High growth rates will take place in the less developed countries because a large percentage of their population consists of children under the age of 15 who will be growing older and having children themselves. If we plot the number of people in a country according to their ages, we can see clearly the difference between rapidly growing populations, which most less developed nations have, and relatively stable or slowly growing populations, which the more developed nations have. Figure 1.4 shows the difference between the populations of the more developed countries and less developed countries. The age structure of the more developed countries is gener- ally column shaped, while the age structure of the less developed countries is usually pyramid shaped. Another major change occurring in the world’s population is the movement of people from rural areas to urban areas. Although this is happening throughout the world, the trend is especially dramatic in the developing world, where people are fleeing rural areas to escape the extreme poverty that is
  • 27. common in those areas, and because the cities seem to offer a more stimulating life. Mostly it is the young people who go to the cities, hoping to find work and better living conditions. But all too often jobs are not available in the cities either. These rural migrants usually settle in Figure 1.3 World population projections to 2050: three scenarios Source: United Nations Population Division, World Population Prospects: The 2008 Revision (2009). B ill io n s 12 10 0 2000 2005 2010 2015 2020 2025 2030 2035 2040 High 10.5 9.1 8.0 Medium Low
  • 28. 2045 2050 8 6 4 2 Population 7 slums on the edges of the big cities. At current rates the populations in these informal settlements will double every 10 to 15 years. It is hard to imagine a city like Calcutta getting any bigger. In 1950, when I visited it, it had a population of about 4 million, and thousands of these people lived permanently on the streets; in 1990 it had a population of about 13 million and an estimated 400,000 lived on the streets.2 If the present rate of growth continues, it will have a population of about 17 million by 2015. Table 1.2 gives the world’s ten largest cities in 1950 and 2000 and the Figure 1.4 Population by age and sex in developed and less developed countries 2010 (projected) Source: United Nations Population Division, World Population Prospects: The 2008 Revision (2009).
  • 30. 5–9 0–4 Males Population (millions), 2010 300 200 100 0 100 200 300 Age DEVELOPED COUNTRIES Females Males Population (millions), 2010 300 200 100 0 100 200 300 Age DEVELOPING COUNTRIES Females Table 1.2 Ten largest citiesa in the world, 1950, 2000, and 2015 (projection) Population in 1950 (millions) Population in 2000 (millions) Population in 2015 (projected) (millions) New York, US 12 Tokyo, Japan 26 Tokyo, Japan 27 London, UK 9 Mexico City, Mexico 18 Delhi, India 24 Tokyo, Japan 7 São Paolo, Brazil 18 Mumbai (Bombay),
  • 31. India 22 Paris, France 5 New York, US 17 Sao Paulo, Brazil 21 Moscow, USSR 5 Buenos Aires, 16 Mexico City, Mexico 20 Shanghai, China 5 Los Angeles, US 13 New York-Newark, US 20 Essen, Germany 5 Calcutta, India 13 Shanghai, China 18 Buenos Aires, Argentina 5 Shanghai, China 13 Calcutta, India 17 Chicago, US 5 Dhaka, Bangladesh 13 Dhaka, Bangladesh 17 Calcutta, India 4 Delhi, India 12 Karachi, Pakistan 15 a Formally called “urban agglomerations” in UN publications. Source: (for 2015 projections) UN Population Division, World Urbanization Prospects: The 2009 Revision Plate 1.2 Growing cities in less developed nations often have a mixture of modern and substandard housing (United Nations) Plate 1.1 Rural migrants often settle in urban slums in developing nations (United Nations) Population 9 The most innovative city in the world: Curitiba, Brazil Curitiba, Brazil, has been called the most innovative city in the world. City officials from around the world visit Curitiba to learn how this
  • 32. city, with rela- tively limited funds, has been tackling urban problems. By using imaginative, low-cost solutions and low technology, Curitiba has created a pleasant urban life that many cities in the more developed nations have yet to achieve. Here is how the city achieved this. Transportation The city has made public transportation attractive, afford- able, and efficient. Instead of building a subway, which the city could not afford, it established a system of extended, high-speed buses, some carrying as many as 275 passengers, on express routes, connecting the city center with outlying areas. Many people own cars in Curitiba but 85 percent of the commuters use public transportation. This has reduced traffic congestion and air pollution. There are 30 percent fewer cars on city streets than you would expect from the number of cars owned by its residents. Trash collection Poor people are encouraged to collect recyclable trash in the areas where they live and turn it in for food. In 1995 the city gave out about 350,000 Easter eggs, 25,000 Christmas cakes, and 2 million pounds of food in exchange for trash. About 70 percent of its trash is recycled, one of the highest rates in the world. Education Small libraries have been built throughout the city in
  • 33. the shape of a lighthouse. Called Lighthouses of Learning, they provide books (many schools in Brazil have no books), an attractive study room, and, in a tower, a strong light and guard to make the area safe. Health Curitiba has more health clinics – that are open 24 hours a day – per person than any other city in Brazil. Environmental education The Free University for the Environment was built out of recycled old utility poles next to a lake made from an old quarry. Short courses on how to make better use of the environment have been designed for contractors, merchants, and housewives. Taxi drivers are required to take a course there in order to get their licenses. (Continued) projected ten largest for the year 2015.3 Note that eight of the ten largest cities in the year 2015 are expected to be in the less developed countri es – Tokyo and New York are the exceptions – whereas in 1950 only three of the ten were in the poorer countries (Shanghai, Buenos Aires, and Calcutta). Note also the increased size of the cities. Cities with over 5 million people are sometimes called “megacities.” In 1950 Buenos Aires and Shanghai were the only cities in the developing world with at least 5 million people. By
  • 34. 2005 there were about 60 megacities in the world with the majority of them being in the less devel- oped nations. Many of these cities had vast areas of substandard housing and serious urban pollution, and many of their residents lived without sanitation facilities, safe drinking water, or adequate healthcare facilities.