The document discusses the cell cycle and cell division. It makes the following key points:
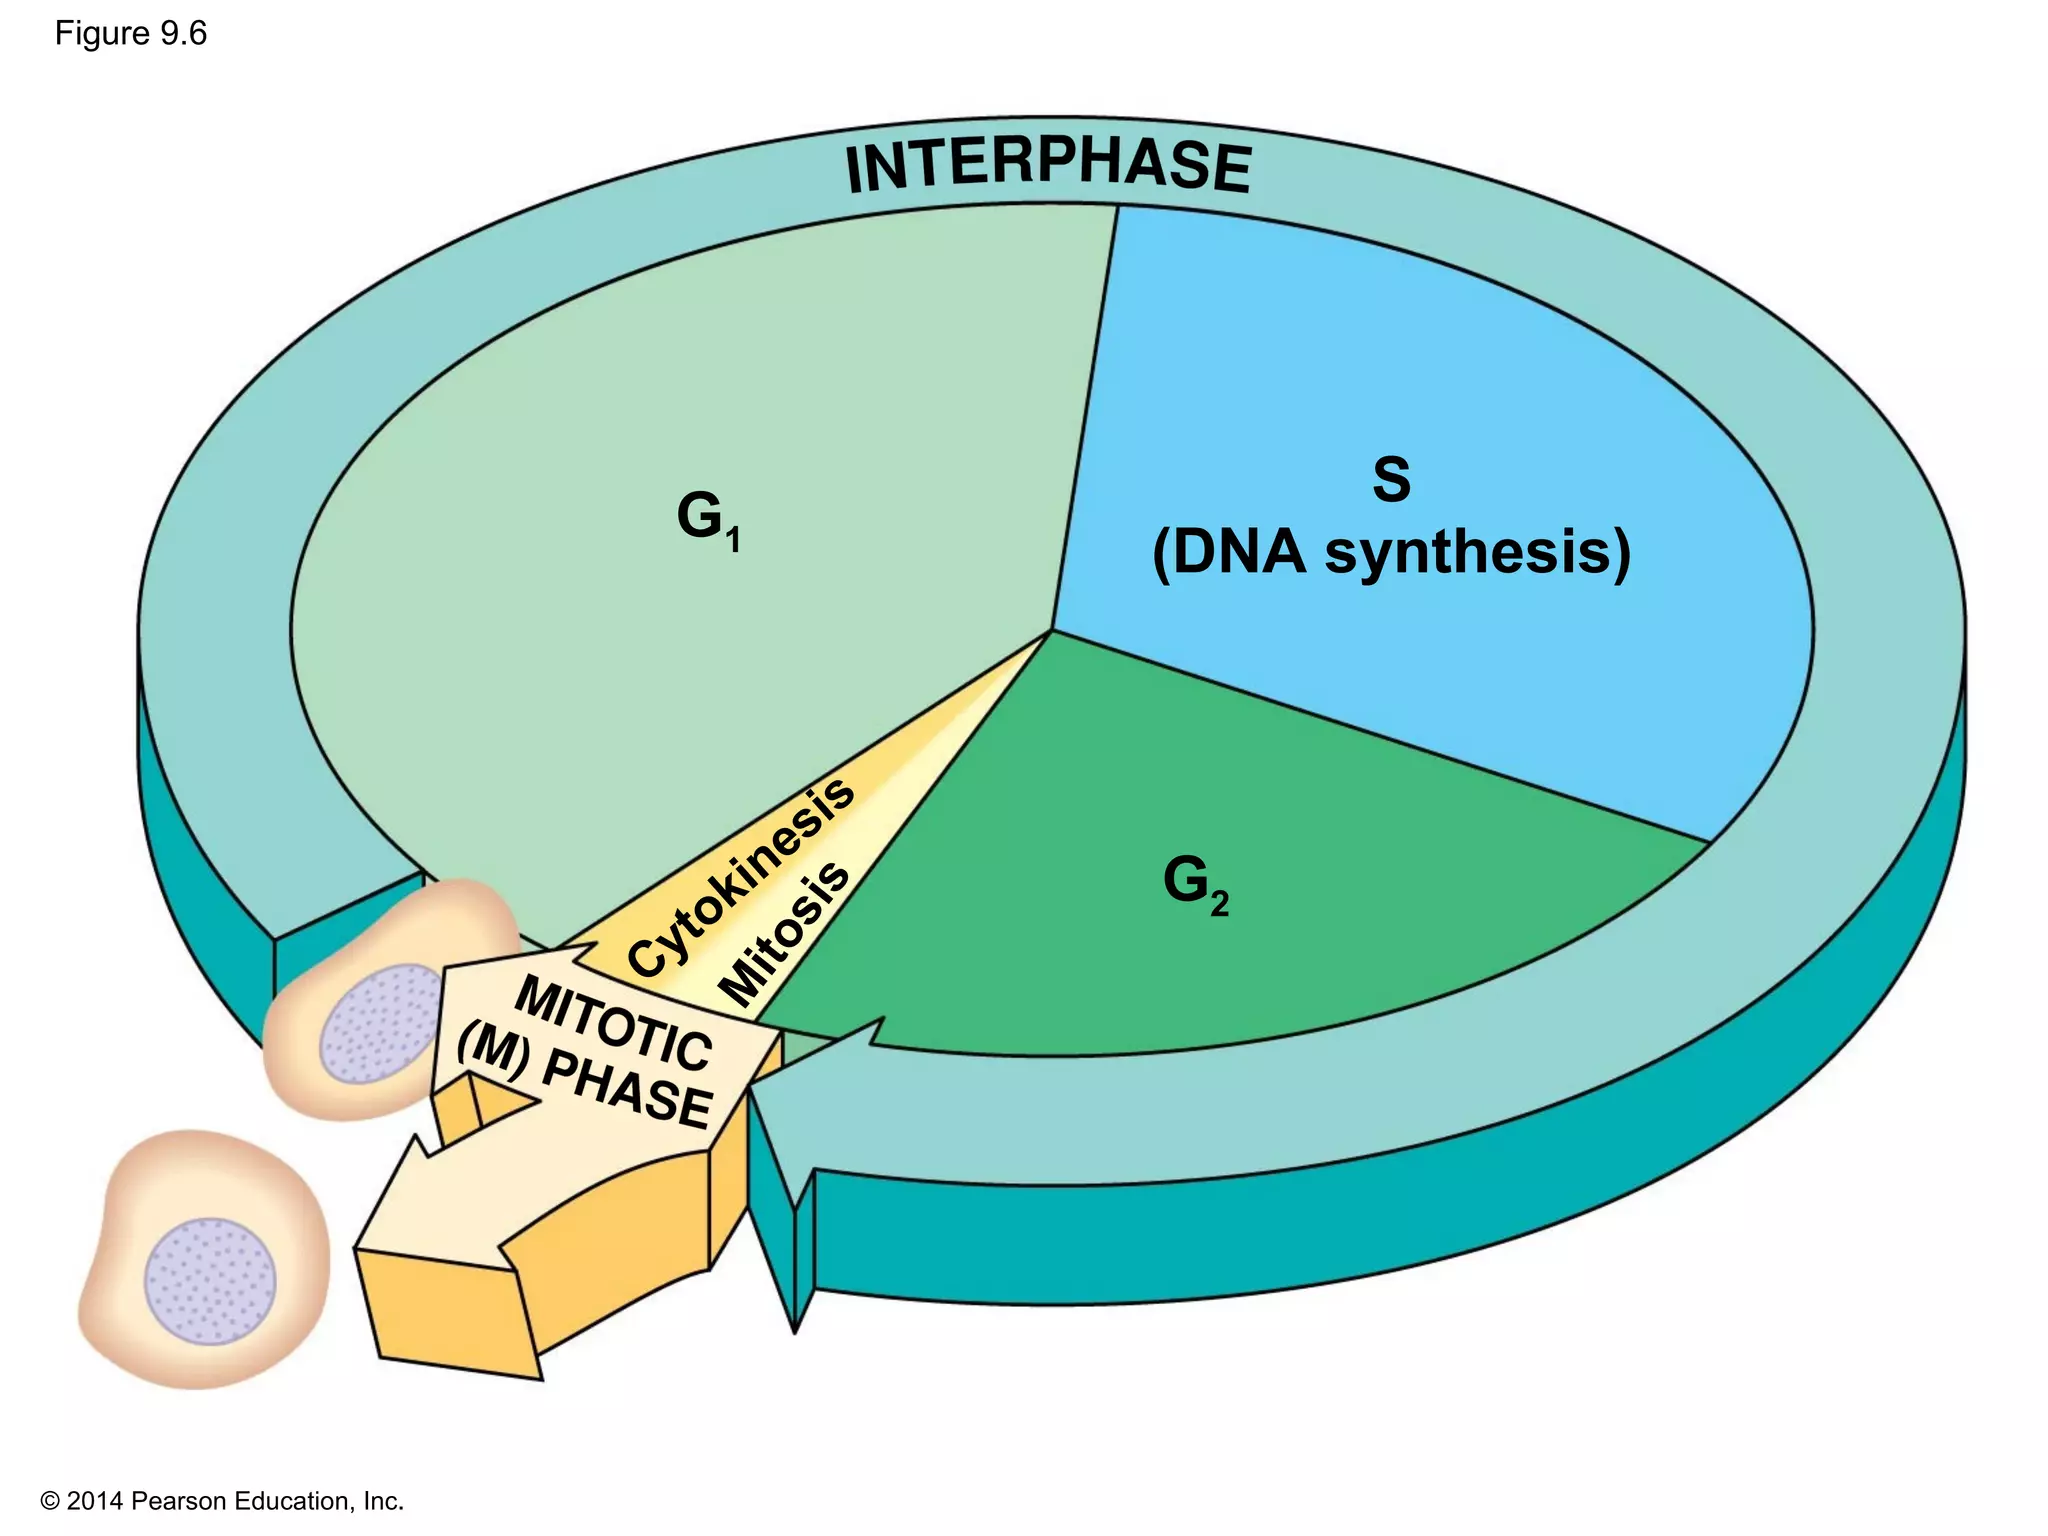
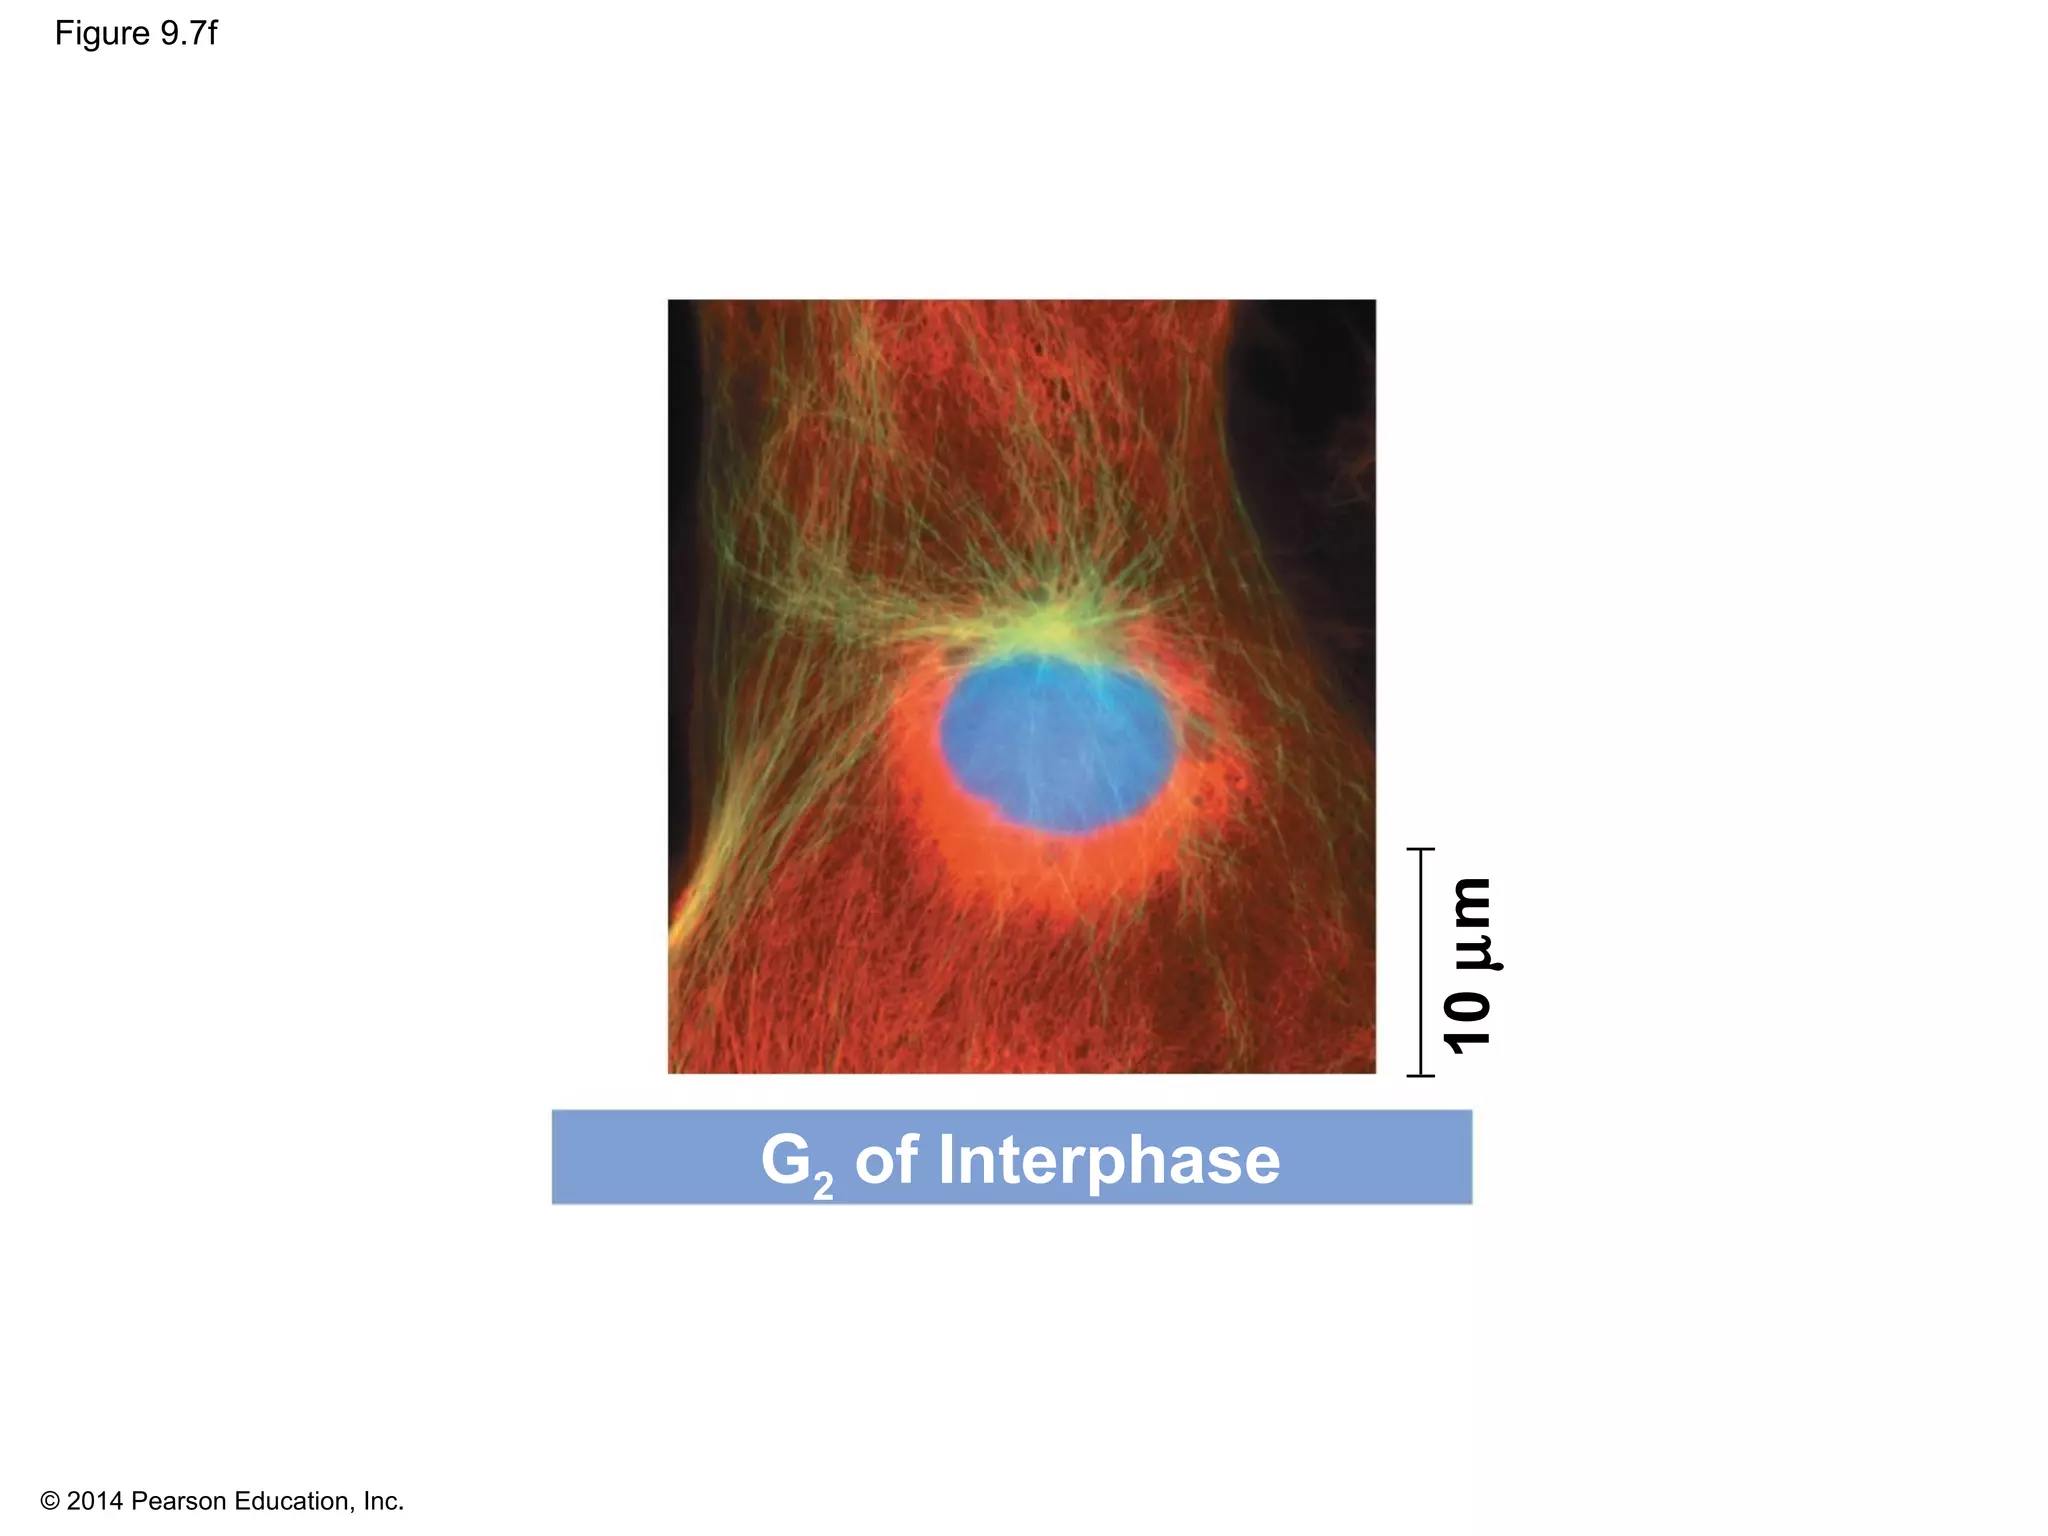
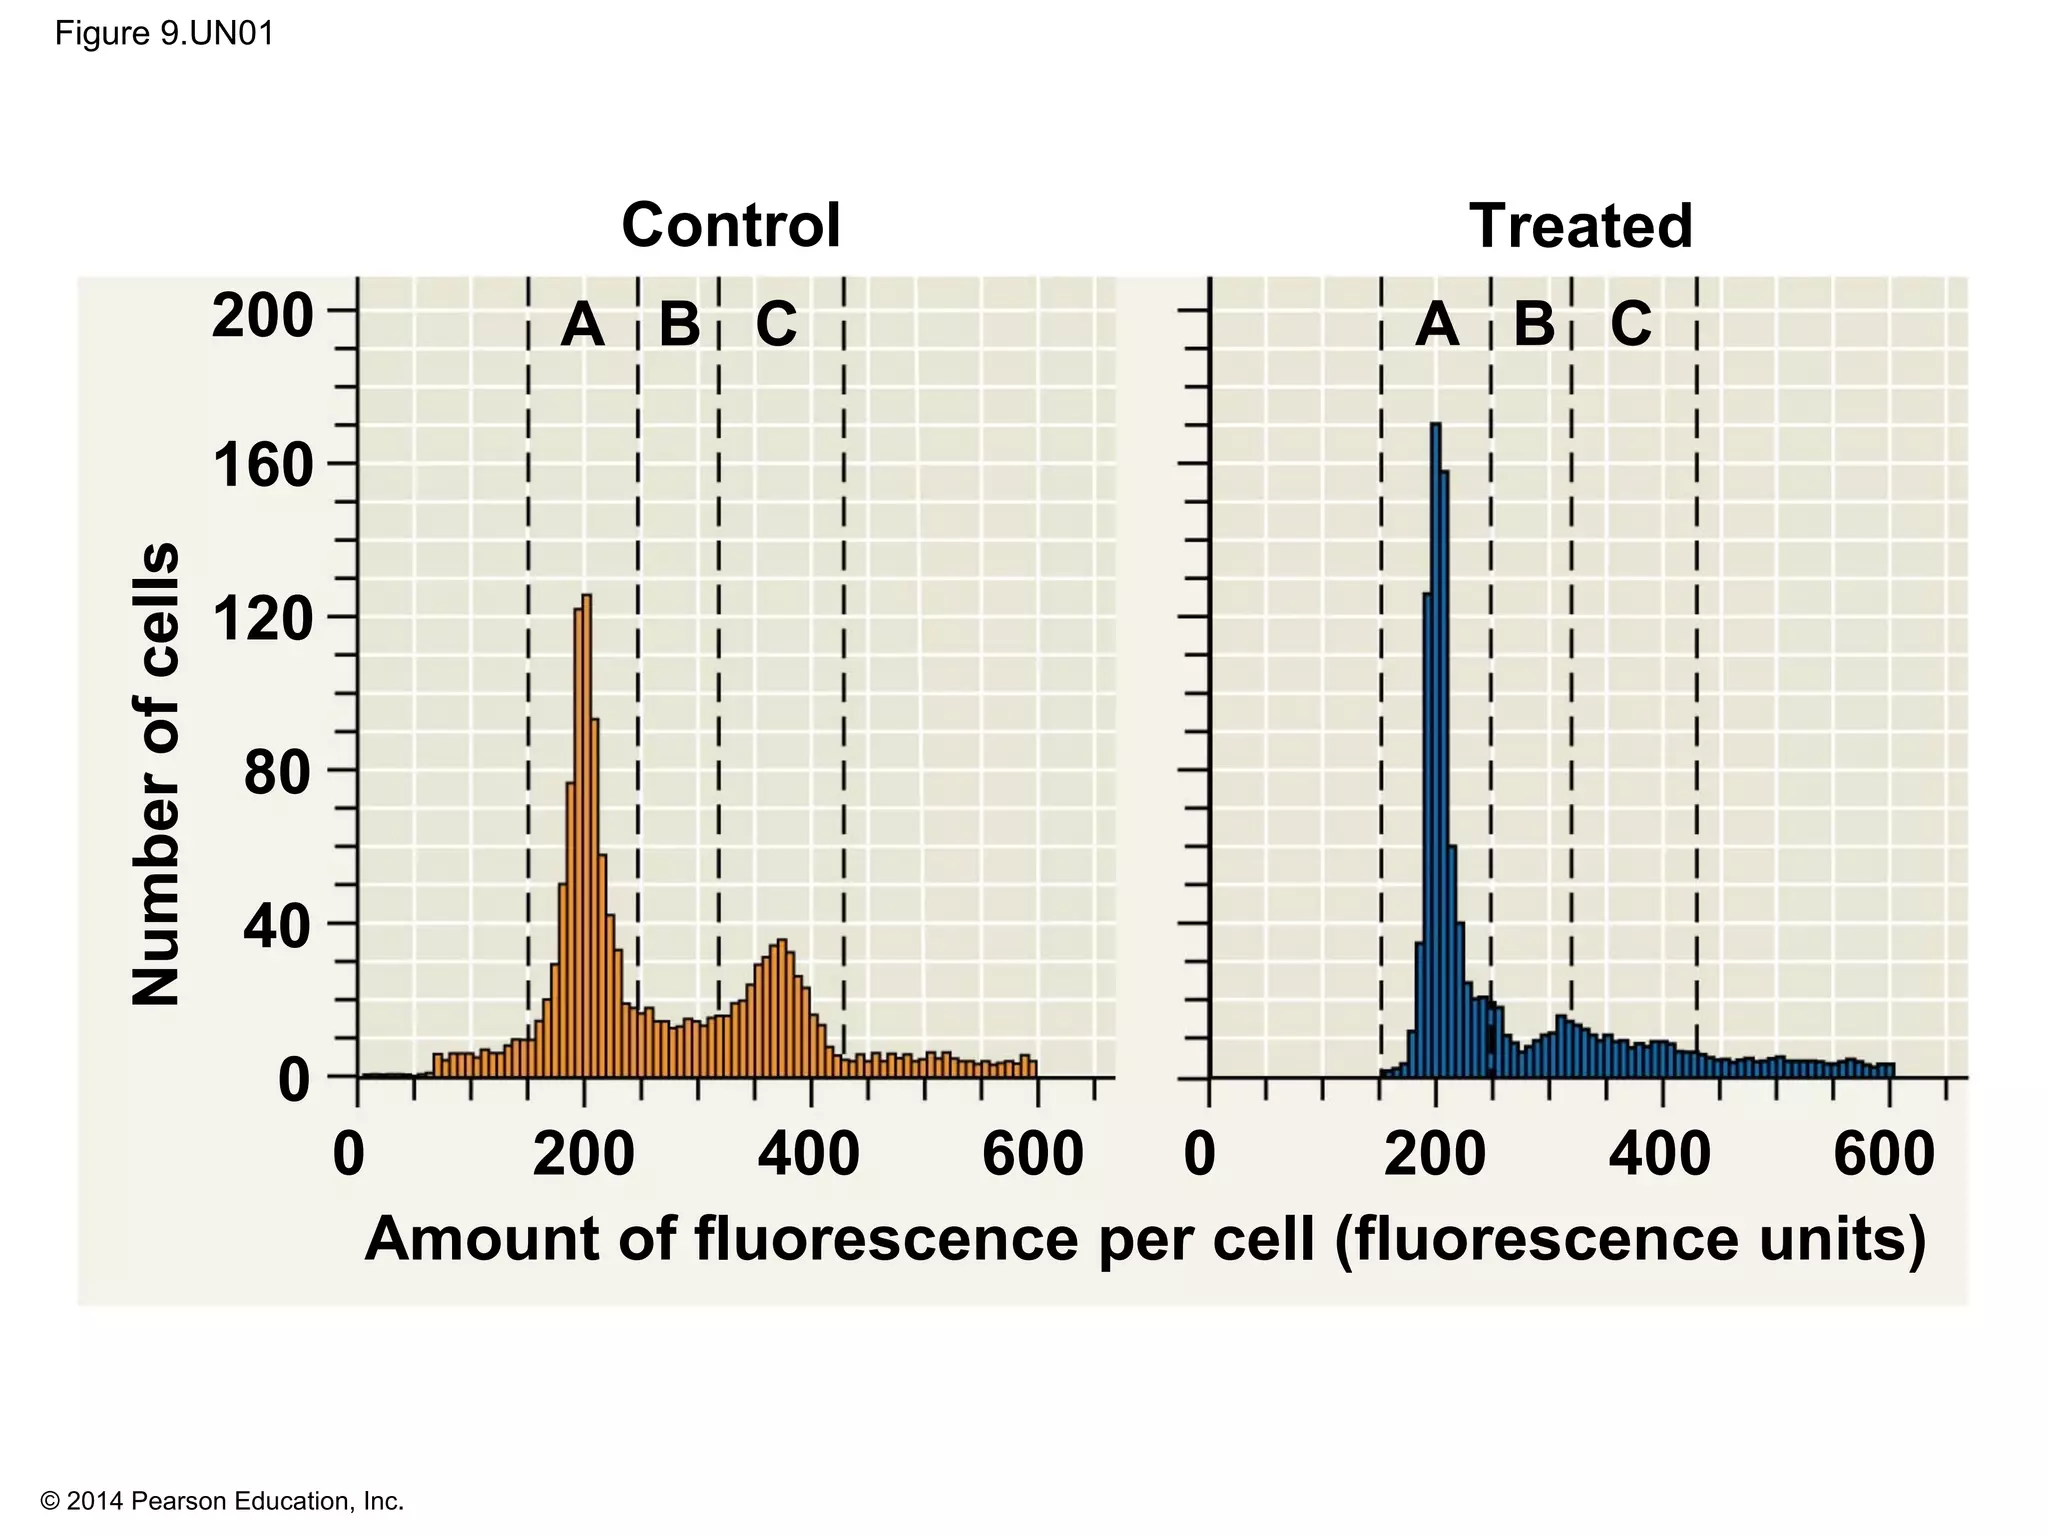
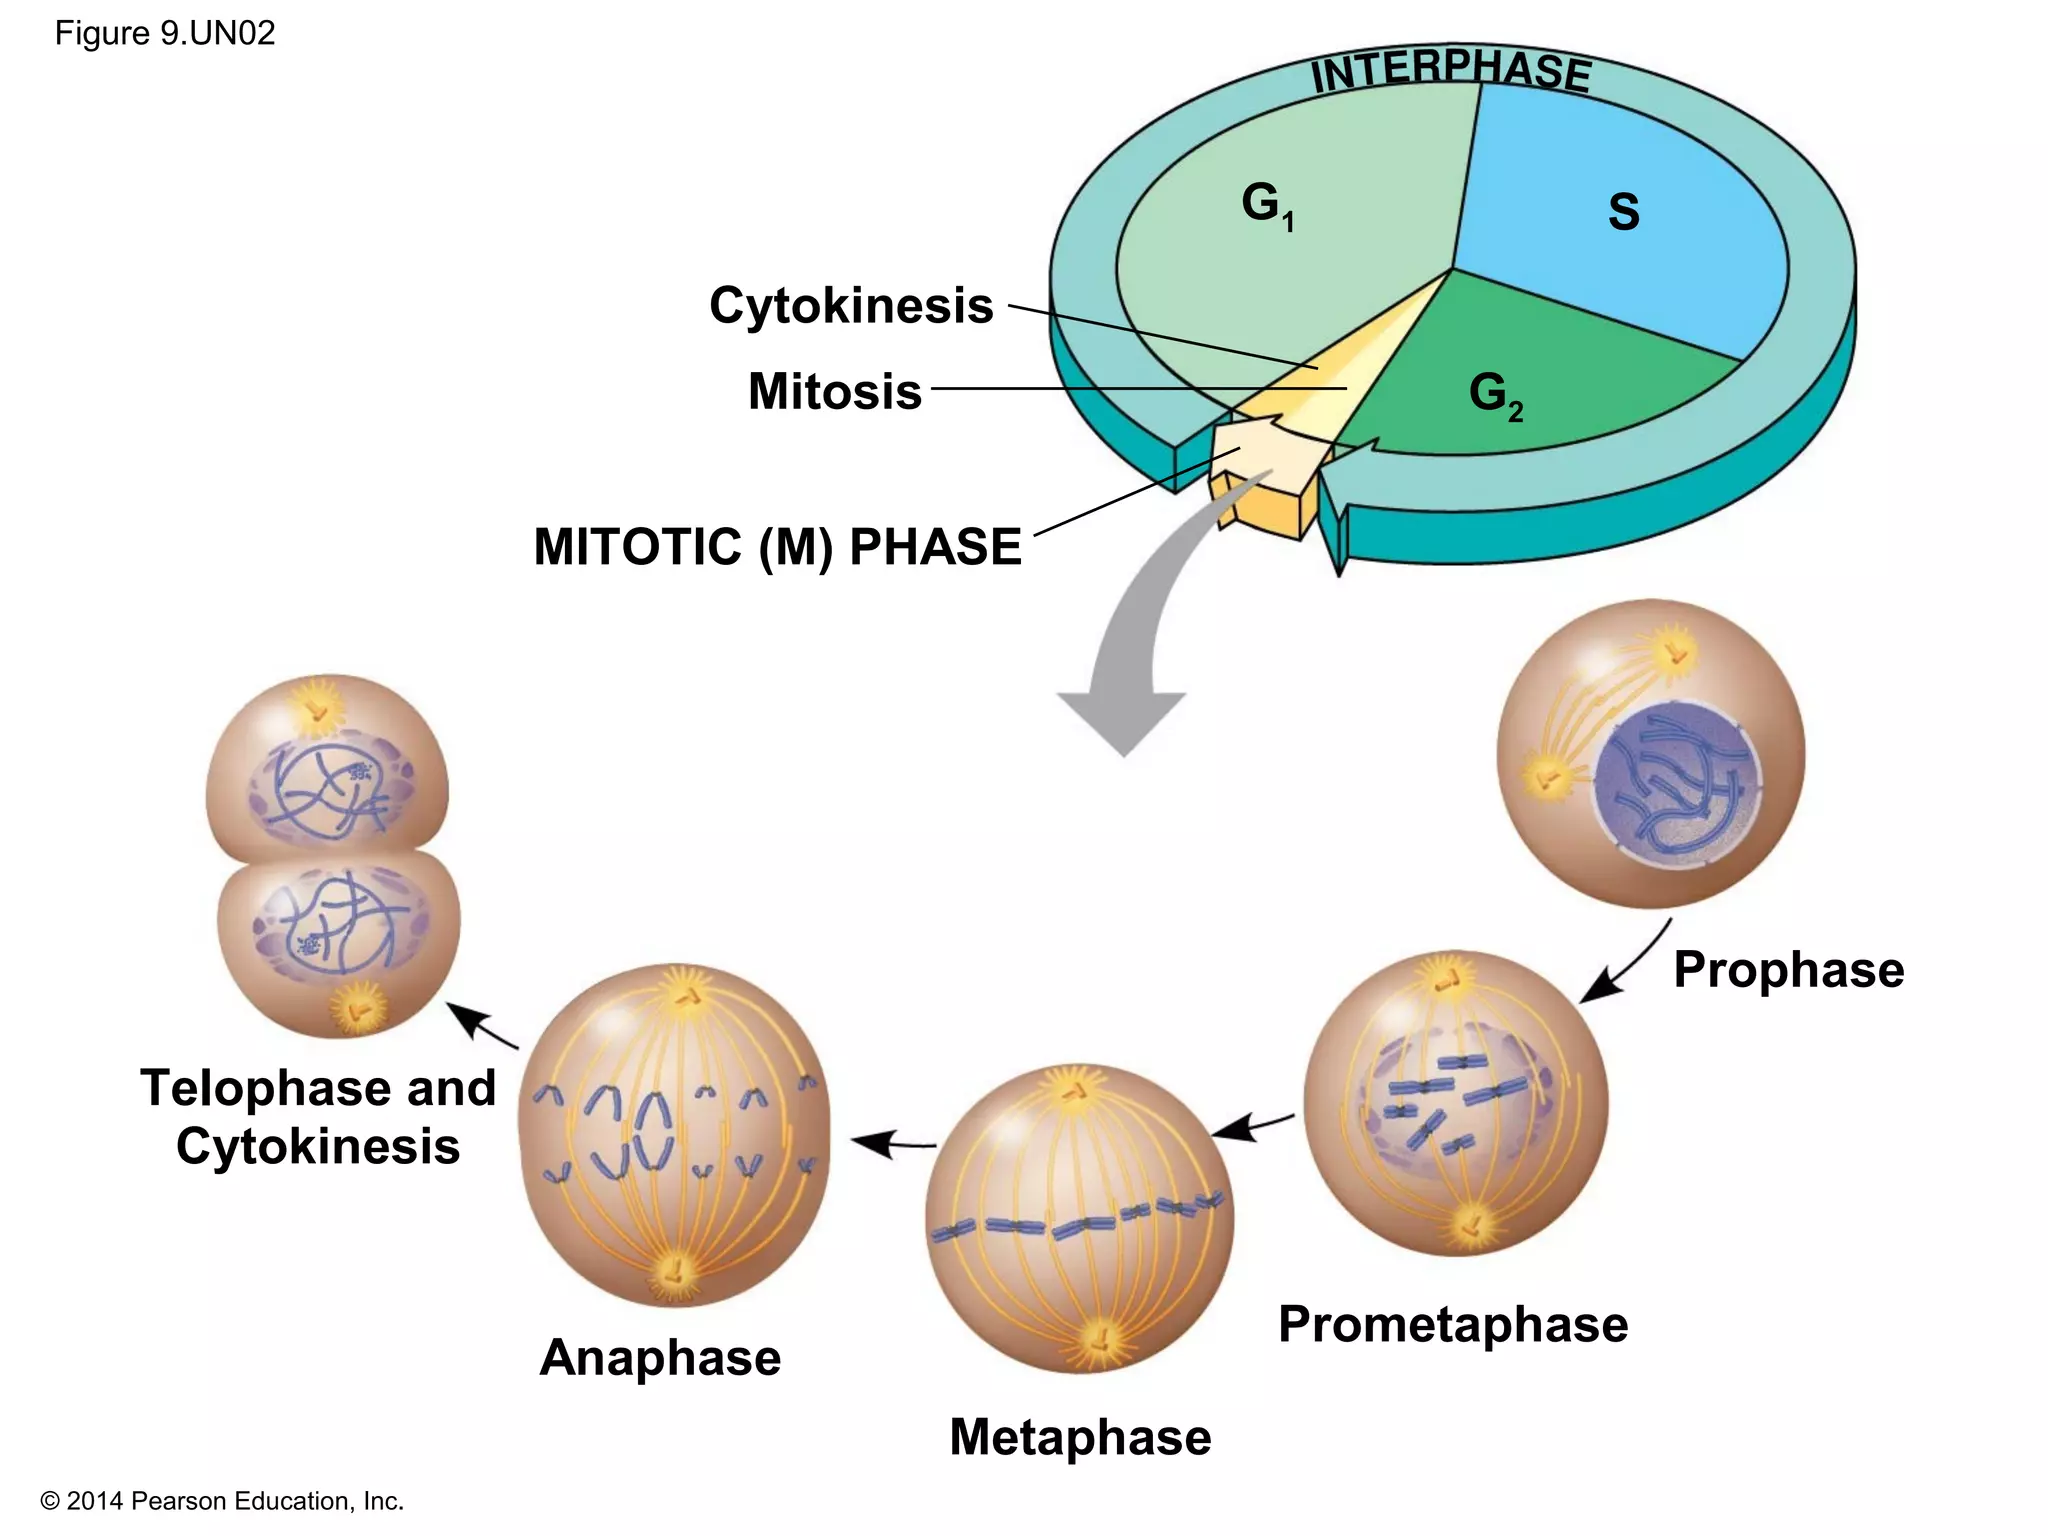
1) The cell cycle consists of interphase and the mitotic (M) phase. Interphase includes cell growth and DNA replication, while mitosis involves the equal division of genetic material into two daughter cells.
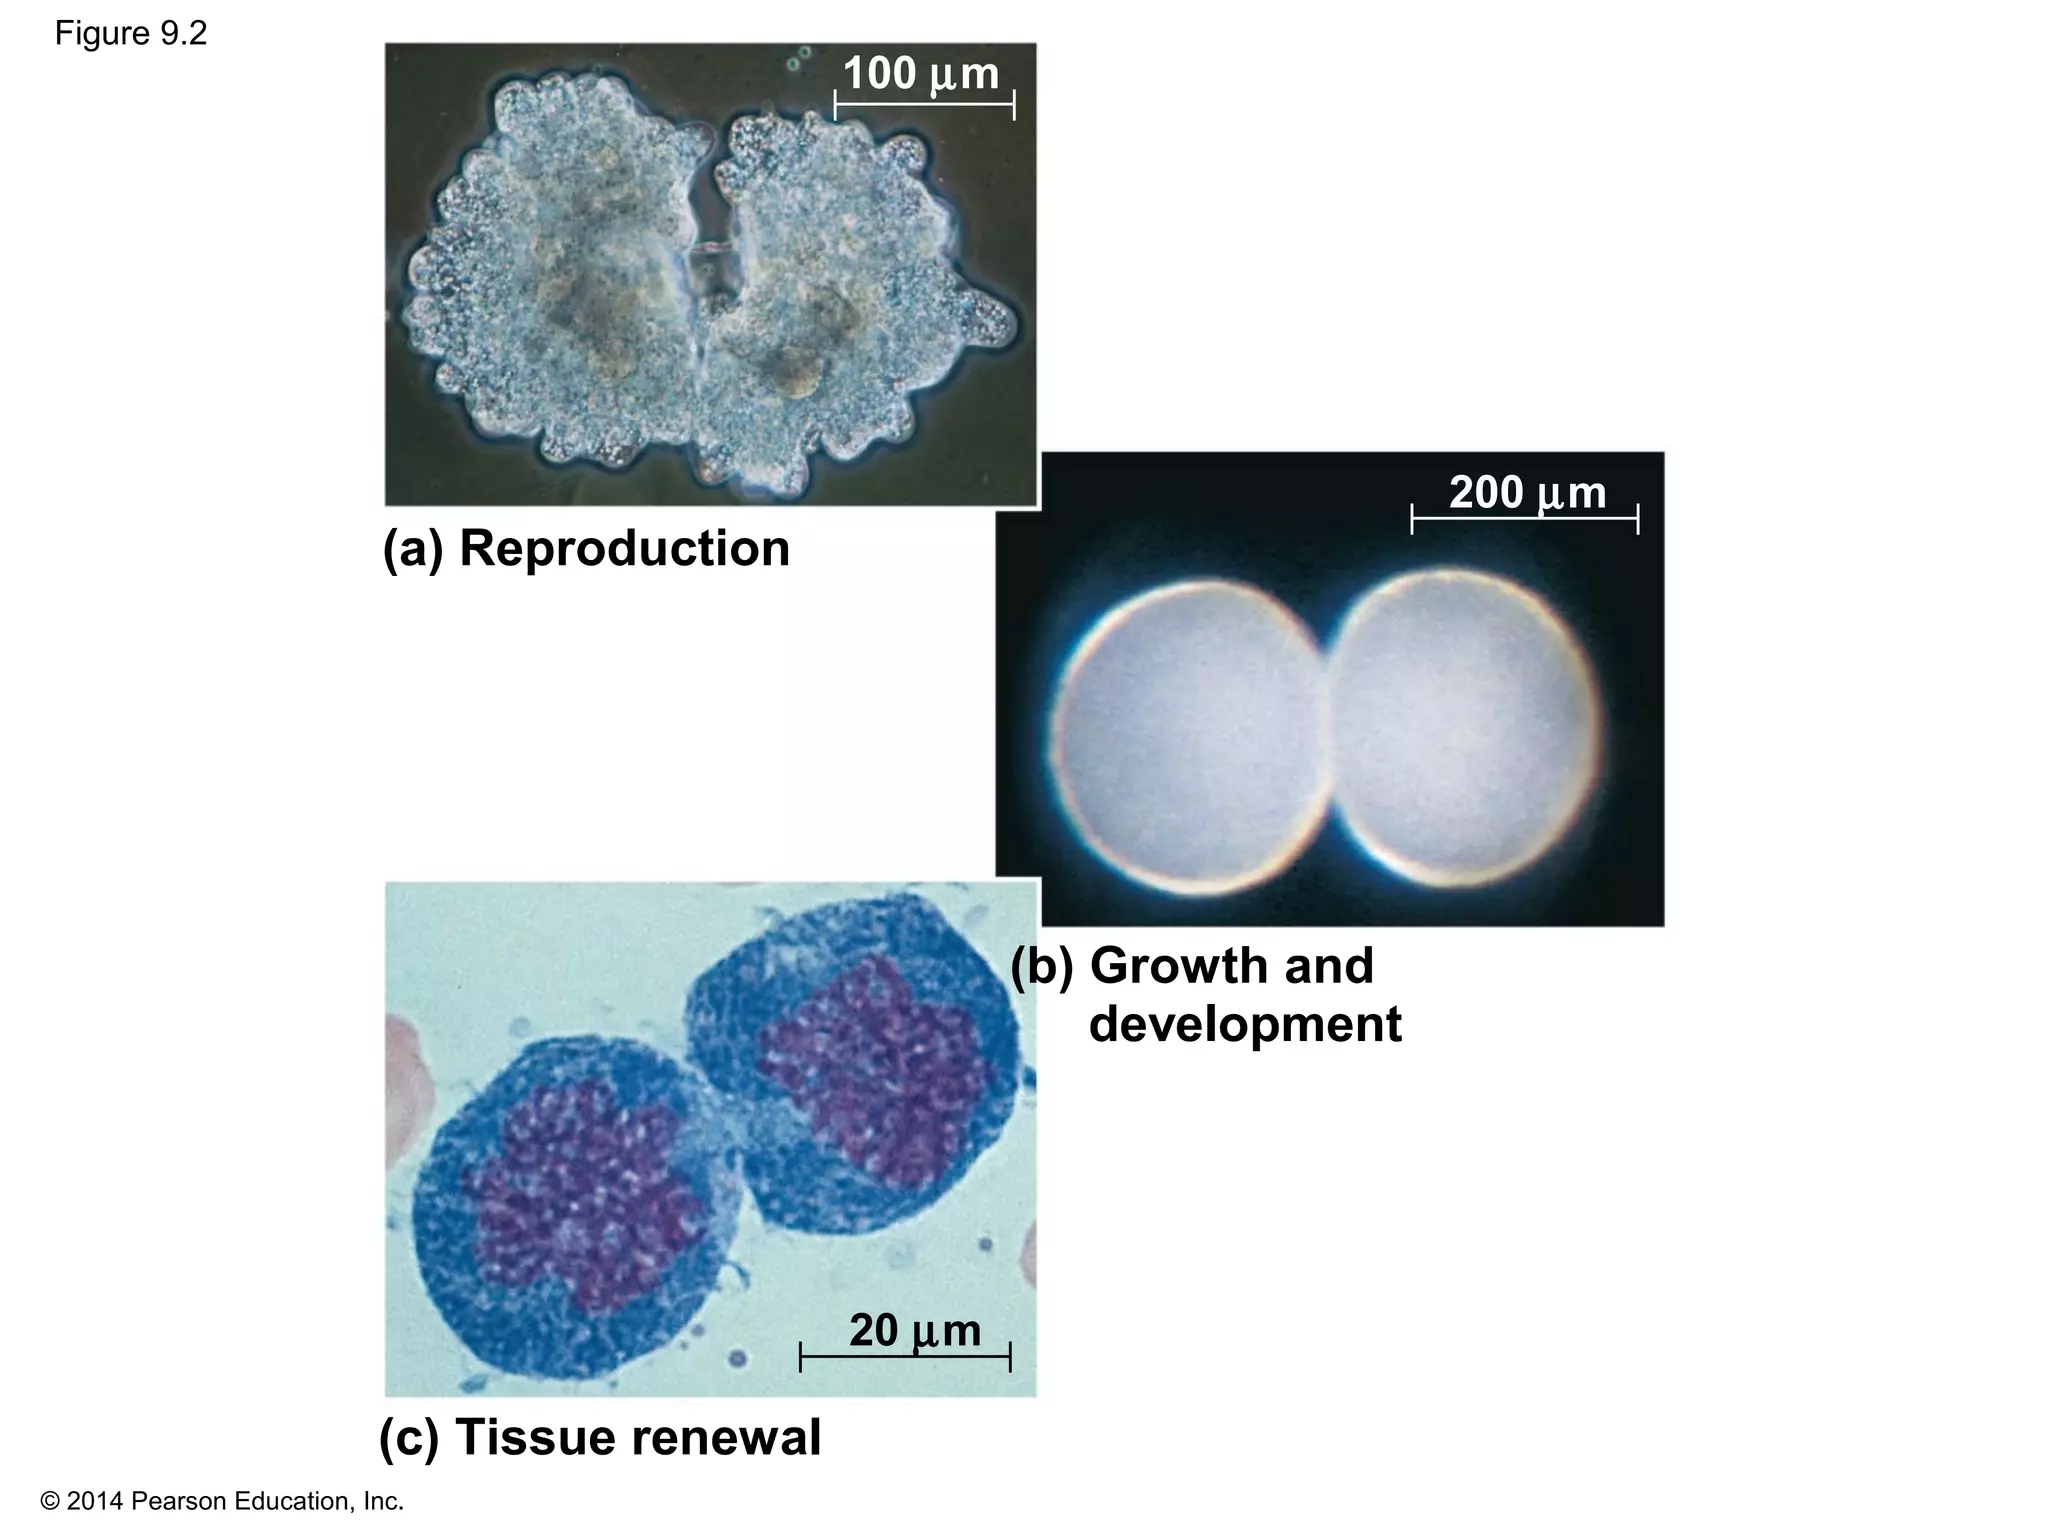
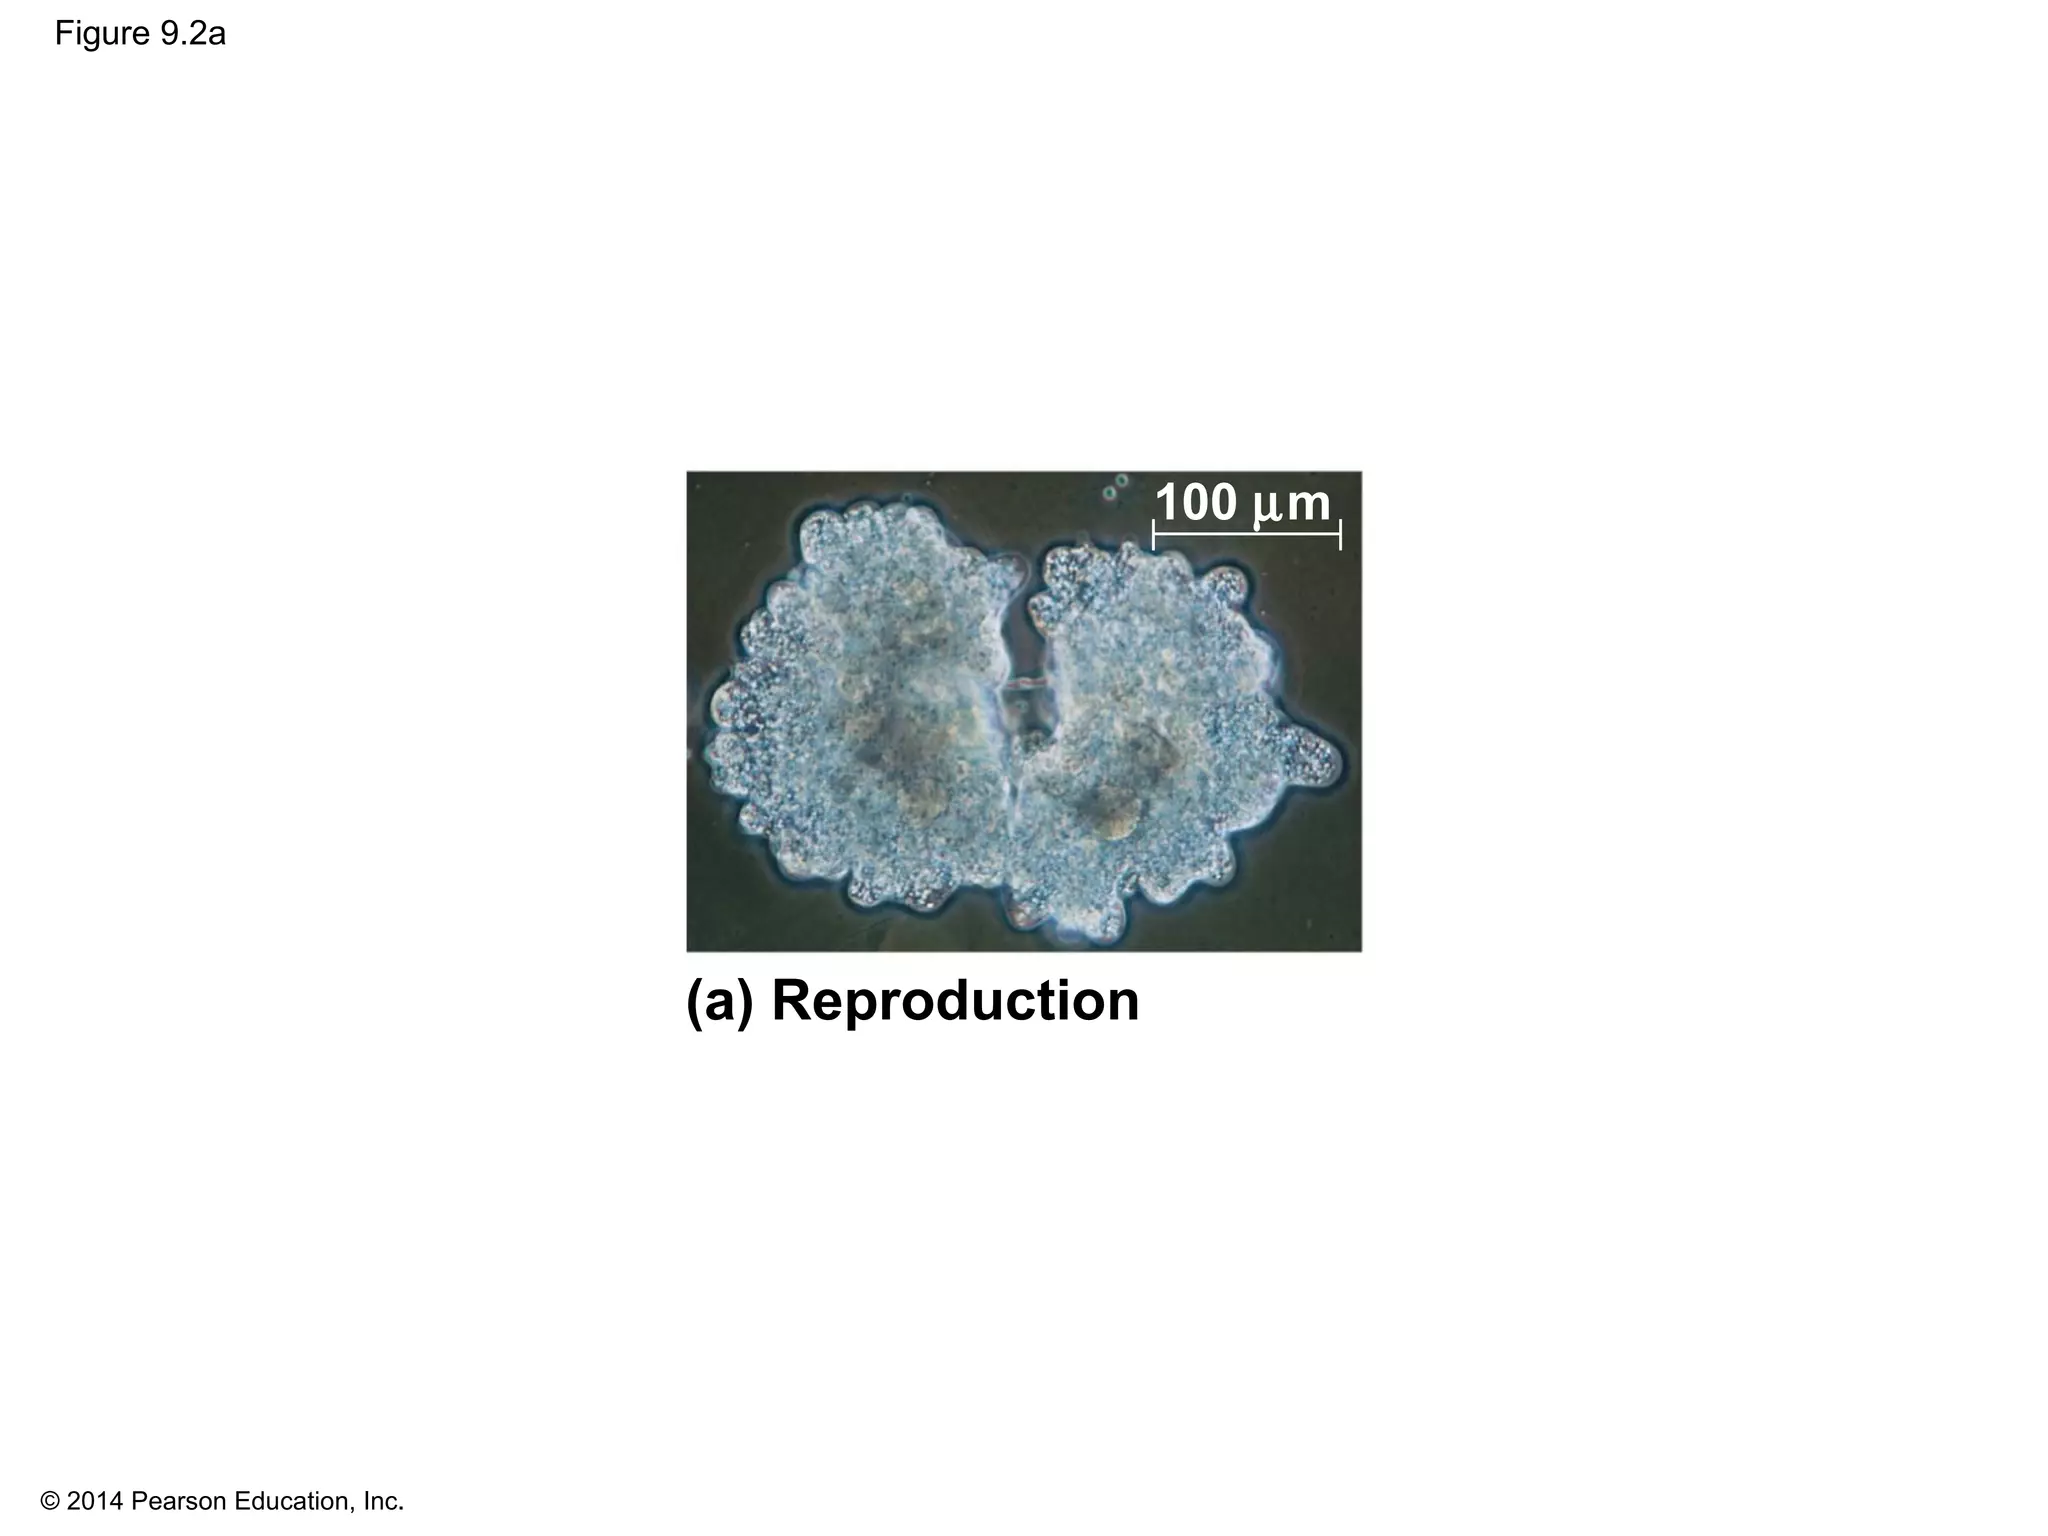
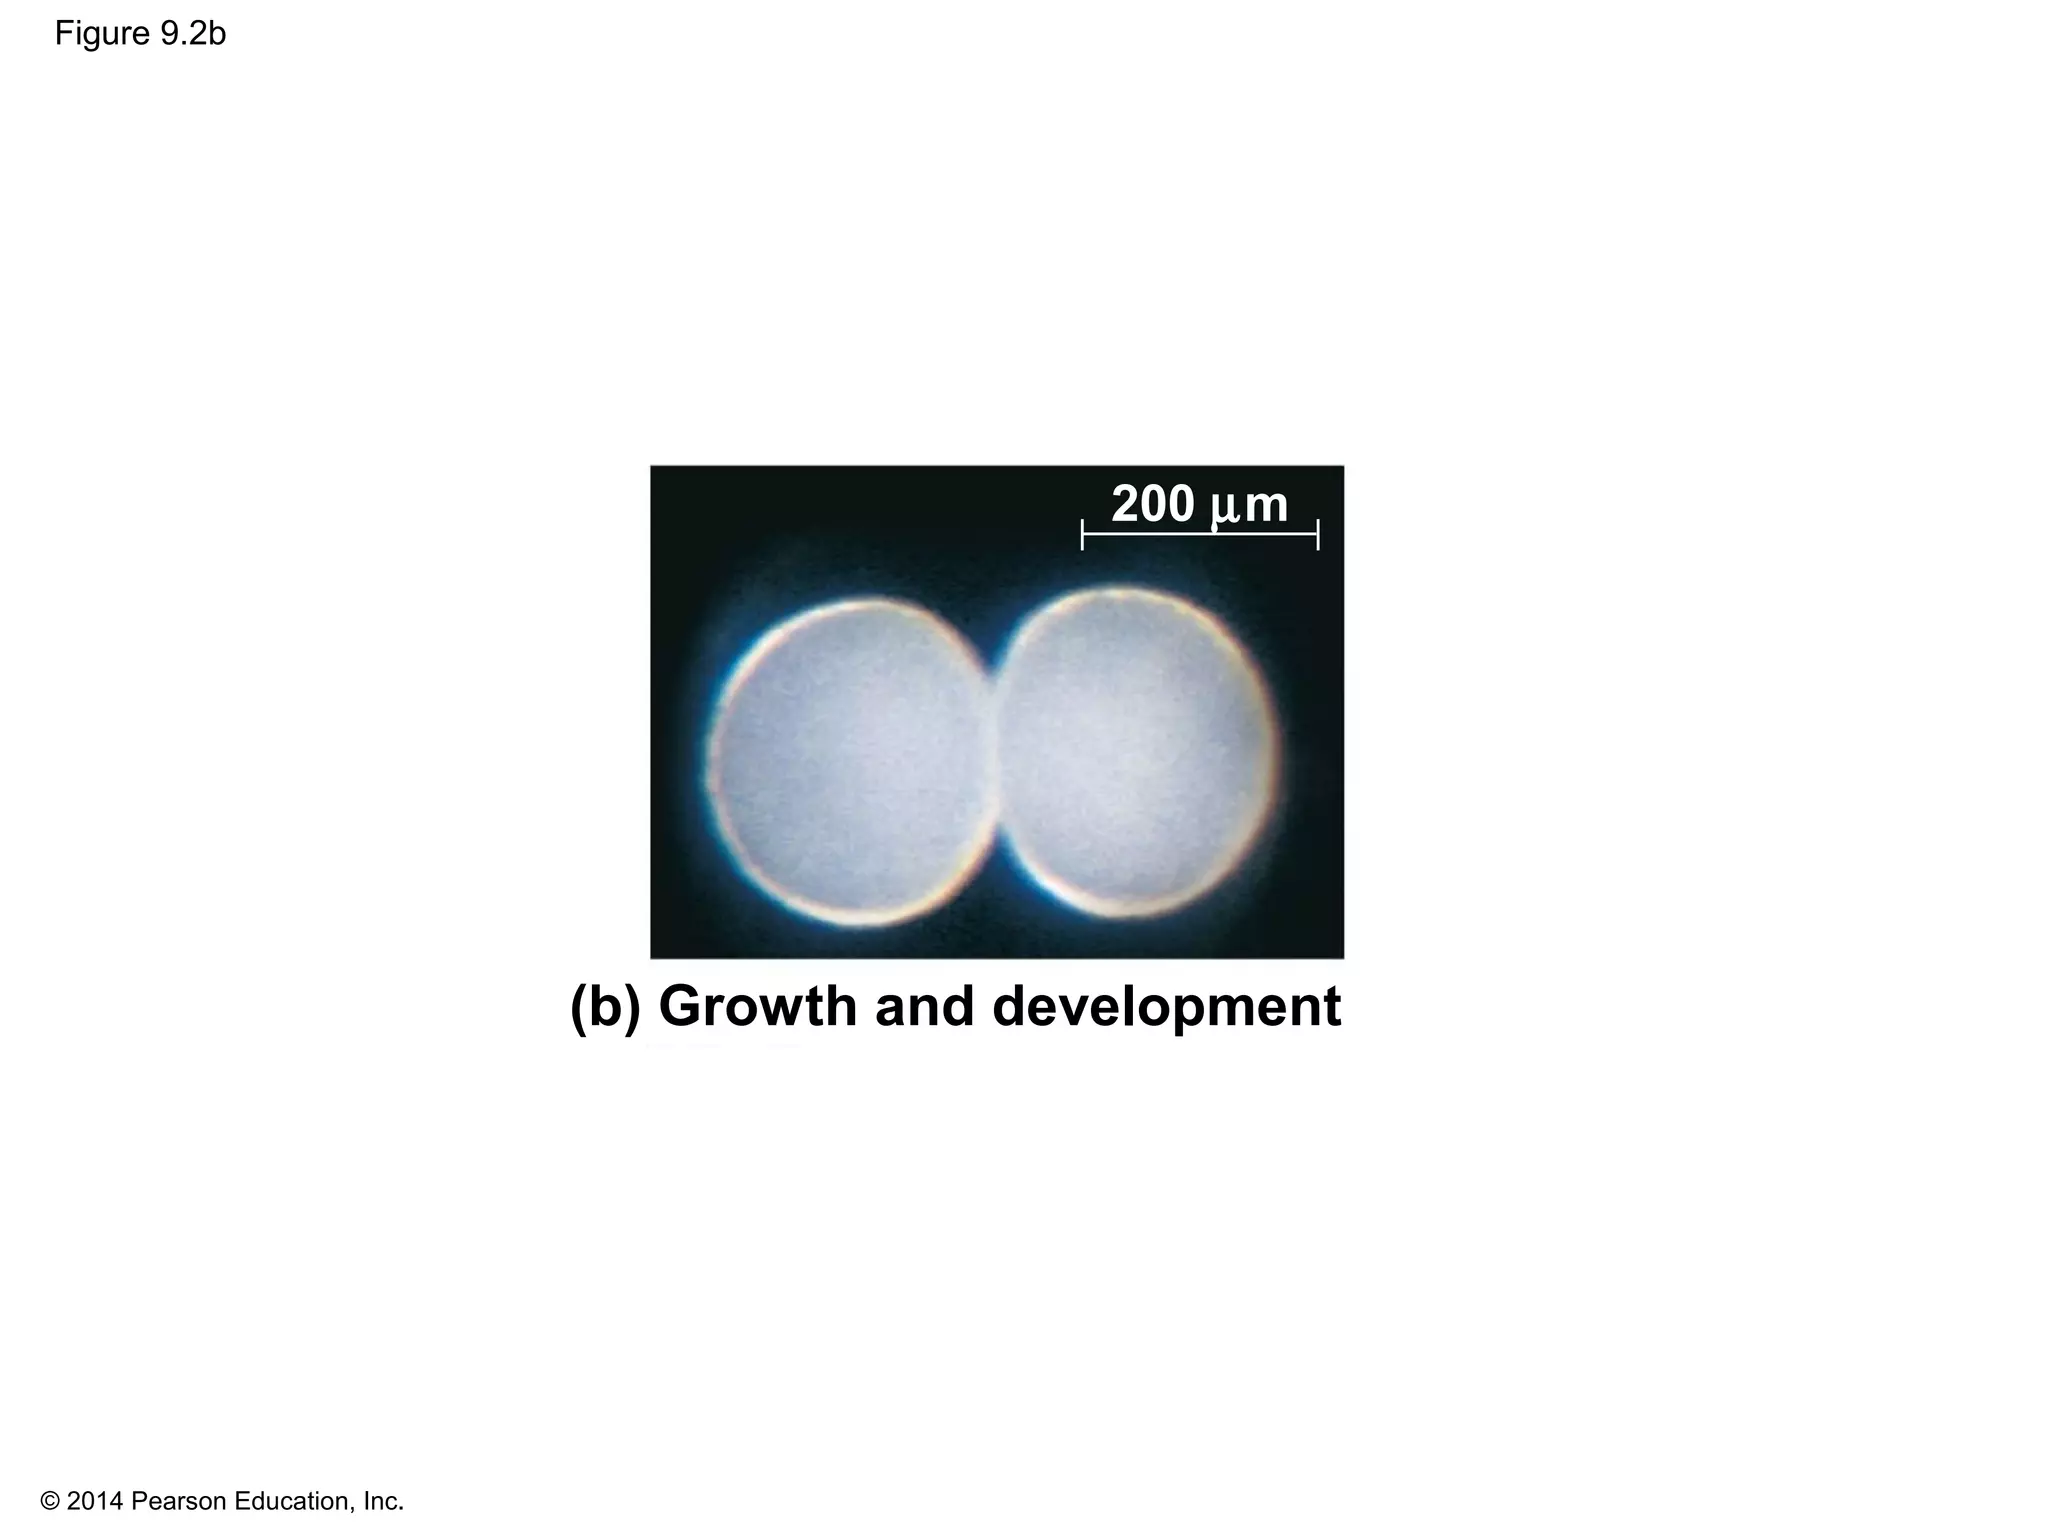
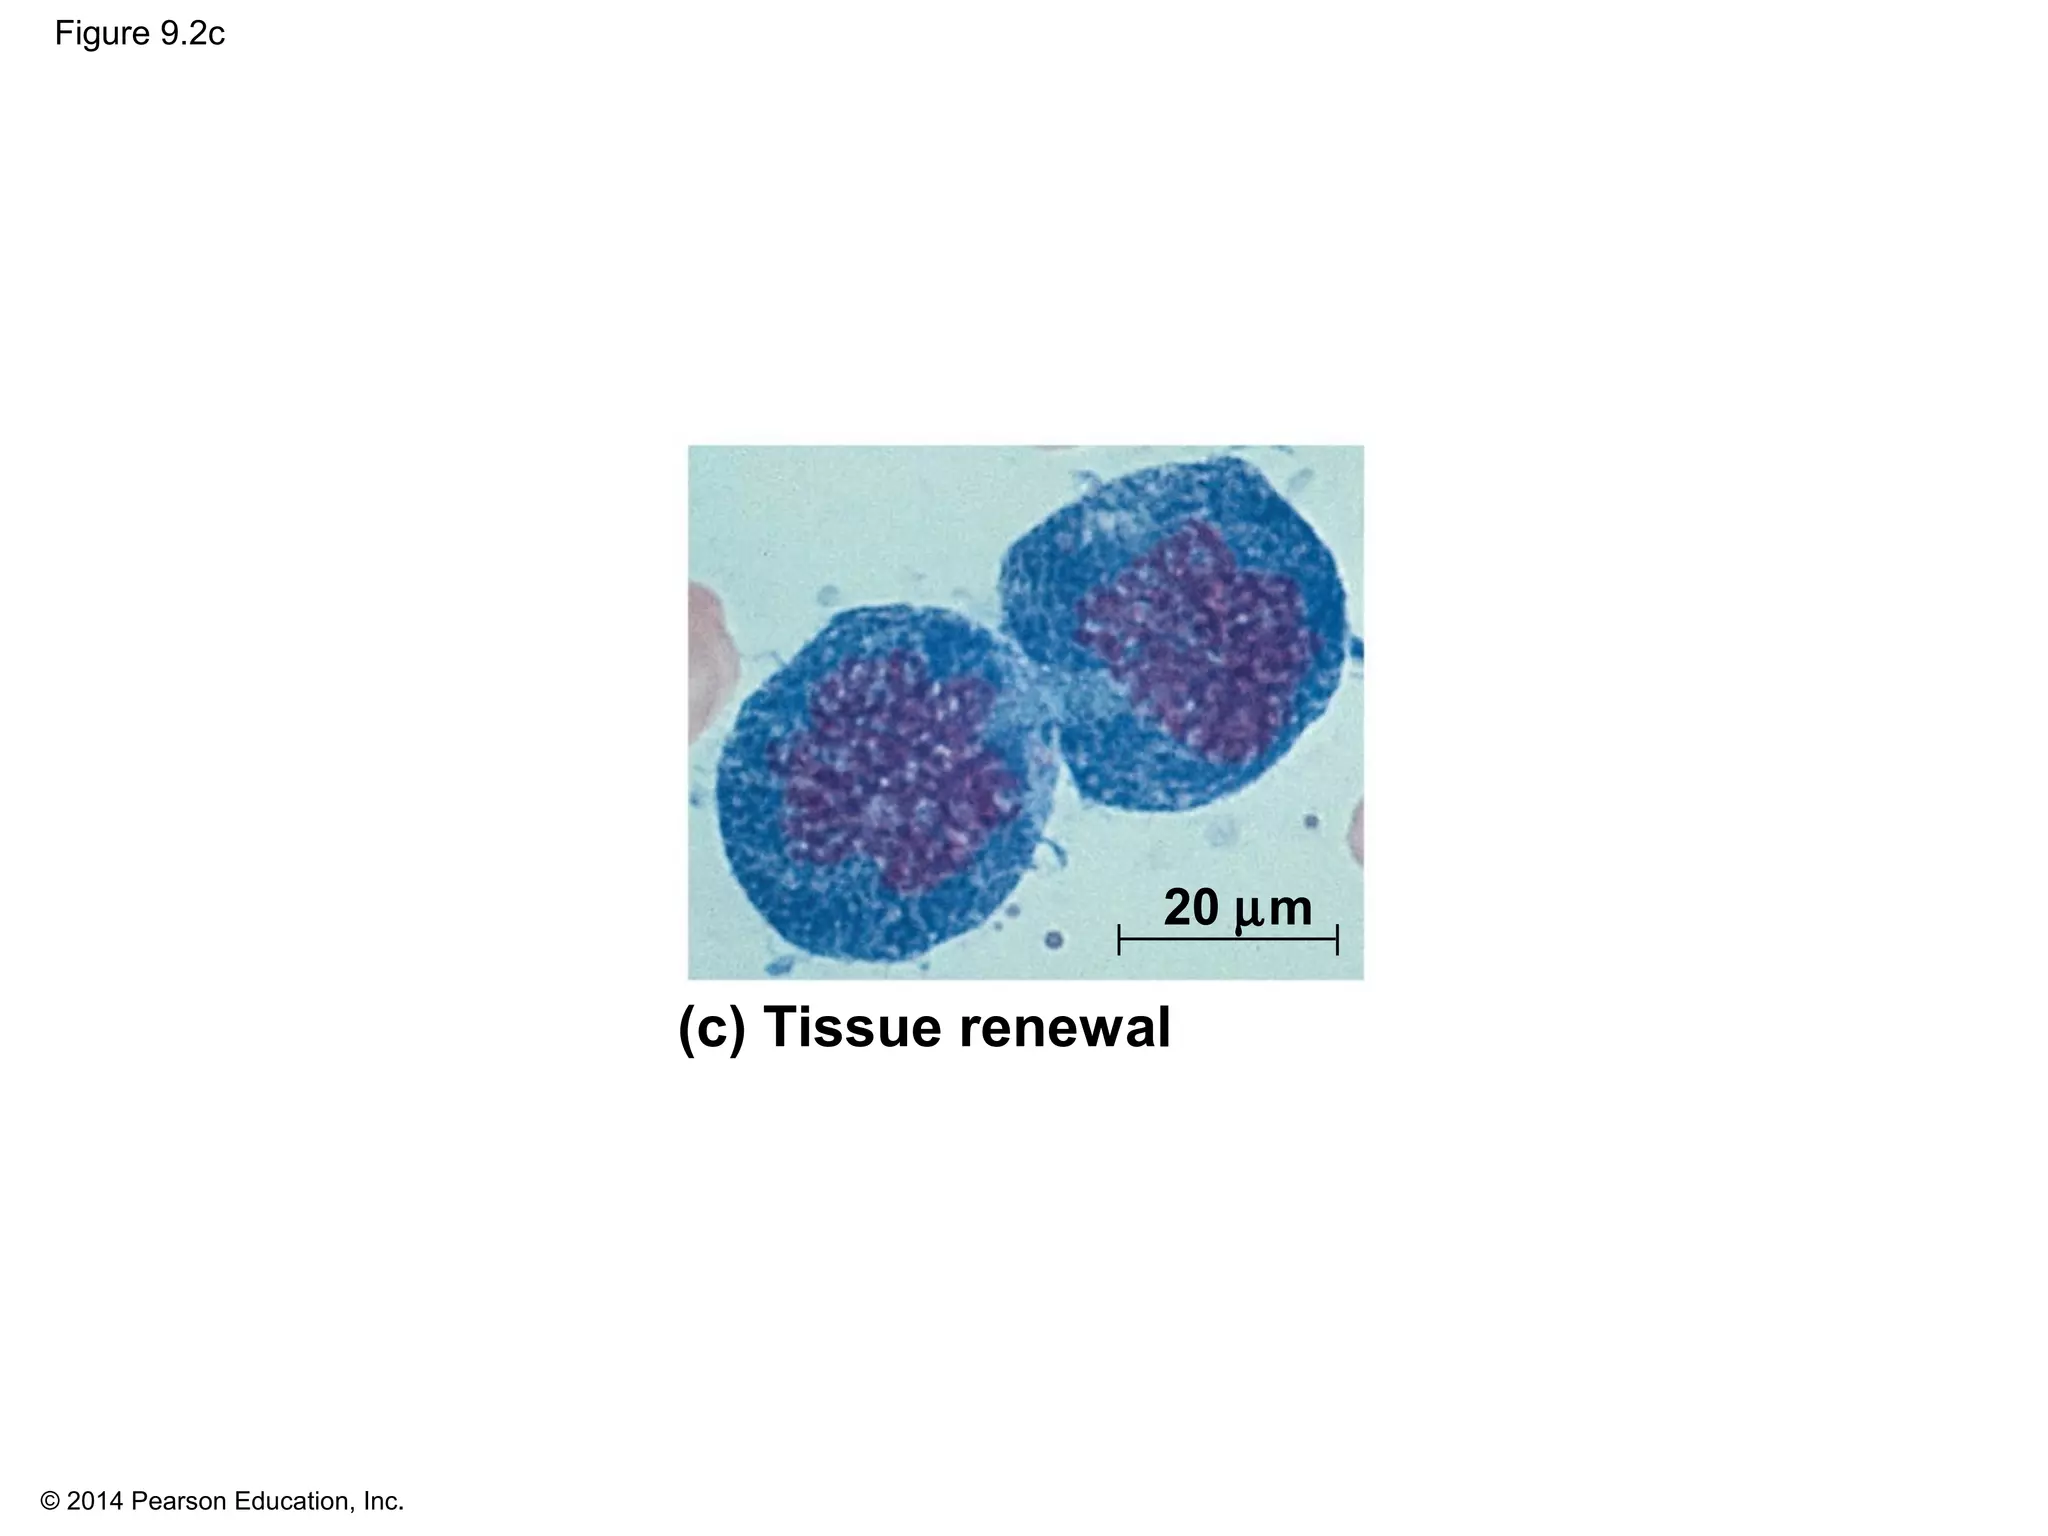
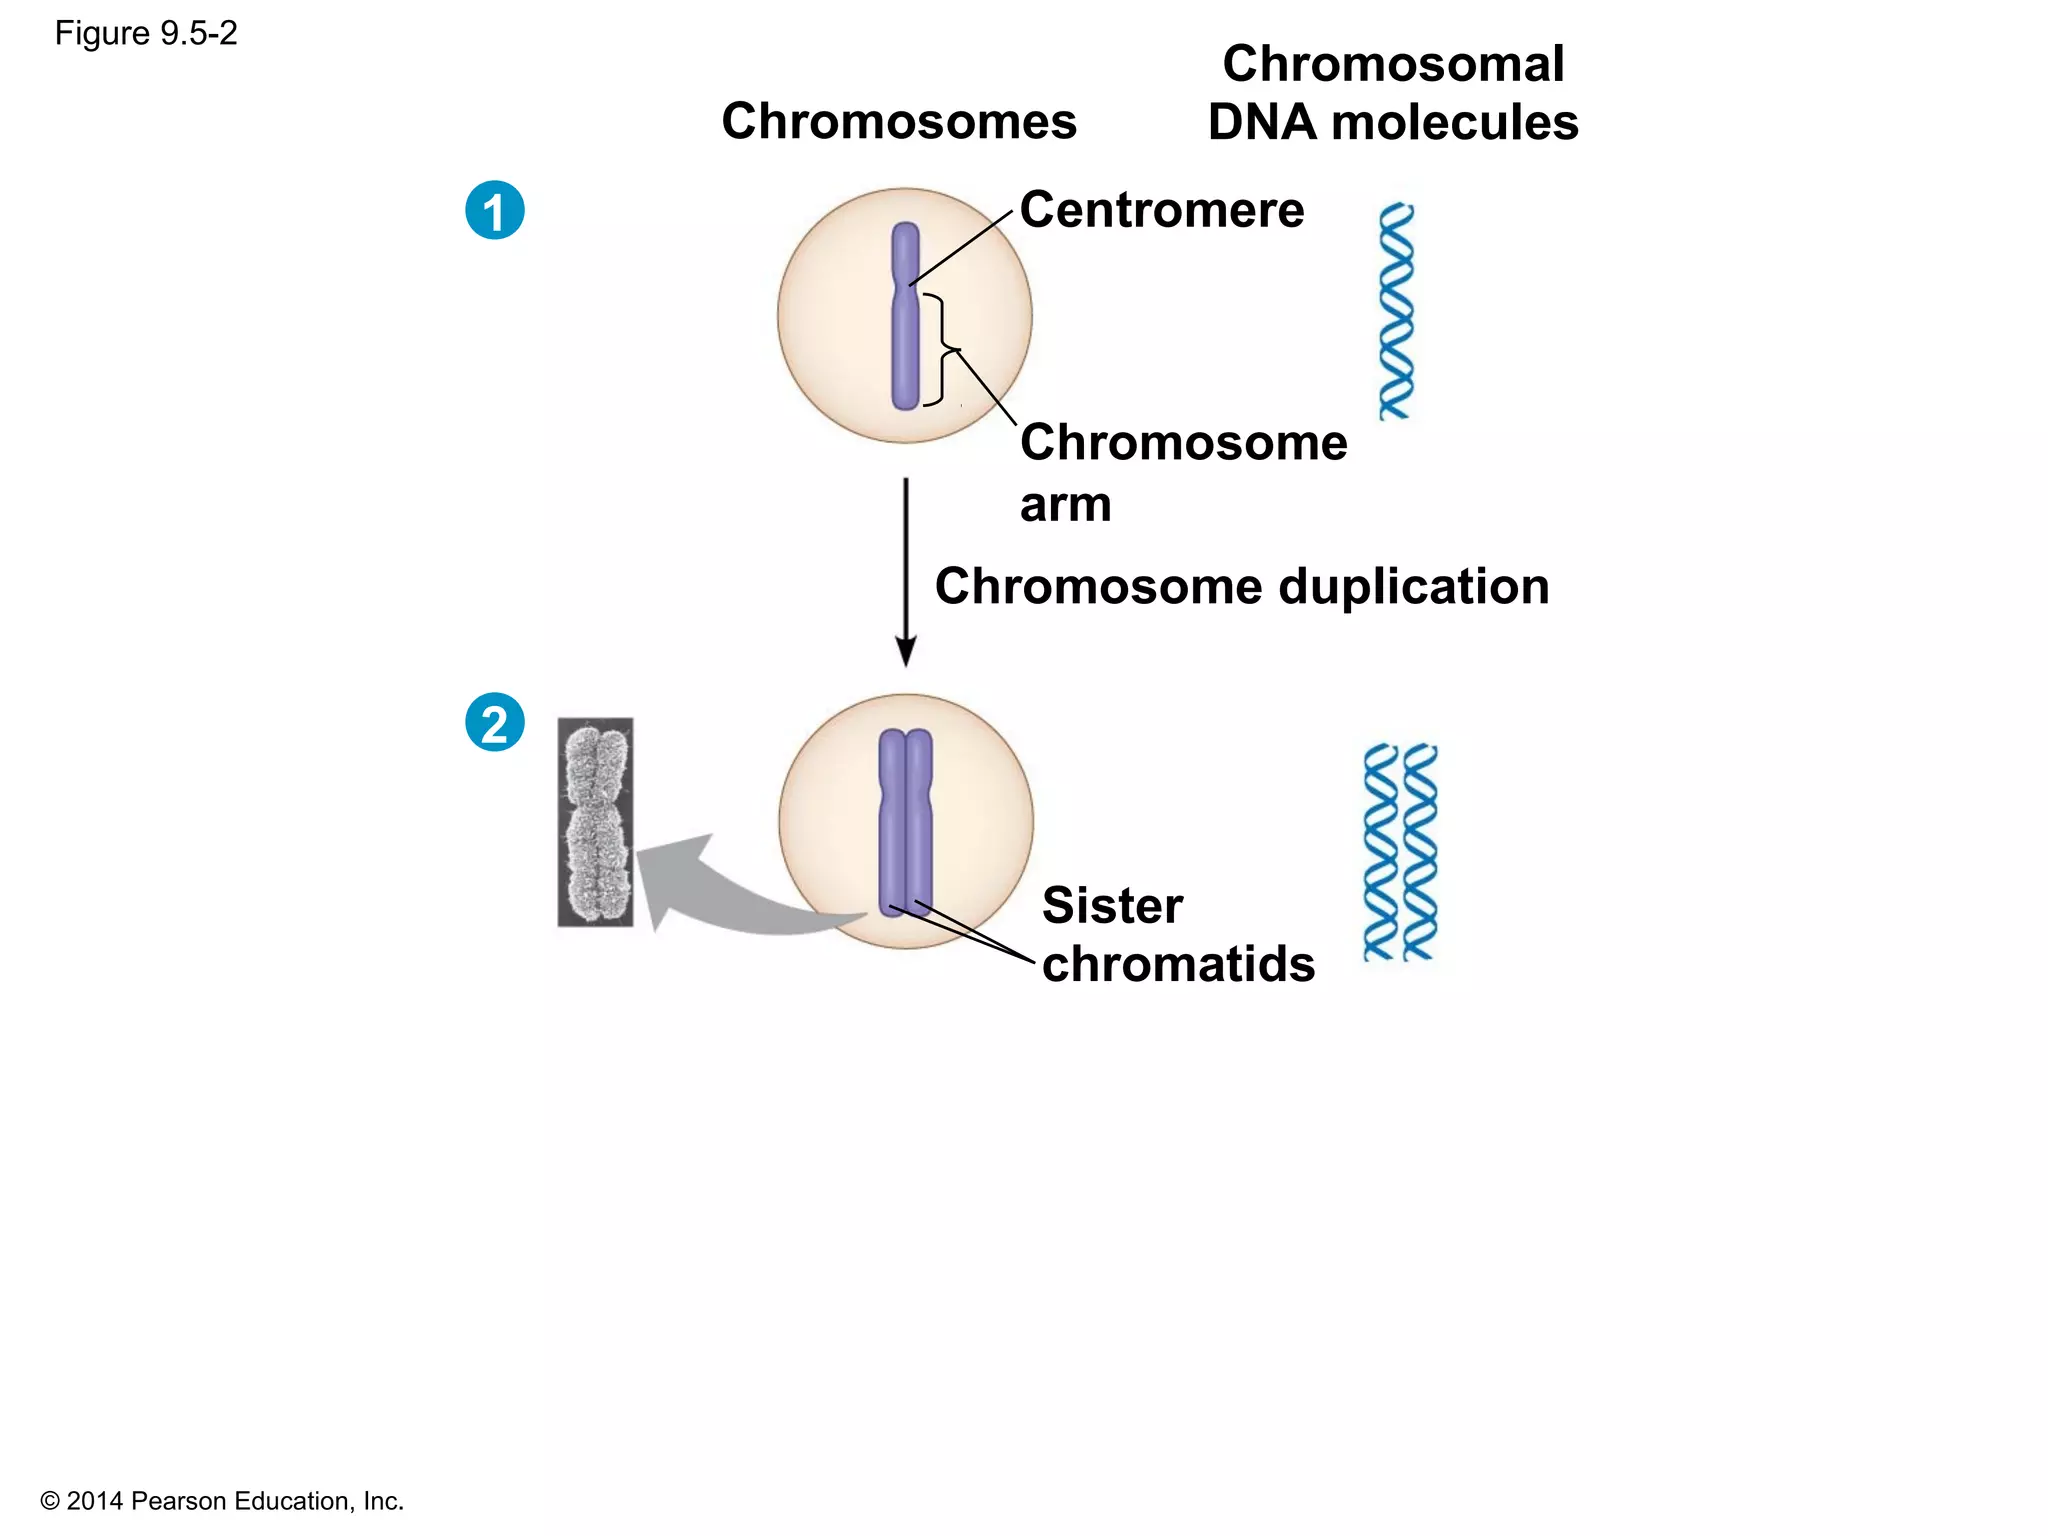
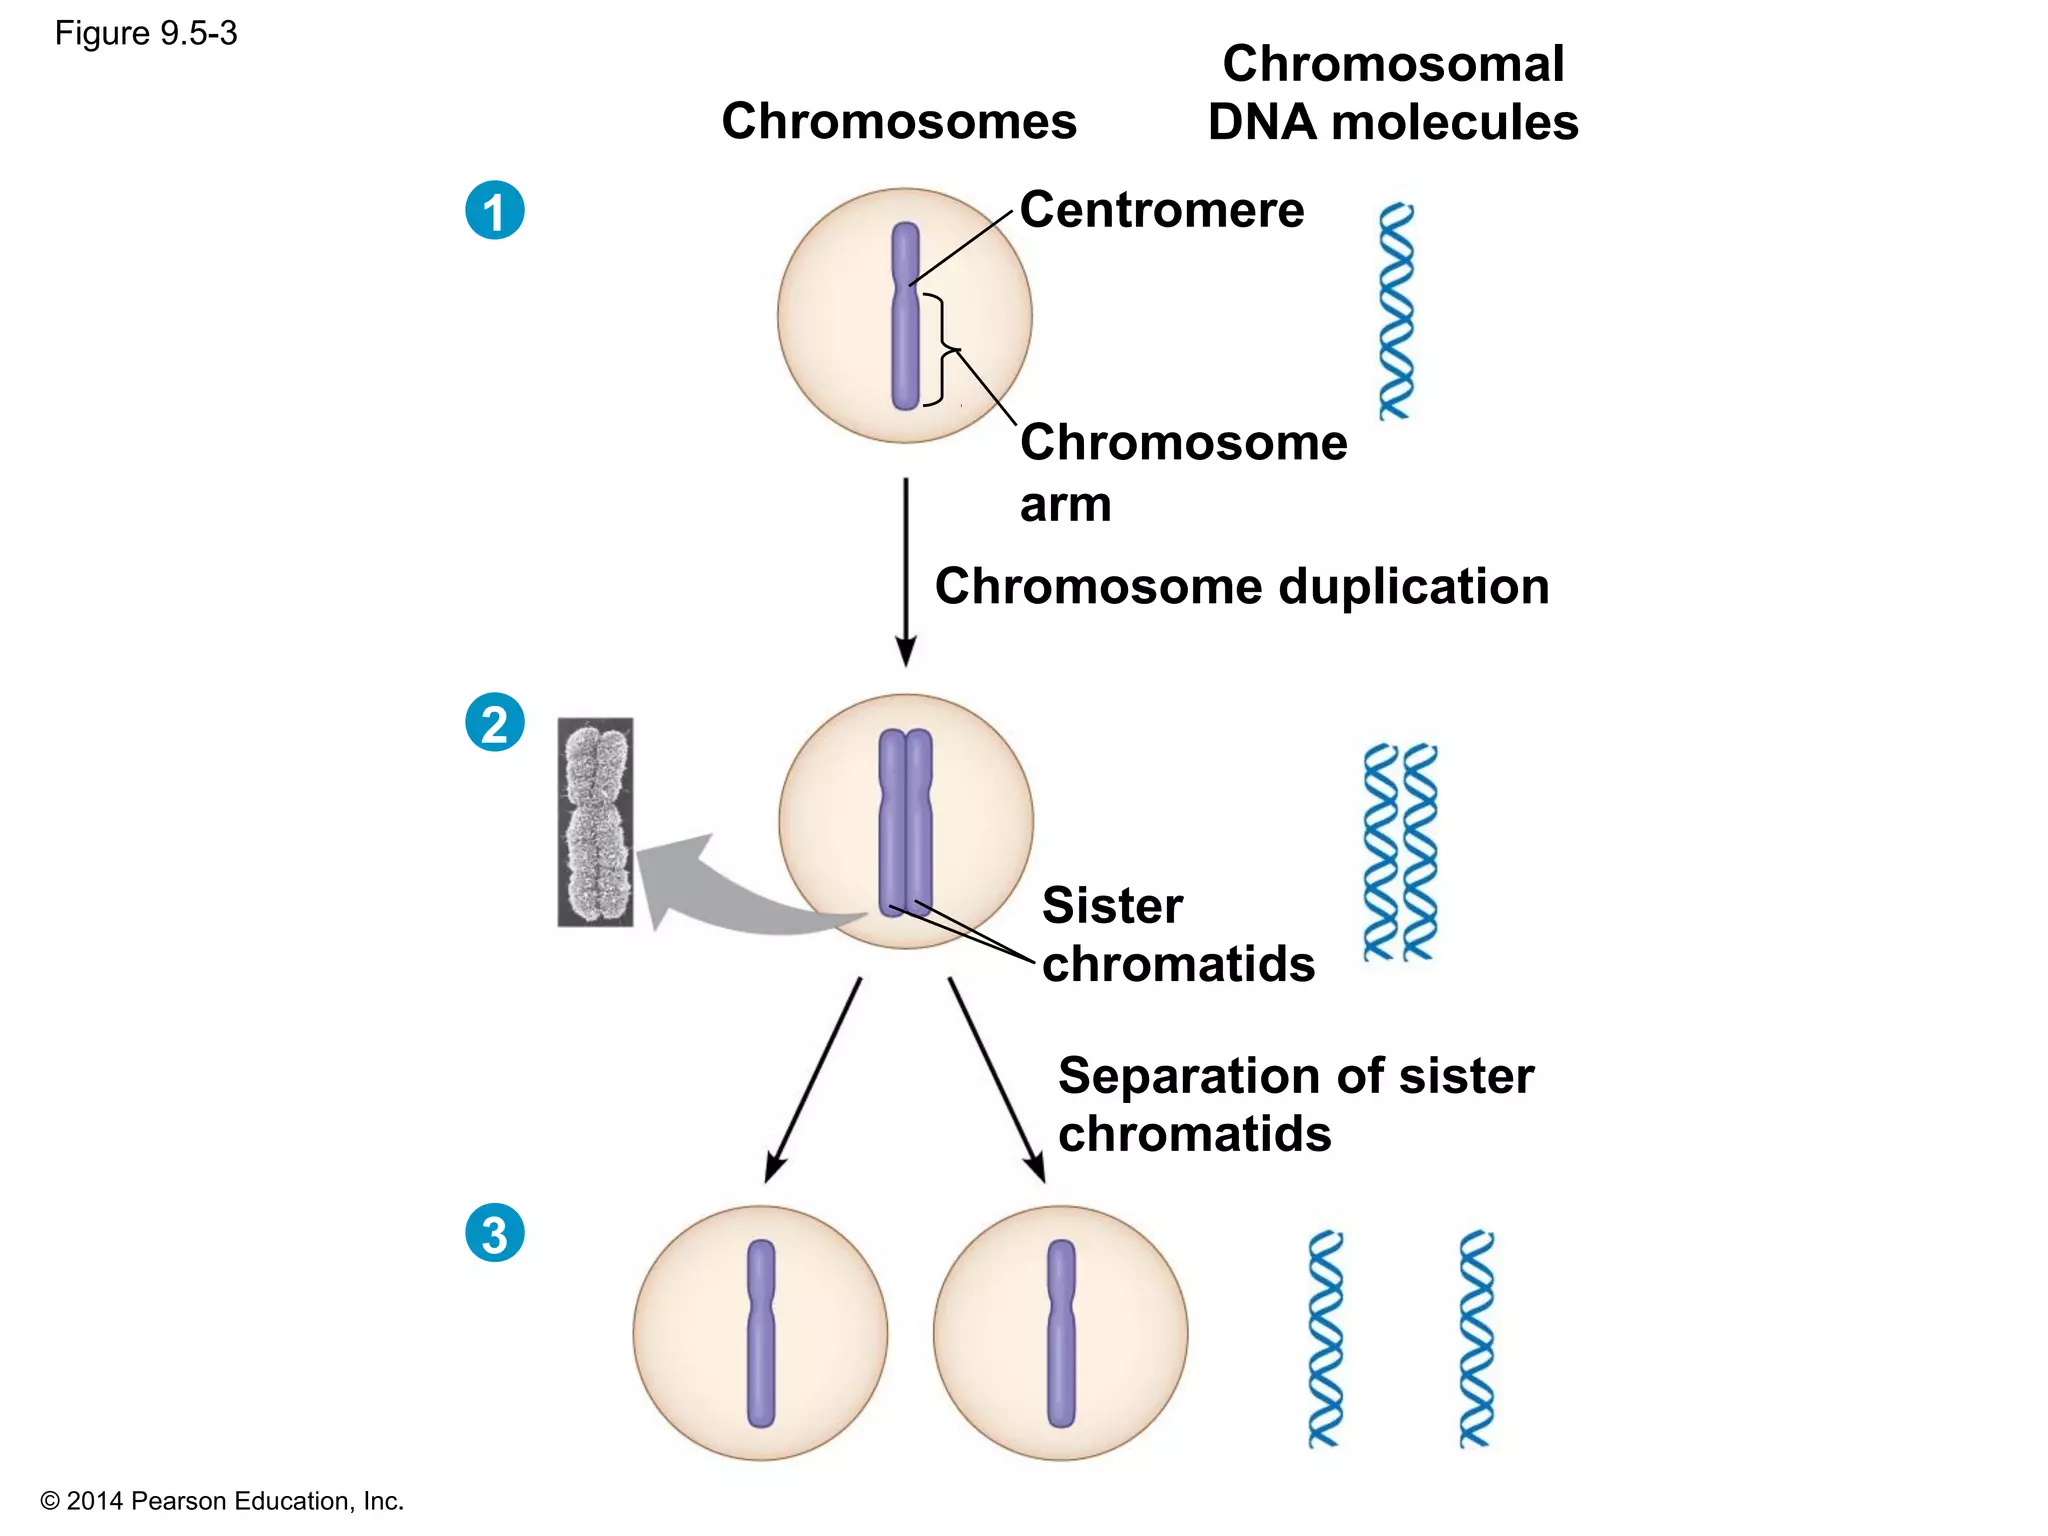
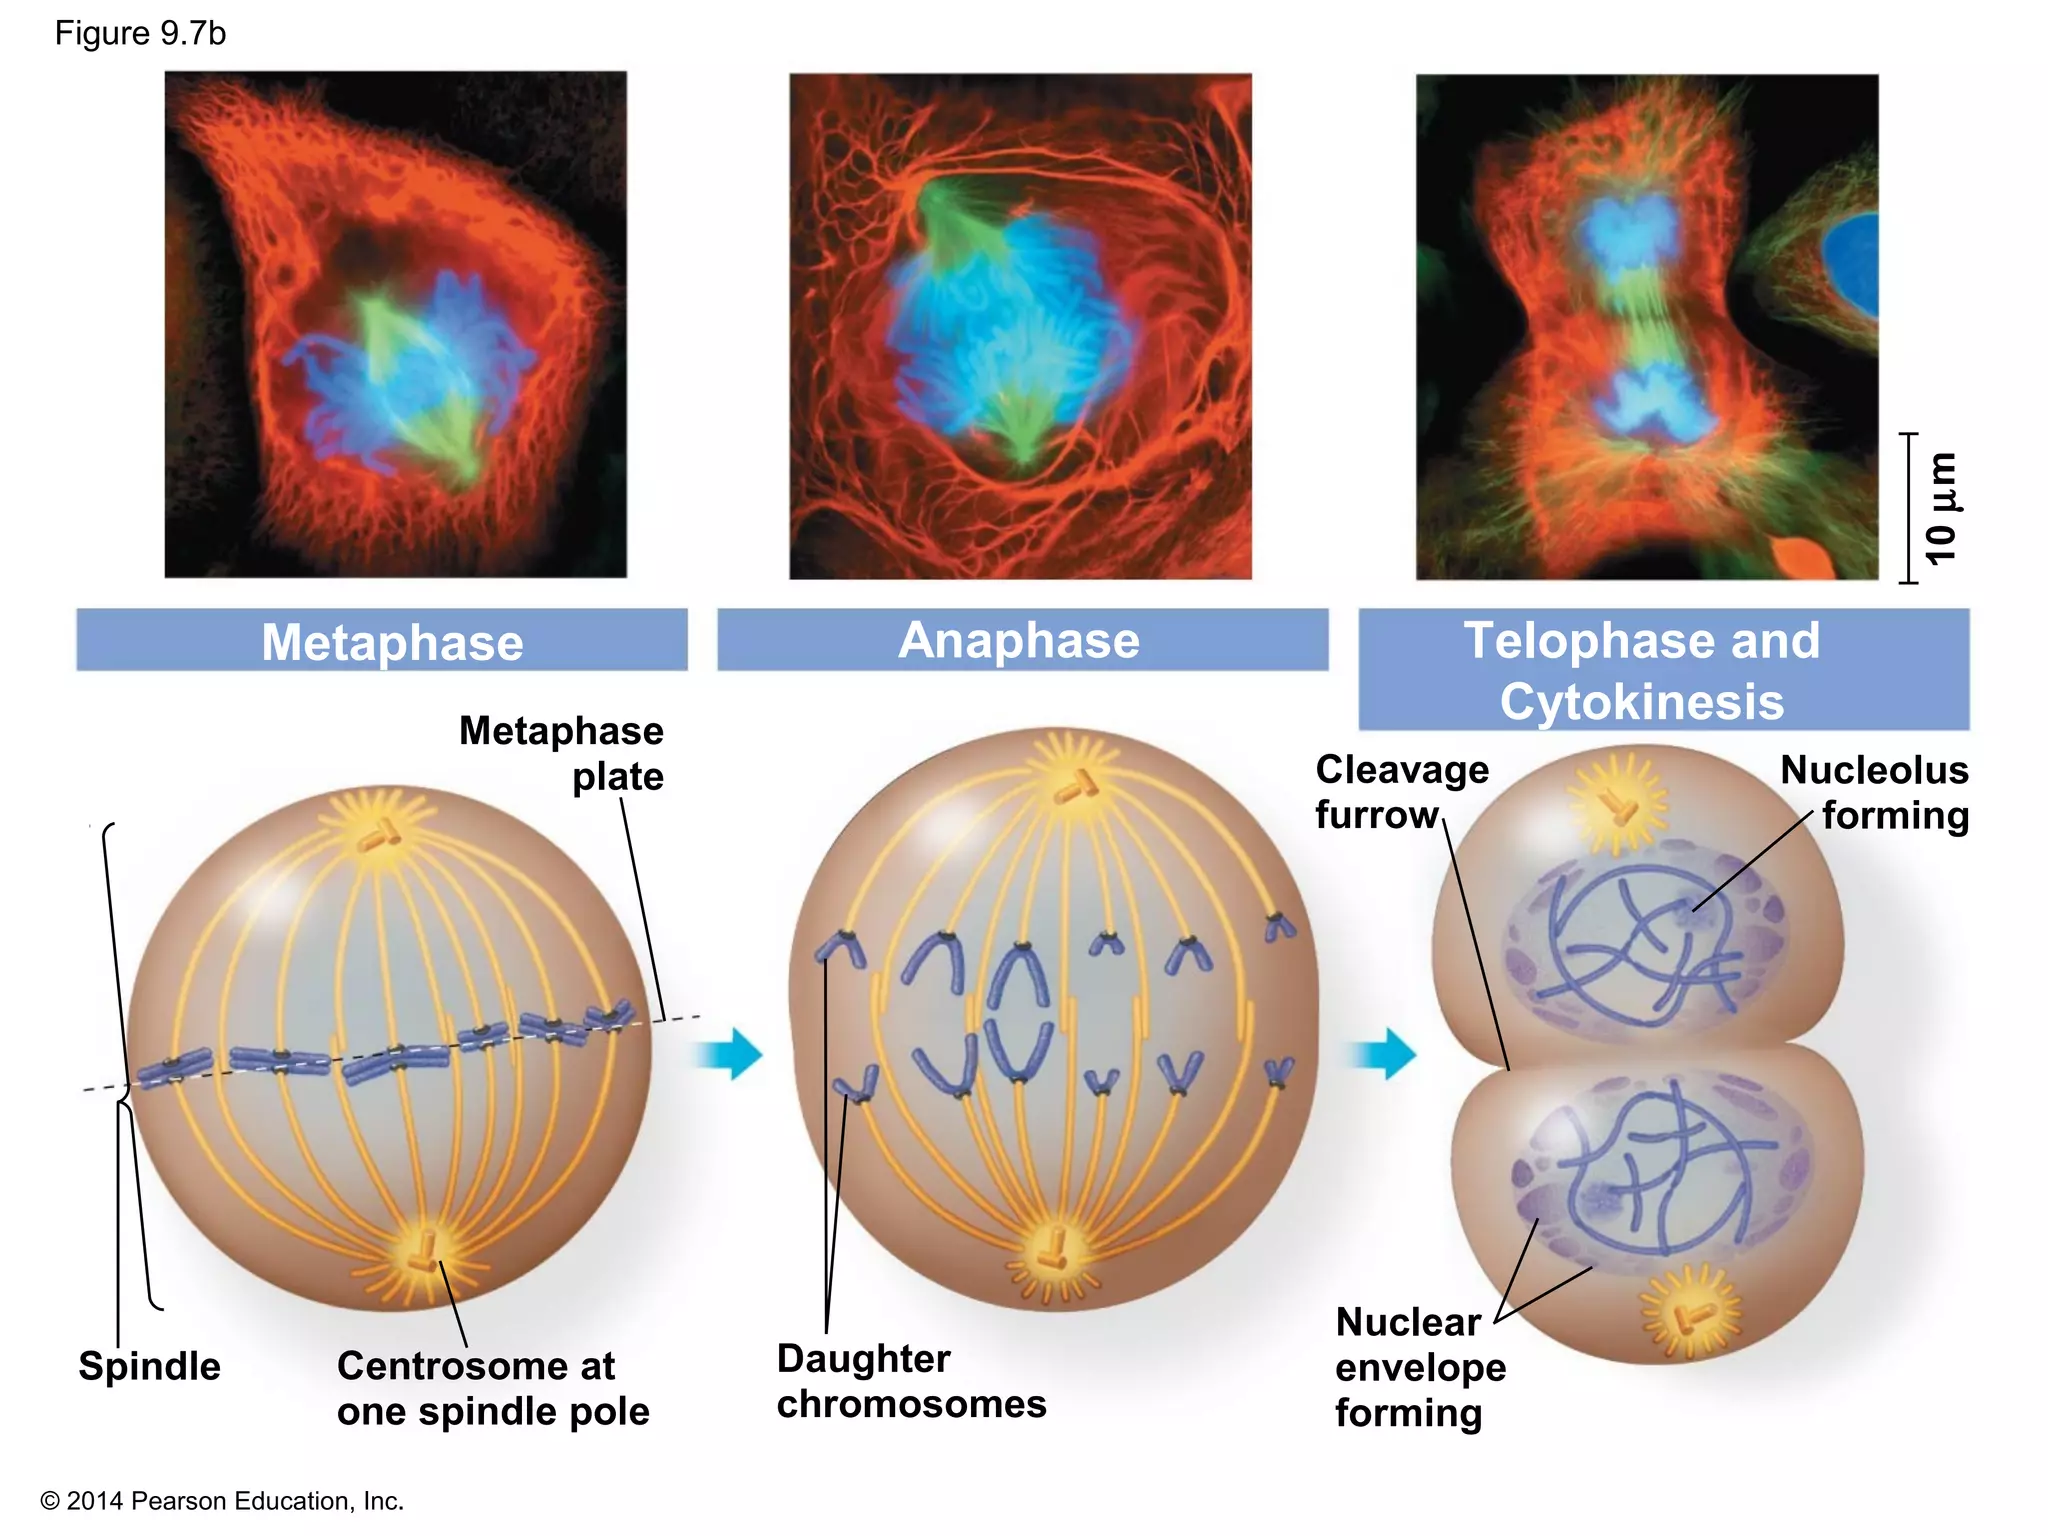
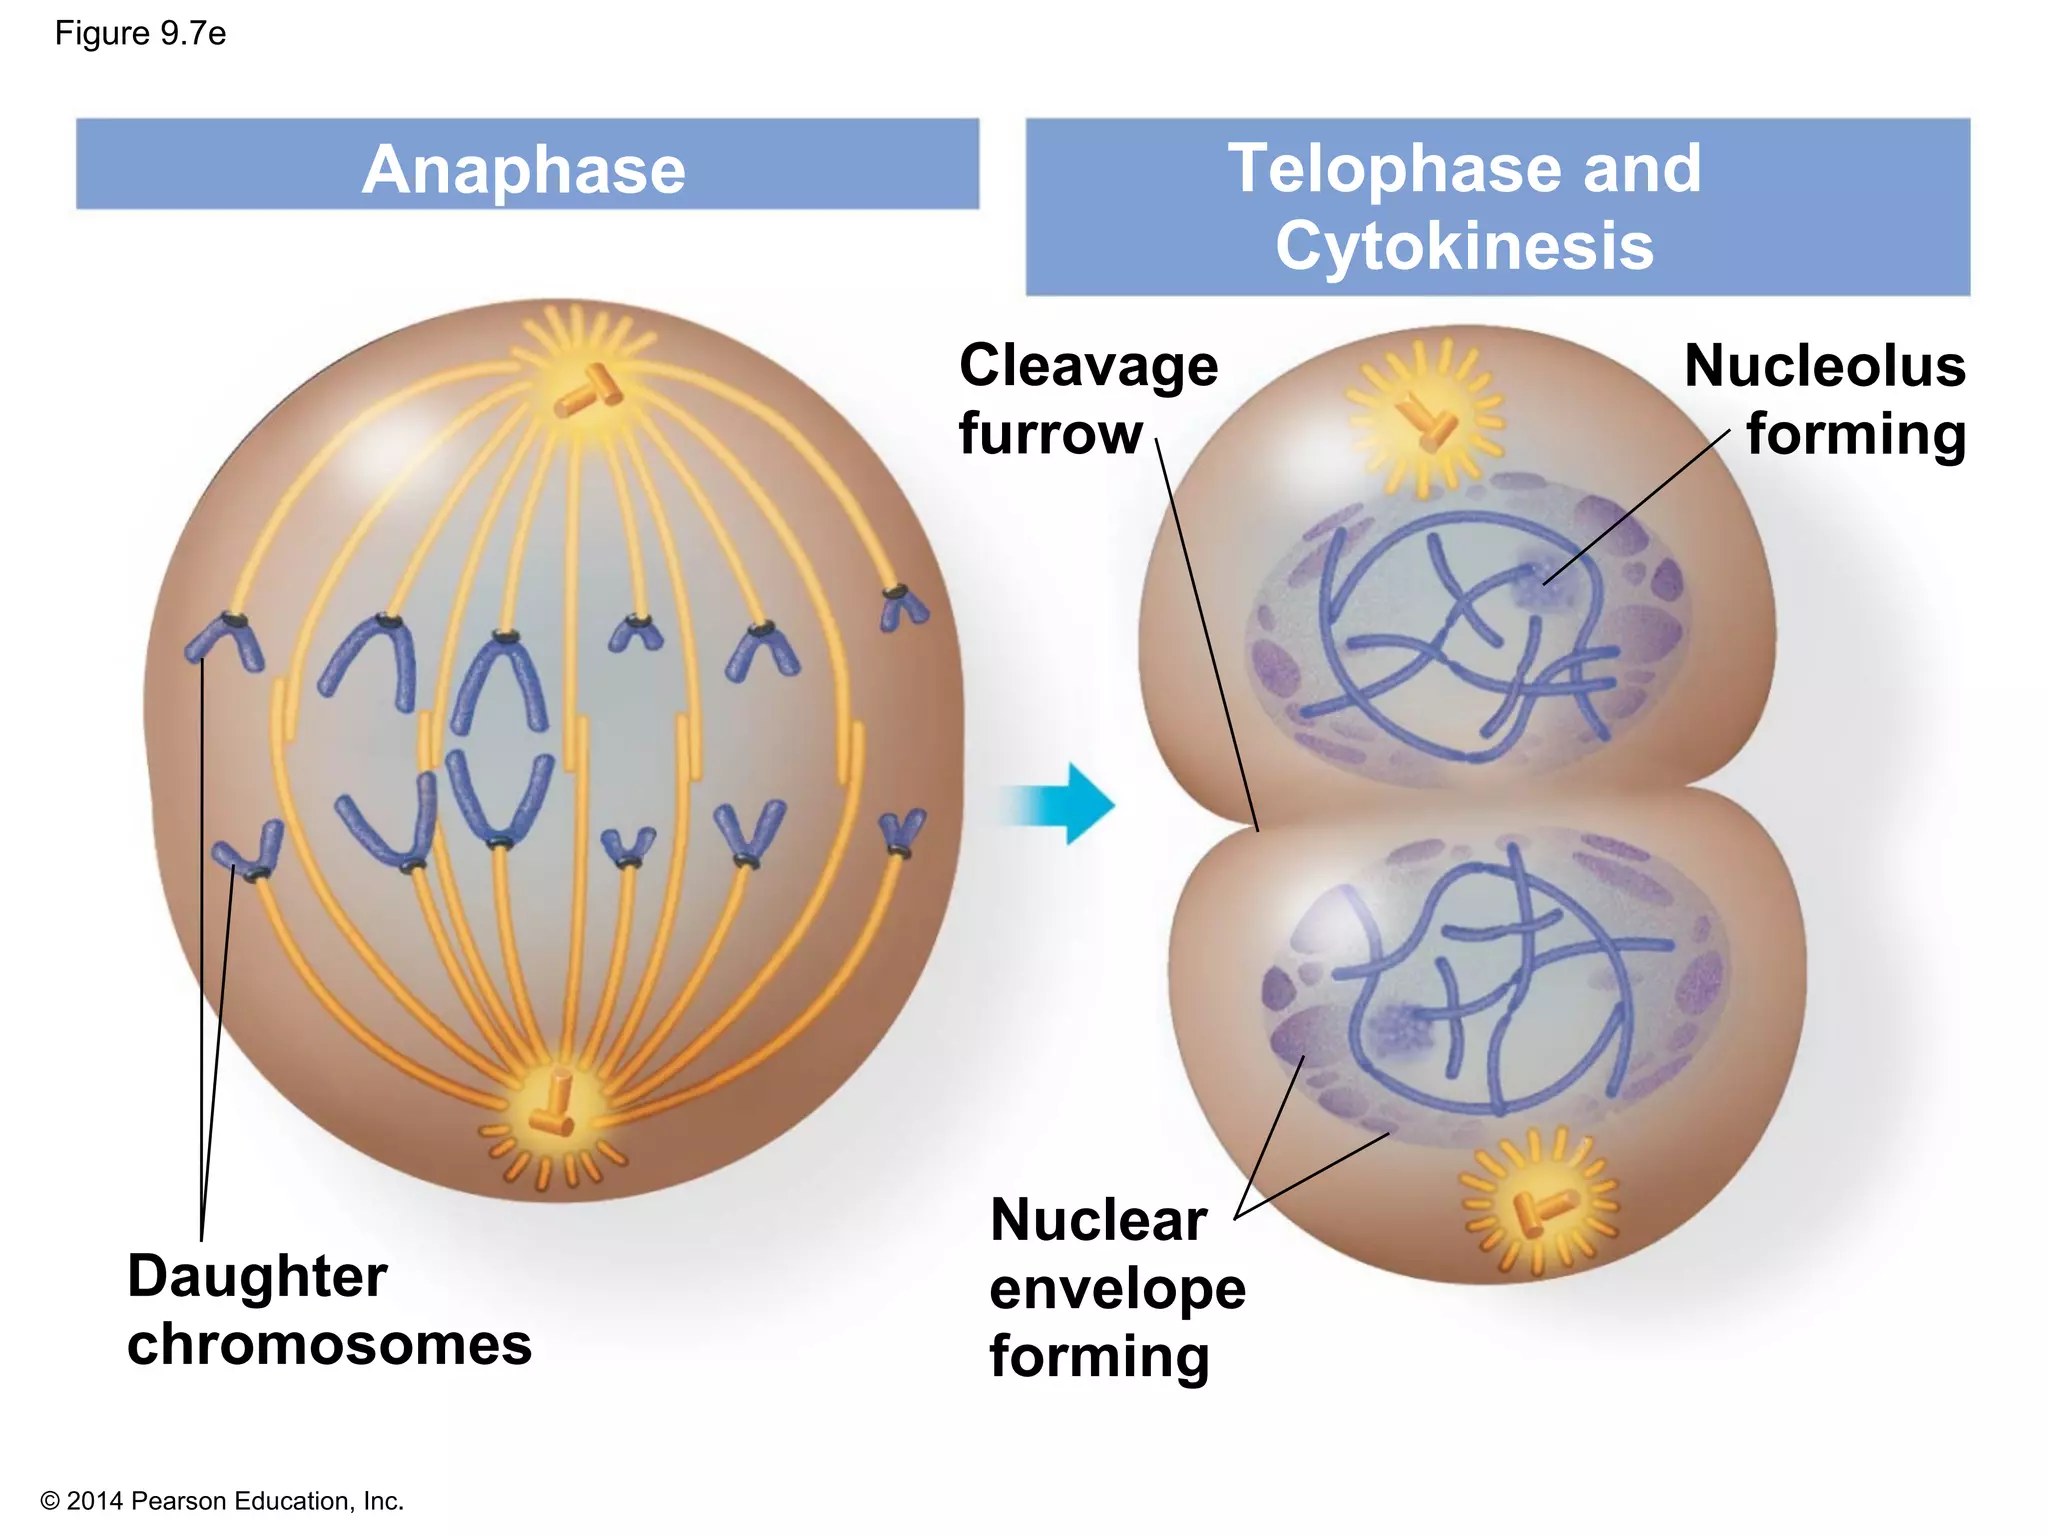
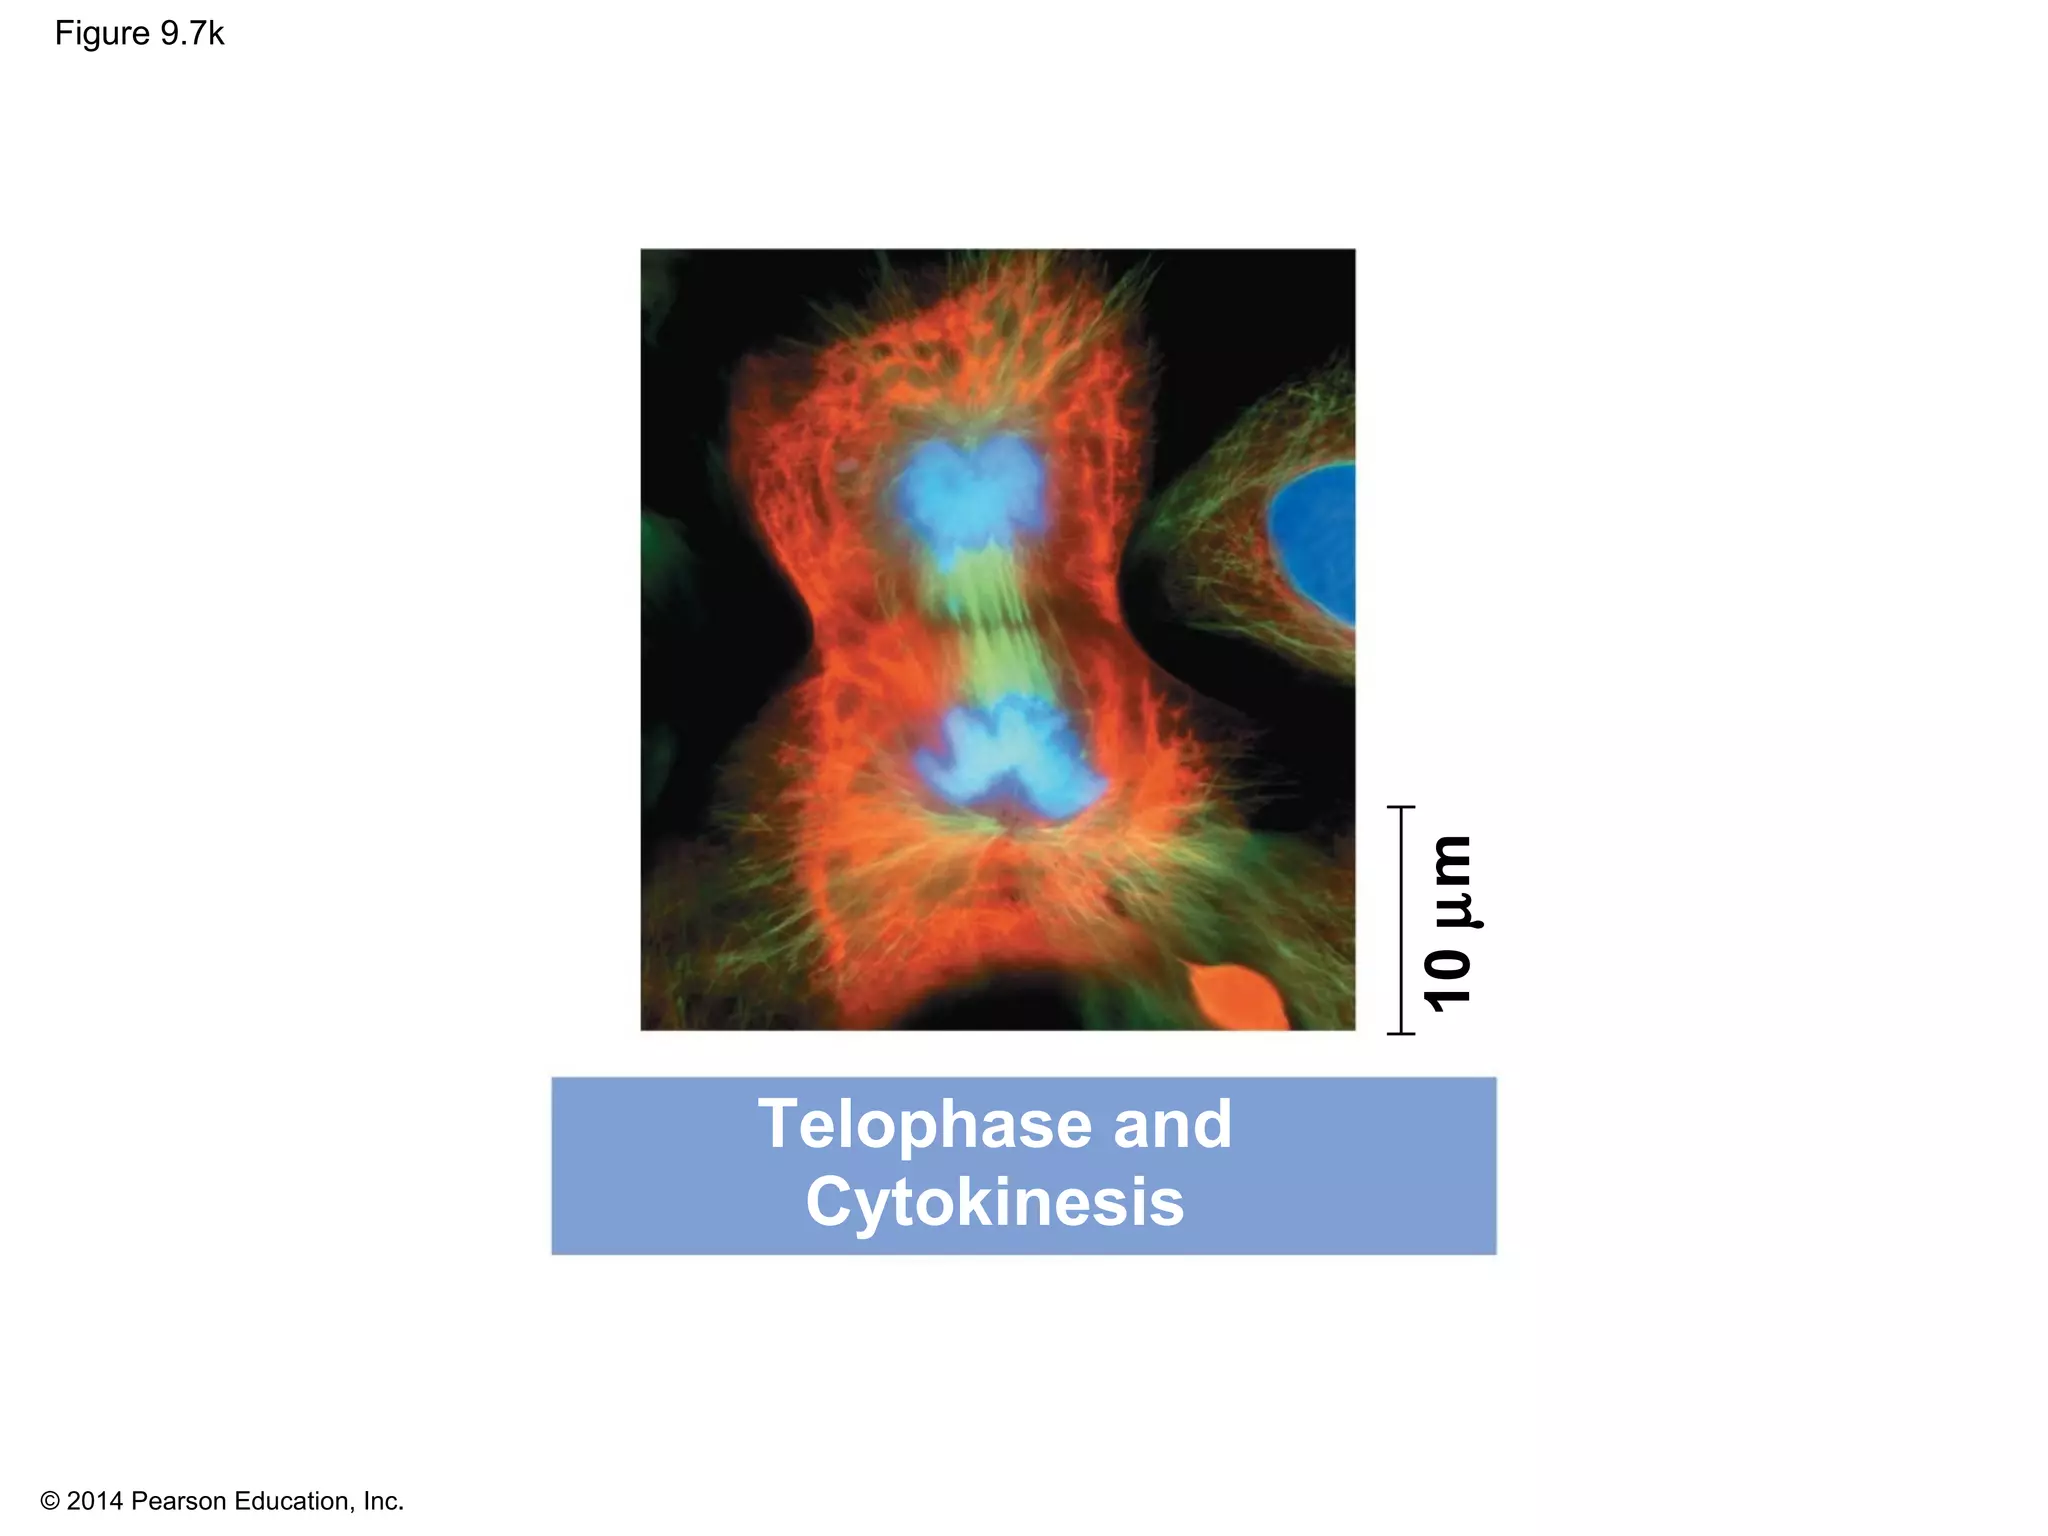
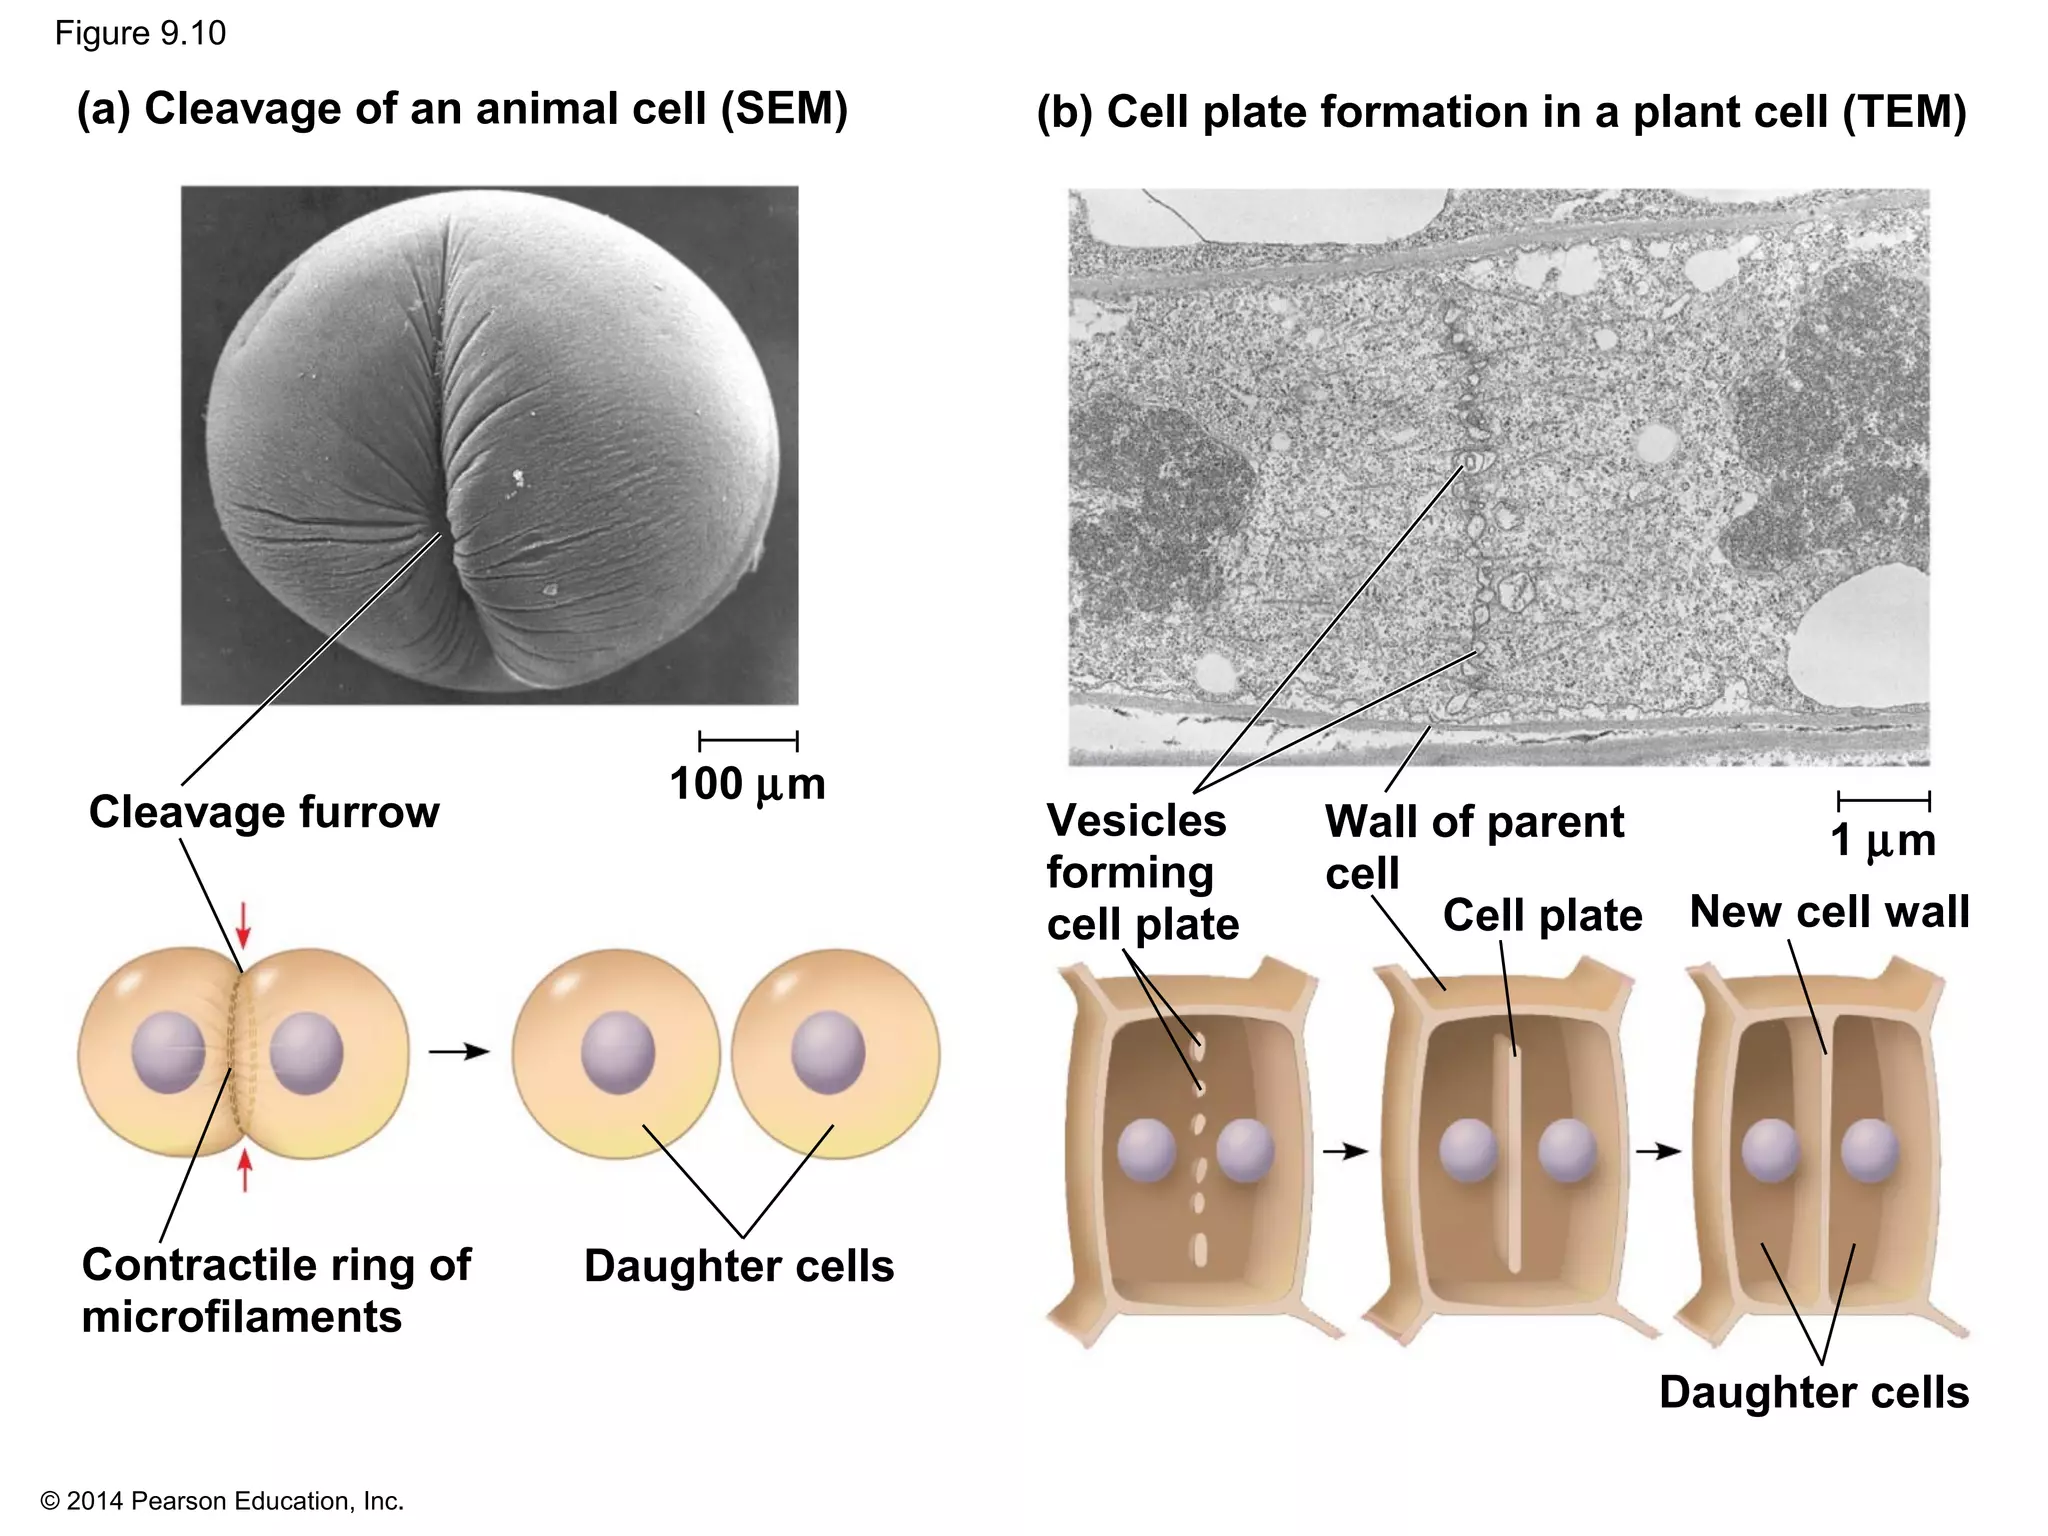
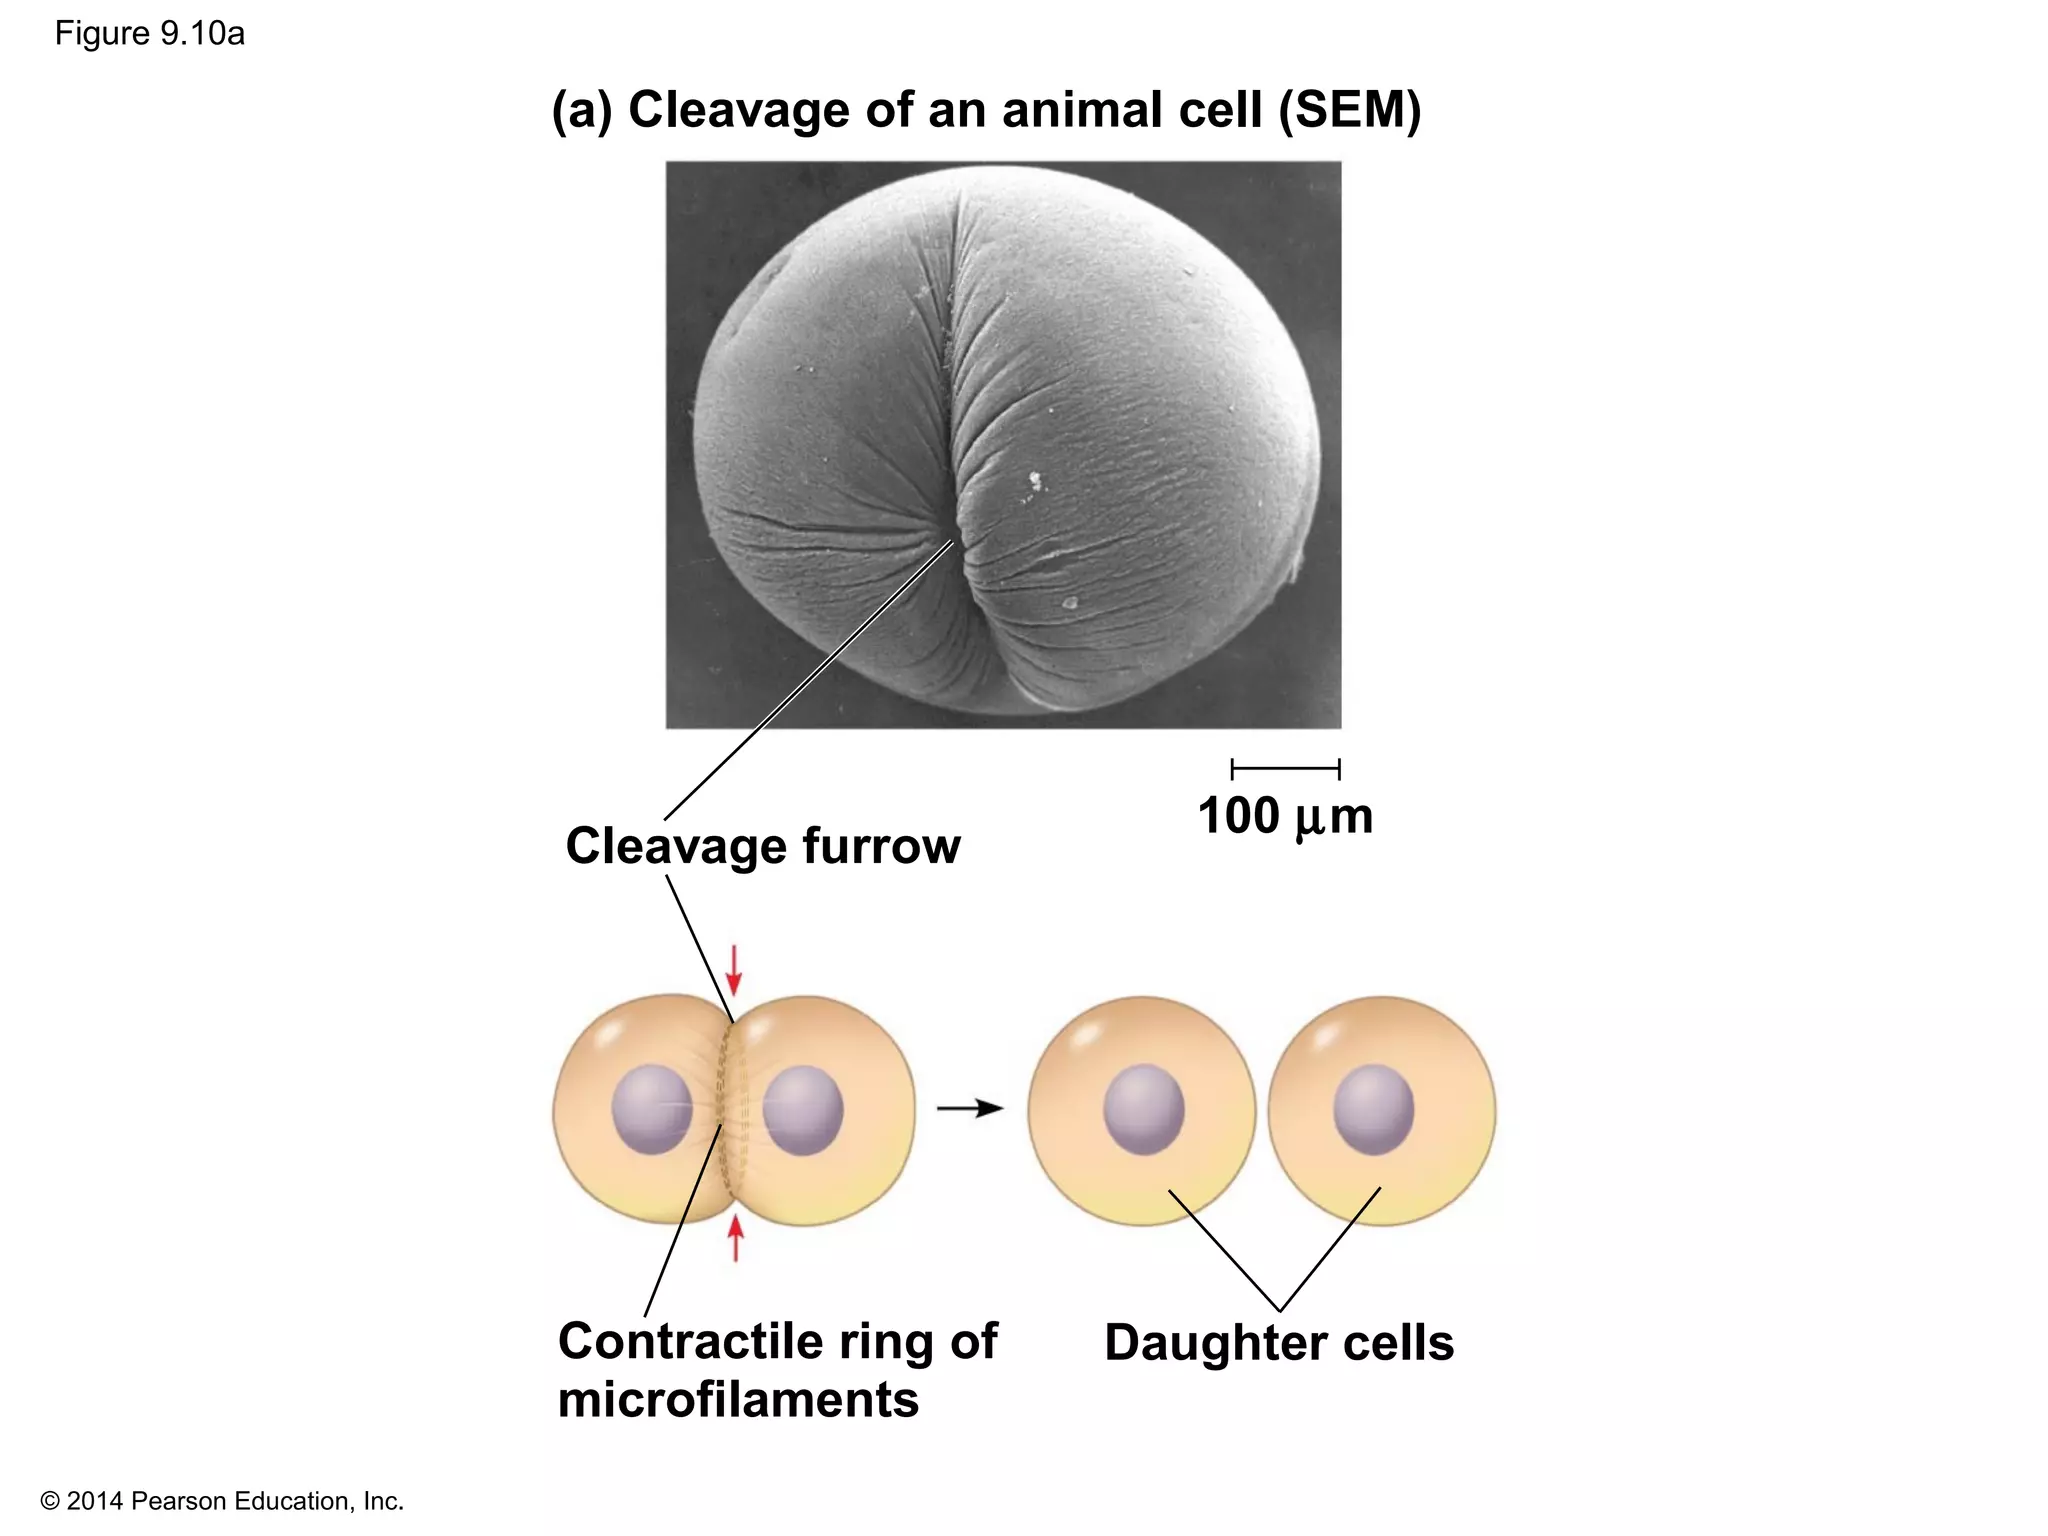
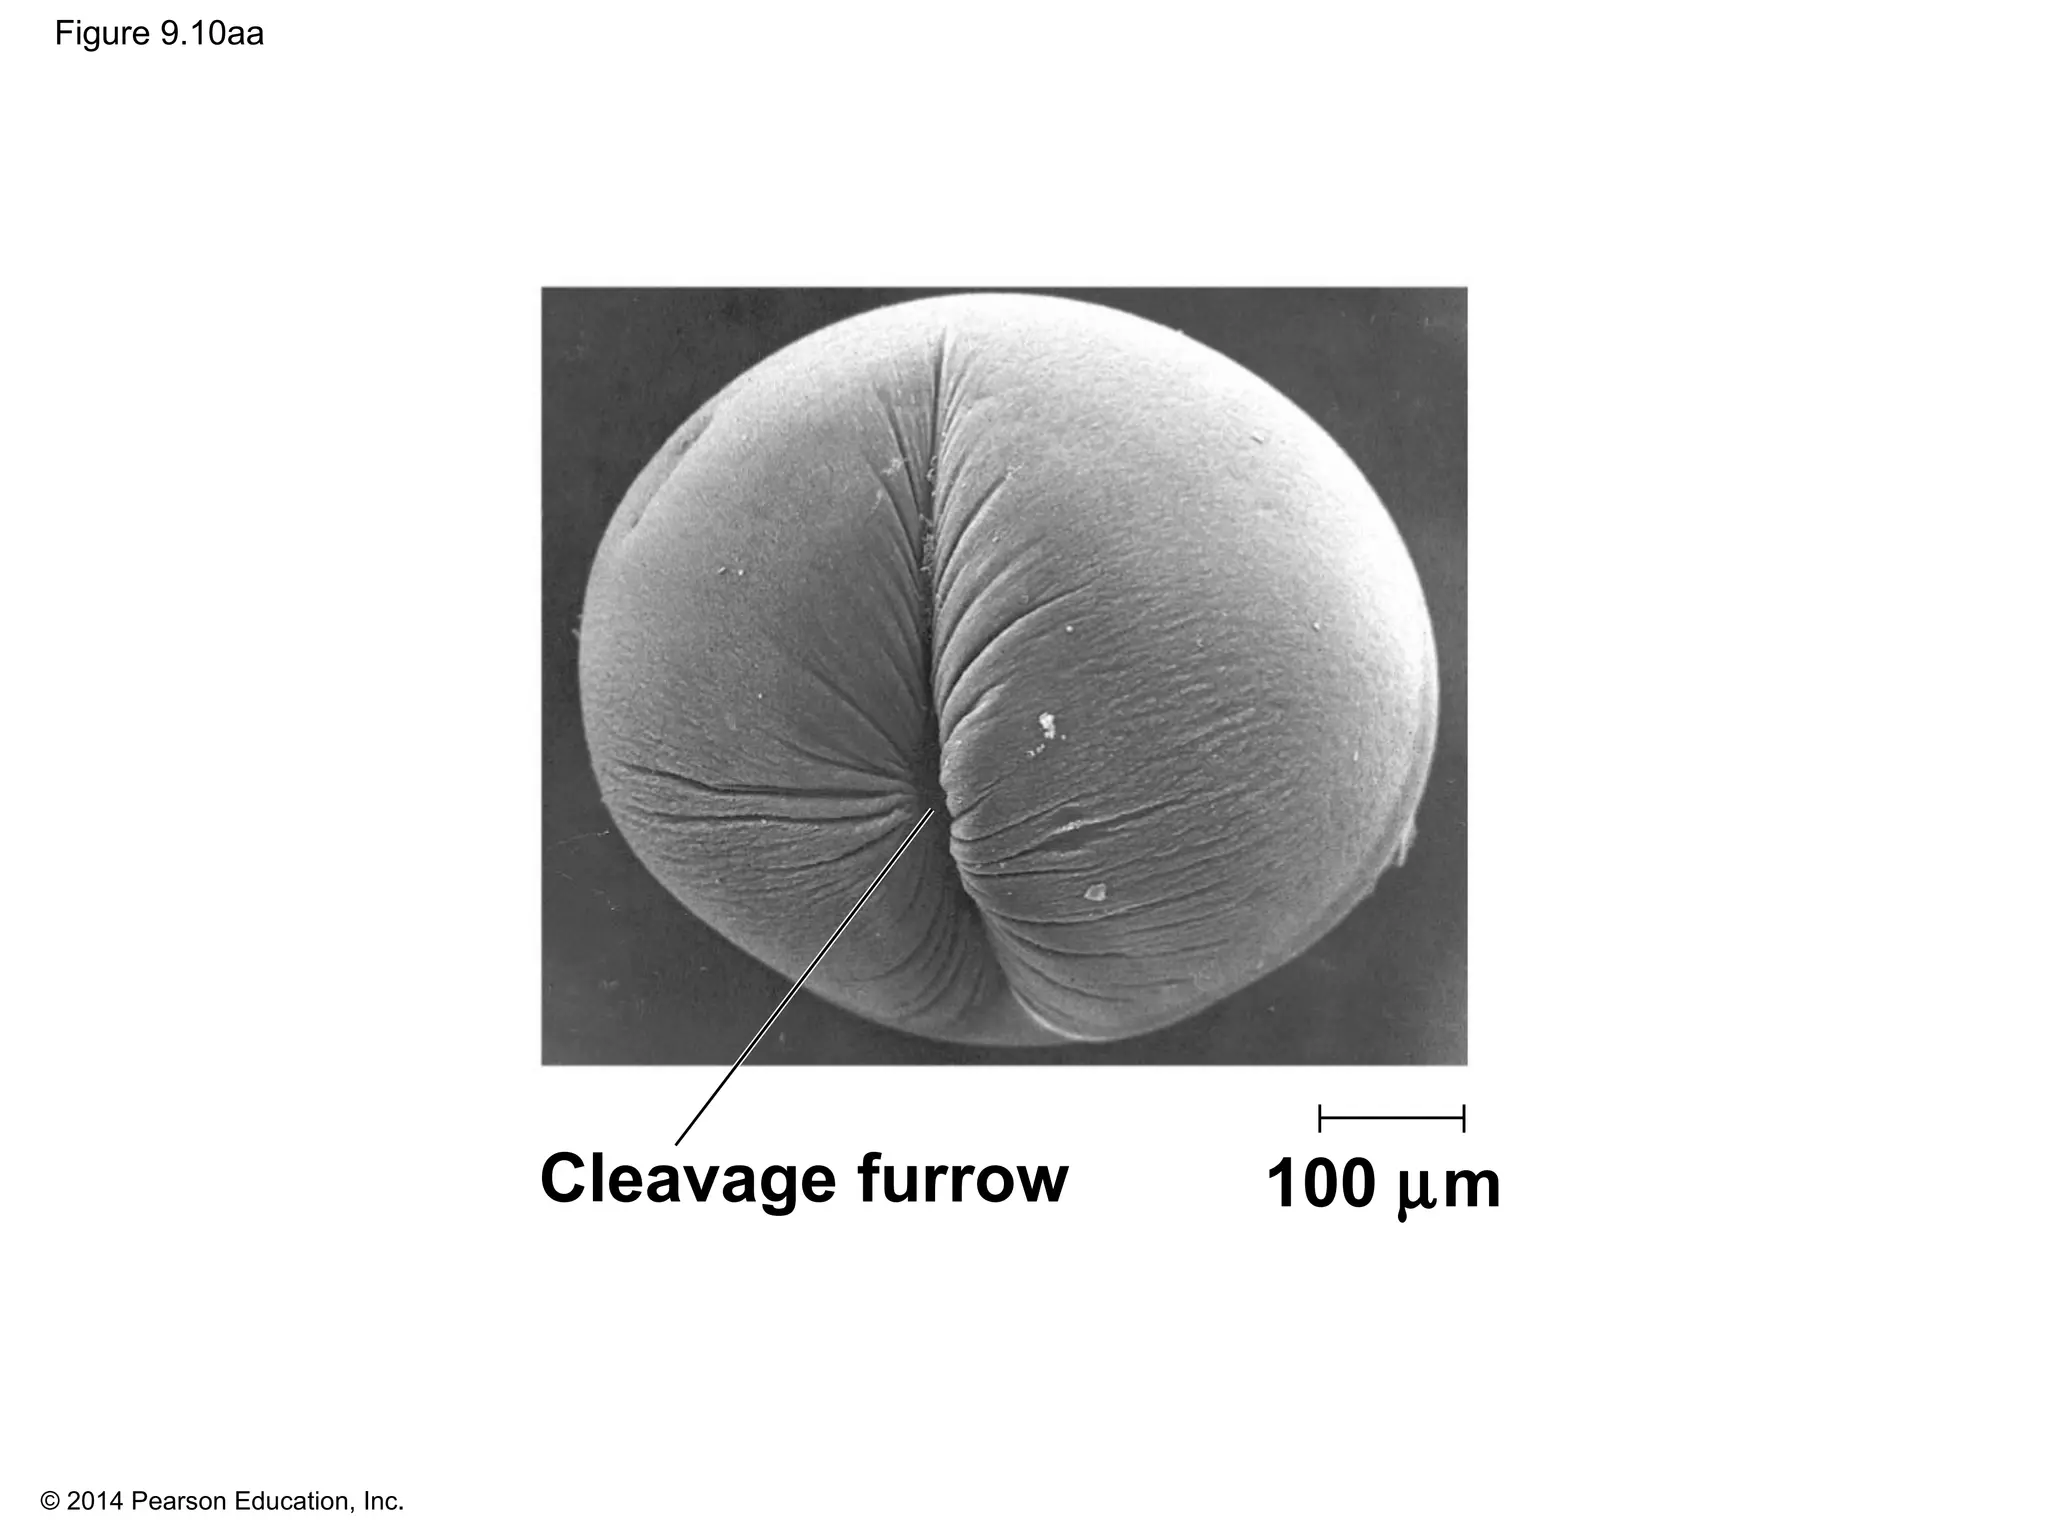
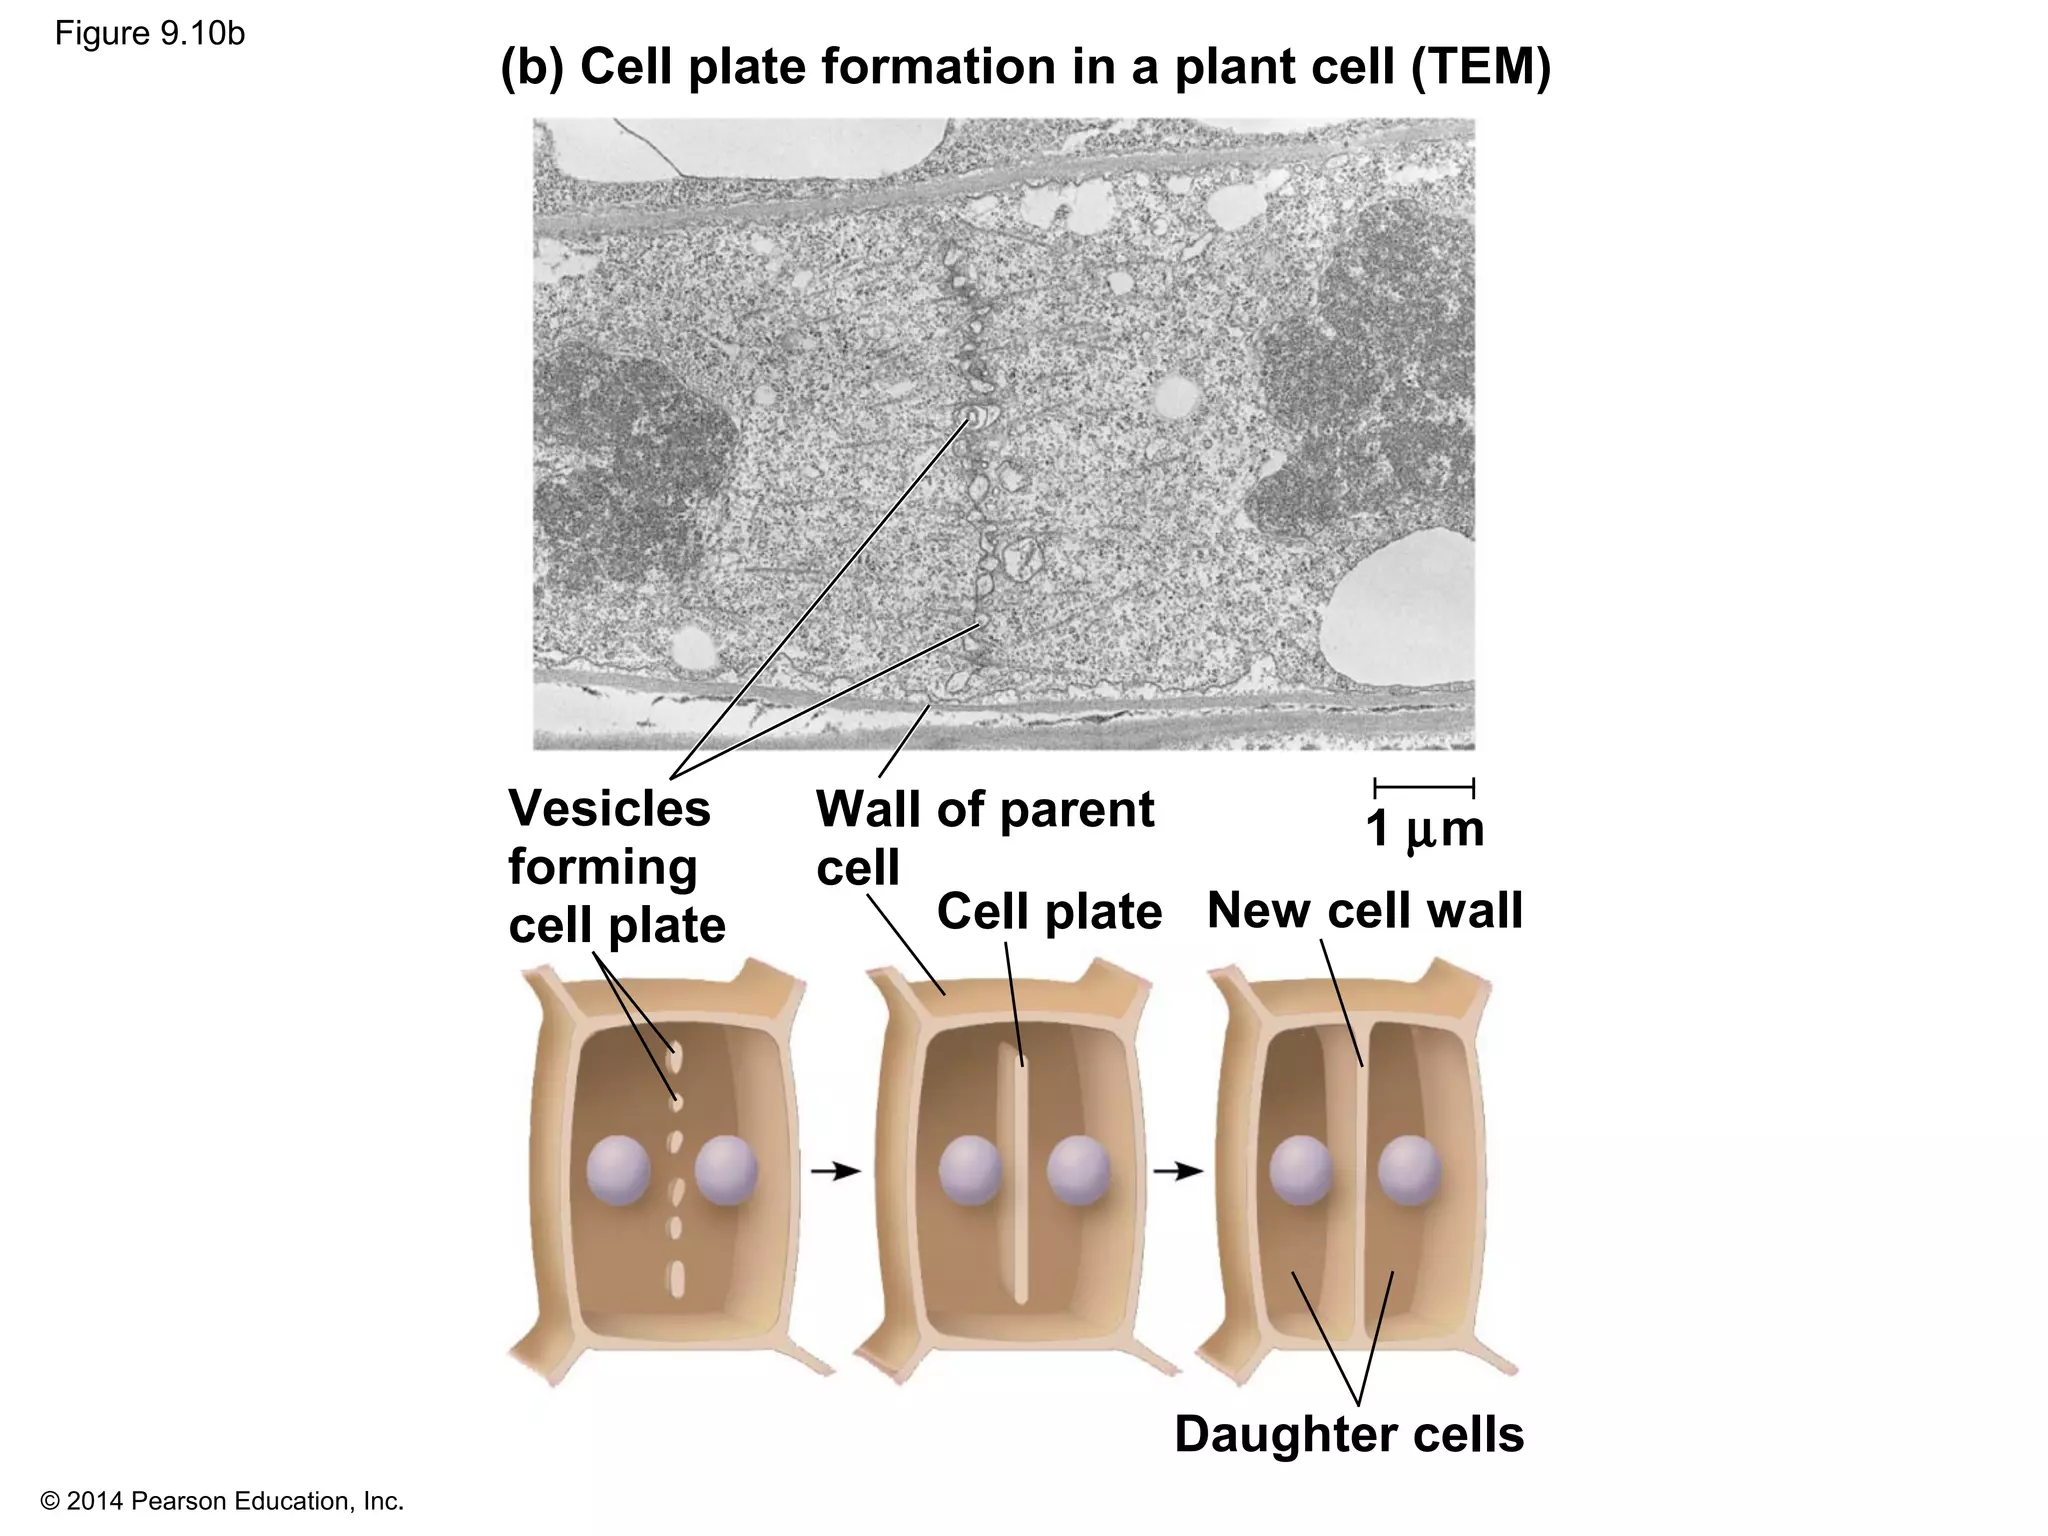
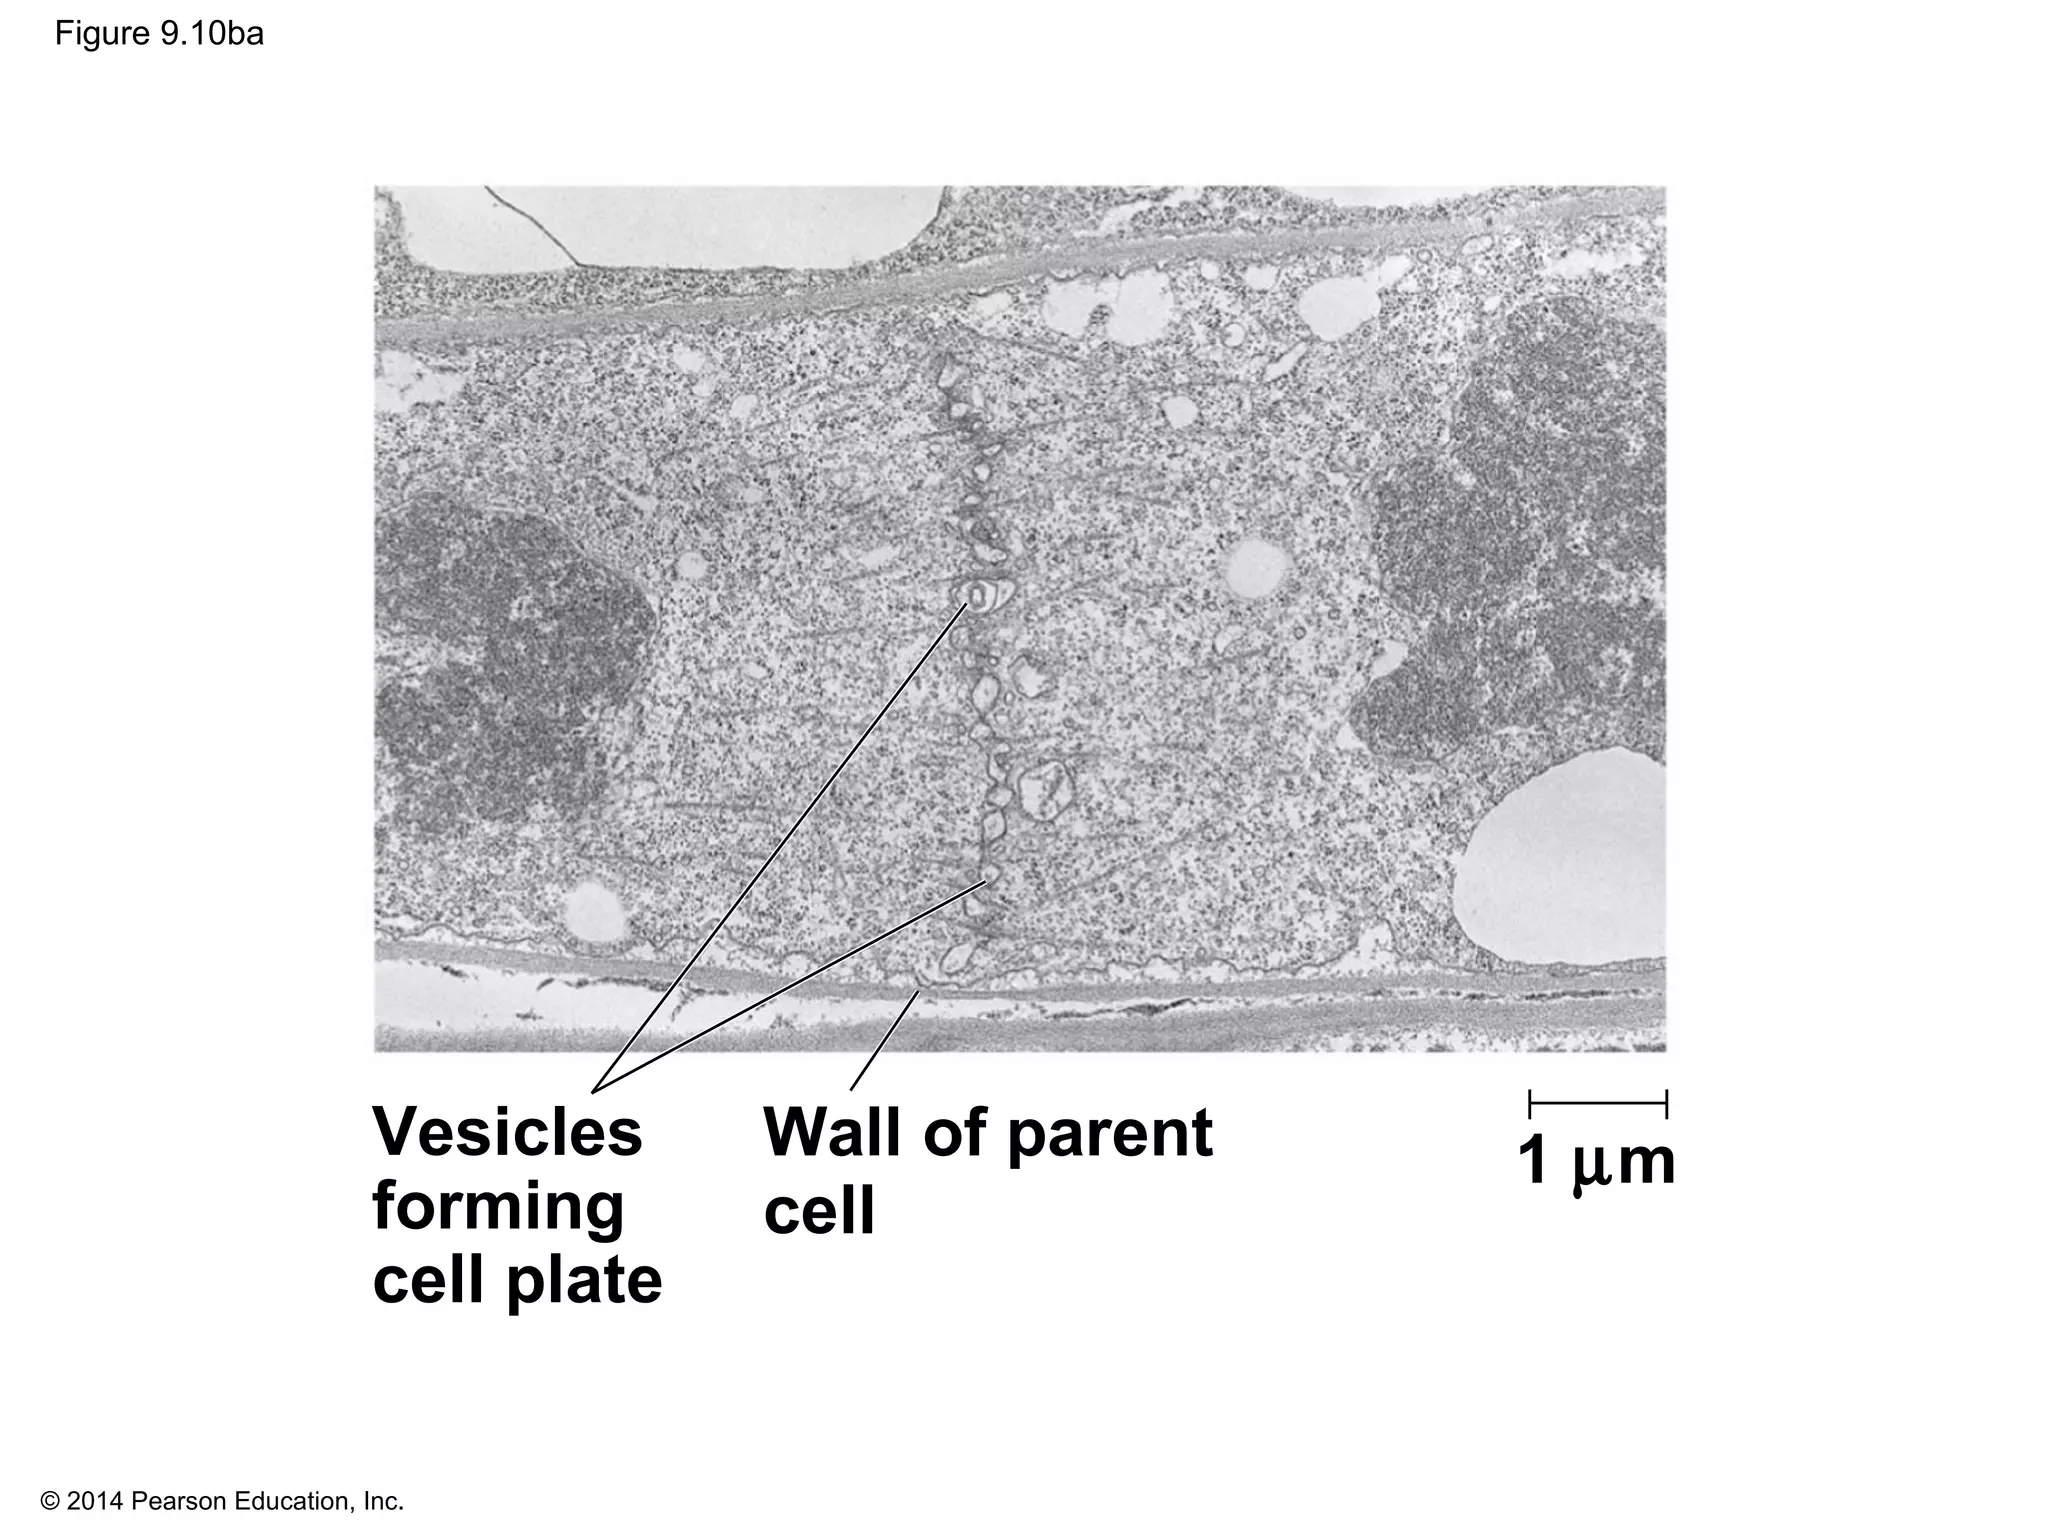
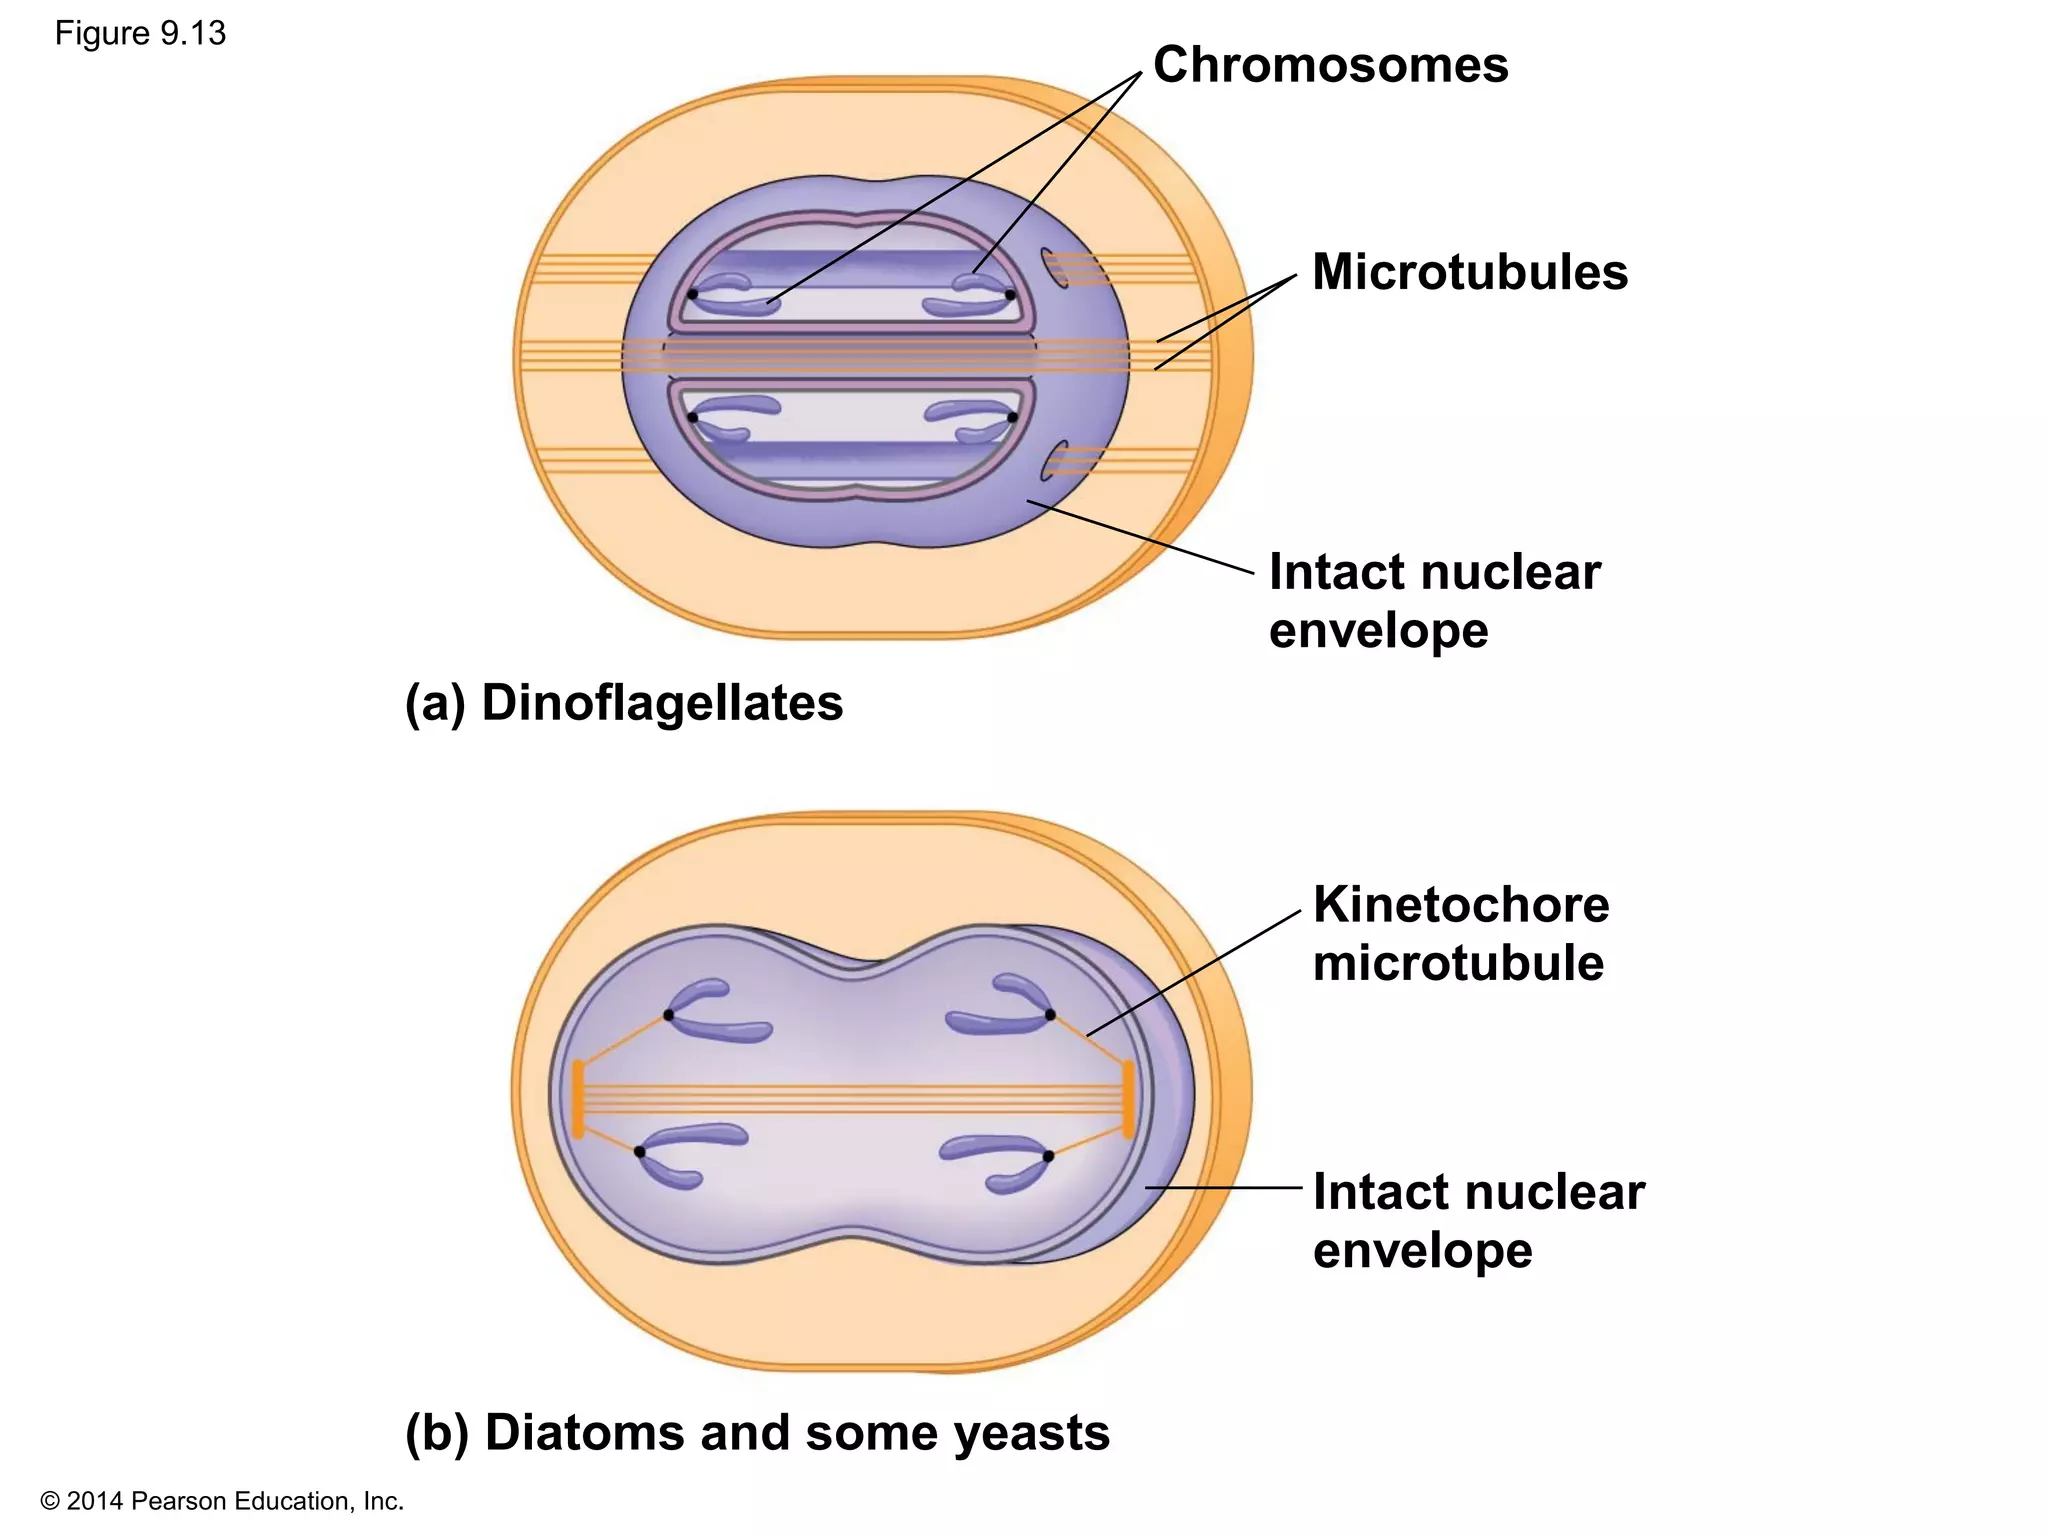
2) In eukaryotes, cell division results in two genetically identical daughter cells through mitosis and cytokinesis. Mitosis ensures each cell receives one copy of each chromosome, while cytokinesis physically separates the cytoplasmic components.
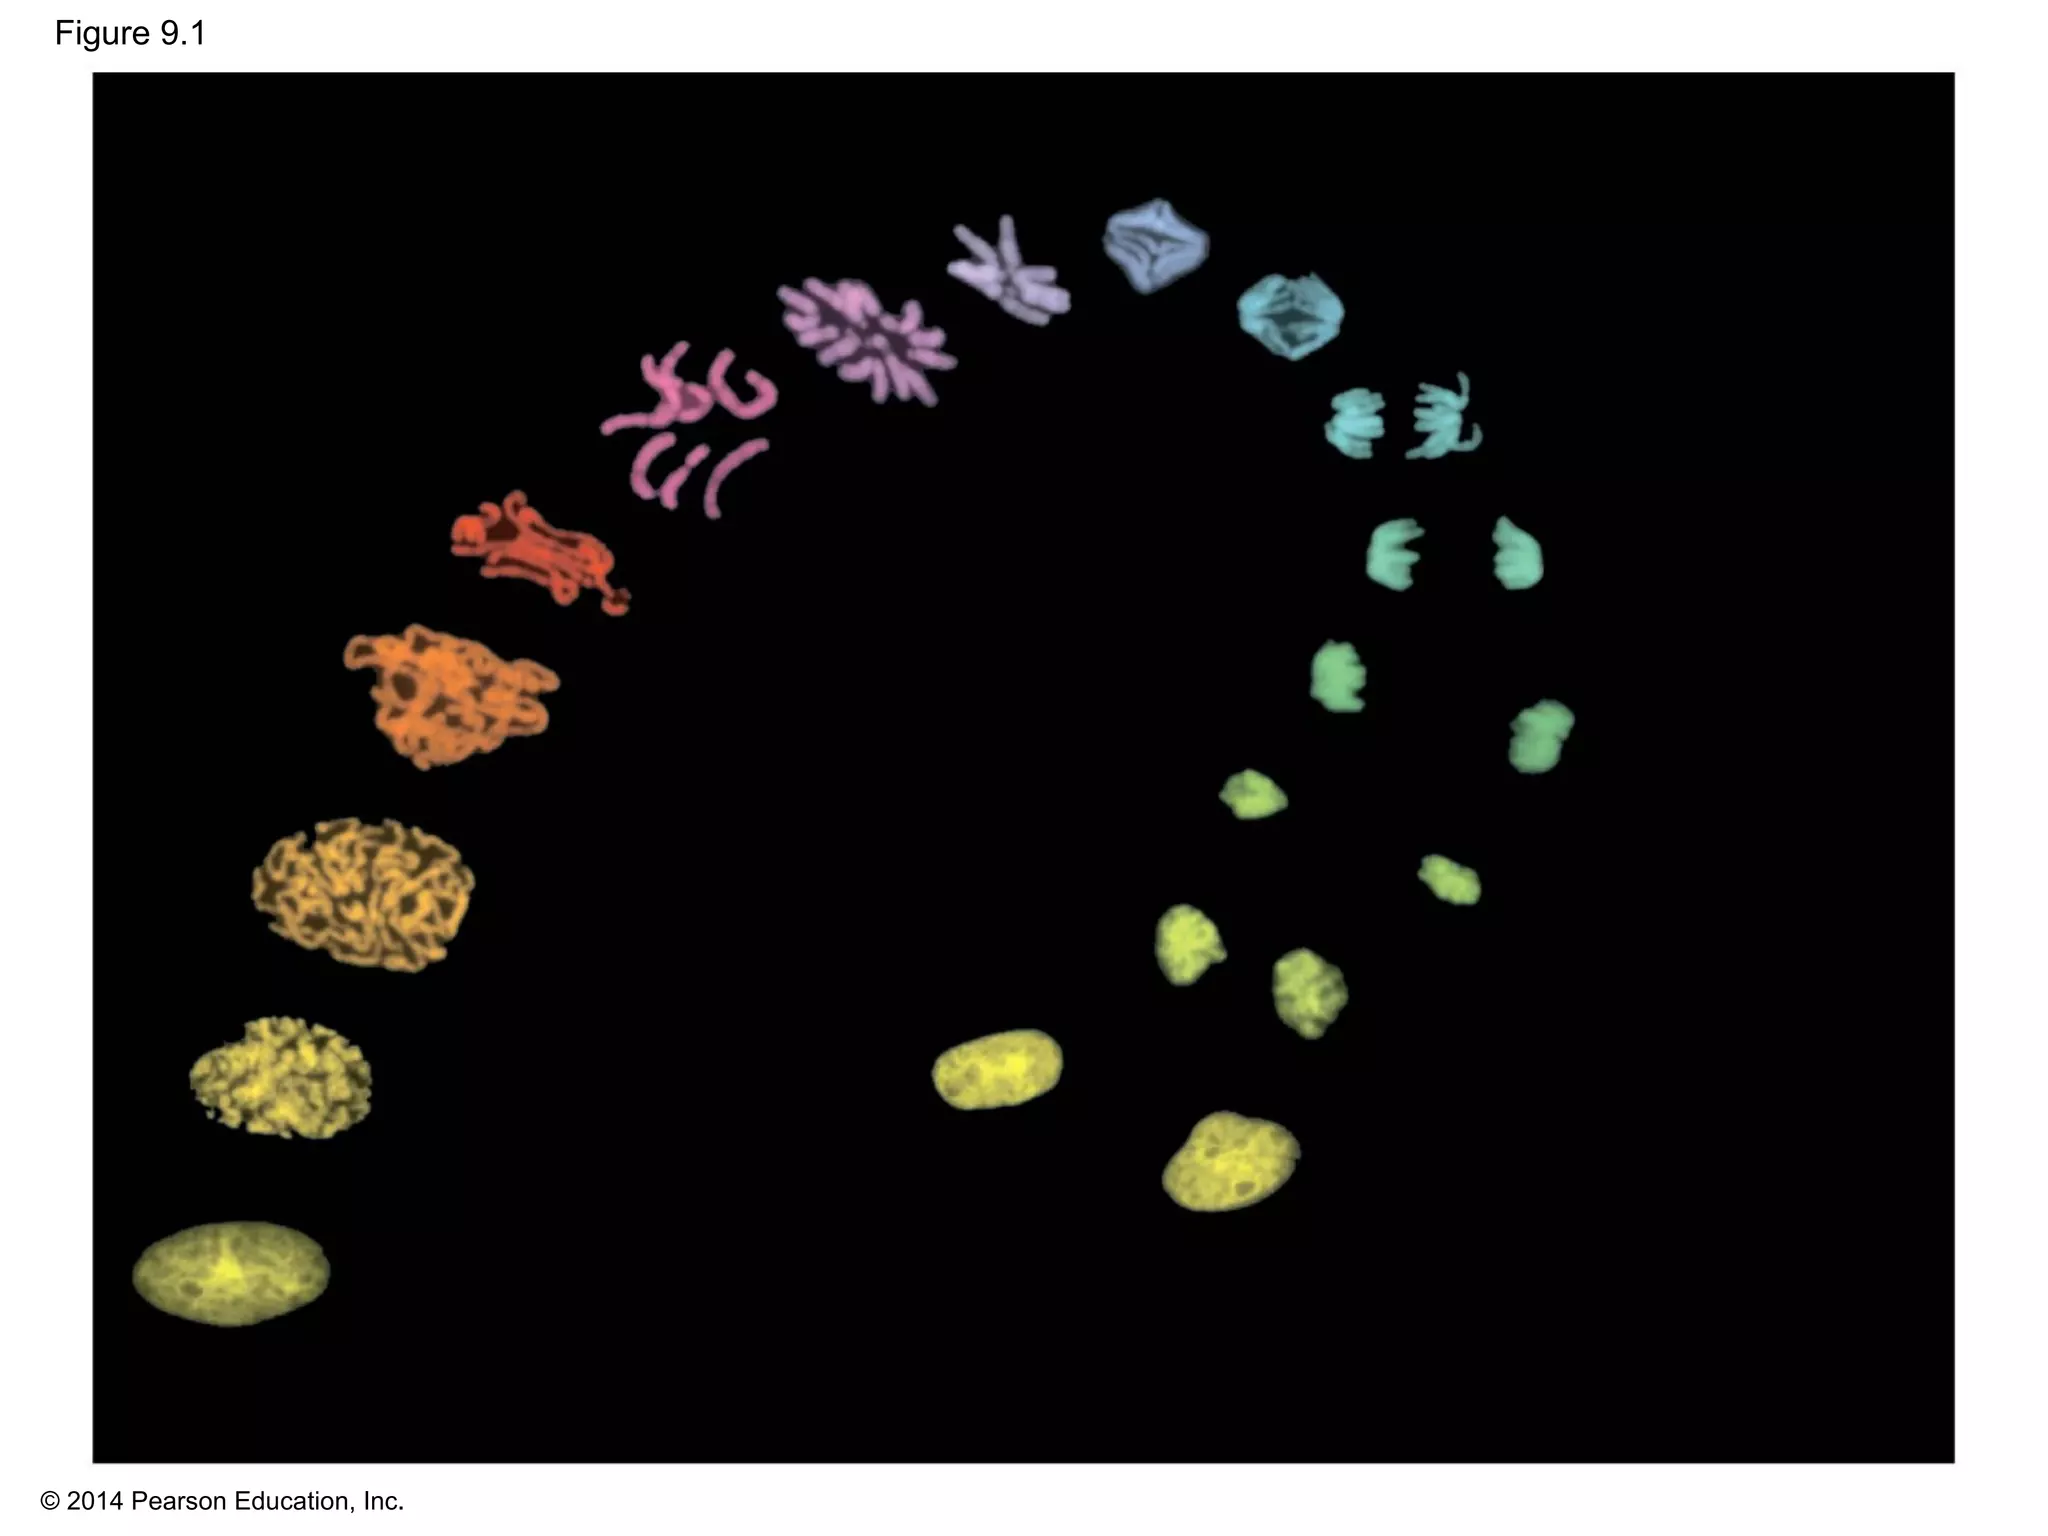
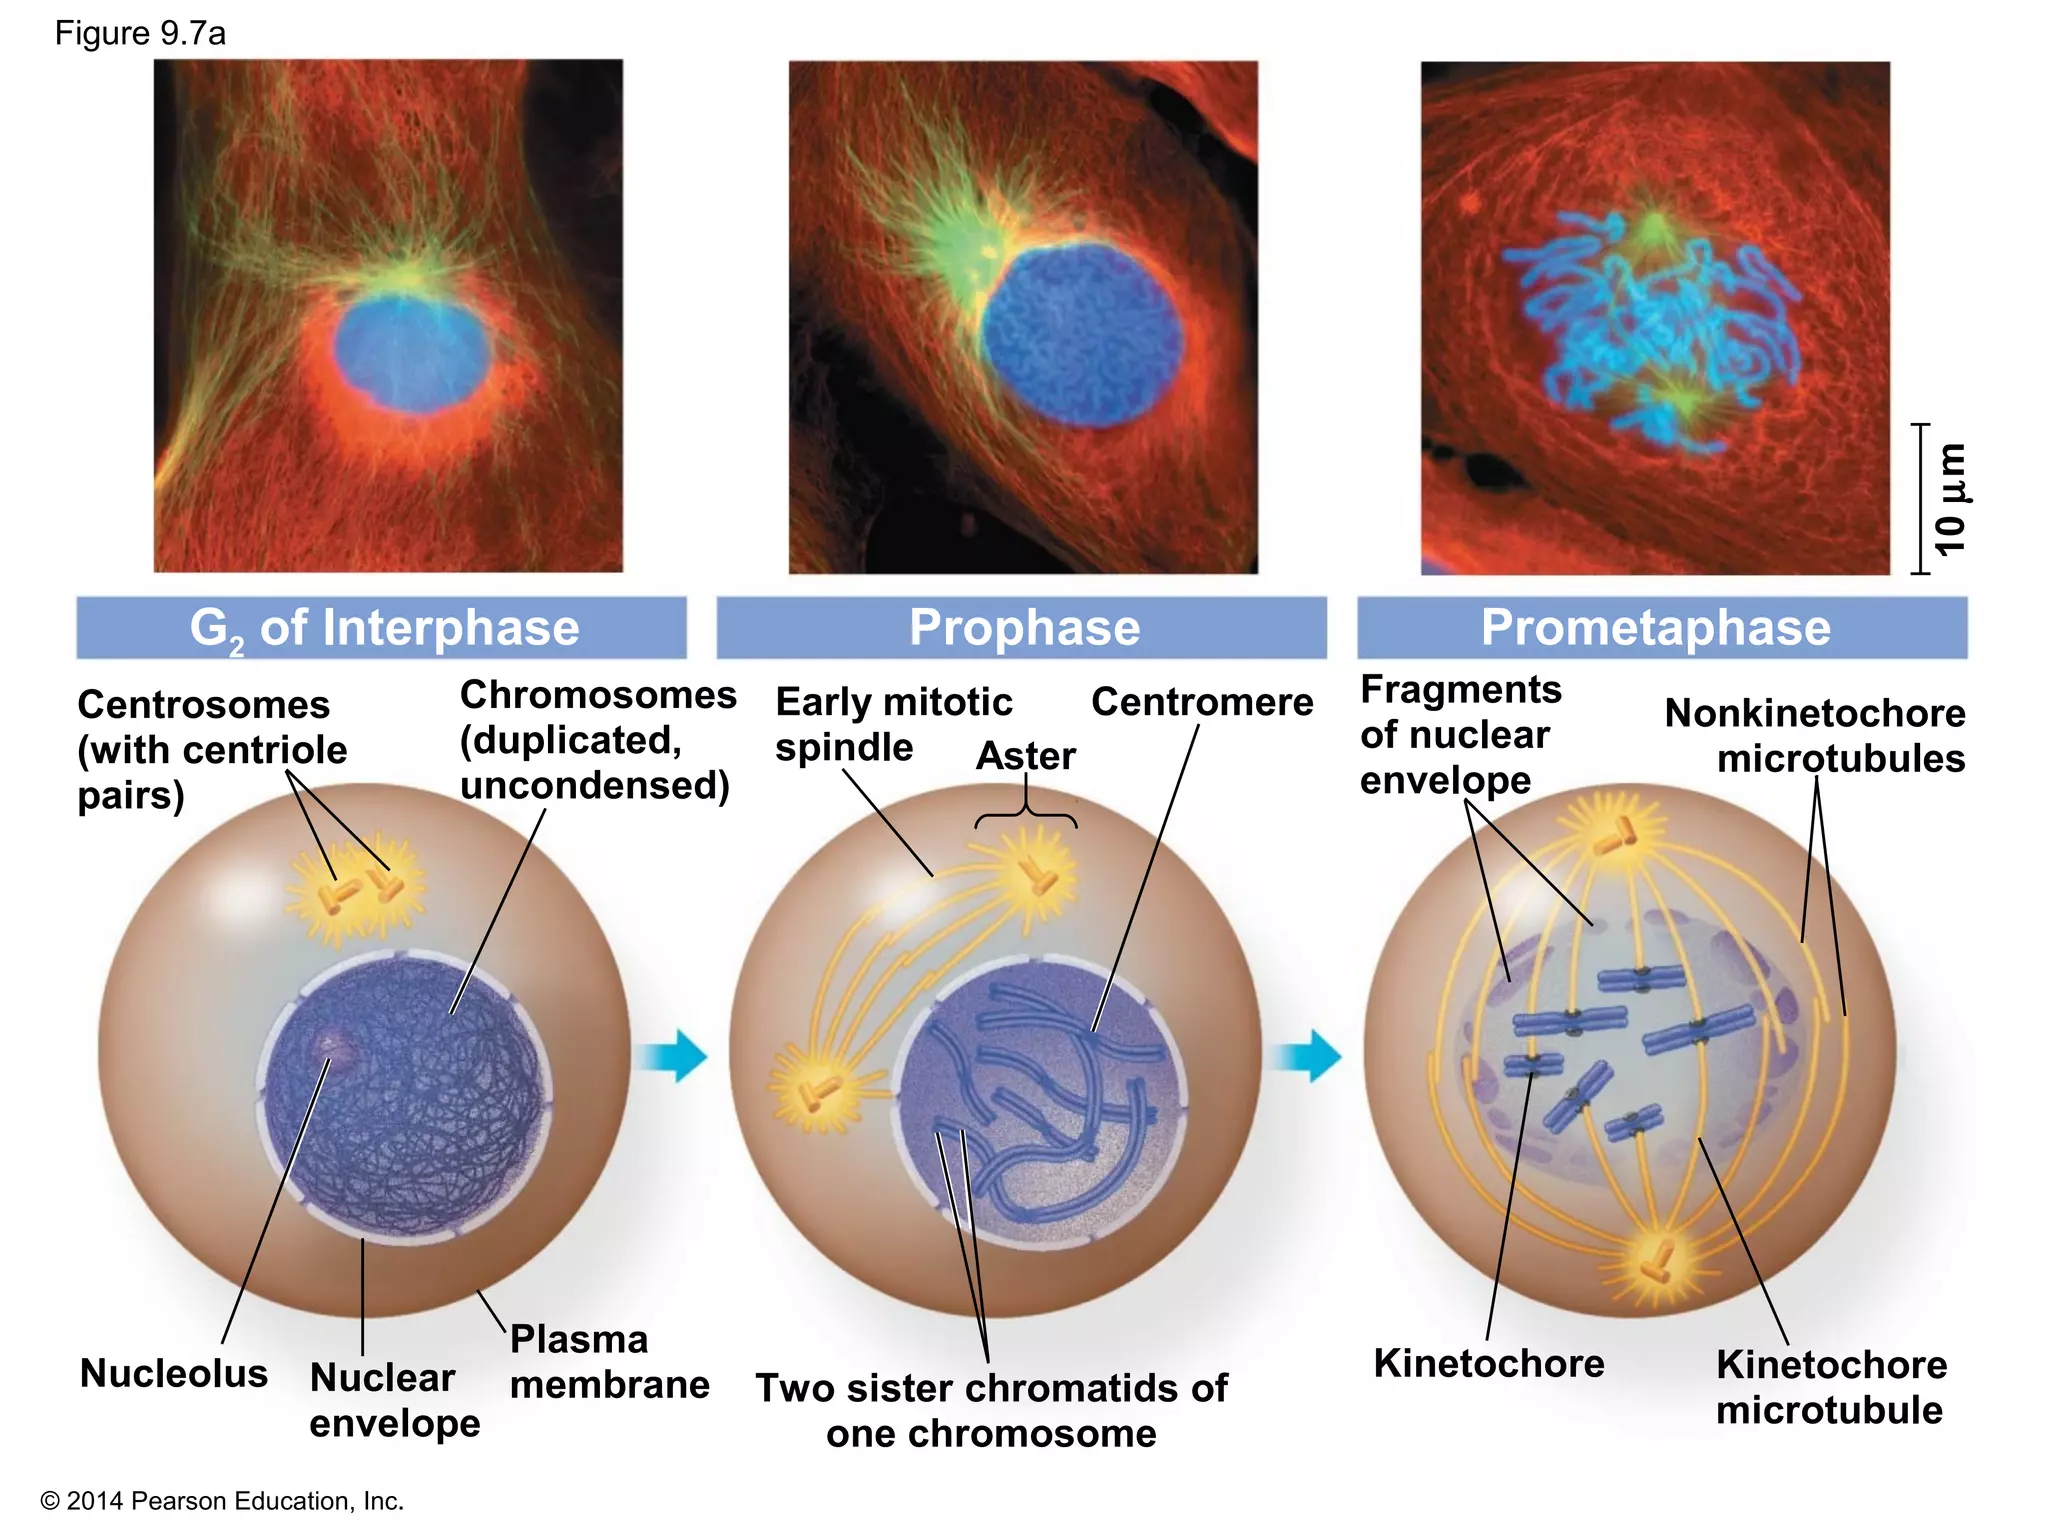
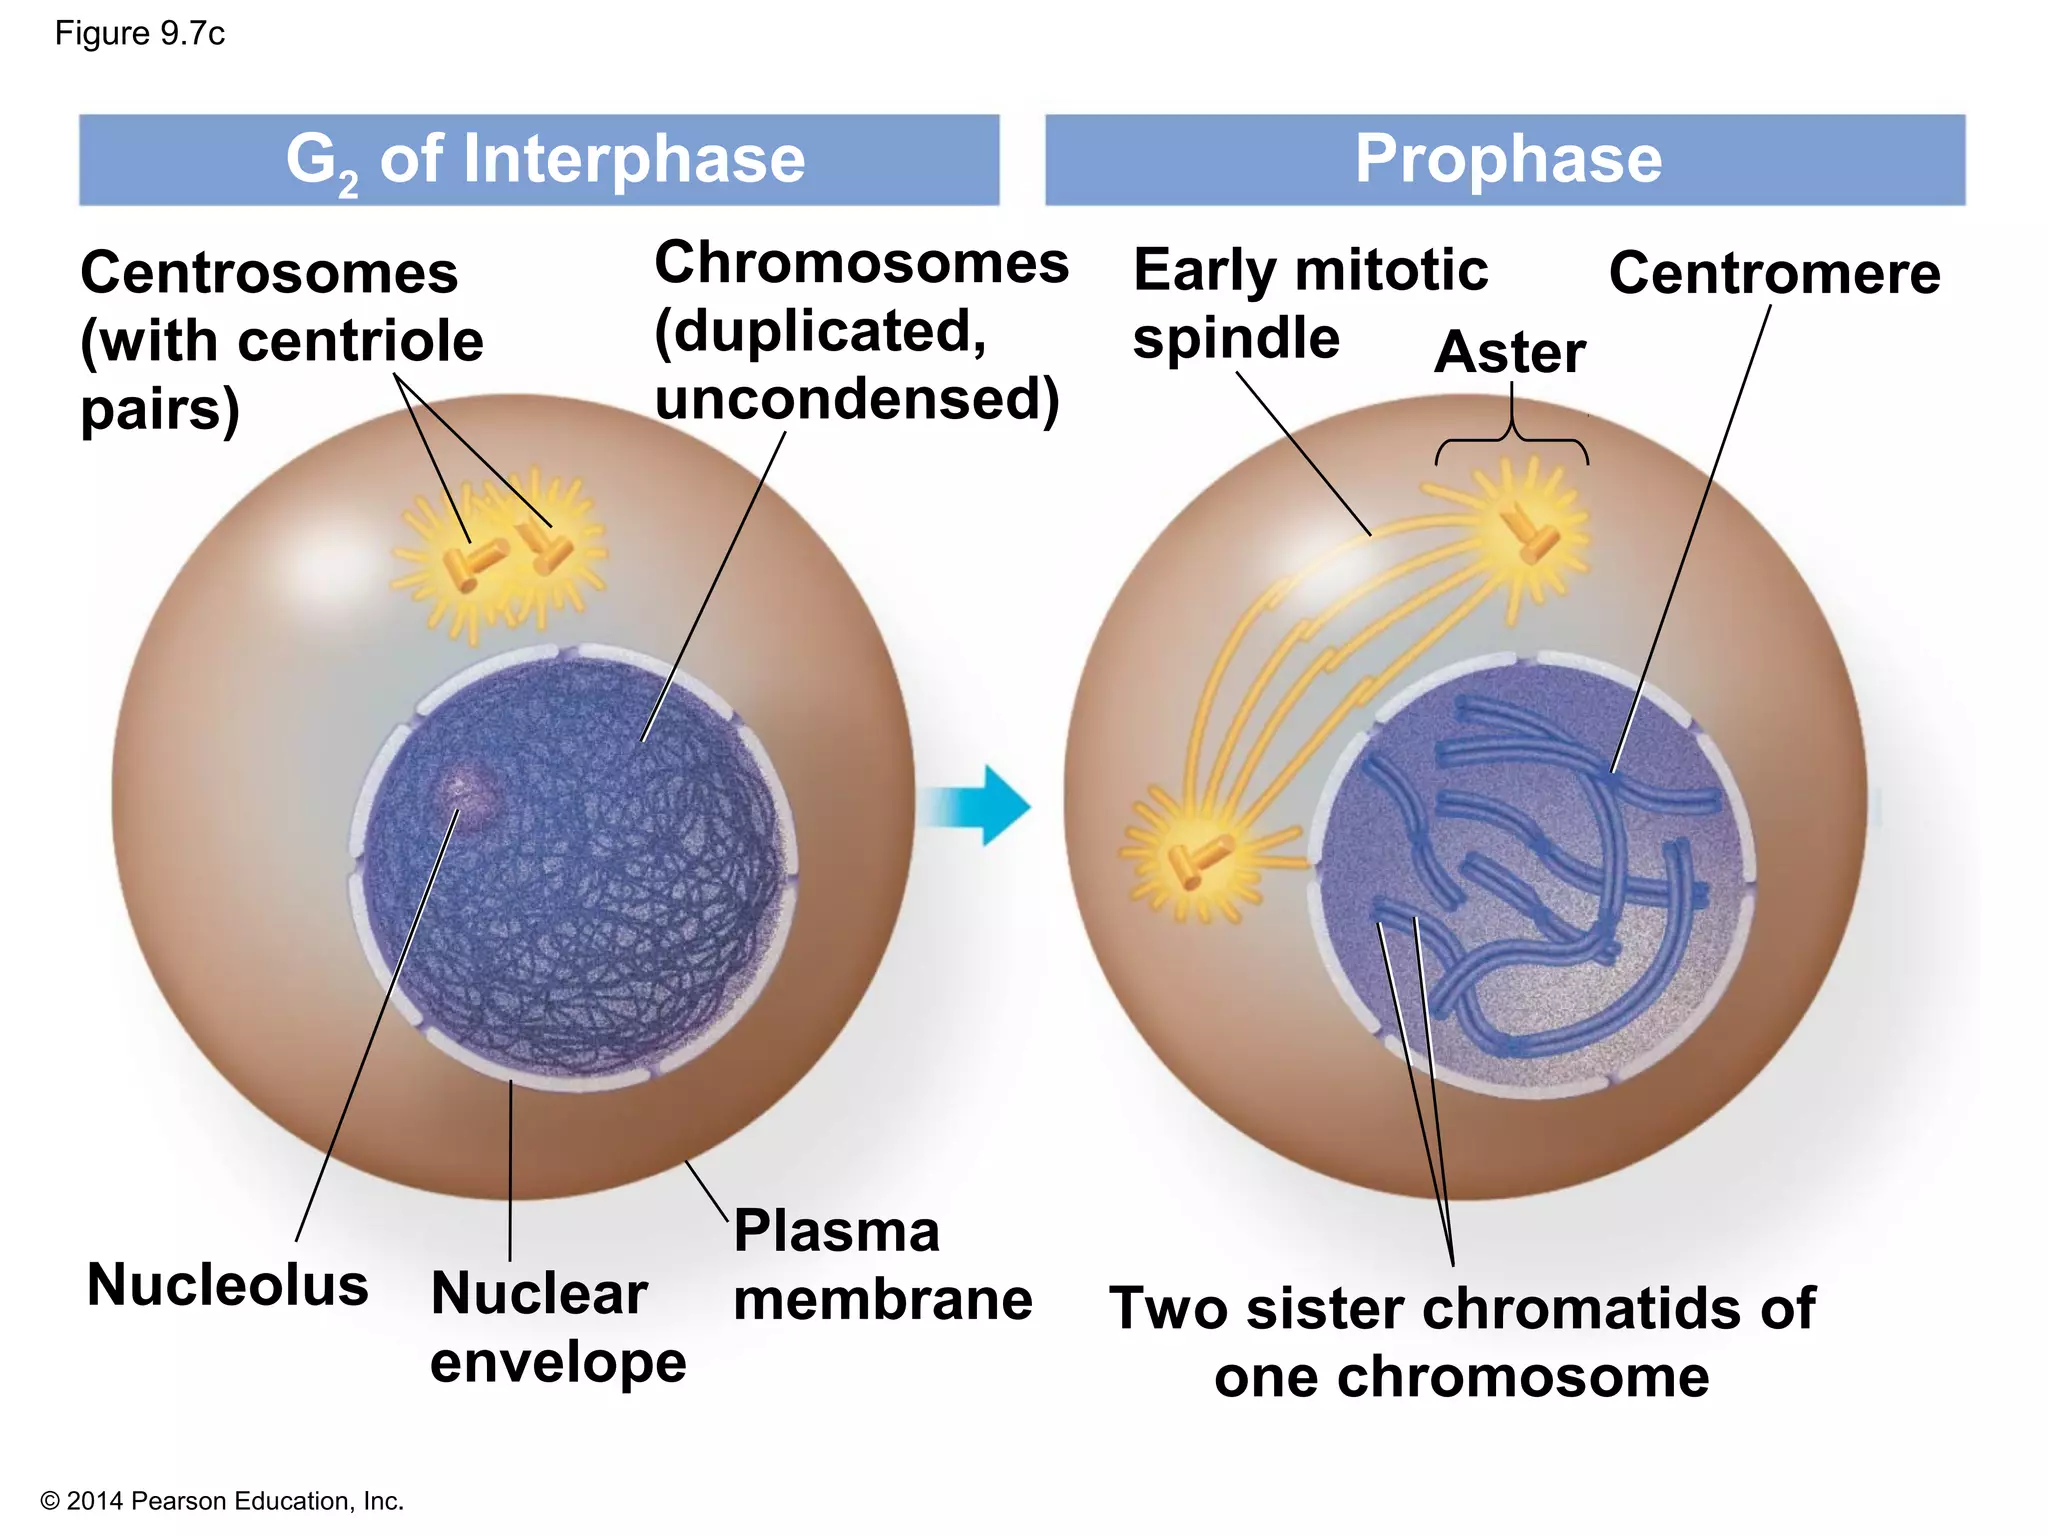
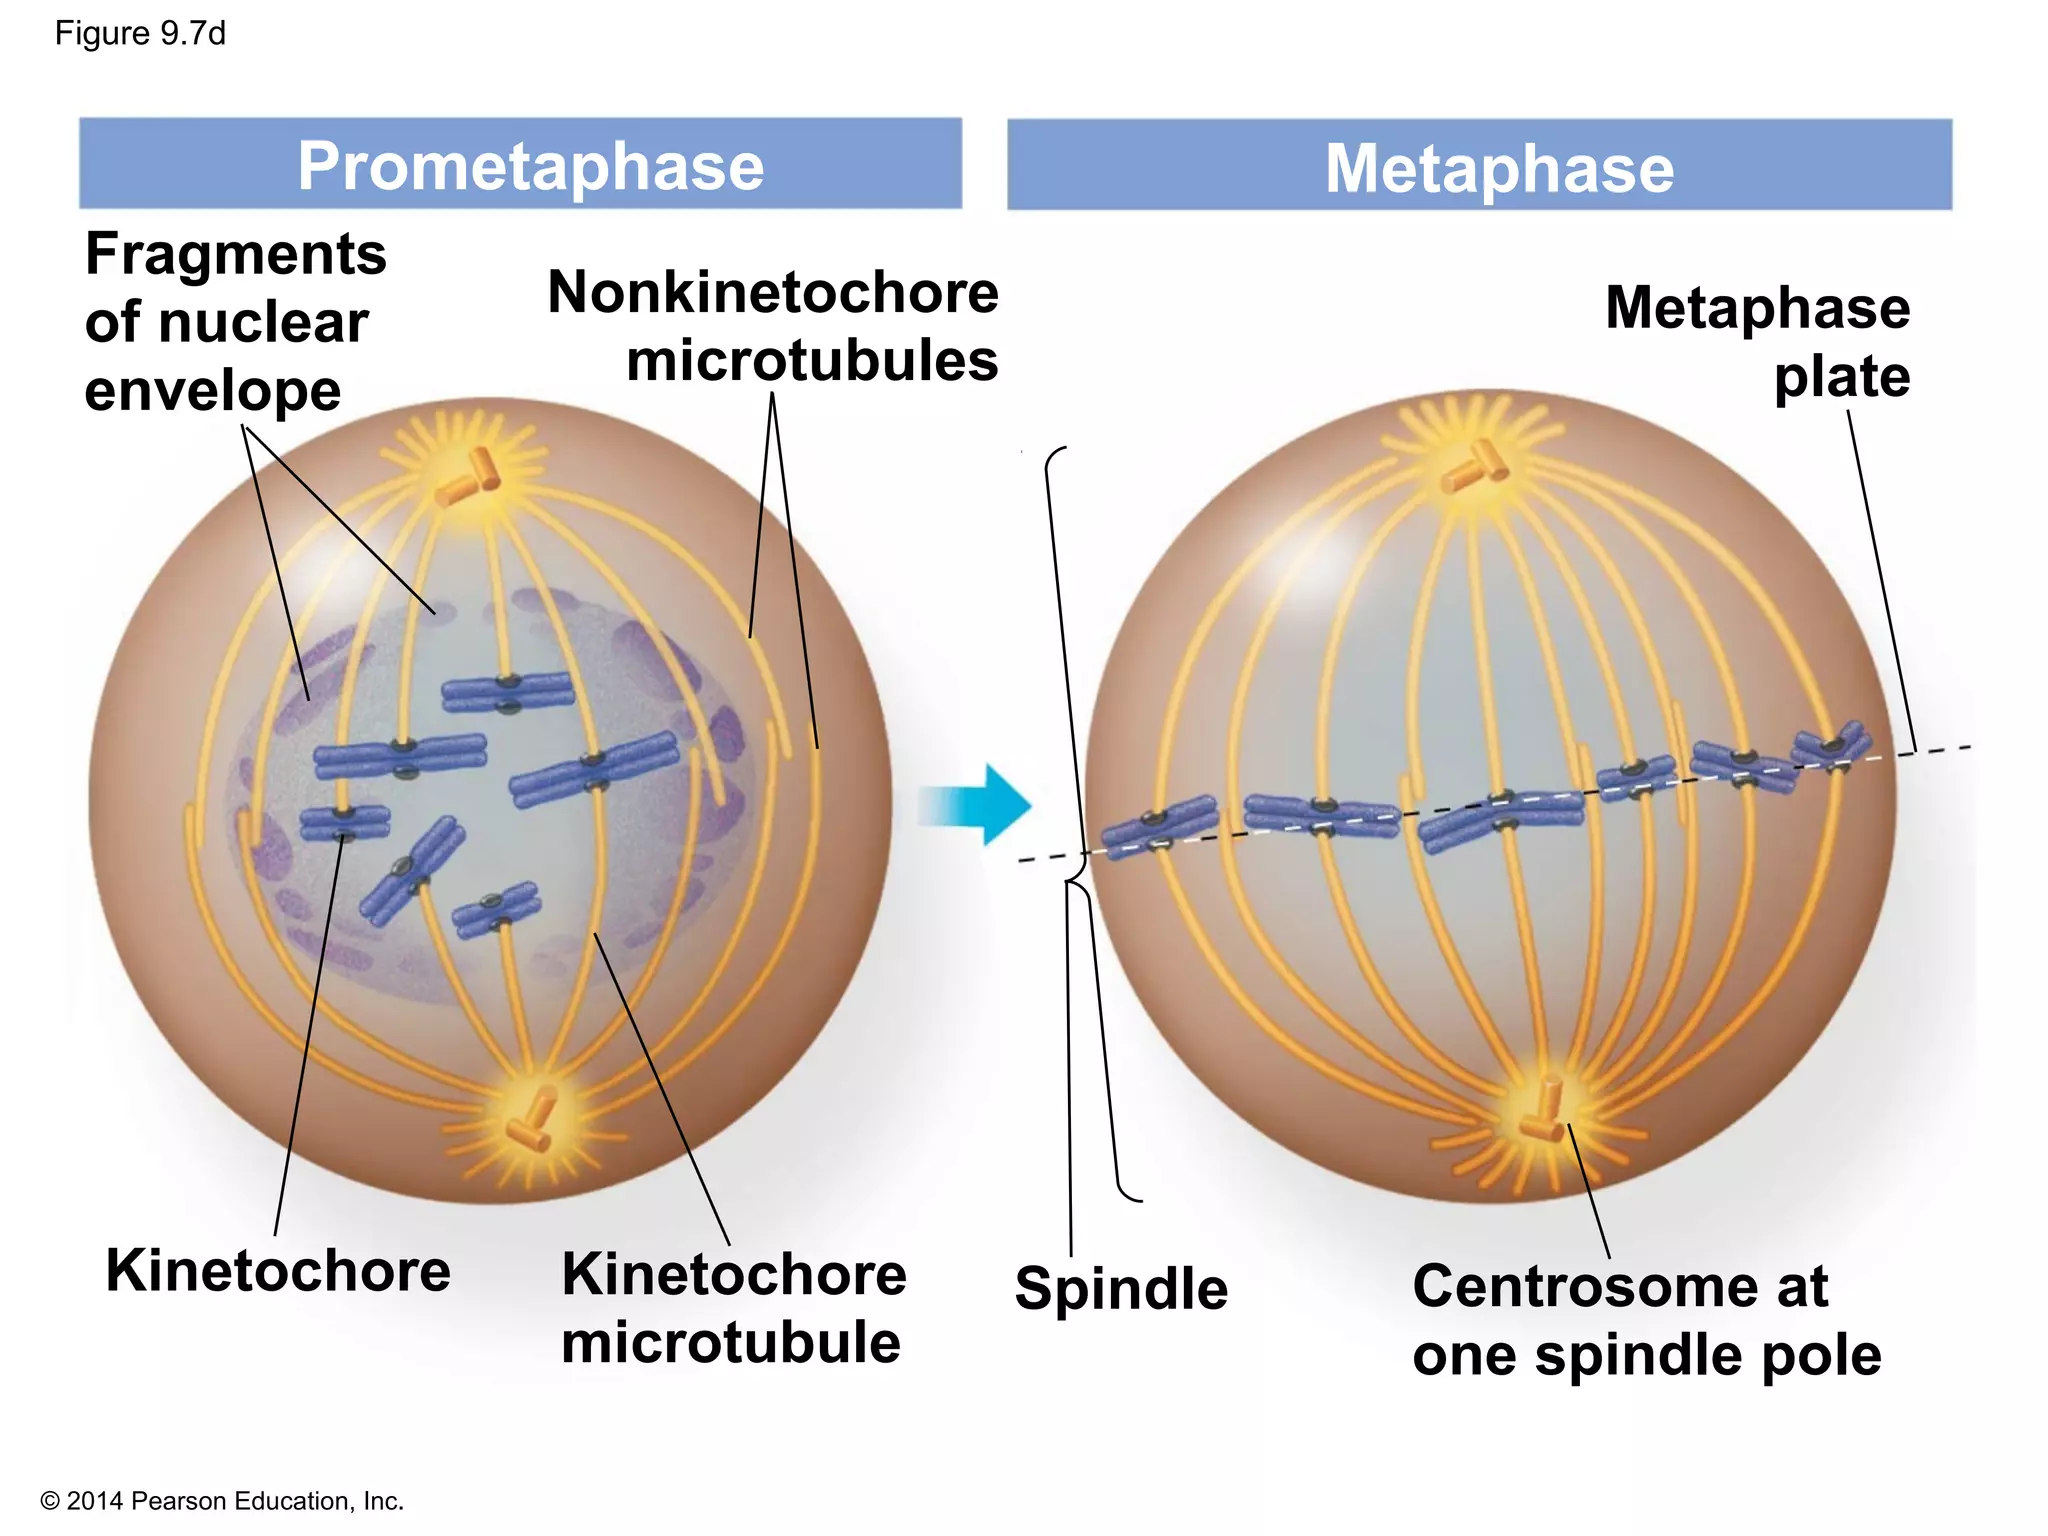
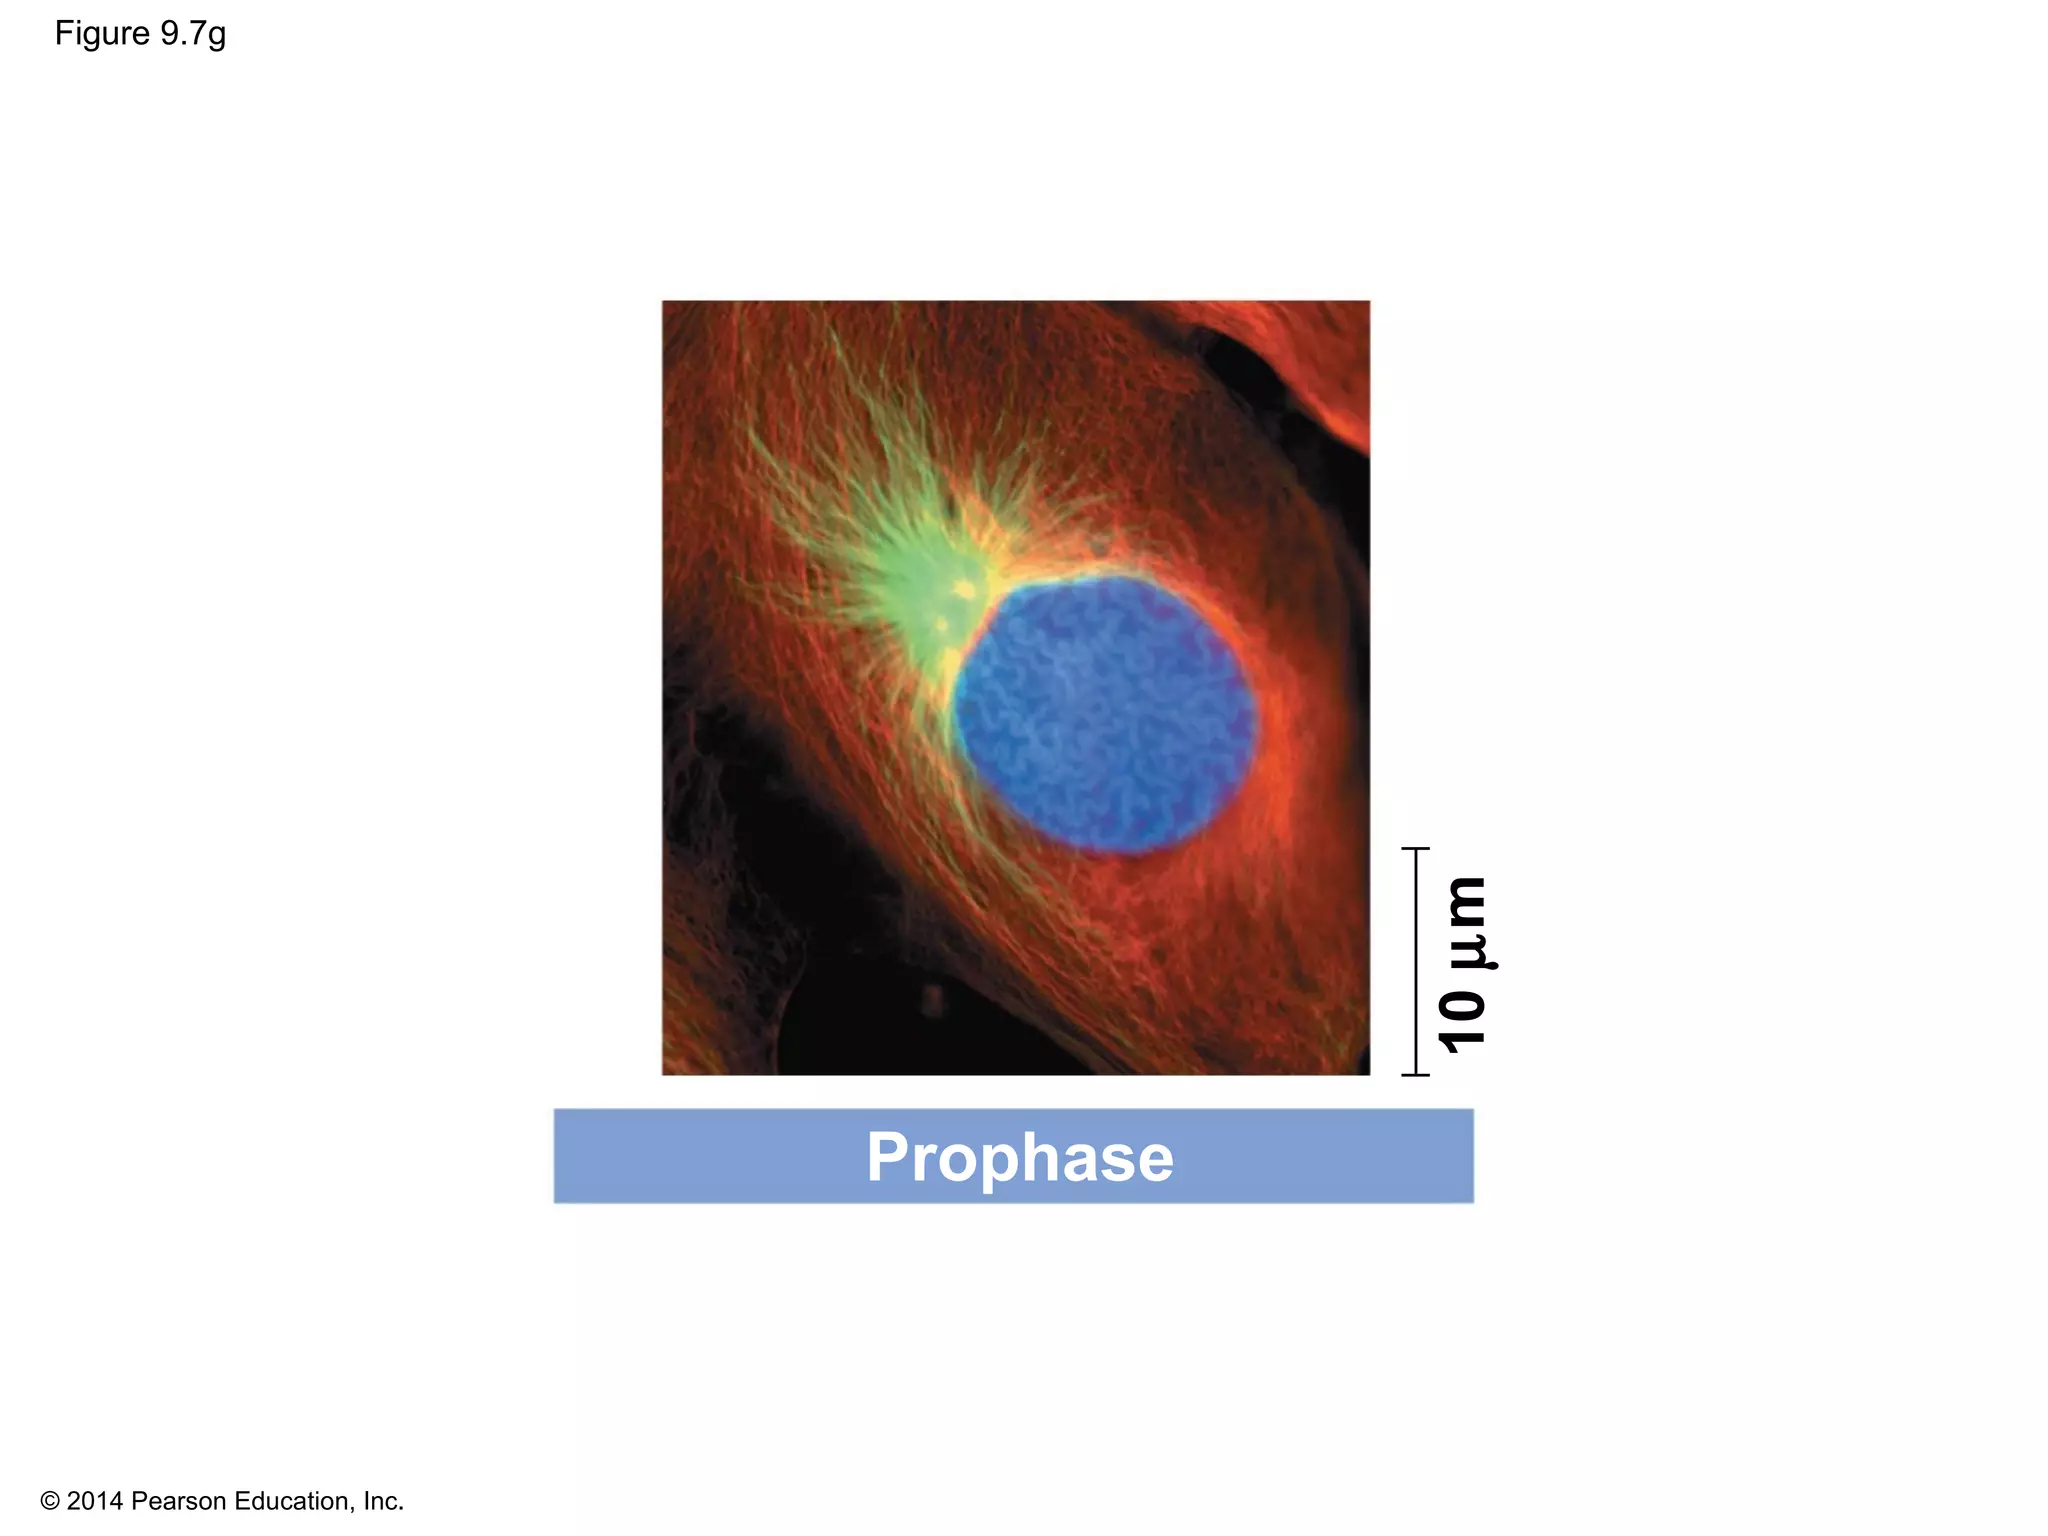
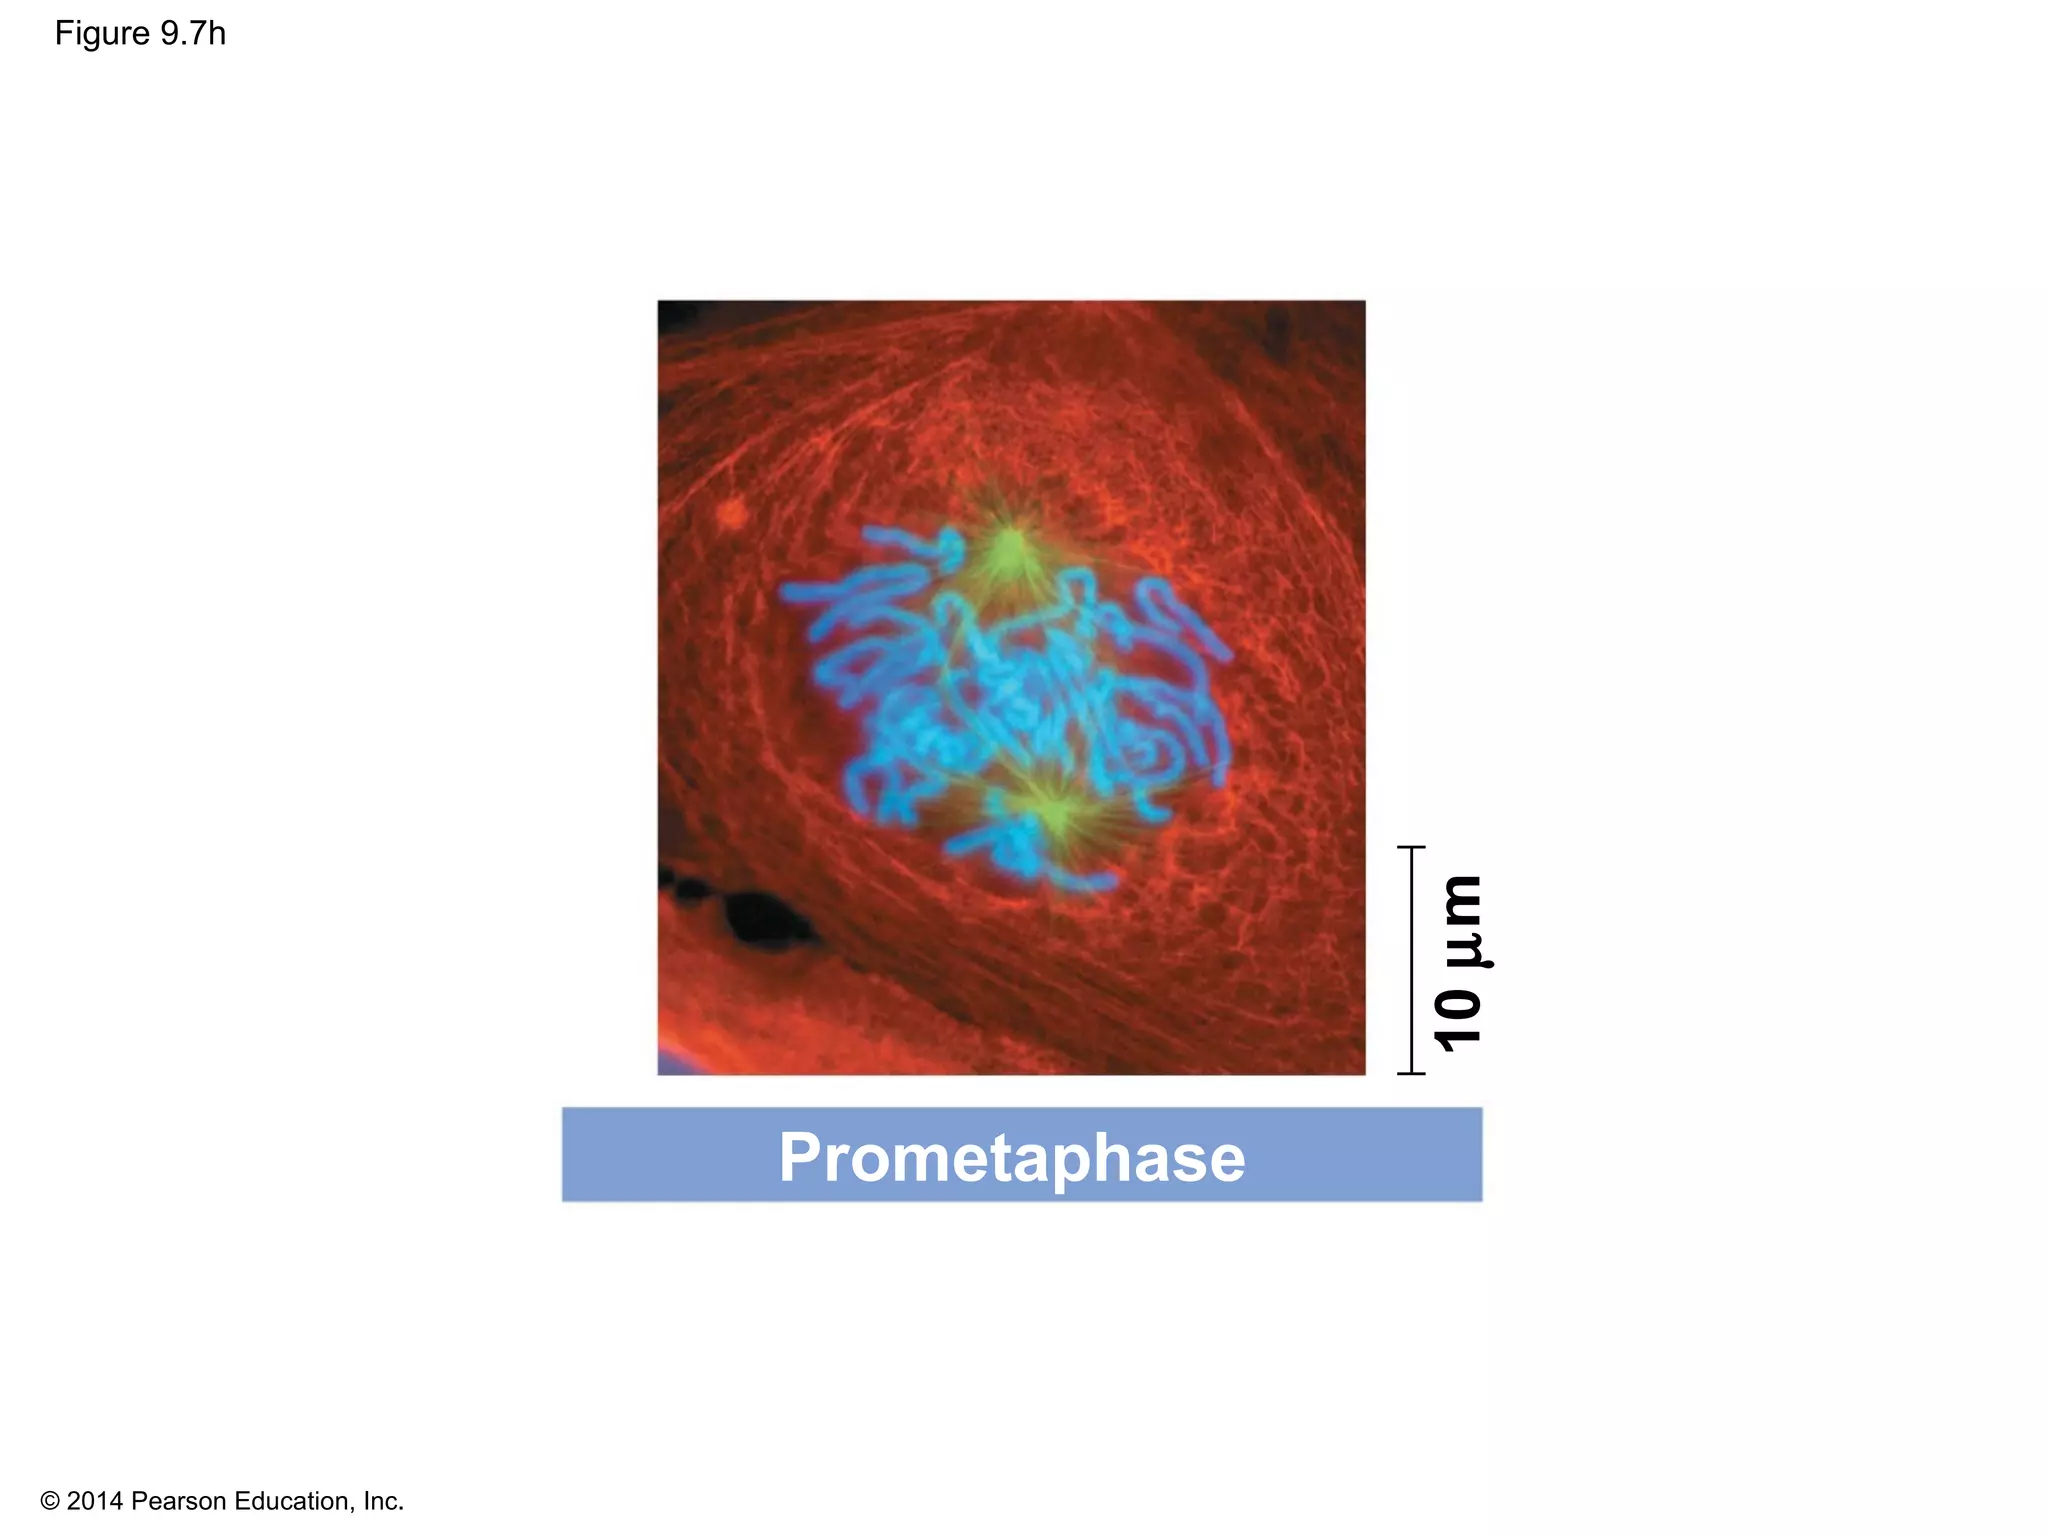
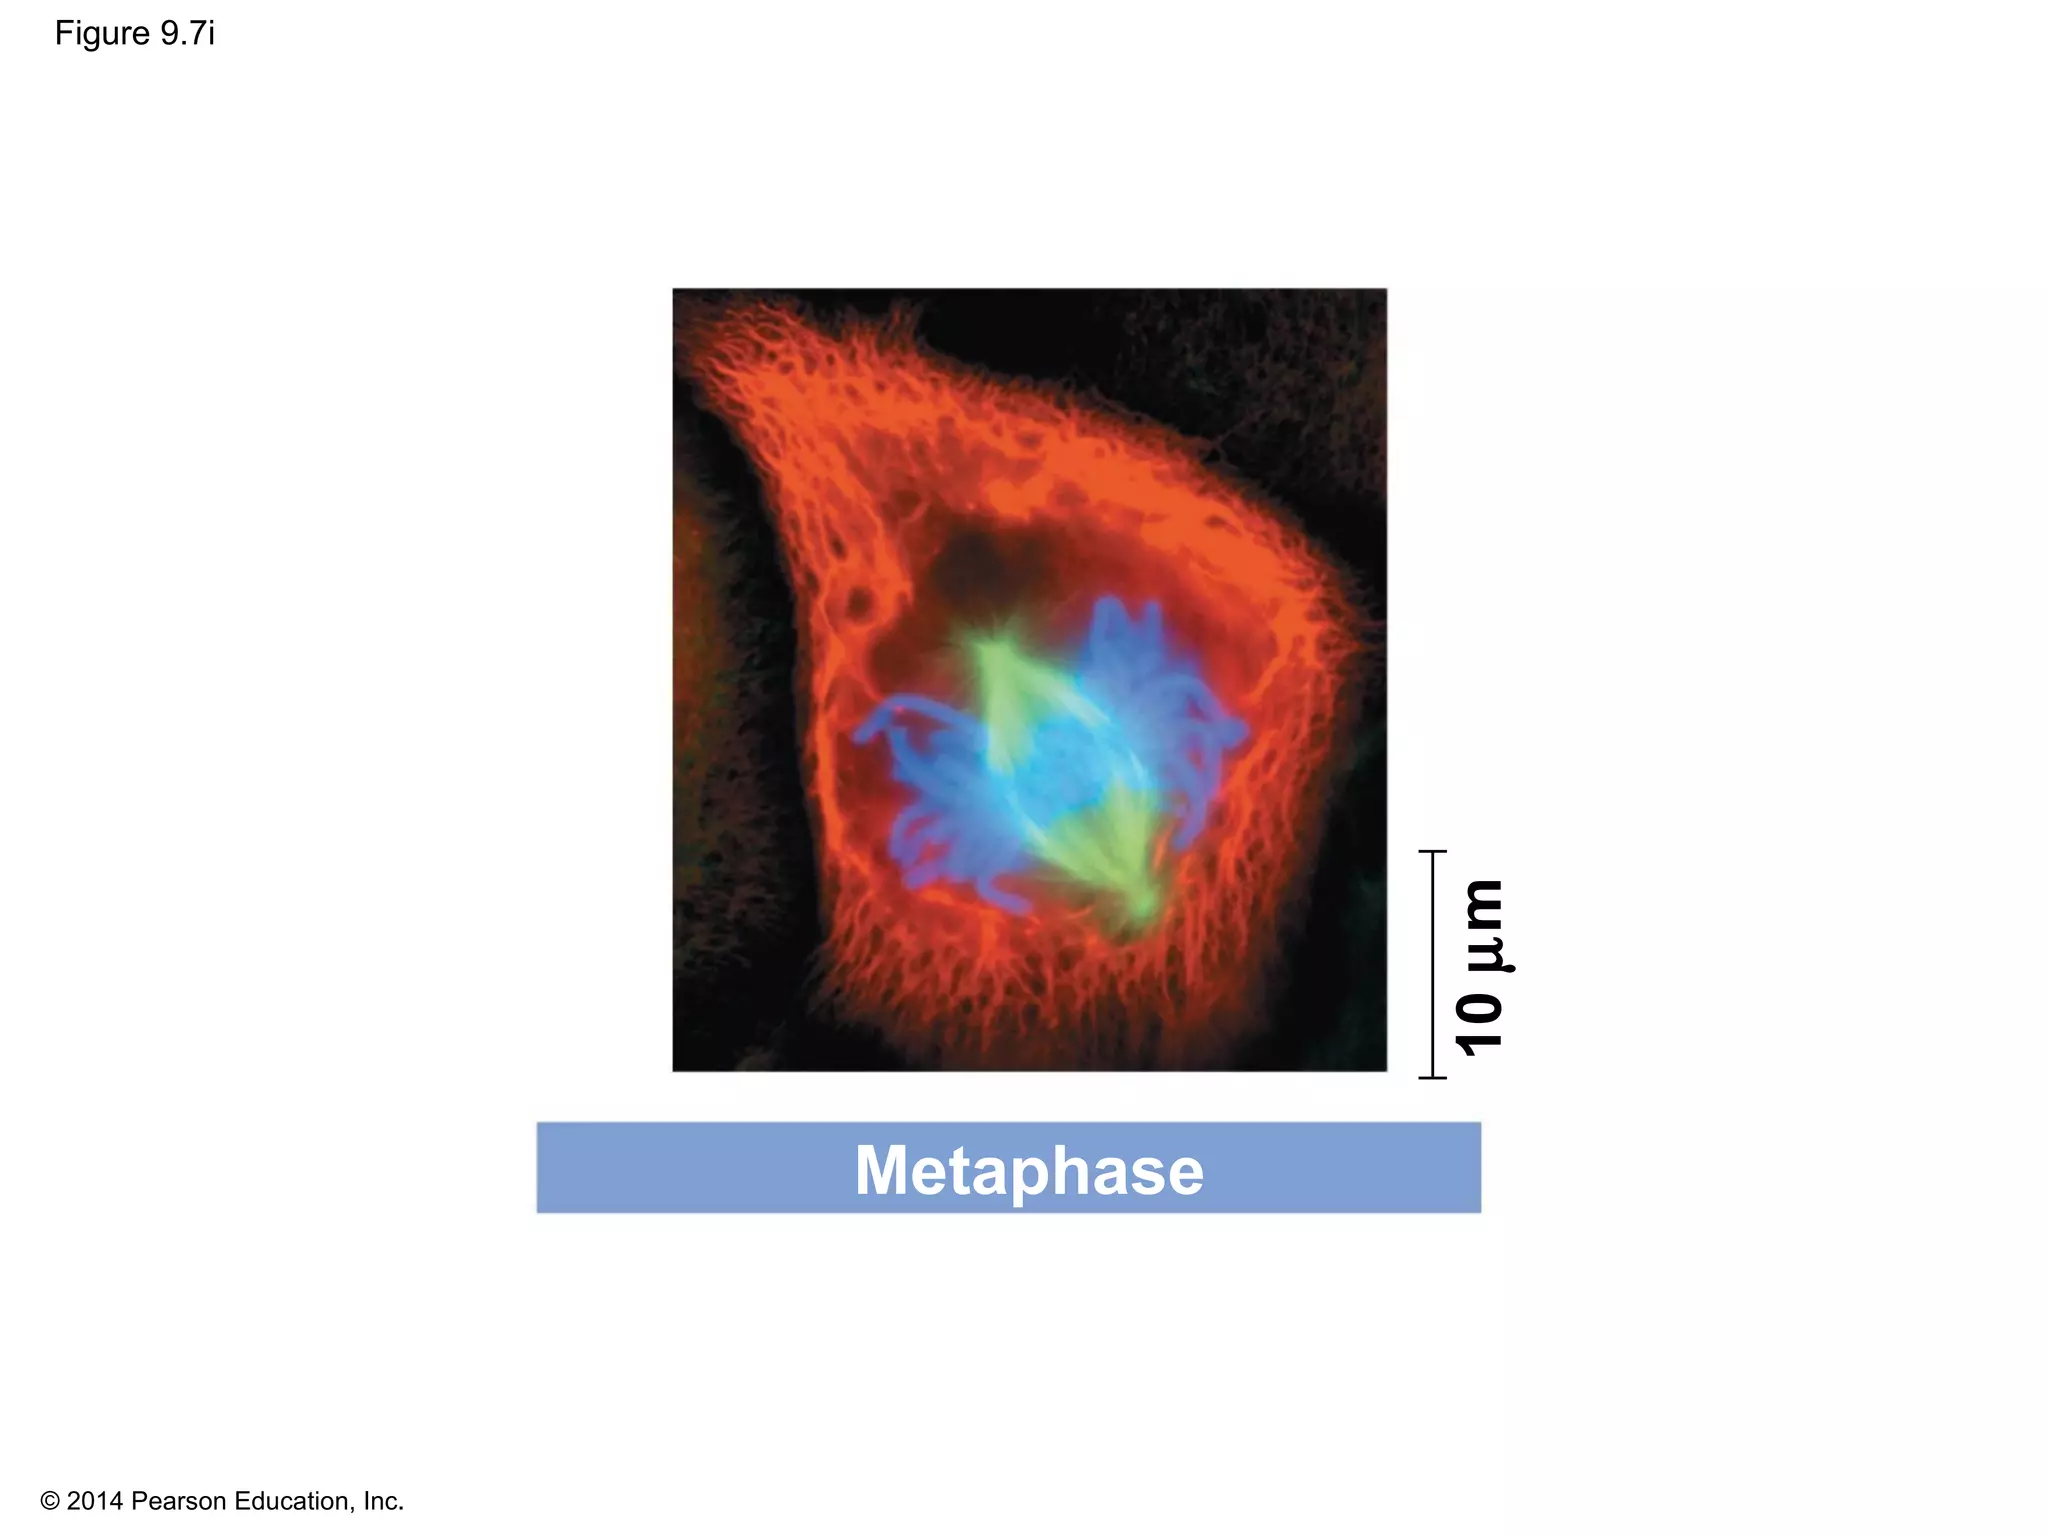
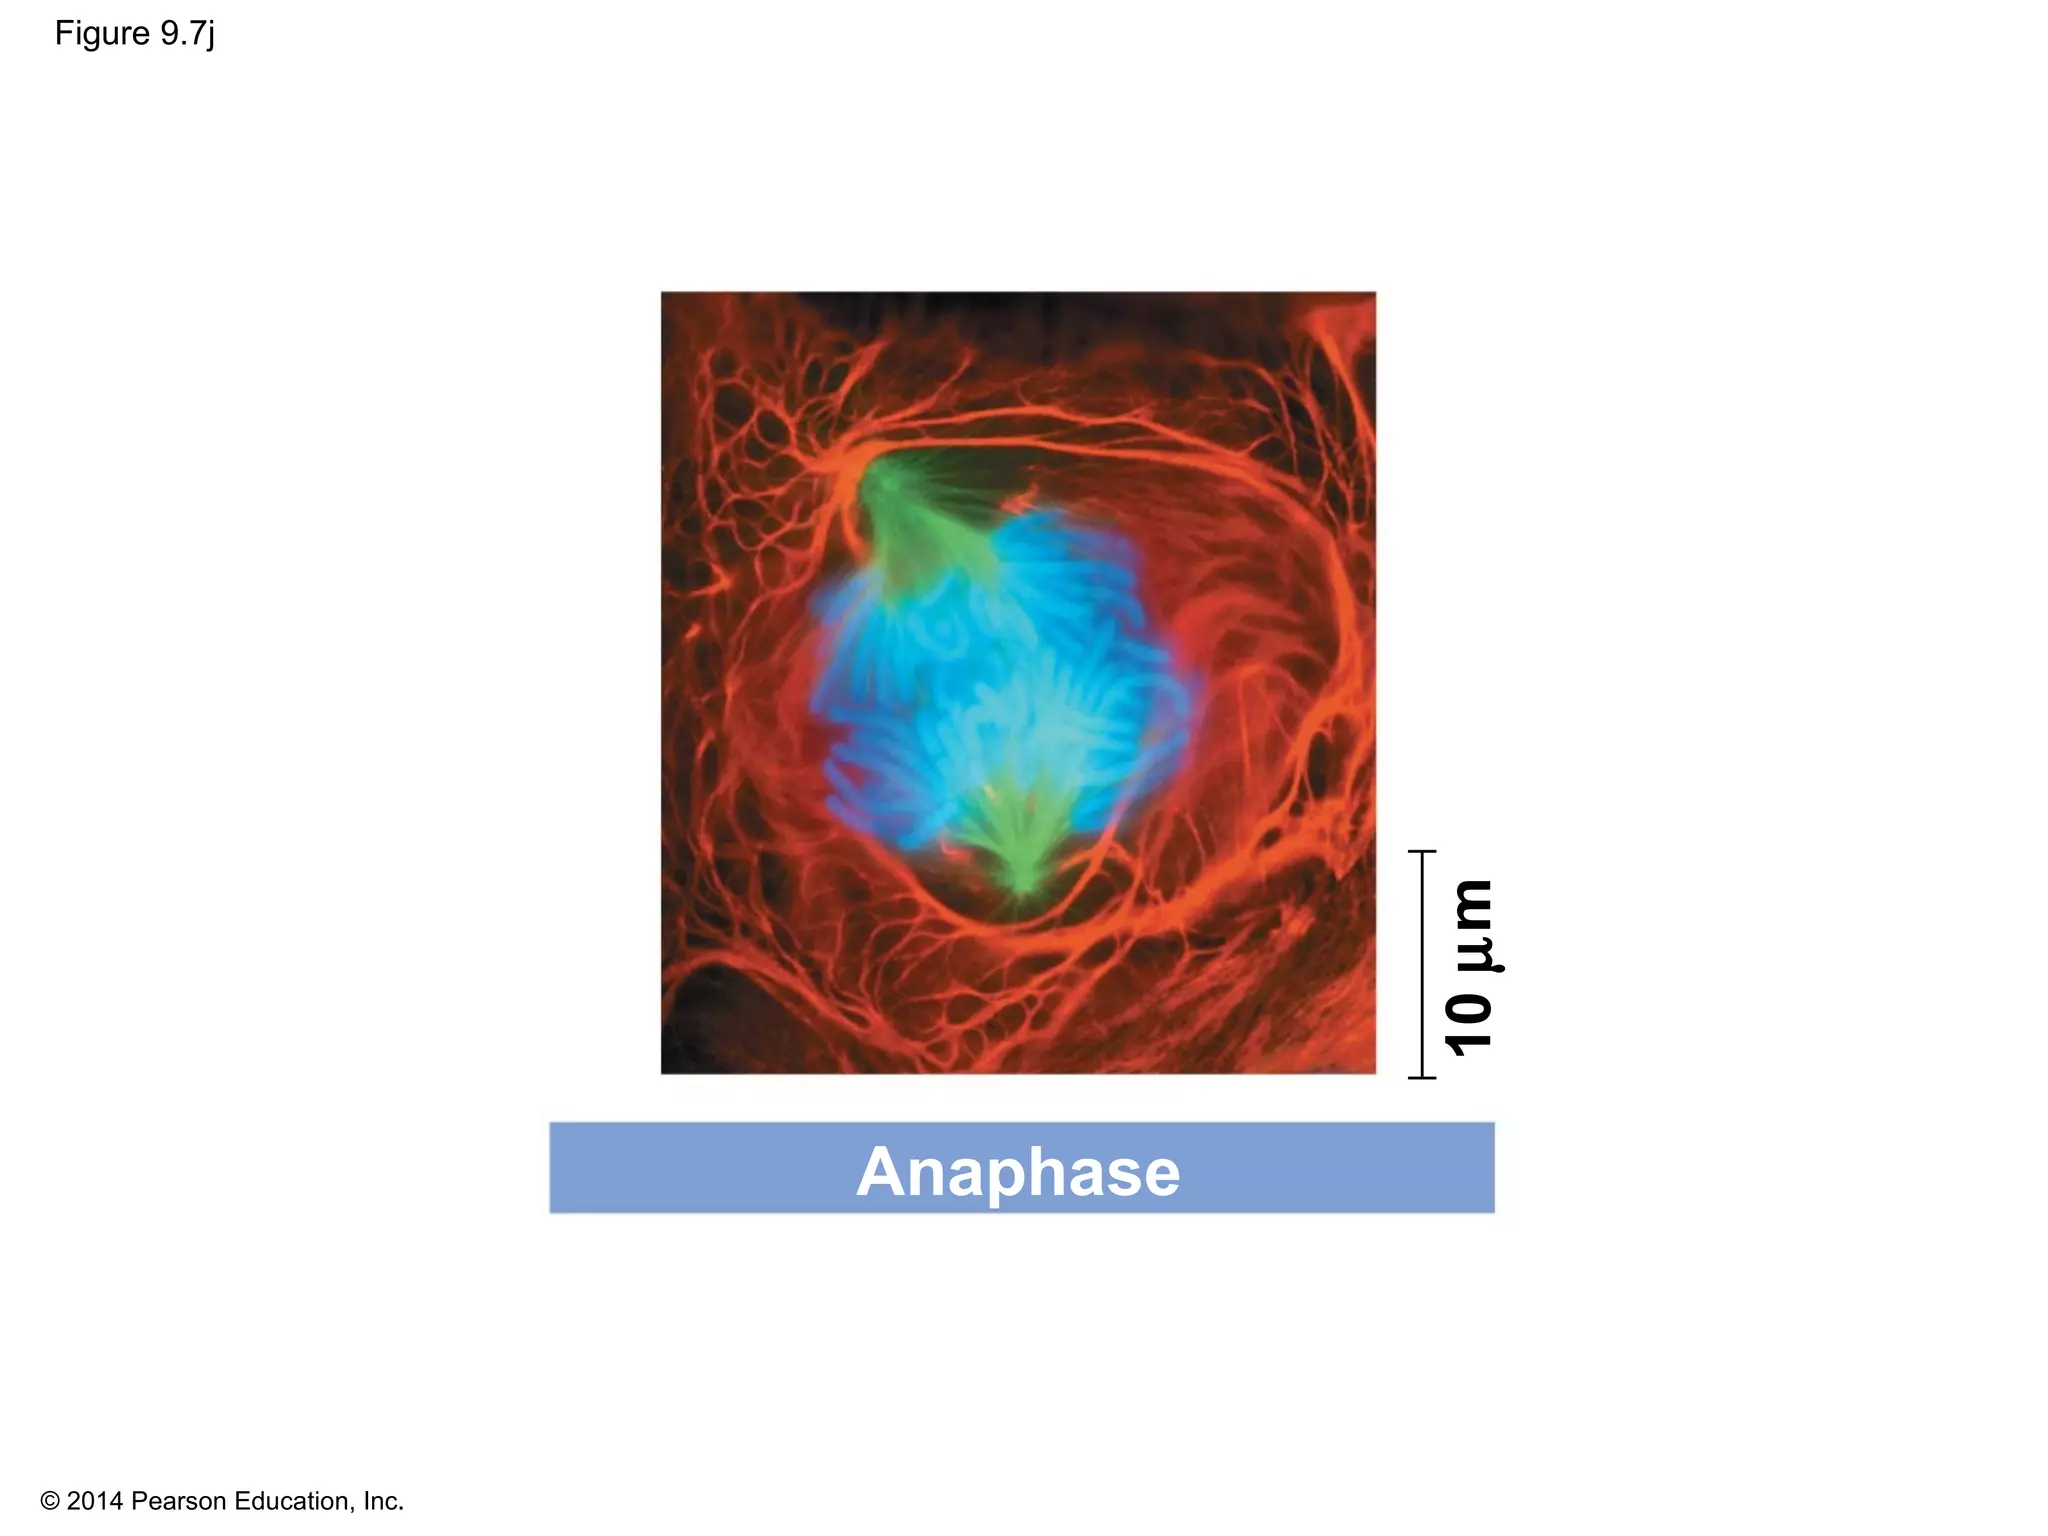
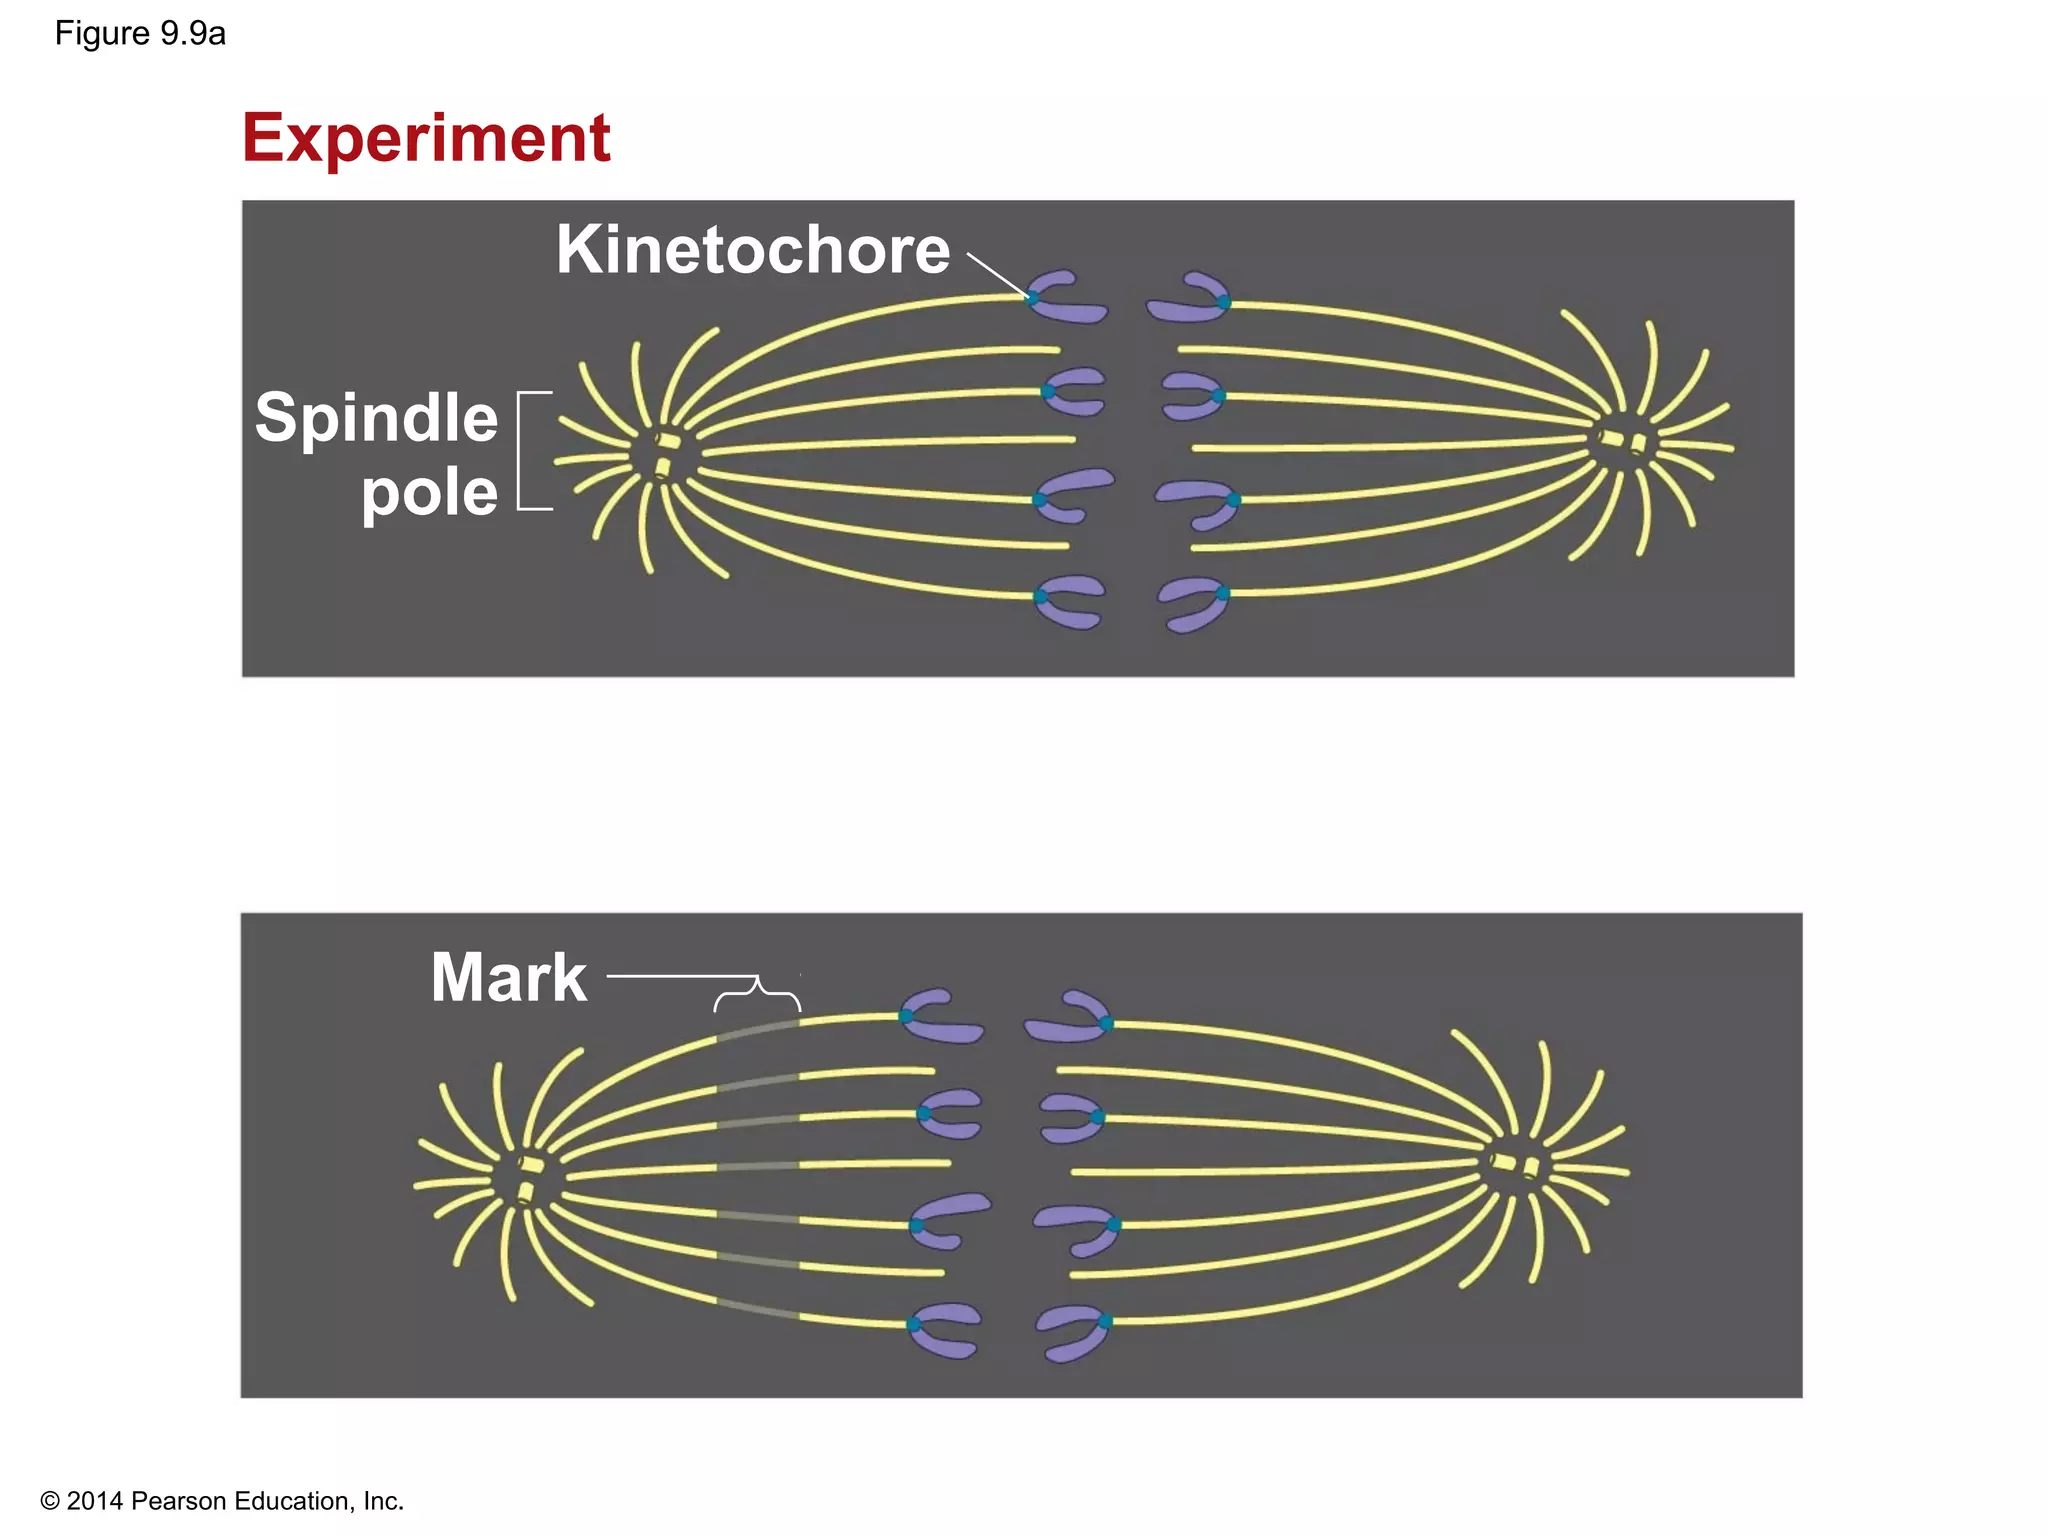
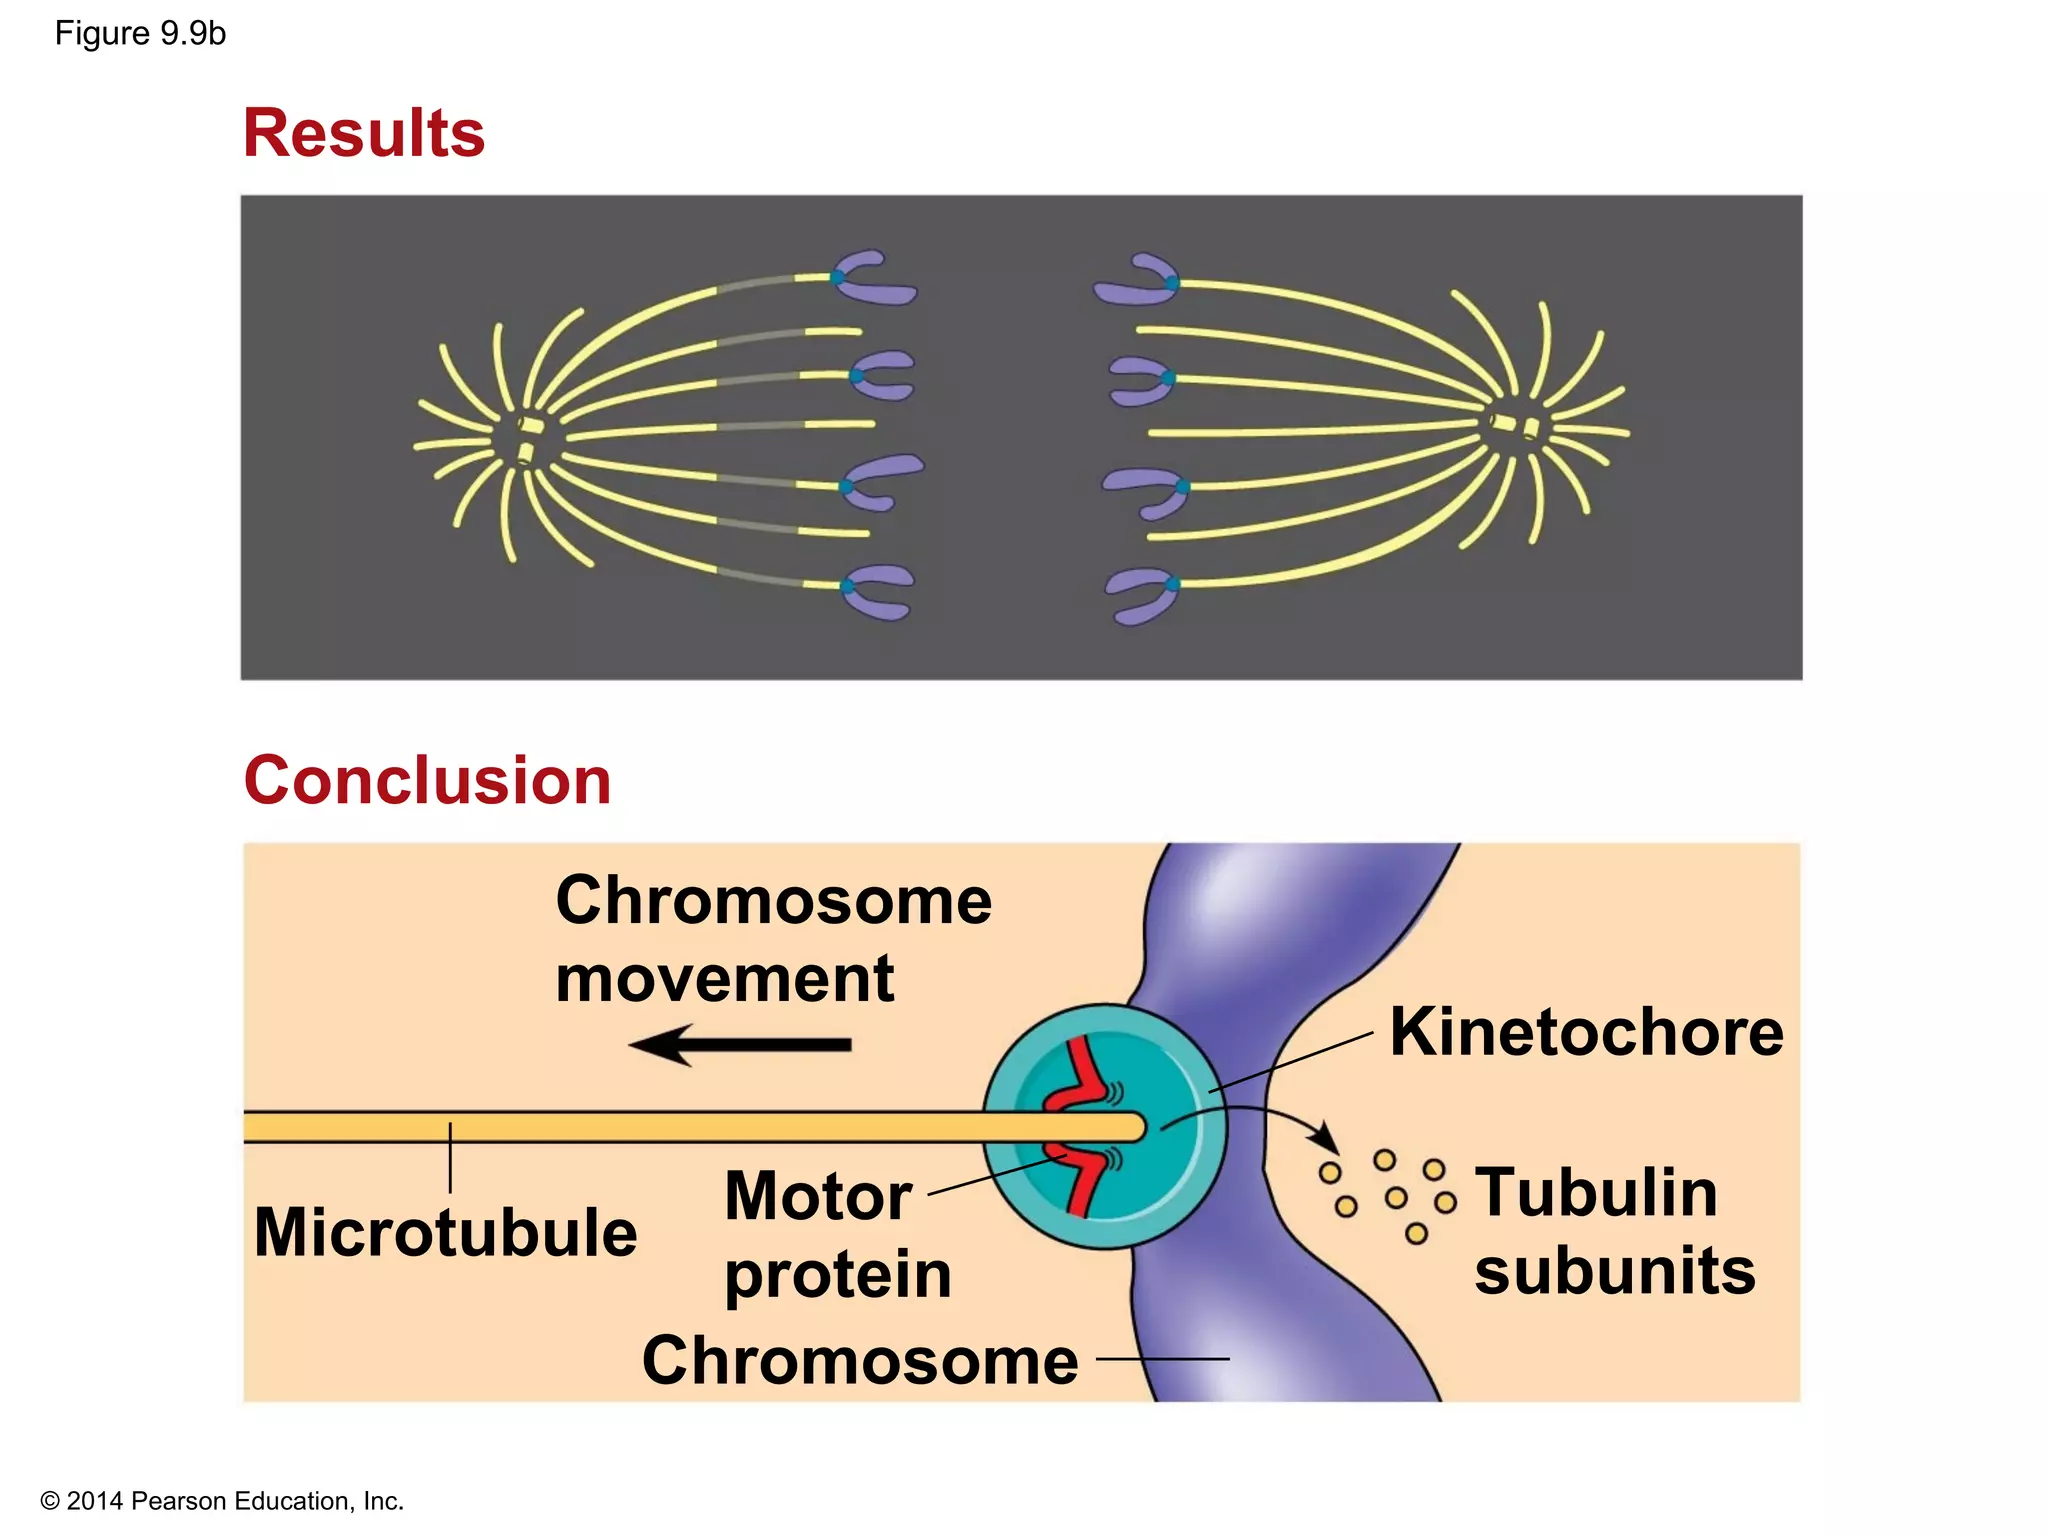
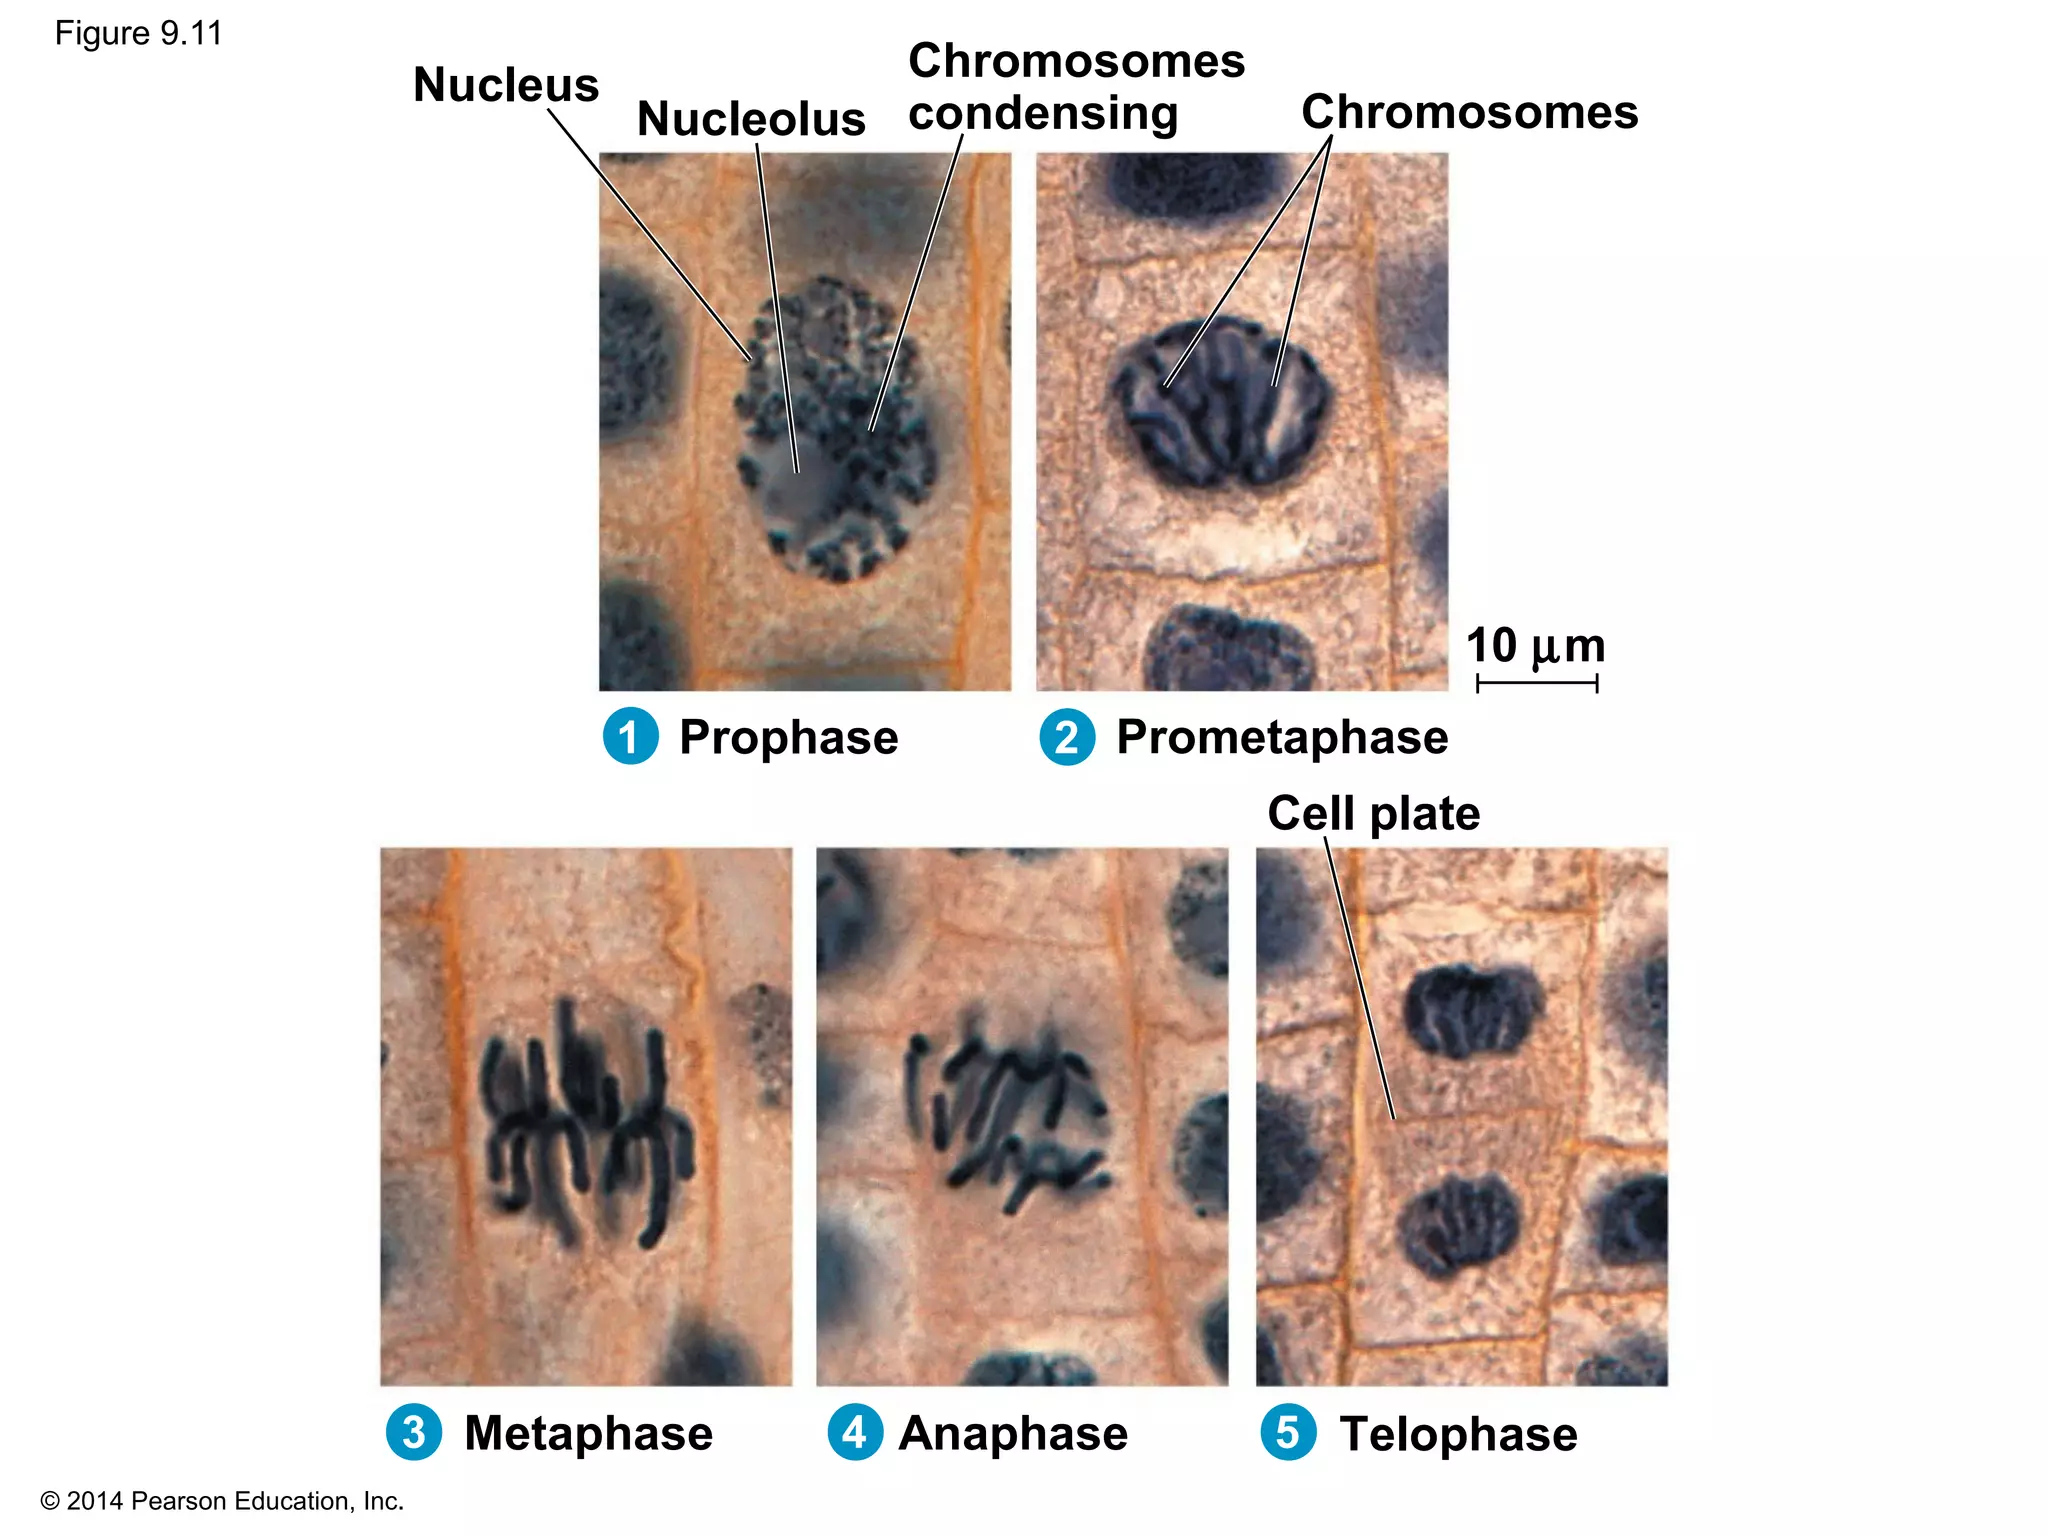
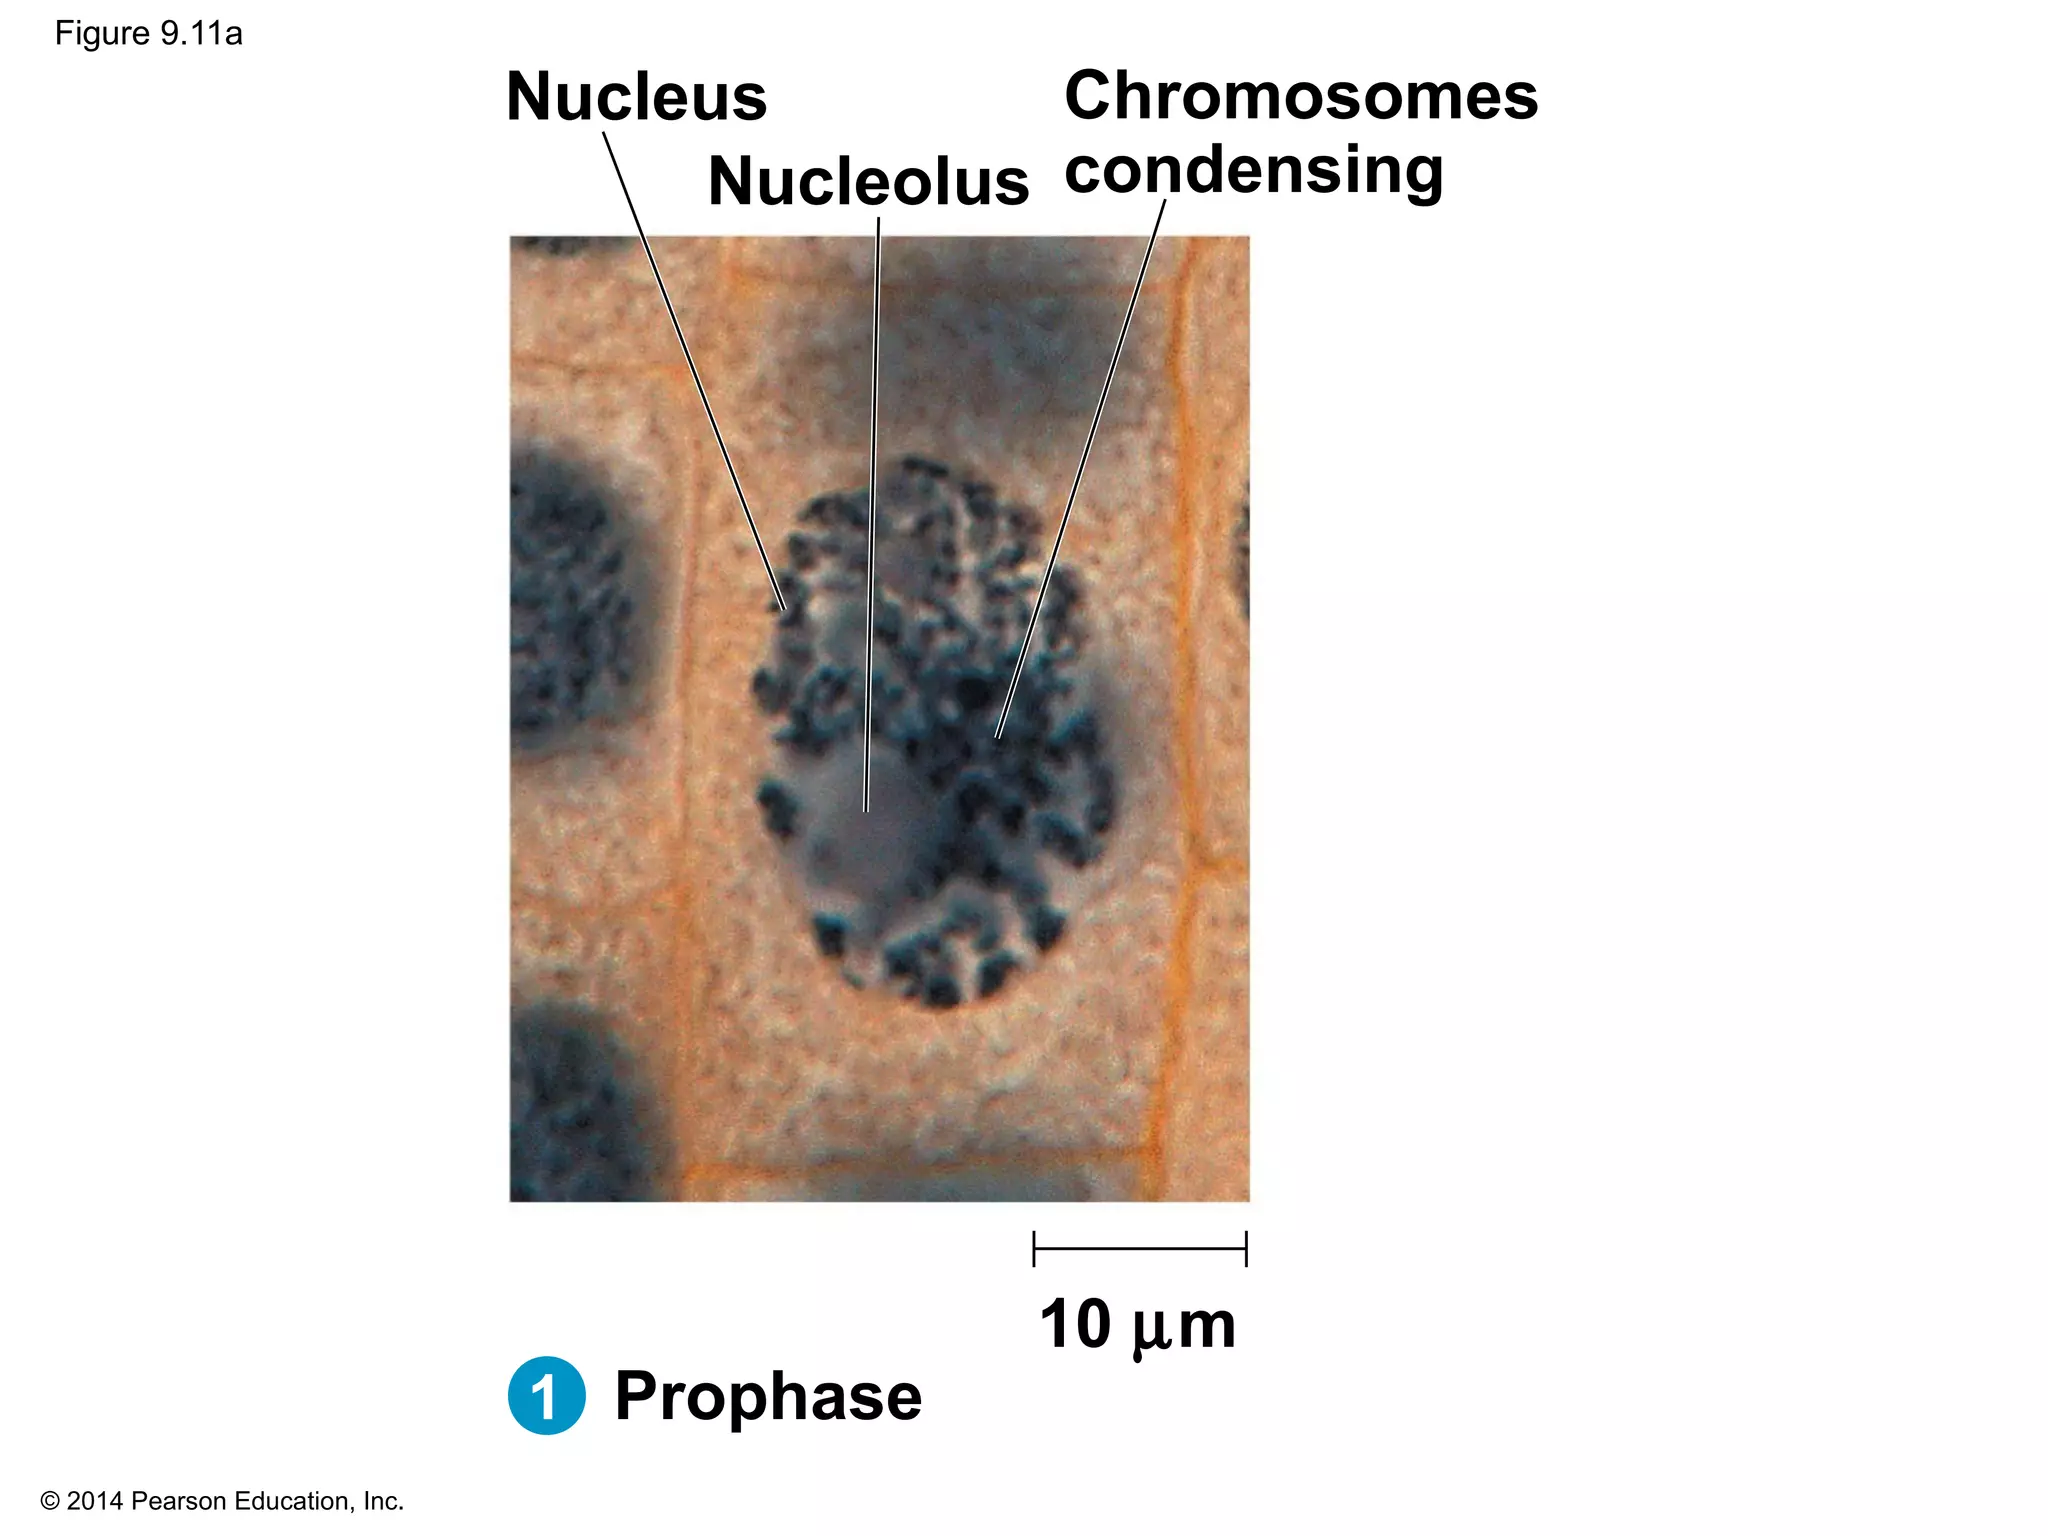
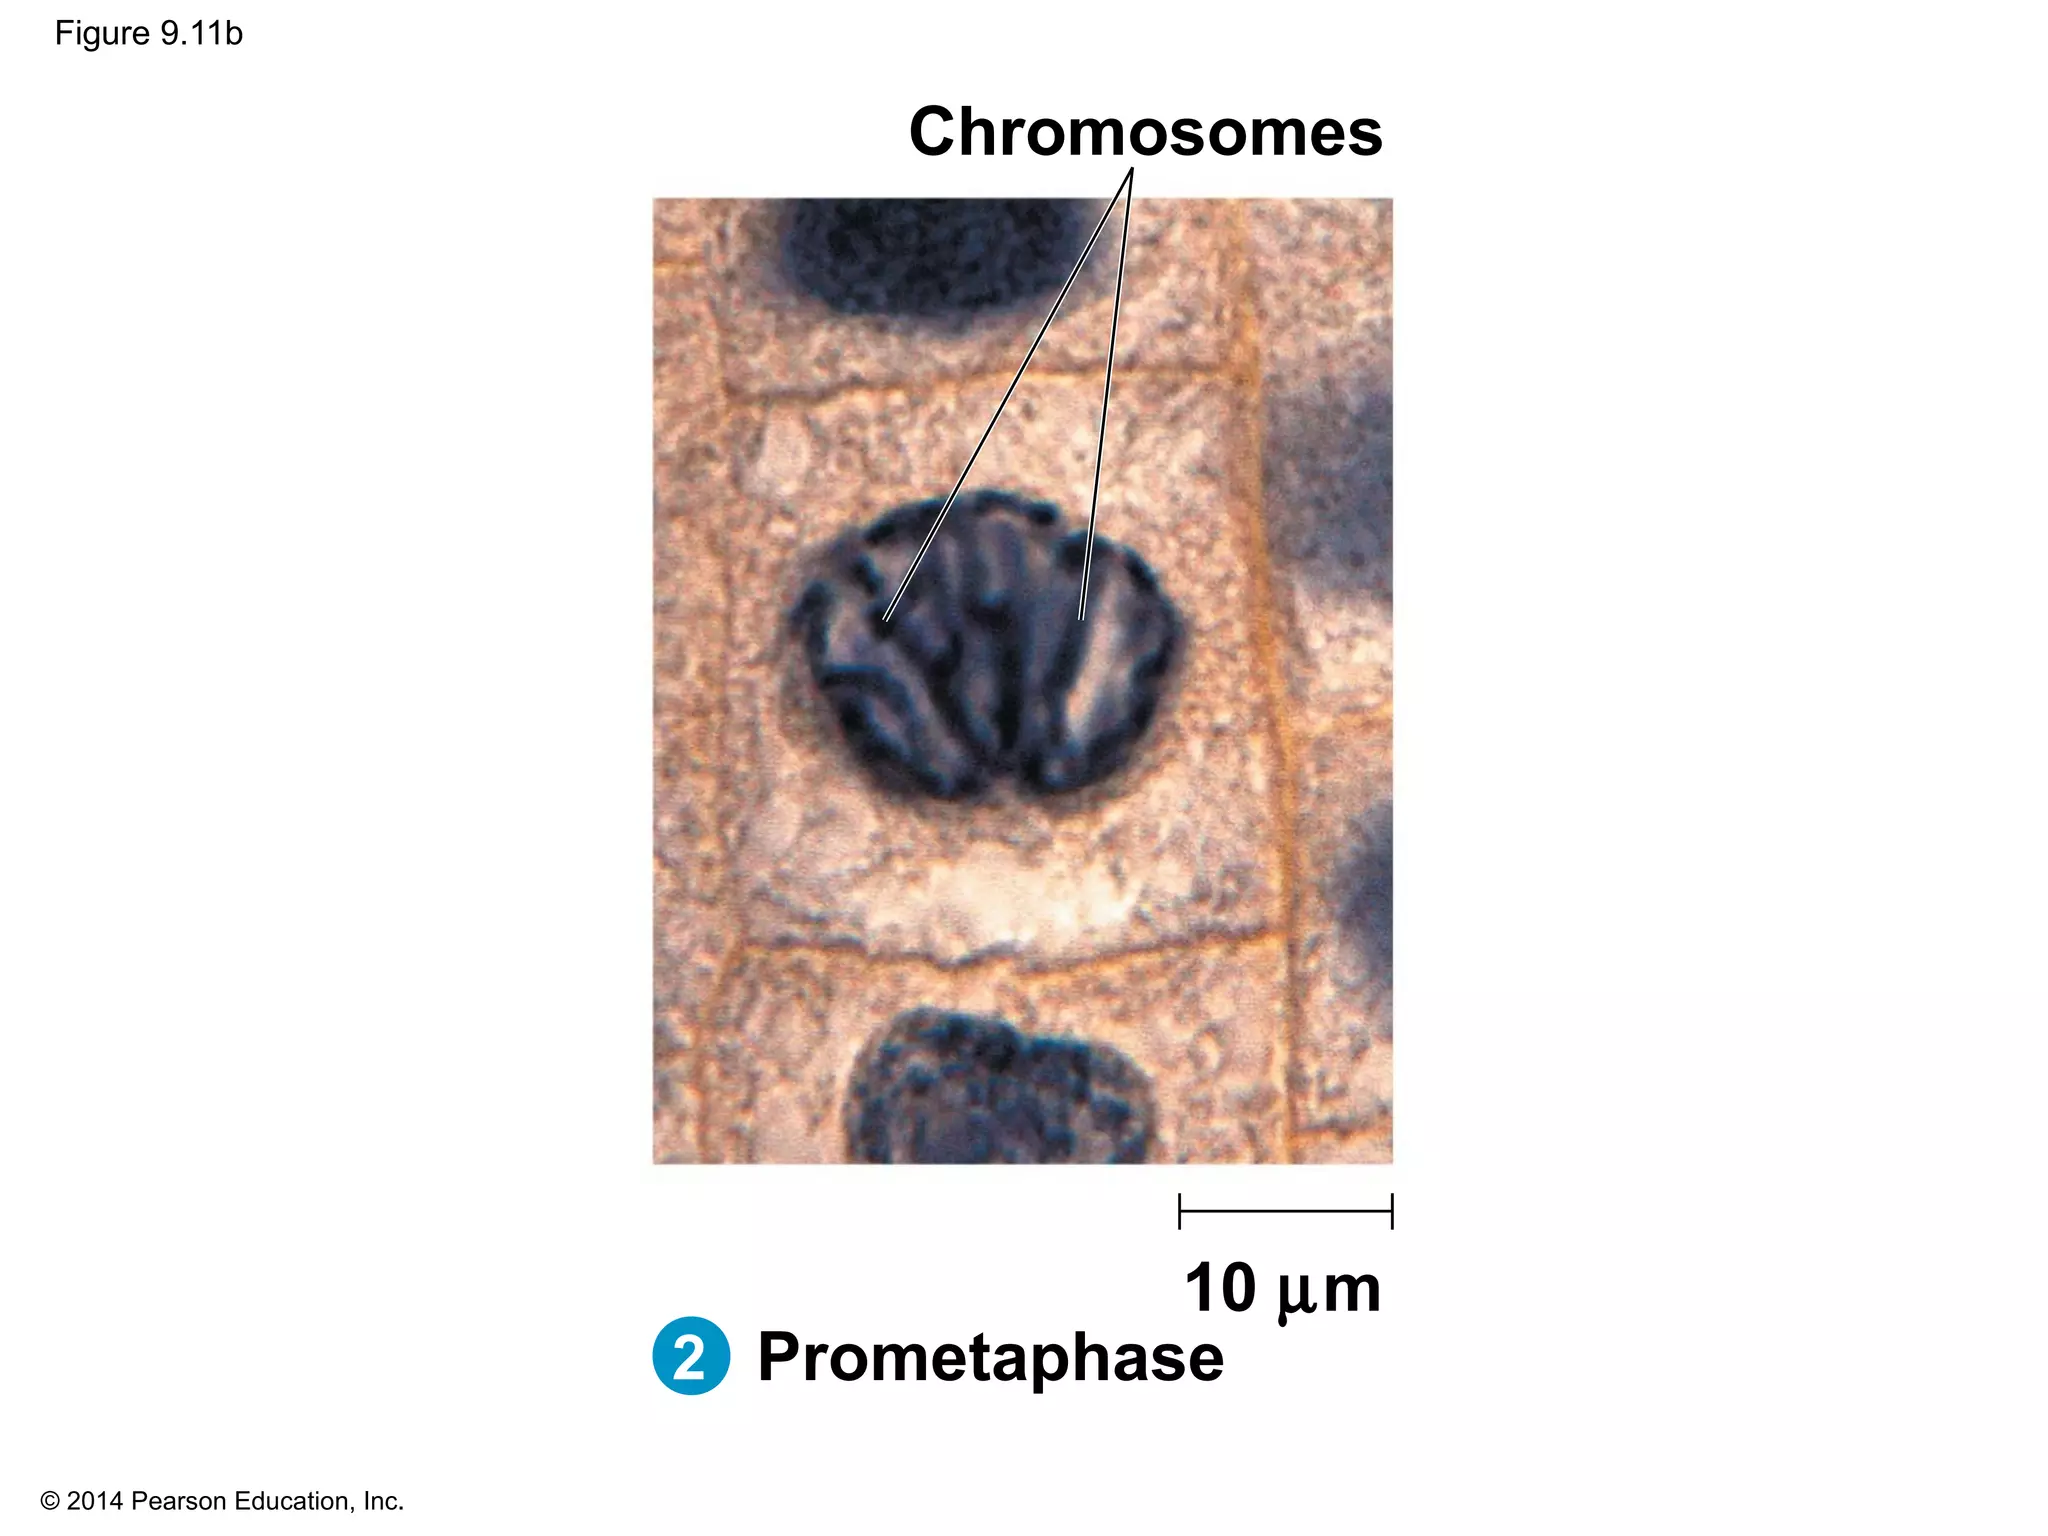
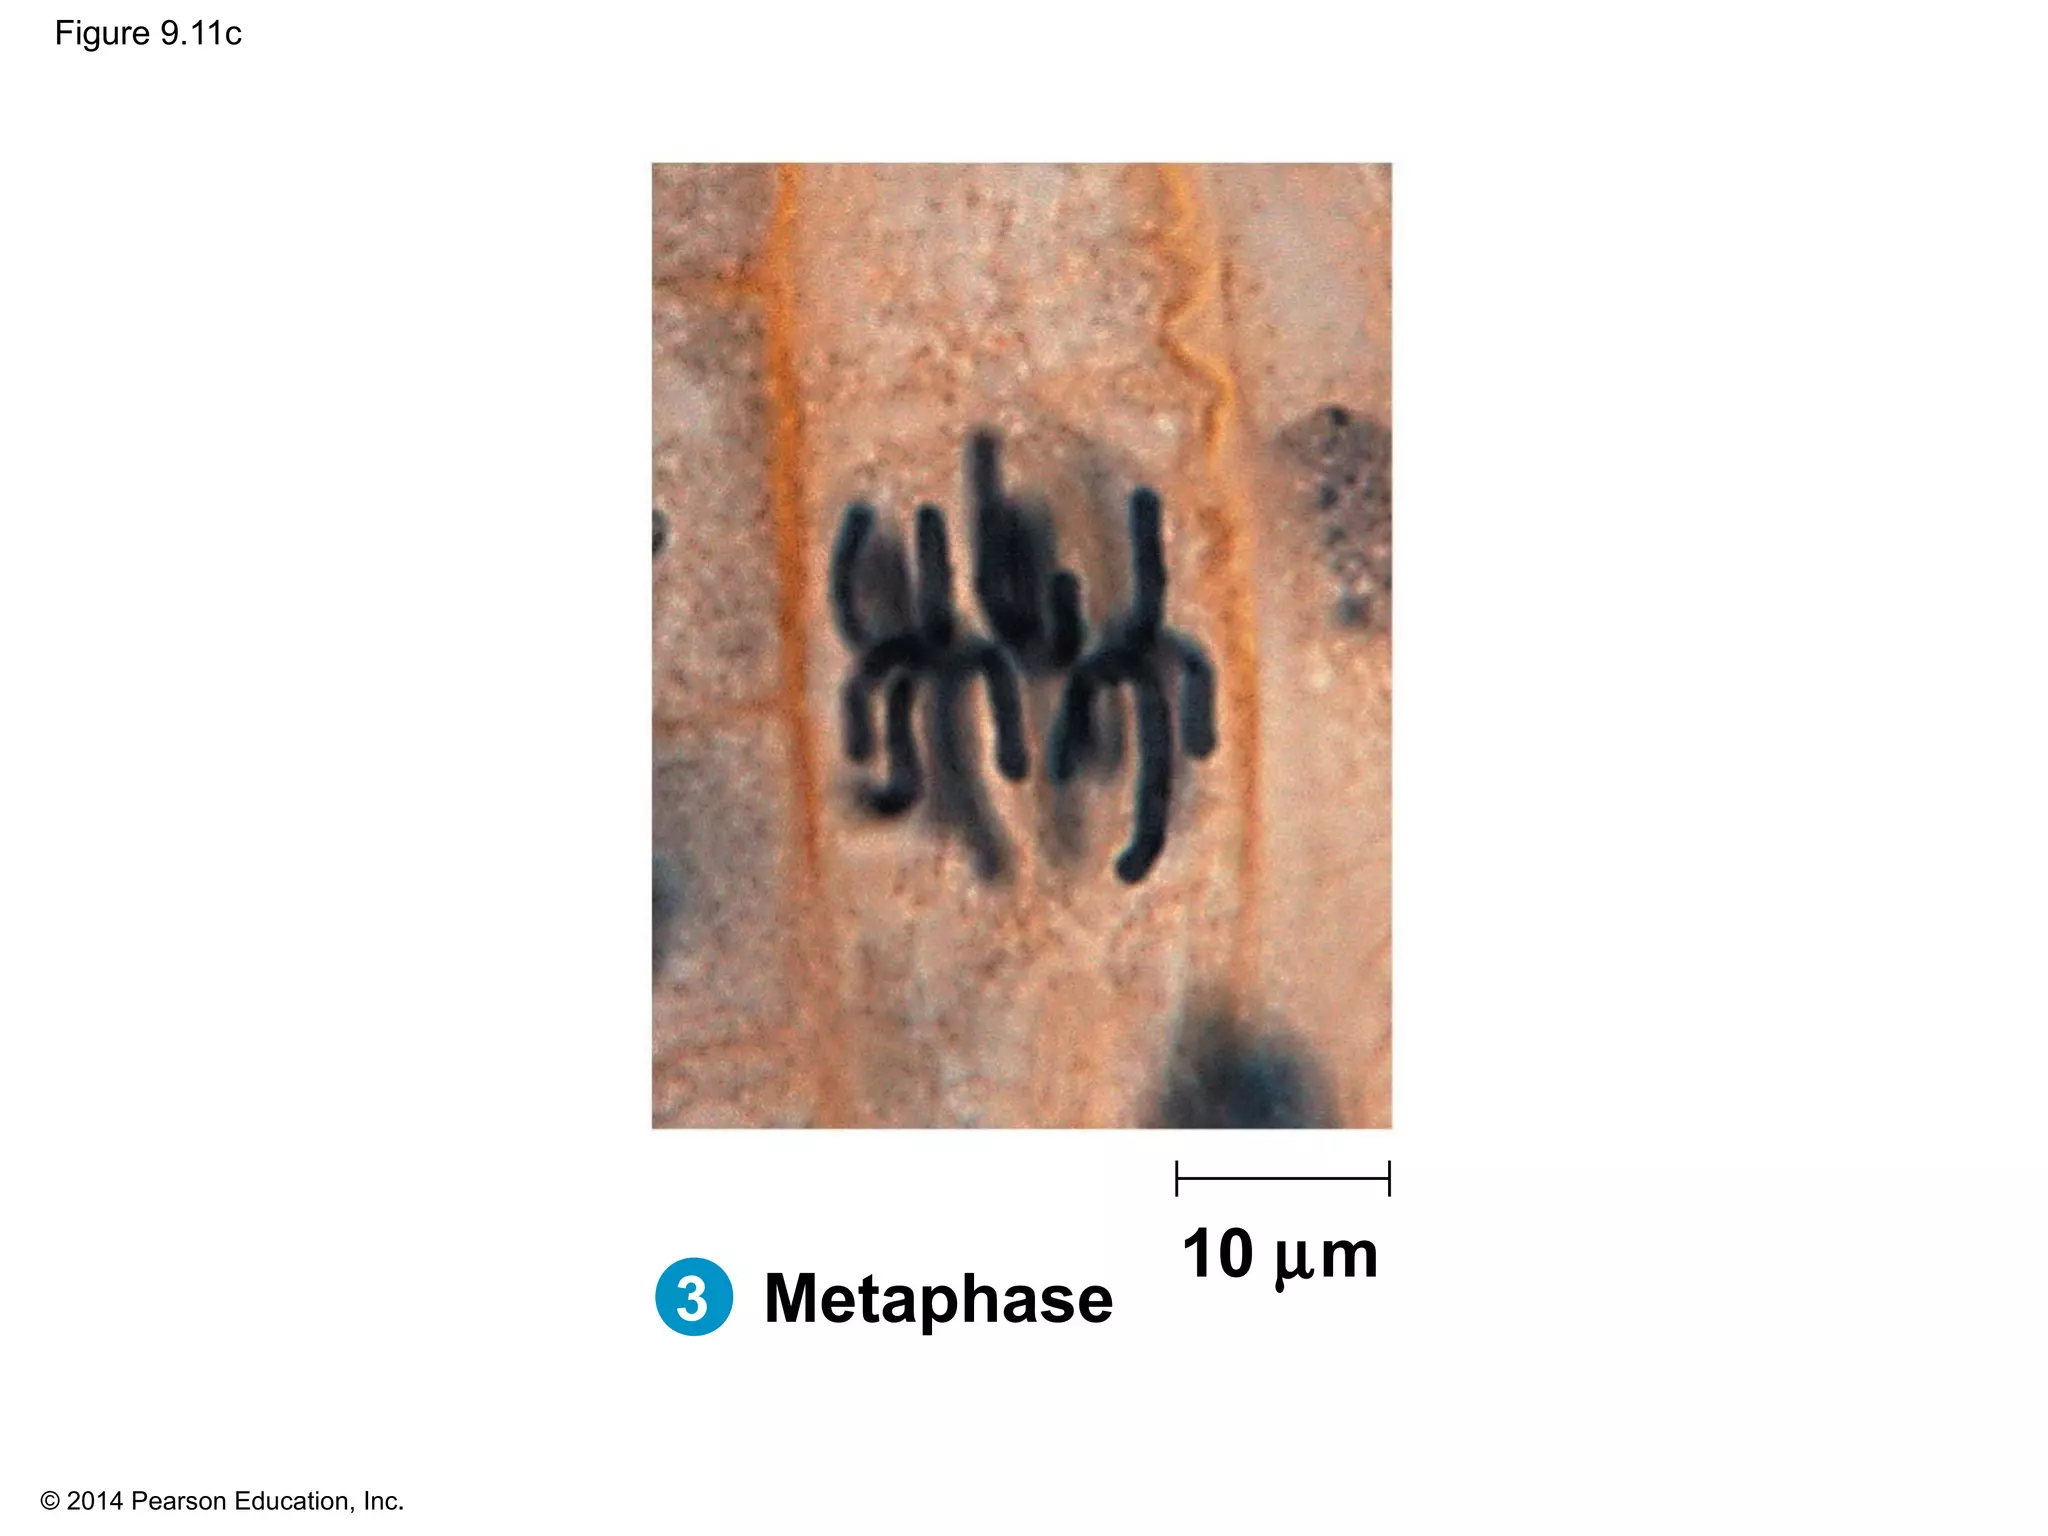
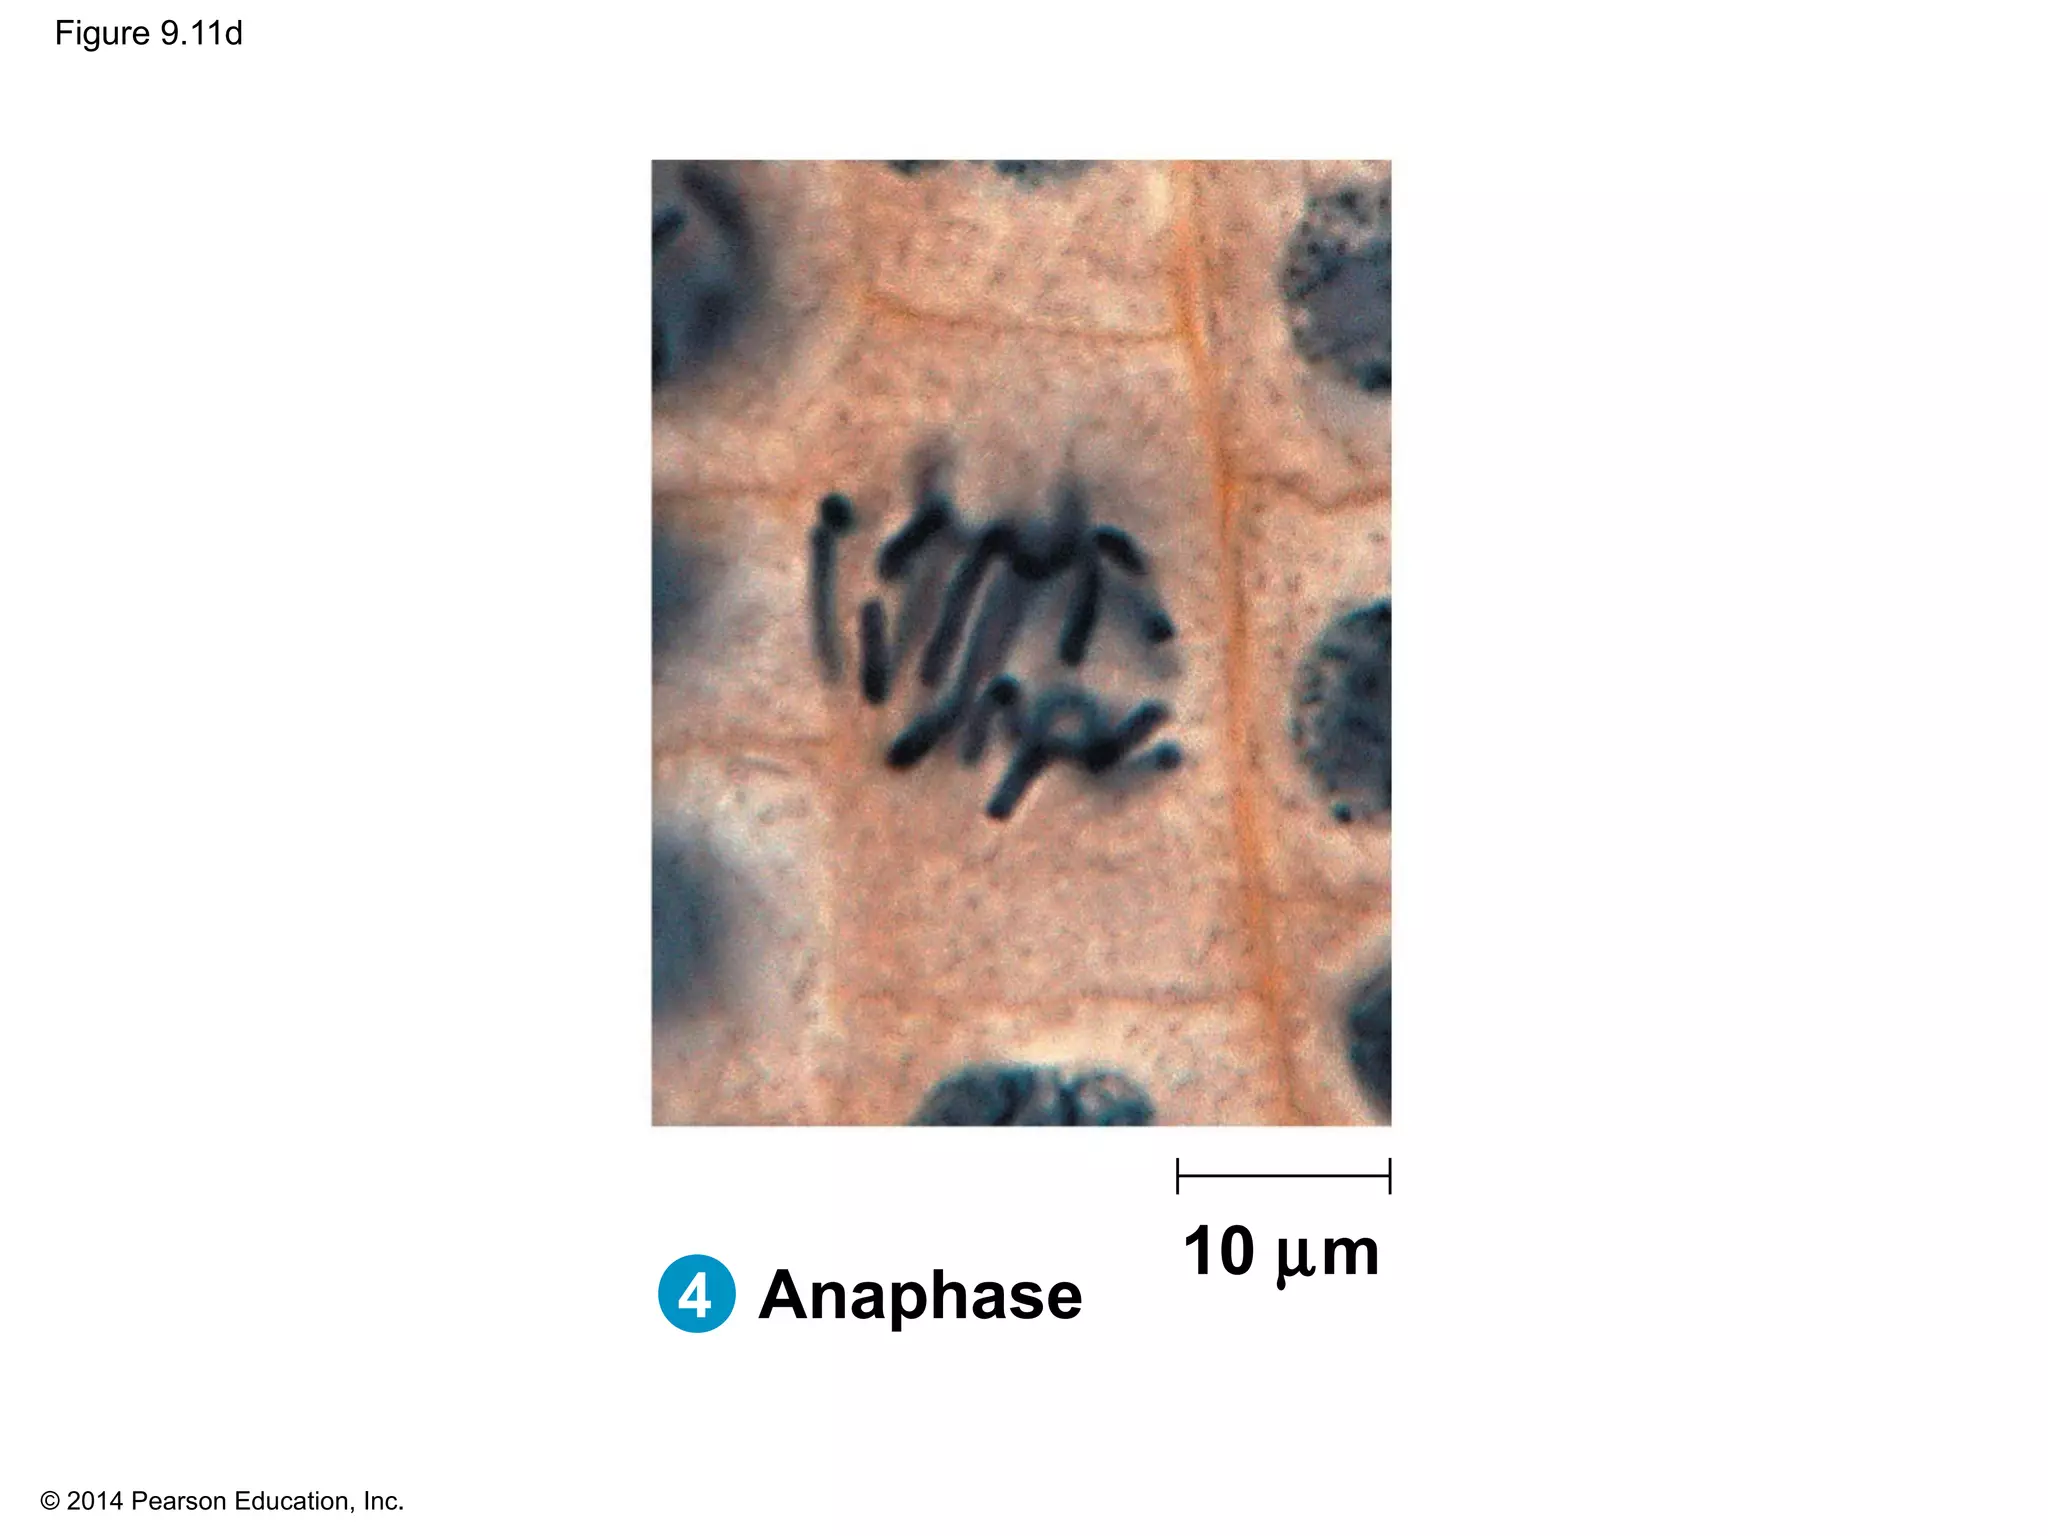
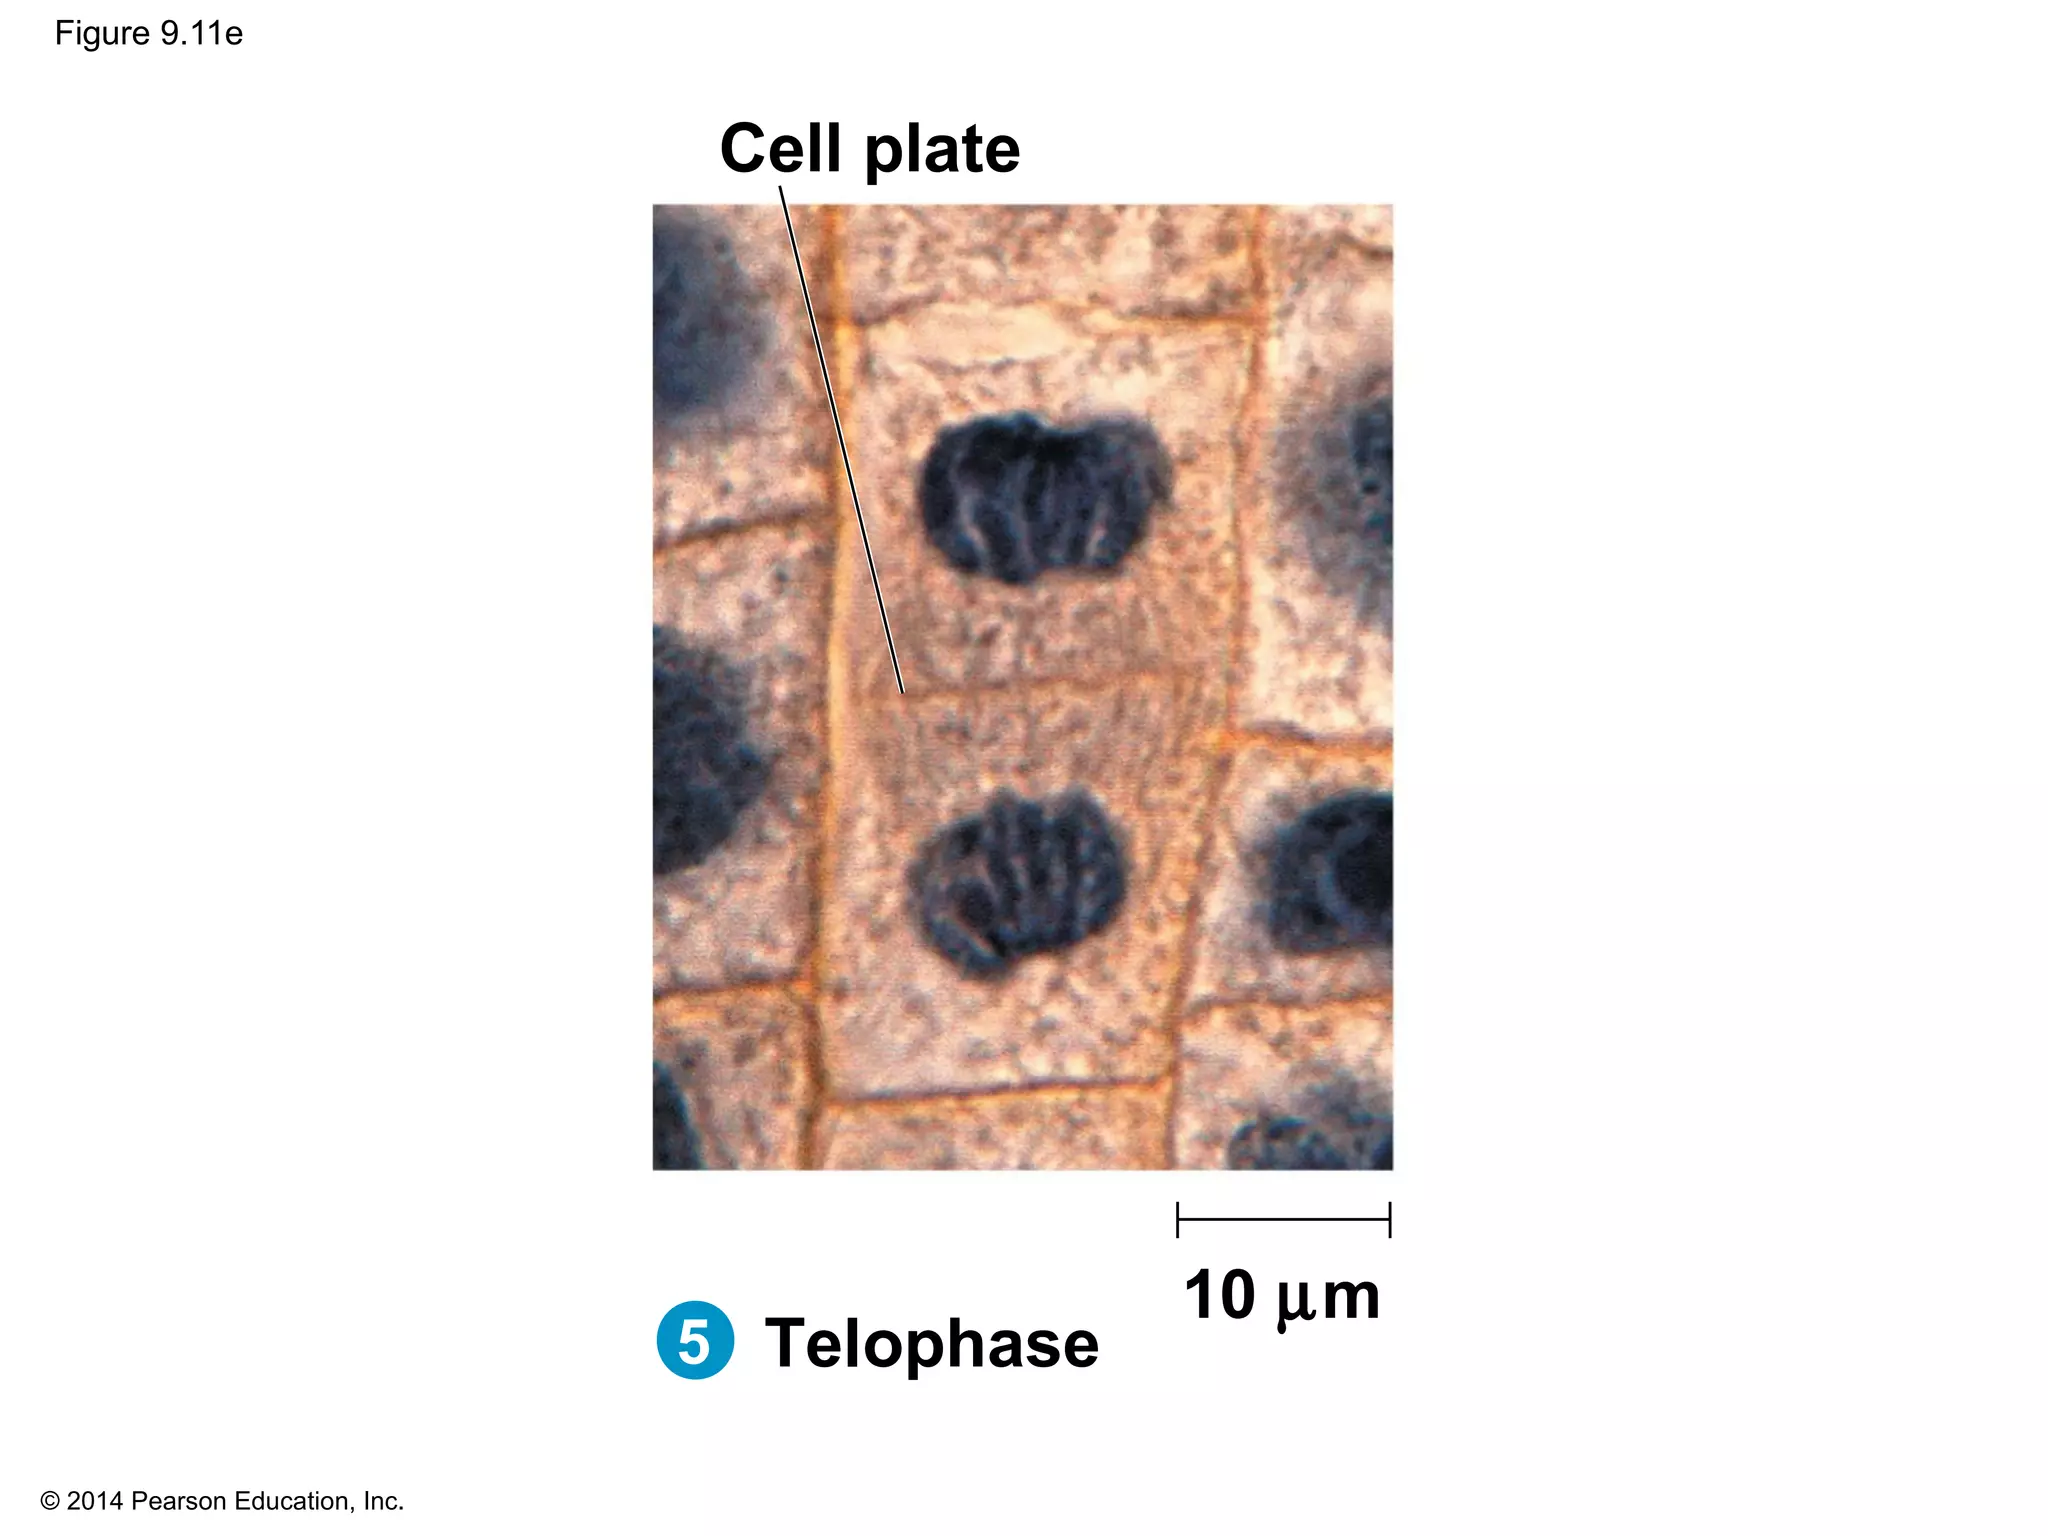
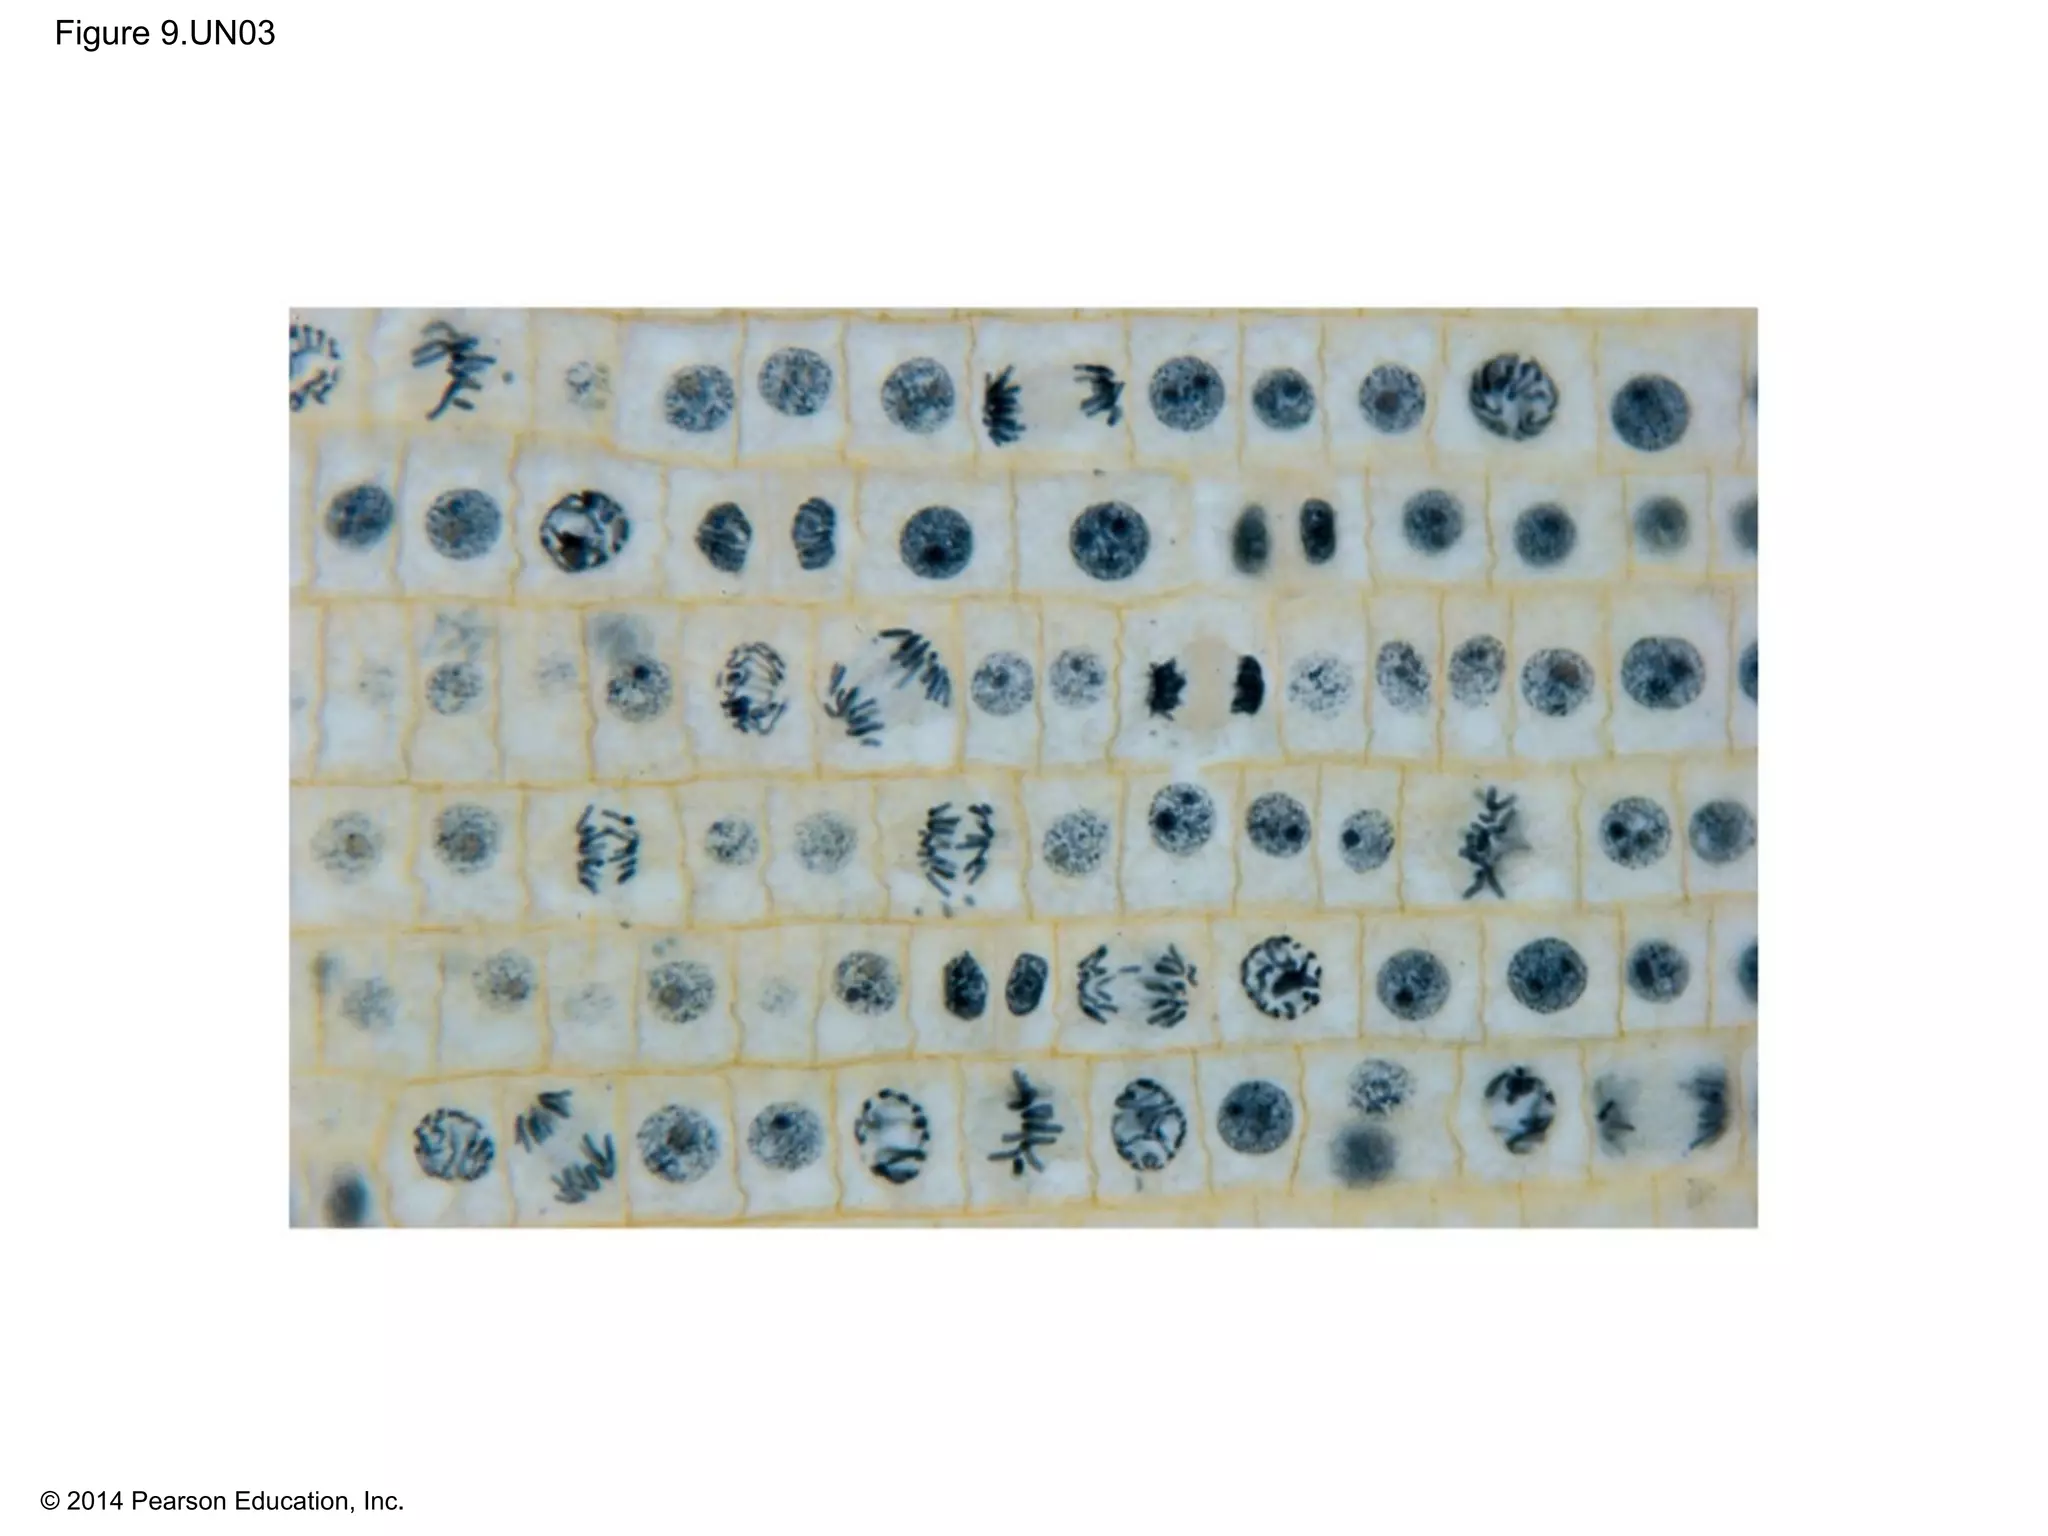
3) The stages of mitosis are prophase, prometaphase, metaphase, anaphase and telophase. During this process, chromosomes condense and