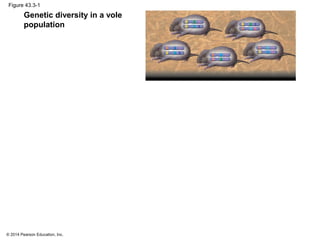
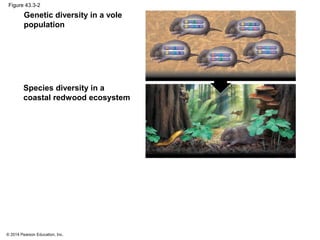
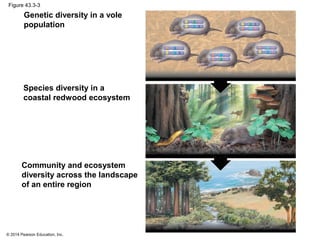
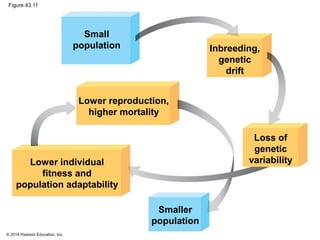
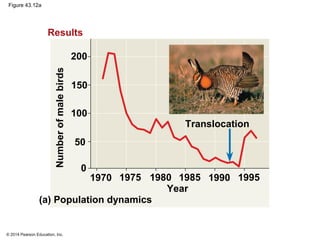
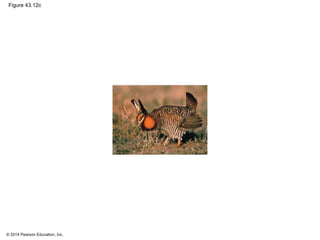
CAMPBELL BIOLOGY IN FOCUS
© 2014 Pearson Education, Inc.
Urry • Cain • Wasserman • Minorsky • Jackson • Reece
Lecture Presentations by
Kathleen Fitzpatrick and Nicole Tunbridge
43
Global Ecology
and Conservation
Biology
© 2014 Pearson Education, Inc.
Overview: Psychedelic Treasure
 Scientists have named and described 1.8 million
species
 Biologists estimate 10–100 million species exist on
Earth
 Tropical forests contain some of the greatest
concentrations of species and are being destroyed at
an alarming rate
 Humans are rapidly pushing many species, including
the newly discovered psychedelic rock gecko, toward
extinction
© 2014 Pearson Education, Inc.
Figure 43.1
© 2014 Pearson Education, Inc.
Figure 43.2
© 2014 Pearson Education, Inc.
 Conservation biology, which seeks to preserve
life, integrates several fields
 Ecology
 Evolutionary biology
 Molecular biology
 Genetics
 Physiology
© 2014 Pearson Education, Inc.
Concept 43.1: Human activities threaten
Earth’s biodiversity
 Rates of species extinction are difficult to determine
under natural conditions
 Extinction is a natural process, but the high rate of
extinction is responsible for today’s biodiversity crisis
 Human activities are threatening Earth’s biodiversity
© 2014 Pearson Education, Inc.
Three Levels of Biodiversity
 Biodiversity has three main components
 Genetic diversity
 Species diversity
 Ecosystem diversity
© 2014 Pearson Education, Inc.
Figure 43.3-1
Genetic diversity in a vole
population
© 2014 Pearson Education, Inc.
Figure 43.3-2
Species diversity in a
coastal redwood ecosystem
Genetic diversity in a vole
population
© 2014 Pearson Education, Inc.
Figure 43.3-3
Species diversity in a
coastal redwood ecosystem
Genetic diversity in a vole
population
Community and ecosystem
diversity across the landscape
of an entire region
© 2014 Pearson Education, Inc.
Genetic Diversity
 Genetic diversity comprises genetic variation within
a population and between populations
 Population extinctions reduce genetic diversity, which
in turn reduces the adaptive potential of a species
© 2014 Pearson Education, Inc.
Species Diversity
 Species diversity is the variety of species in an
ecosystem or throughout the biosphere
 According to the U.S. Endangered Species Act
 An endangered species is “in danger of becoming
extinct throughout all or a significant portion of its
range”
 A threatened species is likely to become
endangered in the near future
© 2014 Pearson Education, Inc.
 Conservation biologists are concerned about species
loss because of alarming statistics regarding
extinction and biodiversity
 Globally, 12% of birds and 21% of mammals are
threatened with extinction
 Extinction may be local or global
© 2014 Pearson Education, Inc.
Figure 43.4
Philippine eagle
Yangtze River
dolphin
© 2014 Pearson Education, Inc.
Figure 43.4a
Philippine eagle
© 2014 Pearson Education, Inc.
Figure 43.4b
Yangtze River dolphin
© 2014 Pearson Education, Inc.
Ecosystem Diversity
 Human activity is reducing ecosystem diversity, the
variety of ecosystems in the biosphere
 More than 50% of wetlands in the contiguous United
States have been drained and converted to
agricultural or other use
© 2014 Pearson Education, Inc.
 The local extinction of one species can have a
negative impact on other species in an ecosystem
 For example, flying foxes (bats) are important
pollinators and seed dispersers in the Pacific Islands
© 2014 Pearson Education, Inc.
Figure 43.5
© 2014 Pearson Education, Inc.
Biodiversity and Human Welfare
 Human biophilia allows us to recognize the value of
biodiversity for its own sake
 Species diversity brings humans practical benefits
© 2014 Pearson Education, Inc.
Benefits of Species and Genetic Diversity
 Species related to agricultural crops can have
important genetic qualities
 For example, plant breeders bred virus-resistant
commercial rice by crossing it with a wild population
 In the United States, 25% of prescriptions contain
substances originally derived from plants
 For example, the rosy periwinkle contains alkaloids
that inhibit cancer growth
© 2014 Pearson Education, Inc.
Figure 43.UN01
Rosy periwinkle
© 2014 Pearson Education, Inc.
 The loss of species also means loss of unique
genes and genetic diversity
 The enormous genetic diversity of organisms has
potential for great human benefit
© 2014 Pearson Education, Inc.
Ecosystem Services
 Ecosystem services encompass all the processes
through which natural ecosystems help sustain
human life
 Some examples of ecosystem services
 Purification of air and water
 Detoxification and decomposition of wastes
 Crop pollination, pest control, and soil preservation
 Ecosystem services have an estimated value of $33
trillion per year, but are provided for free
© 2014 Pearson Education, Inc.
Threats to Biodiversity
 Most species loss can be traced to four major
threats
 Habitat loss
 Introduced species
 Overharvesting
 Global change
© 2014 Pearson Education, Inc.
Habitat Loss
 Human alteration of habitat is the greatest threat to
biodiversity throughout the biosphere
 In almost all cases, habitat fragmentation and
destruction lead to loss of biodiversity
 For example
 In Wisconsin, prairie habitat has been reduced by
over 99.9%, resulting in the loss of up to 60% of the
original plant species
© 2014 Pearson Education, Inc.
Figure 43.6
© 2014 Pearson Education, Inc.
Introduced Species
 Introduced species are those that humans move
from native locations to new geographic regions
 Without their native predators, parasites, and
pathogens, introduced species may spread rapidly
 Introduced species that gain a foothold in a new
habitat usually disrupt their adopted community
© 2014 Pearson Education, Inc.
 Humans have deliberately introduced some species
with good intentions but disastrous effects
 For example, kudzu was intentionally introduced to
the southern United States
© 2014 Pearson Education, Inc.
Figure 43.7
© 2014 Pearson Education, Inc.
Overharvesting
 Overharvesting is human harvesting of wild plants
or animals at rates exceeding the ability of
populations of those species to rebound
 Species with restricted habitats or large body size
with low reproductive rates are especially
vulnerable to overharvesting
 For example, elephant populations declined
because of harvesting for ivory
© 2014 Pearson Education, Inc.
 DNA analysis can help conservation biologists
identify the source of illegally obtained animal
products
 For example, DNA from illegally harvested ivory can
be used to trace the original population of elephants to
within a few hundred kilometers
© 2014 Pearson Education, Inc.
Figure 43.8
© 2014 Pearson Education, Inc.
 Overfishing has decimated wild fish populations
 For example, the North Atlantic bluefin tuna
population decreased by 80% in ten years
© 2014 Pearson Education, Inc.
Figure 43.9
© 2014 Pearson Education, Inc.
Global Change
 Global change includes alterations in climate,
atmospheric chemistry, and broad ecological
systems
 Acid precipitation is rain, snow, sleet, or fog with a
pH <5.2
 Acid precipitation contains sulfuric acid and nitric
acid from the burning of wood and fossil fuels
© 2014 Pearson Education, Inc.
 Air pollution from one region can result in acid
precipitation downwind
 For example, industrial pollution in the midwestern
United States caused acid precipitation in eastern
Canada in the 1960s
 Acid precipitation kills fish and other lake-dwelling
organisms
 Environmental regulations have helped to decrease
acid precipitation
 For example, sulfur dioxide emissions in the United
States decreased >40% between 1993 and 2009
© 2014 Pearson Education, Inc.
Figure 43.10
4.8
4.7
4.6
4.5
4.4
4.3
4.2
4.1
4.0
pH
1960 ’65 ’70 ’75 ’80 ’85
Year
’90 ’95 2000 ’05 ’10
© 2014 Pearson Education, Inc.
Concept 43.2: Population conservation focuses on
population size, genetic diversity, and critical
habitat
 Biologists focusing on conservation at the population
and species levels follow two main approaches
 The small-population approach
 The declining-population approach
© 2014 Pearson Education, Inc.
Small-Population Approach
 The small-population approach studies processes
that can make small populations become extinct
© 2014 Pearson Education, Inc.
The Extinction Vortex: Evolutionary Implications
of Small Population Size
 A small population is prone to inbreeding and genetic
drift, which draw it down an extinction vortex
 The key factor driving the extinction vortex is loss of
the genetic variation necessary to enable
evolutionary responses to environmental change
 Small populations and low genetic diversity do not
always lead to extinction
© 2014 Pearson Education, Inc.
Figure 43.11
Small
population
Lower reproduction,
higher mortality
Inbreeding,
genetic
drift
Loss of
genetic
variability
Smaller
population
Lower individual
fitness and
population adaptability
© 2014 Pearson Education, Inc.
Case Study: The Greater Prairie Chicken and the
Extinction Vortex
 Populations of the greater prairie chicken in North
America were fragmented by agriculture and later
found to exhibit decreased fertility
 To test the extinction vortex hypothesis, scientists
imported genetic variation by transplanting birds
from larger populations
 The declining population rebounded, confirming that
low genetic variation had been causing an extinction
vortex
© 2014 Pearson Education, Inc.
Figure 43.12
Results
200
150
100
50
0
1970 1975 1980 1985 1990 1995
Translocation
Year
(a) Population dynamics
NumberofmalebirdsEggshatched(%)
100
90
80
70
60
50
40
30
Years
(b) Hatching rate
1970–’74 ’75–’79 ’80–’84 ’85–’89 ’90 ’93–’97
© 2014 Pearson Education, Inc.
Figure 43.12a
Results
200
150
100
50
0
1970 1975 1980 1985 1990 1995
Translocation
Year
(a) Population dynamics
Numberofmalebirds
© 2014 Pearson Education, Inc.
Figure 43.12b
Eggshatched(%)
100
90
80
70
60
50
40
30
Years
(b) Hatching rate
1970–’74 ’75–’79 ’80–’84 ’85–’89 ’90 ’93–’97
Results
© 2014 Pearson Education, Inc.
Figure 43.12c
© 2014 Pearson Education, Inc.
Minimum Viable Population Size
 Minimum viable population (MVP) is the minimum
population size at which a species can survive
 The MVP depends on factors that affect a
population’s chances for survival over a particular
time
© 2014 Pearson Education, Inc.
Effective Population Size
 A meaningful estimate of MVP requires determining
the effective population size, which is based on
the population’s breeding potential
© 2014 Pearson Education, Inc.
 Effective population size (Ne) is estimated by
where Nf and Nm are the number of females and
the number of males, respectively, that breed
successfully
 Conservation programs attempt to sustain population
sizes including a minimum number of reproductively
active individuals to retain genetic diversity
4Nf Nm
Nf + Nm
Ne =
© 2014 Pearson Education, Inc.
Case Study: Analysis of Grizzly Bear Populations
 One of the first population viability analyses was
conducted as part of a long-term study of grizzly
bears in Yellowstone National Park
 It is estimated that a population of 100 bears would
have a 95% chance of surviving about 200 years
 The Yellowstone grizzly population is estimated to
include about 500 individuals, but the Ne is about 125
© 2014 Pearson Education, Inc.
Figure 43.13
© 2014 Pearson Education, Inc.
 The Yellowstone grizzly population has low genetic
variability compared with other grizzly populations
 Introducing individuals from other populations would
increase the numbers and genetic variation
 Promoting dispersal between fragmented
populations is an urgent conservation need
© 2014 Pearson Education, Inc.
Declining-Population Approach
 The declining-population approach
 Focuses on threatened and endangered populations
that show a downward trend, regardless of
population size
 Emphasizes the environmental factors that caused a
population to decline
© 2014 Pearson Education, Inc.
Case Study: Decline of the Red-Cockaded
Woodpecker
 Red-cockaded woodpeckers require living trees in
mature pine forests
 These woodpeckers require forests with little
undergrowth
 Logging, agriculture, and fire suppression have
reduced suitable habitat
© 2014 Pearson Education, Inc.
Figure 43.14
Red-cockaded
woodpecker
(a) Forests with low undergrowth (b) Forests with high, dense
undergrowth
© 2014 Pearson Education, Inc.
Figure 43.14a
(a) Forests with low undergrowth
© 2014 Pearson Education, Inc.
Figure 43.14b
(b) Forests with high, dense undergrowth
© 2014 Pearson Education, Inc.
Figure 43.14c
Red-cockaded
woodpecker
© 2014 Pearson Education, Inc.
 Red-cockaded woodpeckers take months to
excavate nesting cavities
 In a study where breeding cavities were constructed
in restored sites, new breeding groups formed only
in sites with constructed cavities
 Based on this experiment, a combination of habitat
maintenance and excavation of breeding cavities
enabled this endangered species to rebound
© 2014 Pearson Education, Inc.
Weighing Conflicting Demands
 Conserving species often requires resolving conflicts
between habitat needs of endangered species and
human demands
 For example, in the western United States, habitat
preservation for many species is at odds with
grazing and resource extraction industries
 The ecological role of the target species is an
important consideration in conservation
© 2014 Pearson Education, Inc.
Concept 43.3: Landscape and regional
conservation help sustain biodiversity
 Conservation biology has attempted to sustain the
biodiversity of entire communities, ecosystems, and
landscapes
 Ecosystem management is part of landscape
ecology, which seeks to make biodiversity
conservation part of land-use planning
© 2014 Pearson Education, Inc.
Landscape Structure and Biodiversity
 The structure of a landscape can strongly influence
biodiversity
© 2014 Pearson Education, Inc.
Fragmentation and Edges
 The boundaries, or edges, between ecosystems are
defining features of landscapes
 Some species take advantage of edge communities
to access resources from both adjacent areas
© 2014 Pearson Education, Inc.
Figure 43.15
© 2014 Pearson Education, Inc.
 The Biological Dynamics of Forest Fragments
Project in the Amazon examines the effects of
fragmentation on biodiversity
 Landscapes dominated by fragmented habitats
support fewer species due to a loss of species
adapted to habitat interiors
© 2014 Pearson Education, Inc.
Figure 43.16
© 2014 Pearson Education, Inc.
Corridors That Connect Habitat Fragments
 A movement corridor is a narrow strip of habitat
connecting otherwise isolated patches
 Movement corridors promote dispersal and reduce
inbreeding
 Corridors can also have harmful effects, for example,
promoting the spread of disease
 In areas of heavy human use, artificial corridors are
sometimes constructed
© 2014 Pearson Education, Inc.
Figure 43.17
© 2014 Pearson Education, Inc.
Establishing Protected Areas
 Conservation biologists apply understanding of
landscape dynamics in establishing protected areas
to slow the loss of biodiversity
© 2014 Pearson Education, Inc.
Preserving Biodiversity Hot Spots
 A biodiversity hot spot is a relatively small area
with a great concentration of endemic species and
many endangered and threatened species
 Biodiversity hot spots are good choices for nature
reserves, but identifying them is not always easy
© 2014 Pearson Education, Inc.
 Designation of hot spots is often biased toward
saving vertebrates and plants
 Hot spots can change with climate change
© 2014 Pearson Education, Inc.
Figure 43.18
Equator
Earth’s terrestrial ( ) and marine ( ) biodiversity hot spots
© 2014 Pearson Education, Inc.
Philosophy of Nature Reserves
 Nature reserves are biodiversity islands in a sea of
habitat degraded by human activity
 Nature reserves must consider disturbances as a
functional component of all ecosystems
© 2014 Pearson Education, Inc.
 An important question is whether to create numerous
small reserves or fewer large reserves
 Smaller reserves may be more realistic and may
slow the spread of disease between populations
 One argument for large reserves is that large, far-
ranging animals with low-density populations require
extensive habitats
 Large reserves also have proportionally smaller
perimeters, reducing edge effects
© 2014 Pearson Education, Inc.
Figure 43.19
Kilometers
Biotic boundary for
short-term survival;
MVP is 50 individuals.
Biotic boundary for
long-term survival;
MVP is 500 individuals.
MONTANA
WYOMING
WYOMING
IDAHOMONTANA
IDAHO
0 50 100
Yellowstone
National
Park
Grand Teton
National Park
Snake R.
© 2014 Pearson Education, Inc.
Zoned Reserves
 A zoned reserve includes relatively undisturbed
areas surrounded by human-modified areas of
economic value
 The zoned reserve approach creates buffer zones
by regulating human activities in areas surrounding
the protected core
 Zoned reserves are often established as
“conservation areas”
 Costa Rica has become a world leader in establishing
zoned reserves
© 2014 Pearson Education, Inc.
Figure 43.20
Costa
Rica
Nicaragua CARIBBEAN SEA
PACIFIC OCEAN
National park land
Buffer zone
© 2014 Pearson Education, Inc.
 Many fish populations have collapsed due to
modern fishing practices
 Some areas in the Fiji islands are closed to fishing,
which improves fishing success in nearby areas
 The United States has adopted a similar zoned
reserve system with the Florida Keys National
Marine Sanctuary
Video: Coral Reef
© 2014 Pearson Education, Inc.
Figure 43.21
GULF OF MEXICO FLORIDA
Florida Keys National
Marine Sanctuary
50 km
© 2014 Pearson Education, Inc.
Figure 43.21a
© 2014 Pearson Education, Inc.
Concept 43.4: Earth is changing rapidly as a
result of human actions
 The locations of reserves today may be unsuitable
for their species in the future
 Human-caused changes in the environment include
 Nutrient enrichment
 Accumulation of toxins
 Climate change
© 2014 Pearson Education, Inc.
Nutrient Enrichment
 Humans transport nutrients from one part of the
biosphere to another
 Harvest of agricultural crops exports nutrients from
the agricultural ecosystem
 Agriculture leads to the depletion of nutrients in
the soil
 Fertilizers add nitrogen and other nutrients to the
agricultural ecosystem
© 2014 Pearson Education, Inc.
 Critical load is the amount of added nutrient that
can be absorbed by plants without damaging
ecosystem integrity
 Nutrients that exceed the critical load leach into
groundwater or run off into aquatic ecosystems
 Agricultural runoff and sewage lead to phytoplankton
blooms in the Atlantic Ocean
 Decomposition of phytoplankton blooms causes
“dead zones” due to low oxygen levels
© 2014 Pearson Education, Inc.
Figure 43.22
© 2014 Pearson Education, Inc.
Toxins in the Environment
 Humans release many toxic chemicals, including
synthetics previously unknown to nature
 In some cases, harmful substances persist for long
periods in an ecosystem
 One reason toxins are harmful is that they become
more concentrated in successive trophic levels
 Biological magnification concentrates toxins at
higher trophic levels, where biomass is lower
© 2014 Pearson Education, Inc.
 PCBs and many pesticides such as DDT are
subject to biological magnification in ecosystems
 Herring gulls of the Great Lakes lay eggs with PCB
levels 5,000 times greater than in phytoplankton
© 2014 Pearson Education, Inc.
Figure 43.23
Herring
gull eggs
124 ppm
Smelt
1.04 ppm
ConcentrationofPCBs
Lake trout
4.83 ppm
Phytoplankton
0.025 ppm
Zooplankton
0.123 ppm
© 2014 Pearson Education, Inc.
 In the 1960s Rachel Carson brought attention to
the biomagnification of DDT in birds in her book
Silent Spring
 DDT was banned in the United States in 1971
 Countries with malaria face a trade-off between
killing mosquitoes (malarial vectors) and
protecting other species
© 2014 Pearson Education, Inc.
Figure 43.24
© 2014 Pearson Education, Inc.
 Pharmaceutical drugs enter freshwater ecosystems
through human and animal waste
 Estrogen used in birth control pills can cause
feminization of males in some species of fish
© 2014 Pearson Education, Inc.
Figure 43.25
Pharmaceuticals
Farm animals
Sludge
Manure
Farms
Agricultural
runoff
Treated effluent
Lakes and riversSewage
treatment plant
Toilet
Humans
© 2014 Pearson Education, Inc.
Greenhouse Gases and Climate Change
 One pressing problem caused by human activities
is the rising concentration of atmospheric CO2 due
to the burning of fossil fuels and deforestation
© 2014 Pearson Education, Inc.
Figure 43.26
Year
Temperature
Averageglobaltemperature(°C)
CO2concentration(ppm)
CO2
1960 1965 1970 1975 1980 1985 1990 1995 2000 2005 2010
13.6
13.7
13.8
13.9
14.0
14.1
14.214.2
14.3
14.4
14.5
14.6
14.7
14.8
14.9
390
380
370
360
350
340
320
310
300
330
© 2014 Pearson Education, Inc.
 CO2, water vapor, and other greenhouse gases
reflect infrared radiation back toward Earth; this is
the greenhouse effect
 This effect is important for keeping Earth’s surface
at a habitable temperature
 Increasing concentration of atmospheric CO2 is
linked to increasing global temperature
© 2014 Pearson Education, Inc.
 Climatologists can make inferences about
prehistoric climates
 CO2 levels are inferred from bubbles trapped in
glacial ice
 Chemical isotope analysis is used to infer past
temperature
© 2014 Pearson Education, Inc.
 Northern coniferous forests and tundra show the
strongest effects of global warming
 For example, in 2007 the extent of Arctic sea ice
was the smallest on record
© 2014 Pearson Education, Inc.
 Many organisms, especially plants, may not be able
to disperse rapidly enough to survive rapid climate
change
 Researchers can track changes in tree distributions
since the last period of glaciation to help infer future
changes due to climatic warming
Range Shifts and Climate Change
© 2014 Pearson Education, Inc.
Figure 43.27
(a) Current range (b) 4.5°C warming
over next century
(c) 6.5°C warming
over next century
© 2014 Pearson Education, Inc.
 Global warming can be slowed by reducing energy
needs and converting to renewable sources of
energy
 Stabilizing CO2 emissions will require an international
effort and changes in personal lifestyles and
industrial processes
 Reduced deforestation would also decrease
greenhouse gas emissions
Climate Change Solutions
© 2014 Pearson Education, Inc.
Concept 43.5: The human population is no longer
growing exponentially but is still increasing
rapidly
 Global environmental problems arise from growing
consumption and the increasing human population
 No population can grow indefinitely, and humans are
no exception
© 2014 Pearson Education, Inc.
The Global Human Population
 The human population increased relatively slowly
until about 1650 and then began to grow
exponentially
© 2014 Pearson Education, Inc.
Figure 43.28
4000 3000 2000 1000 0
BCE BCE BCE BCE BCE CE CE
1000 2000
0
1
2
3
4
5
6
7
Humanpopulation(billions)
8000
© 2014 Pearson Education, Inc.
 The global population is now more than 7 billion
 Though the global population is still growing, the
rate of growth began to slow during the 1960s
© 2014 Pearson Education, Inc.
Figure 43.29
Year
1950 1975 2000 2025 2050
Projected
data
2011
0
0.2
0.4
0.6
0.8
1.0
1.2
1.4
1.6
Annualpercentincrease 1.8
2.0
2.2
© 2014 Pearson Education, Inc.
 The growth rates of individual nations vary with their
degree of industrialization
 Most of the current global population growth is
concentrated in developing countries
 Human population growth rates can be controlled
through family planning, voluntary contraception,
and increased access to education for females
© 2014 Pearson Education, Inc.
Global Carrying Capacity
 How many humans can the biosphere support?
 Population ecologists predict a global population
of 8.1−10.6 billion people in 2050
© 2014 Pearson Education, Inc.
Estimates of Carrying Capacity
 The carrying capacity of Earth for humans is
uncertain
 The average estimate is 10–15 billion
© 2014 Pearson Education, Inc.
Limits on Human Population Size
 The ecological footprint concept summarizes the
aggregate land and water area needed to sustain
the people of a nation
 It is one measure of how close we are to the
carrying capacity of Earth
 Countries vary greatly in footprint size and available
ecological capacity
© 2014 Pearson Education, Inc.
Figure 43.30
> 300 150–300 50–150 10–50 < 10nergy use (GJ):
© 2014 Pearson Education, Inc.
 Our carrying capacity could potentially be limited
by food, space, nonrenewable resources, or buildup
of wastes
 Unlike other organisms, we can regulate our
population growth through social changes
© 2014 Pearson Education, Inc.
Concept 43.6: Sustainable development can
improve human lives while conserving
biodiversity
 The concept of sustainability helps ecologists
establish long-term conservation priorities
© 2014 Pearson Education, Inc.
Sustainable Development
 Sustainable development is development that
meets the needs of people today without limiting
the ability of future generations to meet their needs
 To sustain ecosystem processes and slow the loss
of biodiversity, connections between life sciences,
social sciences, economics, and humanities must
be made
© 2014 Pearson Education, Inc.
Case Study: Sustainable Development in Costa
Rica
 Costa Rica’s conservation of tropical biodiversity
involves partnerships between the government,
nongovernmental organizations (NGOs), and
private citizens
 Human living conditions (infant mortality, life
expectancy, literacy rate) in Costa Rica have
improved along with ecological conservation
© 2014 Pearson Education, Inc.
The Future of the Biosphere
 Our lives differ greatly from those of early humans,
who hunted and gathered and painted on cave walls
© 2014 Pearson Education, Inc.
Figure 43.31
(a) Detail of animals in a 17,000-year-old
cave painting, Lascaux, France
(b) A 30,000-year-old ivory carving of a
water bird, found in Germany
(d) A young biologist holding a songbird(c) Nature lovers on a wildlife-watching
expedition
© 2014 Pearson Education, Inc.
Figure 43.31a
(a) Detail of animals in a 17,000-year-old
cave painting, Lascaux, France
© 2014 Pearson Education, Inc.
Figure 43.31b
(b) A 30,000-year-old ivory carving of a
water bird, found in Germany
© 2014 Pearson Education, Inc.
Figure 43.31c
(c) Nature lovers on a wildlife-watching
expedition
© 2014 Pearson Education, Inc.
Figure 43.31d
(d) A young biologist holding a songbird
© 2014 Pearson Education, Inc.
 Our behavior reflects remnants of our ancestral
attachment to nature and the diversity of life—the
concept of biophilia
 Our sense of connection to nature may motivate
realignment of our environmental priorities
© 2014 Pearson Education, Inc.
Figure 43.UN02
© 2014 Pearson Education, Inc.
Figure 43.UN03
Genetic diversity: source of variations that enable
populations to adapt to environmental changes
Species diversity: important in maintaining structure
of communities and food webs
Ecosystem diversity: provides life-sustaining services
such as nutrient cycling and waste decomposition

Biology in Focus - Chapter 43

  • 1.
    CAMPBELL BIOLOGY INFOCUS © 2014 Pearson Education, Inc. Urry • Cain • Wasserman • Minorsky • Jackson • Reece Lecture Presentations by Kathleen Fitzpatrick and Nicole Tunbridge 43 Global Ecology and Conservation Biology
  • 2.
    © 2014 PearsonEducation, Inc. Overview: Psychedelic Treasure  Scientists have named and described 1.8 million species  Biologists estimate 10–100 million species exist on Earth  Tropical forests contain some of the greatest concentrations of species and are being destroyed at an alarming rate  Humans are rapidly pushing many species, including the newly discovered psychedelic rock gecko, toward extinction
  • 3.
    © 2014 PearsonEducation, Inc. Figure 43.1
  • 4.
    © 2014 PearsonEducation, Inc. Figure 43.2
  • 5.
    © 2014 PearsonEducation, Inc.  Conservation biology, which seeks to preserve life, integrates several fields  Ecology  Evolutionary biology  Molecular biology  Genetics  Physiology
  • 6.
    © 2014 PearsonEducation, Inc. Concept 43.1: Human activities threaten Earth’s biodiversity  Rates of species extinction are difficult to determine under natural conditions  Extinction is a natural process, but the high rate of extinction is responsible for today’s biodiversity crisis  Human activities are threatening Earth’s biodiversity
  • 7.
    © 2014 PearsonEducation, Inc. Three Levels of Biodiversity  Biodiversity has three main components  Genetic diversity  Species diversity  Ecosystem diversity
  • 8.
    © 2014 PearsonEducation, Inc. Figure 43.3-1 Genetic diversity in a vole population
  • 9.
    © 2014 PearsonEducation, Inc. Figure 43.3-2 Species diversity in a coastal redwood ecosystem Genetic diversity in a vole population
  • 10.
    © 2014 PearsonEducation, Inc. Figure 43.3-3 Species diversity in a coastal redwood ecosystem Genetic diversity in a vole population Community and ecosystem diversity across the landscape of an entire region
  • 11.
    © 2014 PearsonEducation, Inc. Genetic Diversity  Genetic diversity comprises genetic variation within a population and between populations  Population extinctions reduce genetic diversity, which in turn reduces the adaptive potential of a species
  • 12.
    © 2014 PearsonEducation, Inc. Species Diversity  Species diversity is the variety of species in an ecosystem or throughout the biosphere  According to the U.S. Endangered Species Act  An endangered species is “in danger of becoming extinct throughout all or a significant portion of its range”  A threatened species is likely to become endangered in the near future
  • 13.
    © 2014 PearsonEducation, Inc.  Conservation biologists are concerned about species loss because of alarming statistics regarding extinction and biodiversity  Globally, 12% of birds and 21% of mammals are threatened with extinction  Extinction may be local or global
  • 14.
    © 2014 PearsonEducation, Inc. Figure 43.4 Philippine eagle Yangtze River dolphin
  • 15.
    © 2014 PearsonEducation, Inc. Figure 43.4a Philippine eagle
  • 16.
    © 2014 PearsonEducation, Inc. Figure 43.4b Yangtze River dolphin
  • 17.
    © 2014 PearsonEducation, Inc. Ecosystem Diversity  Human activity is reducing ecosystem diversity, the variety of ecosystems in the biosphere  More than 50% of wetlands in the contiguous United States have been drained and converted to agricultural or other use
  • 18.
    © 2014 PearsonEducation, Inc.  The local extinction of one species can have a negative impact on other species in an ecosystem  For example, flying foxes (bats) are important pollinators and seed dispersers in the Pacific Islands
  • 19.
    © 2014 PearsonEducation, Inc. Figure 43.5
  • 20.
    © 2014 PearsonEducation, Inc. Biodiversity and Human Welfare  Human biophilia allows us to recognize the value of biodiversity for its own sake  Species diversity brings humans practical benefits
  • 21.
    © 2014 PearsonEducation, Inc. Benefits of Species and Genetic Diversity  Species related to agricultural crops can have important genetic qualities  For example, plant breeders bred virus-resistant commercial rice by crossing it with a wild population  In the United States, 25% of prescriptions contain substances originally derived from plants  For example, the rosy periwinkle contains alkaloids that inhibit cancer growth
  • 22.
    © 2014 PearsonEducation, Inc. Figure 43.UN01 Rosy periwinkle
  • 23.
    © 2014 PearsonEducation, Inc.  The loss of species also means loss of unique genes and genetic diversity  The enormous genetic diversity of organisms has potential for great human benefit
  • 24.
    © 2014 PearsonEducation, Inc. Ecosystem Services  Ecosystem services encompass all the processes through which natural ecosystems help sustain human life  Some examples of ecosystem services  Purification of air and water  Detoxification and decomposition of wastes  Crop pollination, pest control, and soil preservation  Ecosystem services have an estimated value of $33 trillion per year, but are provided for free
  • 25.
    © 2014 PearsonEducation, Inc. Threats to Biodiversity  Most species loss can be traced to four major threats  Habitat loss  Introduced species  Overharvesting  Global change
  • 26.
    © 2014 PearsonEducation, Inc. Habitat Loss  Human alteration of habitat is the greatest threat to biodiversity throughout the biosphere  In almost all cases, habitat fragmentation and destruction lead to loss of biodiversity  For example  In Wisconsin, prairie habitat has been reduced by over 99.9%, resulting in the loss of up to 60% of the original plant species
  • 27.
    © 2014 PearsonEducation, Inc. Figure 43.6
  • 28.
    © 2014 PearsonEducation, Inc. Introduced Species  Introduced species are those that humans move from native locations to new geographic regions  Without their native predators, parasites, and pathogens, introduced species may spread rapidly  Introduced species that gain a foothold in a new habitat usually disrupt their adopted community
  • 29.
    © 2014 PearsonEducation, Inc.  Humans have deliberately introduced some species with good intentions but disastrous effects  For example, kudzu was intentionally introduced to the southern United States
  • 30.
    © 2014 PearsonEducation, Inc. Figure 43.7
  • 31.
    © 2014 PearsonEducation, Inc. Overharvesting  Overharvesting is human harvesting of wild plants or animals at rates exceeding the ability of populations of those species to rebound  Species with restricted habitats or large body size with low reproductive rates are especially vulnerable to overharvesting  For example, elephant populations declined because of harvesting for ivory
  • 32.
    © 2014 PearsonEducation, Inc.  DNA analysis can help conservation biologists identify the source of illegally obtained animal products  For example, DNA from illegally harvested ivory can be used to trace the original population of elephants to within a few hundred kilometers
  • 33.
    © 2014 PearsonEducation, Inc. Figure 43.8
  • 34.
    © 2014 PearsonEducation, Inc.  Overfishing has decimated wild fish populations  For example, the North Atlantic bluefin tuna population decreased by 80% in ten years
  • 35.
    © 2014 PearsonEducation, Inc. Figure 43.9
  • 36.
    © 2014 PearsonEducation, Inc. Global Change  Global change includes alterations in climate, atmospheric chemistry, and broad ecological systems  Acid precipitation is rain, snow, sleet, or fog with a pH <5.2  Acid precipitation contains sulfuric acid and nitric acid from the burning of wood and fossil fuels
  • 37.
    © 2014 PearsonEducation, Inc.  Air pollution from one region can result in acid precipitation downwind  For example, industrial pollution in the midwestern United States caused acid precipitation in eastern Canada in the 1960s  Acid precipitation kills fish and other lake-dwelling organisms  Environmental regulations have helped to decrease acid precipitation  For example, sulfur dioxide emissions in the United States decreased >40% between 1993 and 2009
  • 38.
    © 2014 PearsonEducation, Inc. Figure 43.10 4.8 4.7 4.6 4.5 4.4 4.3 4.2 4.1 4.0 pH 1960 ’65 ’70 ’75 ’80 ’85 Year ’90 ’95 2000 ’05 ’10
  • 39.
    © 2014 PearsonEducation, Inc. Concept 43.2: Population conservation focuses on population size, genetic diversity, and critical habitat  Biologists focusing on conservation at the population and species levels follow two main approaches  The small-population approach  The declining-population approach
  • 40.
    © 2014 PearsonEducation, Inc. Small-Population Approach  The small-population approach studies processes that can make small populations become extinct
  • 41.
    © 2014 PearsonEducation, Inc. The Extinction Vortex: Evolutionary Implications of Small Population Size  A small population is prone to inbreeding and genetic drift, which draw it down an extinction vortex  The key factor driving the extinction vortex is loss of the genetic variation necessary to enable evolutionary responses to environmental change  Small populations and low genetic diversity do not always lead to extinction
  • 42.
    © 2014 PearsonEducation, Inc. Figure 43.11 Small population Lower reproduction, higher mortality Inbreeding, genetic drift Loss of genetic variability Smaller population Lower individual fitness and population adaptability
  • 43.
    © 2014 PearsonEducation, Inc. Case Study: The Greater Prairie Chicken and the Extinction Vortex  Populations of the greater prairie chicken in North America were fragmented by agriculture and later found to exhibit decreased fertility  To test the extinction vortex hypothesis, scientists imported genetic variation by transplanting birds from larger populations  The declining population rebounded, confirming that low genetic variation had been causing an extinction vortex
  • 44.
    © 2014 PearsonEducation, Inc. Figure 43.12 Results 200 150 100 50 0 1970 1975 1980 1985 1990 1995 Translocation Year (a) Population dynamics NumberofmalebirdsEggshatched(%) 100 90 80 70 60 50 40 30 Years (b) Hatching rate 1970–’74 ’75–’79 ’80–’84 ’85–’89 ’90 ’93–’97
  • 45.
    © 2014 PearsonEducation, Inc. Figure 43.12a Results 200 150 100 50 0 1970 1975 1980 1985 1990 1995 Translocation Year (a) Population dynamics Numberofmalebirds
  • 46.
    © 2014 PearsonEducation, Inc. Figure 43.12b Eggshatched(%) 100 90 80 70 60 50 40 30 Years (b) Hatching rate 1970–’74 ’75–’79 ’80–’84 ’85–’89 ’90 ’93–’97 Results
  • 47.
    © 2014 PearsonEducation, Inc. Figure 43.12c
  • 48.
    © 2014 PearsonEducation, Inc. Minimum Viable Population Size  Minimum viable population (MVP) is the minimum population size at which a species can survive  The MVP depends on factors that affect a population’s chances for survival over a particular time
  • 49.
    © 2014 PearsonEducation, Inc. Effective Population Size  A meaningful estimate of MVP requires determining the effective population size, which is based on the population’s breeding potential
  • 50.
    © 2014 PearsonEducation, Inc.  Effective population size (Ne) is estimated by where Nf and Nm are the number of females and the number of males, respectively, that breed successfully  Conservation programs attempt to sustain population sizes including a minimum number of reproductively active individuals to retain genetic diversity 4Nf Nm Nf + Nm Ne =
  • 51.
    © 2014 PearsonEducation, Inc. Case Study: Analysis of Grizzly Bear Populations  One of the first population viability analyses was conducted as part of a long-term study of grizzly bears in Yellowstone National Park  It is estimated that a population of 100 bears would have a 95% chance of surviving about 200 years  The Yellowstone grizzly population is estimated to include about 500 individuals, but the Ne is about 125
  • 52.
    © 2014 PearsonEducation, Inc. Figure 43.13
  • 53.
    © 2014 PearsonEducation, Inc.  The Yellowstone grizzly population has low genetic variability compared with other grizzly populations  Introducing individuals from other populations would increase the numbers and genetic variation  Promoting dispersal between fragmented populations is an urgent conservation need
  • 54.
    © 2014 PearsonEducation, Inc. Declining-Population Approach  The declining-population approach  Focuses on threatened and endangered populations that show a downward trend, regardless of population size  Emphasizes the environmental factors that caused a population to decline
  • 55.
    © 2014 PearsonEducation, Inc. Case Study: Decline of the Red-Cockaded Woodpecker  Red-cockaded woodpeckers require living trees in mature pine forests  These woodpeckers require forests with little undergrowth  Logging, agriculture, and fire suppression have reduced suitable habitat
  • 56.
    © 2014 PearsonEducation, Inc. Figure 43.14 Red-cockaded woodpecker (a) Forests with low undergrowth (b) Forests with high, dense undergrowth
  • 57.
    © 2014 PearsonEducation, Inc. Figure 43.14a (a) Forests with low undergrowth
  • 58.
    © 2014 PearsonEducation, Inc. Figure 43.14b (b) Forests with high, dense undergrowth
  • 59.
    © 2014 PearsonEducation, Inc. Figure 43.14c Red-cockaded woodpecker
  • 60.
    © 2014 PearsonEducation, Inc.  Red-cockaded woodpeckers take months to excavate nesting cavities  In a study where breeding cavities were constructed in restored sites, new breeding groups formed only in sites with constructed cavities  Based on this experiment, a combination of habitat maintenance and excavation of breeding cavities enabled this endangered species to rebound
  • 61.
    © 2014 PearsonEducation, Inc. Weighing Conflicting Demands  Conserving species often requires resolving conflicts between habitat needs of endangered species and human demands  For example, in the western United States, habitat preservation for many species is at odds with grazing and resource extraction industries  The ecological role of the target species is an important consideration in conservation
  • 62.
    © 2014 PearsonEducation, Inc. Concept 43.3: Landscape and regional conservation help sustain biodiversity  Conservation biology has attempted to sustain the biodiversity of entire communities, ecosystems, and landscapes  Ecosystem management is part of landscape ecology, which seeks to make biodiversity conservation part of land-use planning
  • 63.
    © 2014 PearsonEducation, Inc. Landscape Structure and Biodiversity  The structure of a landscape can strongly influence biodiversity
  • 64.
    © 2014 PearsonEducation, Inc. Fragmentation and Edges  The boundaries, or edges, between ecosystems are defining features of landscapes  Some species take advantage of edge communities to access resources from both adjacent areas
  • 65.
    © 2014 PearsonEducation, Inc. Figure 43.15
  • 66.
    © 2014 PearsonEducation, Inc.  The Biological Dynamics of Forest Fragments Project in the Amazon examines the effects of fragmentation on biodiversity  Landscapes dominated by fragmented habitats support fewer species due to a loss of species adapted to habitat interiors
  • 67.
    © 2014 PearsonEducation, Inc. Figure 43.16
  • 68.
    © 2014 PearsonEducation, Inc. Corridors That Connect Habitat Fragments  A movement corridor is a narrow strip of habitat connecting otherwise isolated patches  Movement corridors promote dispersal and reduce inbreeding  Corridors can also have harmful effects, for example, promoting the spread of disease  In areas of heavy human use, artificial corridors are sometimes constructed
  • 69.
    © 2014 PearsonEducation, Inc. Figure 43.17
  • 70.
    © 2014 PearsonEducation, Inc. Establishing Protected Areas  Conservation biologists apply understanding of landscape dynamics in establishing protected areas to slow the loss of biodiversity
  • 71.
    © 2014 PearsonEducation, Inc. Preserving Biodiversity Hot Spots  A biodiversity hot spot is a relatively small area with a great concentration of endemic species and many endangered and threatened species  Biodiversity hot spots are good choices for nature reserves, but identifying them is not always easy
  • 72.
    © 2014 PearsonEducation, Inc.  Designation of hot spots is often biased toward saving vertebrates and plants  Hot spots can change with climate change
  • 73.
    © 2014 PearsonEducation, Inc. Figure 43.18 Equator Earth’s terrestrial ( ) and marine ( ) biodiversity hot spots
  • 74.
    © 2014 PearsonEducation, Inc. Philosophy of Nature Reserves  Nature reserves are biodiversity islands in a sea of habitat degraded by human activity  Nature reserves must consider disturbances as a functional component of all ecosystems
  • 75.
    © 2014 PearsonEducation, Inc.  An important question is whether to create numerous small reserves or fewer large reserves  Smaller reserves may be more realistic and may slow the spread of disease between populations  One argument for large reserves is that large, far- ranging animals with low-density populations require extensive habitats  Large reserves also have proportionally smaller perimeters, reducing edge effects
  • 76.
    © 2014 PearsonEducation, Inc. Figure 43.19 Kilometers Biotic boundary for short-term survival; MVP is 50 individuals. Biotic boundary for long-term survival; MVP is 500 individuals. MONTANA WYOMING WYOMING IDAHOMONTANA IDAHO 0 50 100 Yellowstone National Park Grand Teton National Park Snake R.
  • 77.
    © 2014 PearsonEducation, Inc. Zoned Reserves  A zoned reserve includes relatively undisturbed areas surrounded by human-modified areas of economic value  The zoned reserve approach creates buffer zones by regulating human activities in areas surrounding the protected core  Zoned reserves are often established as “conservation areas”  Costa Rica has become a world leader in establishing zoned reserves
  • 78.
    © 2014 PearsonEducation, Inc. Figure 43.20 Costa Rica Nicaragua CARIBBEAN SEA PACIFIC OCEAN National park land Buffer zone
  • 79.
    © 2014 PearsonEducation, Inc.  Many fish populations have collapsed due to modern fishing practices  Some areas in the Fiji islands are closed to fishing, which improves fishing success in nearby areas  The United States has adopted a similar zoned reserve system with the Florida Keys National Marine Sanctuary Video: Coral Reef
  • 80.
    © 2014 PearsonEducation, Inc. Figure 43.21 GULF OF MEXICO FLORIDA Florida Keys National Marine Sanctuary 50 km
  • 81.
    © 2014 PearsonEducation, Inc. Figure 43.21a
  • 82.
    © 2014 PearsonEducation, Inc. Concept 43.4: Earth is changing rapidly as a result of human actions  The locations of reserves today may be unsuitable for their species in the future  Human-caused changes in the environment include  Nutrient enrichment  Accumulation of toxins  Climate change
  • 83.
    © 2014 PearsonEducation, Inc. Nutrient Enrichment  Humans transport nutrients from one part of the biosphere to another  Harvest of agricultural crops exports nutrients from the agricultural ecosystem  Agriculture leads to the depletion of nutrients in the soil  Fertilizers add nitrogen and other nutrients to the agricultural ecosystem
  • 84.
    © 2014 PearsonEducation, Inc.  Critical load is the amount of added nutrient that can be absorbed by plants without damaging ecosystem integrity  Nutrients that exceed the critical load leach into groundwater or run off into aquatic ecosystems  Agricultural runoff and sewage lead to phytoplankton blooms in the Atlantic Ocean  Decomposition of phytoplankton blooms causes “dead zones” due to low oxygen levels
  • 85.
    © 2014 PearsonEducation, Inc. Figure 43.22
  • 86.
    © 2014 PearsonEducation, Inc. Toxins in the Environment  Humans release many toxic chemicals, including synthetics previously unknown to nature  In some cases, harmful substances persist for long periods in an ecosystem  One reason toxins are harmful is that they become more concentrated in successive trophic levels  Biological magnification concentrates toxins at higher trophic levels, where biomass is lower
  • 87.
    © 2014 PearsonEducation, Inc.  PCBs and many pesticides such as DDT are subject to biological magnification in ecosystems  Herring gulls of the Great Lakes lay eggs with PCB levels 5,000 times greater than in phytoplankton
  • 88.
    © 2014 PearsonEducation, Inc. Figure 43.23 Herring gull eggs 124 ppm Smelt 1.04 ppm ConcentrationofPCBs Lake trout 4.83 ppm Phytoplankton 0.025 ppm Zooplankton 0.123 ppm
  • 89.
    © 2014 PearsonEducation, Inc.  In the 1960s Rachel Carson brought attention to the biomagnification of DDT in birds in her book Silent Spring  DDT was banned in the United States in 1971  Countries with malaria face a trade-off between killing mosquitoes (malarial vectors) and protecting other species
  • 90.
    © 2014 PearsonEducation, Inc. Figure 43.24
  • 91.
    © 2014 PearsonEducation, Inc.  Pharmaceutical drugs enter freshwater ecosystems through human and animal waste  Estrogen used in birth control pills can cause feminization of males in some species of fish
  • 92.
    © 2014 PearsonEducation, Inc. Figure 43.25 Pharmaceuticals Farm animals Sludge Manure Farms Agricultural runoff Treated effluent Lakes and riversSewage treatment plant Toilet Humans
  • 93.
    © 2014 PearsonEducation, Inc. Greenhouse Gases and Climate Change  One pressing problem caused by human activities is the rising concentration of atmospheric CO2 due to the burning of fossil fuels and deforestation
  • 94.
    © 2014 PearsonEducation, Inc. Figure 43.26 Year Temperature Averageglobaltemperature(°C) CO2concentration(ppm) CO2 1960 1965 1970 1975 1980 1985 1990 1995 2000 2005 2010 13.6 13.7 13.8 13.9 14.0 14.1 14.214.2 14.3 14.4 14.5 14.6 14.7 14.8 14.9 390 380 370 360 350 340 320 310 300 330
  • 95.
    © 2014 PearsonEducation, Inc.  CO2, water vapor, and other greenhouse gases reflect infrared radiation back toward Earth; this is the greenhouse effect  This effect is important for keeping Earth’s surface at a habitable temperature  Increasing concentration of atmospheric CO2 is linked to increasing global temperature
  • 96.
    © 2014 PearsonEducation, Inc.  Climatologists can make inferences about prehistoric climates  CO2 levels are inferred from bubbles trapped in glacial ice  Chemical isotope analysis is used to infer past temperature
  • 97.
    © 2014 PearsonEducation, Inc.  Northern coniferous forests and tundra show the strongest effects of global warming  For example, in 2007 the extent of Arctic sea ice was the smallest on record
  • 98.
    © 2014 PearsonEducation, Inc.  Many organisms, especially plants, may not be able to disperse rapidly enough to survive rapid climate change  Researchers can track changes in tree distributions since the last period of glaciation to help infer future changes due to climatic warming Range Shifts and Climate Change
  • 99.
    © 2014 PearsonEducation, Inc. Figure 43.27 (a) Current range (b) 4.5°C warming over next century (c) 6.5°C warming over next century
  • 100.
    © 2014 PearsonEducation, Inc.  Global warming can be slowed by reducing energy needs and converting to renewable sources of energy  Stabilizing CO2 emissions will require an international effort and changes in personal lifestyles and industrial processes  Reduced deforestation would also decrease greenhouse gas emissions Climate Change Solutions
  • 101.
    © 2014 PearsonEducation, Inc. Concept 43.5: The human population is no longer growing exponentially but is still increasing rapidly  Global environmental problems arise from growing consumption and the increasing human population  No population can grow indefinitely, and humans are no exception
  • 102.
    © 2014 PearsonEducation, Inc. The Global Human Population  The human population increased relatively slowly until about 1650 and then began to grow exponentially
  • 103.
    © 2014 PearsonEducation, Inc. Figure 43.28 4000 3000 2000 1000 0 BCE BCE BCE BCE BCE CE CE 1000 2000 0 1 2 3 4 5 6 7 Humanpopulation(billions) 8000
  • 104.
    © 2014 PearsonEducation, Inc.  The global population is now more than 7 billion  Though the global population is still growing, the rate of growth began to slow during the 1960s
  • 105.
    © 2014 PearsonEducation, Inc. Figure 43.29 Year 1950 1975 2000 2025 2050 Projected data 2011 0 0.2 0.4 0.6 0.8 1.0 1.2 1.4 1.6 Annualpercentincrease 1.8 2.0 2.2
  • 106.
    © 2014 PearsonEducation, Inc.  The growth rates of individual nations vary with their degree of industrialization  Most of the current global population growth is concentrated in developing countries  Human population growth rates can be controlled through family planning, voluntary contraception, and increased access to education for females
  • 107.
    © 2014 PearsonEducation, Inc. Global Carrying Capacity  How many humans can the biosphere support?  Population ecologists predict a global population of 8.1−10.6 billion people in 2050
  • 108.
    © 2014 PearsonEducation, Inc. Estimates of Carrying Capacity  The carrying capacity of Earth for humans is uncertain  The average estimate is 10–15 billion
  • 109.
    © 2014 PearsonEducation, Inc. Limits on Human Population Size  The ecological footprint concept summarizes the aggregate land and water area needed to sustain the people of a nation  It is one measure of how close we are to the carrying capacity of Earth  Countries vary greatly in footprint size and available ecological capacity
  • 110.
    © 2014 PearsonEducation, Inc. Figure 43.30 > 300 150–300 50–150 10–50 < 10nergy use (GJ):
  • 111.
    © 2014 PearsonEducation, Inc.  Our carrying capacity could potentially be limited by food, space, nonrenewable resources, or buildup of wastes  Unlike other organisms, we can regulate our population growth through social changes
  • 112.
    © 2014 PearsonEducation, Inc. Concept 43.6: Sustainable development can improve human lives while conserving biodiversity  The concept of sustainability helps ecologists establish long-term conservation priorities
  • 113.
    © 2014 PearsonEducation, Inc. Sustainable Development  Sustainable development is development that meets the needs of people today without limiting the ability of future generations to meet their needs  To sustain ecosystem processes and slow the loss of biodiversity, connections between life sciences, social sciences, economics, and humanities must be made
  • 114.
    © 2014 PearsonEducation, Inc. Case Study: Sustainable Development in Costa Rica  Costa Rica’s conservation of tropical biodiversity involves partnerships between the government, nongovernmental organizations (NGOs), and private citizens  Human living conditions (infant mortality, life expectancy, literacy rate) in Costa Rica have improved along with ecological conservation
  • 115.
    © 2014 PearsonEducation, Inc. The Future of the Biosphere  Our lives differ greatly from those of early humans, who hunted and gathered and painted on cave walls
  • 116.
    © 2014 PearsonEducation, Inc. Figure 43.31 (a) Detail of animals in a 17,000-year-old cave painting, Lascaux, France (b) A 30,000-year-old ivory carving of a water bird, found in Germany (d) A young biologist holding a songbird(c) Nature lovers on a wildlife-watching expedition
  • 117.
    © 2014 PearsonEducation, Inc. Figure 43.31a (a) Detail of animals in a 17,000-year-old cave painting, Lascaux, France
  • 118.
    © 2014 PearsonEducation, Inc. Figure 43.31b (b) A 30,000-year-old ivory carving of a water bird, found in Germany
  • 119.
    © 2014 PearsonEducation, Inc. Figure 43.31c (c) Nature lovers on a wildlife-watching expedition
  • 120.
    © 2014 PearsonEducation, Inc. Figure 43.31d (d) A young biologist holding a songbird
  • 121.
    © 2014 PearsonEducation, Inc.  Our behavior reflects remnants of our ancestral attachment to nature and the diversity of life—the concept of biophilia  Our sense of connection to nature may motivate realignment of our environmental priorities
  • 122.
    © 2014 PearsonEducation, Inc. Figure 43.UN02
  • 123.
    © 2014 PearsonEducation, Inc. Figure 43.UN03 Genetic diversity: source of variations that enable populations to adapt to environmental changes Species diversity: important in maintaining structure of communities and food webs Ecosystem diversity: provides life-sustaining services such as nutrient cycling and waste decomposition

Editor's Notes

  • #4 Figure 43.1 What will be the fate of this newly described lizard species?
  • #5 Figure 43.2 Tropical deforestation in Vietnam
  • #9 Figure 43.3-1 Three levels of biodiversity (step 1)
  • #10 Figure 43.3-2 Three levels of biodiversity (step 2)
  • #11 Figure 43.3-3 Three levels of biodiversity (step 3)
  • #15 Figure 43.4 A hundred heartbeats from extinction
  • #16 Figure 43.4a A hundred heartbeats from extinction (part 1: Philippine eagle)
  • #17 Figure 43.4b A hundred heartbeats from extinction (part 2: Yangtze River dolphin)
  • #20 Figure 43.5 The endangered Marianas “flying fox” bat (Pteropus mariannus), an important pollinator
  • #23 Figure 43.UN01 In-text figure, rosy periwinkle, p. 885
  • #28 Figure 43.6 Habitat fragmentation in the foothills of Los Angeles
  • #31 Figure 43.7 Kudzu, an introduced species, thriving in South Carolina
  • #34 Figure 43.8 Ecological forensics and elephant poaching
  • #36 Figure 43.9 Overharvesting
  • #39 Figure 43.10 Changes in the pH of precipitation at Hubbard Brook, New Hampshire
  • #43 Figure 43.11 Processes driving an extinction vortex
  • #45 Figure 43.12 Inquiry: What caused the drastic decline of the Illinois greater prairie chicken population?
  • #46 Figure 43.12a Inquiry: What caused the drastic decline of the Illinois greater prairie chicken population? (part 1: population dynamics)
  • #47 Figure 43.12b Inquiry: What caused the drastic decline of the Illinois greater prairie chicken population? (part 2: hatching rate)
  • #48 Figure 43.12c Inquiry: What caused the drastic decline of the Illinois greater prairie chicken population? (part 3: photo)
  • #53 Figure 43.13 Long-term monitoring of a grizzly bear population
  • #57 Figure 43.14 A habitat requirement of the red-cockaded woodpecker
  • #58 Figure 43.14a A habitat requirement of the red-cockaded woodpecker (part 1: low undergrowth)
  • #59 Figure 43.14b A habitat requirement of the red-cockaded woodpecker (part 2: high undergrowth)
  • #60 Figure 43.14c A habitat requirement of the red-cockaded woodpecker (part 3: woodpecker)
  • #66 Figure 43.15 Edges between ecosystems
  • #68 Figure 43.16 Amazon rain forest fragments created as part of the Biological Dynamics of Forest Fragments Project
  • #70 Figure 43.17 An artificial corridor
  • #74 Figure 43.18 Earth’s terrestrial and marine biodiversity hot spots
  • #77 Figure 43.19 Biotic boundaries for grizzly bears in Yellowstone and Grand Teton National Parks
  • #79 Figure 43.20 Zoned reserves in Costa Rica
  • #81 Figure 43.21 A diver measuring coral in the Florida Keys National Marine Sanctuary
  • #82 Figure 43.21a A diver measuring coral in the Florida Keys National Marine Sanctuary (photo)
  • #86 Figure 43.22 A phytoplankton bloom arising from nitrogen pollution in the Mississippi basin that leads to a dead zone
  • #89 Figure 43.23 Biological magnification of PCBs in a Great Lakes food web
  • #91 Figure 43.24 Rachel Carson
  • #93 Figure 43.25 Sources and movements of pharmaceuticals in the environment
  • #95 Figure 43.26 Increase in atmospheric carbon dioxide concentration at Mauna Loa, Hawaii, and average global temperatures
  • #100 Figure 43.27 Current range and predicted range for the American beech under two climate-change scenarios
  • #104 Figure 43.28 Human population growth (data as of 2011)
  • #106 Figure 43.29 Annual percent increase in the global human population (data as of 2011)
  • #111 Figure 43.30 Annual per capita energy use around the world
  • #117 Figure 43.31 Biophilia, past and present
  • #118 Figure 43.31a Biophilia, past and present (part 1: cave painting)
  • #119 Figure 43.31b Biophilia, past and present (part 2: ivory carving)
  • #120 Figure 43.31c Biophilia, past and present (part 3: wildlife expedition)
  • #121 Figure 43.31d Biophilia, past and present (part 4: study of biology)
  • #123 Figure 43.UN02 Skills exercise: graphing cyclic data
  • #124 Figure 43.UN03 Summary of key concepts: levels of biodiversity