Workshop: Introduction to Cytoscape at UT-KBRIN Bioinformatics Summit 2014 (4/11/2014)
This document summarizes a presentation given by Keiichiro Ono on the open source software platform Cytoscape. Ono introduced Cytoscape as a tool for biological network analysis and visualization. He discussed how it can integrate network and attribute data, perform network analysis functions like filtering and calculating statistics, and visualize networks through customizable layouts and visual styles. Ono also highlighted Cytoscape's ecosystem of apps that extend its functionality and its use of open standards to import a variety of network and attribute data formats.
Introduction by Keiichiro Ono, Cytoscape core developer; discusses his role, experience, and the significance of Cytoscape in biological network analysis.
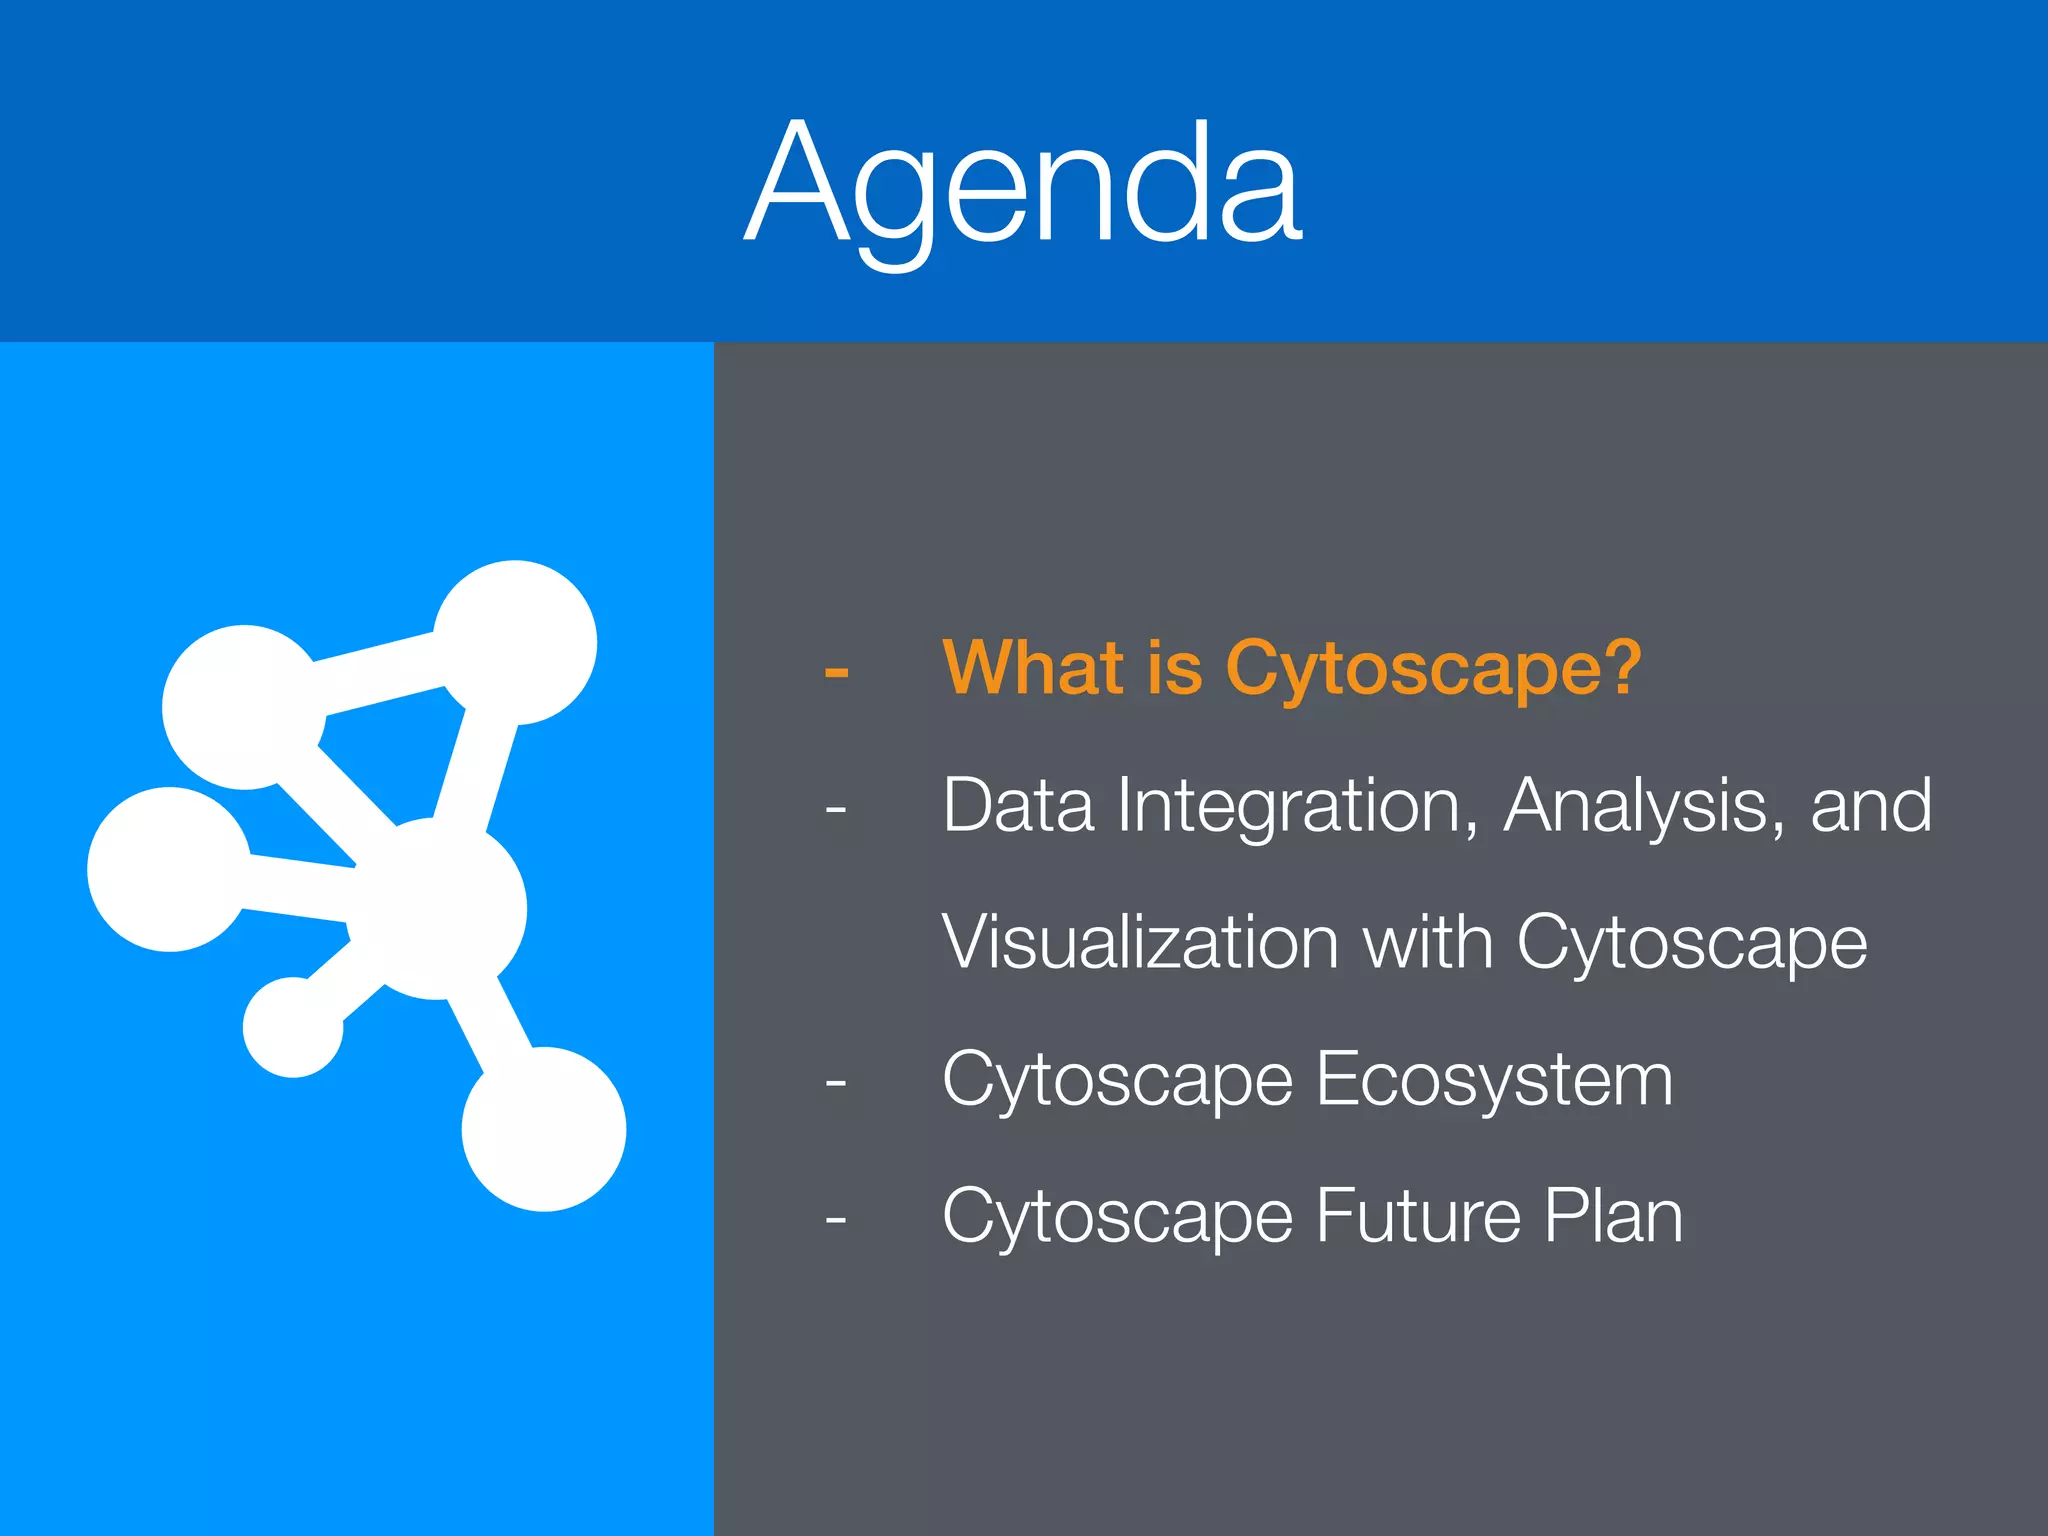
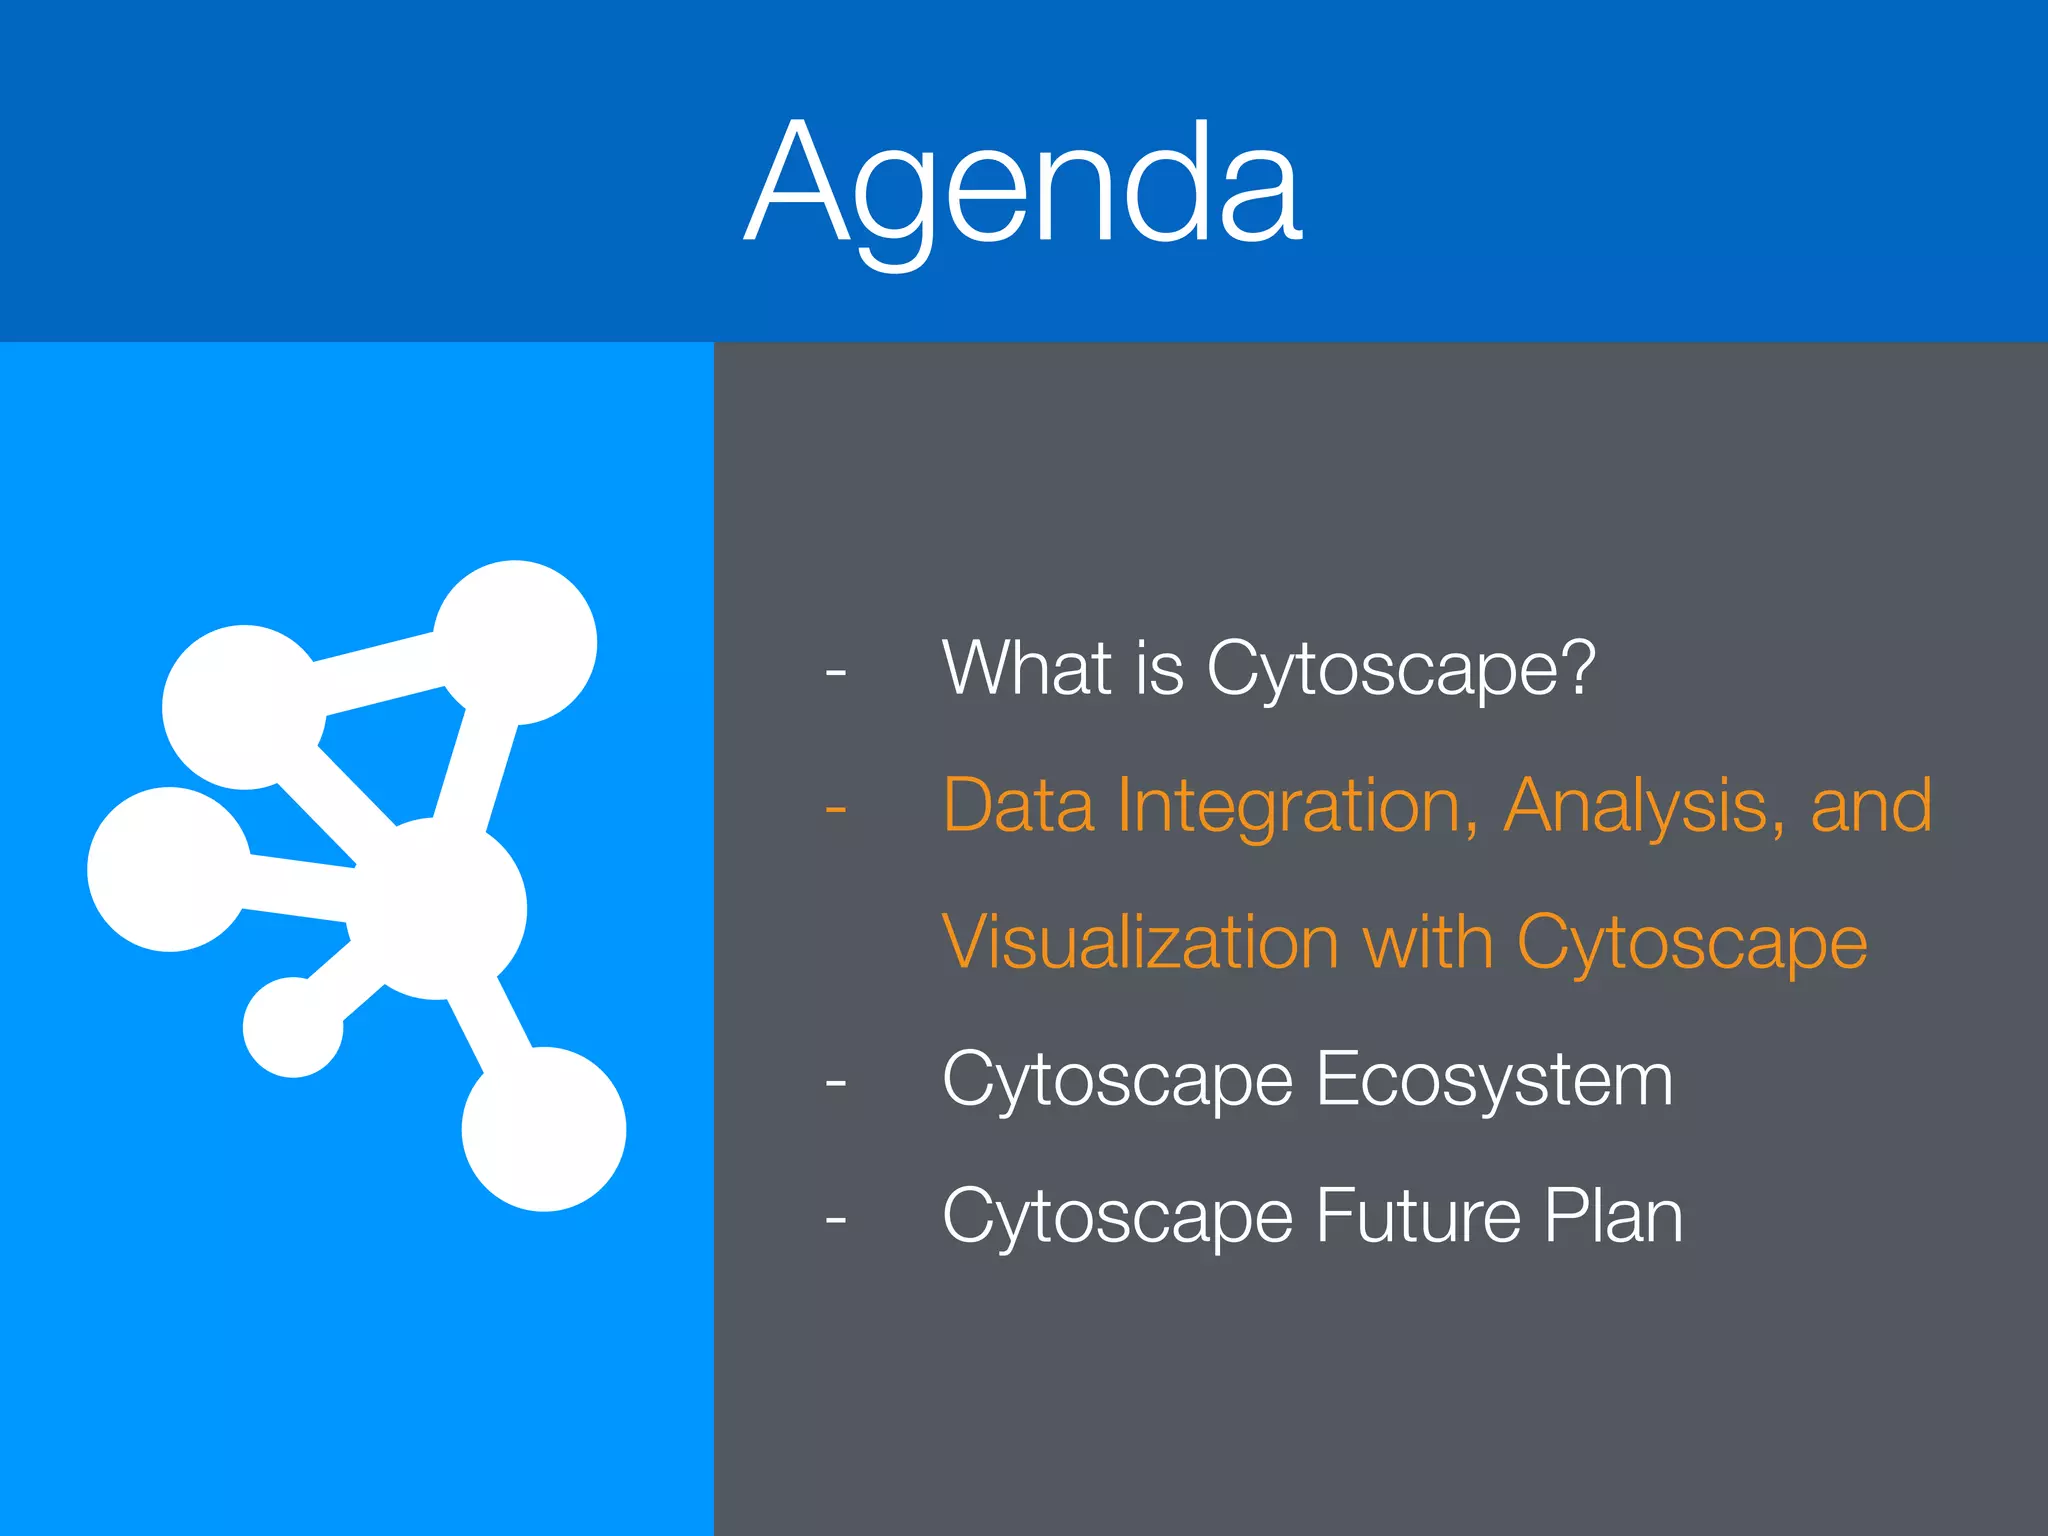
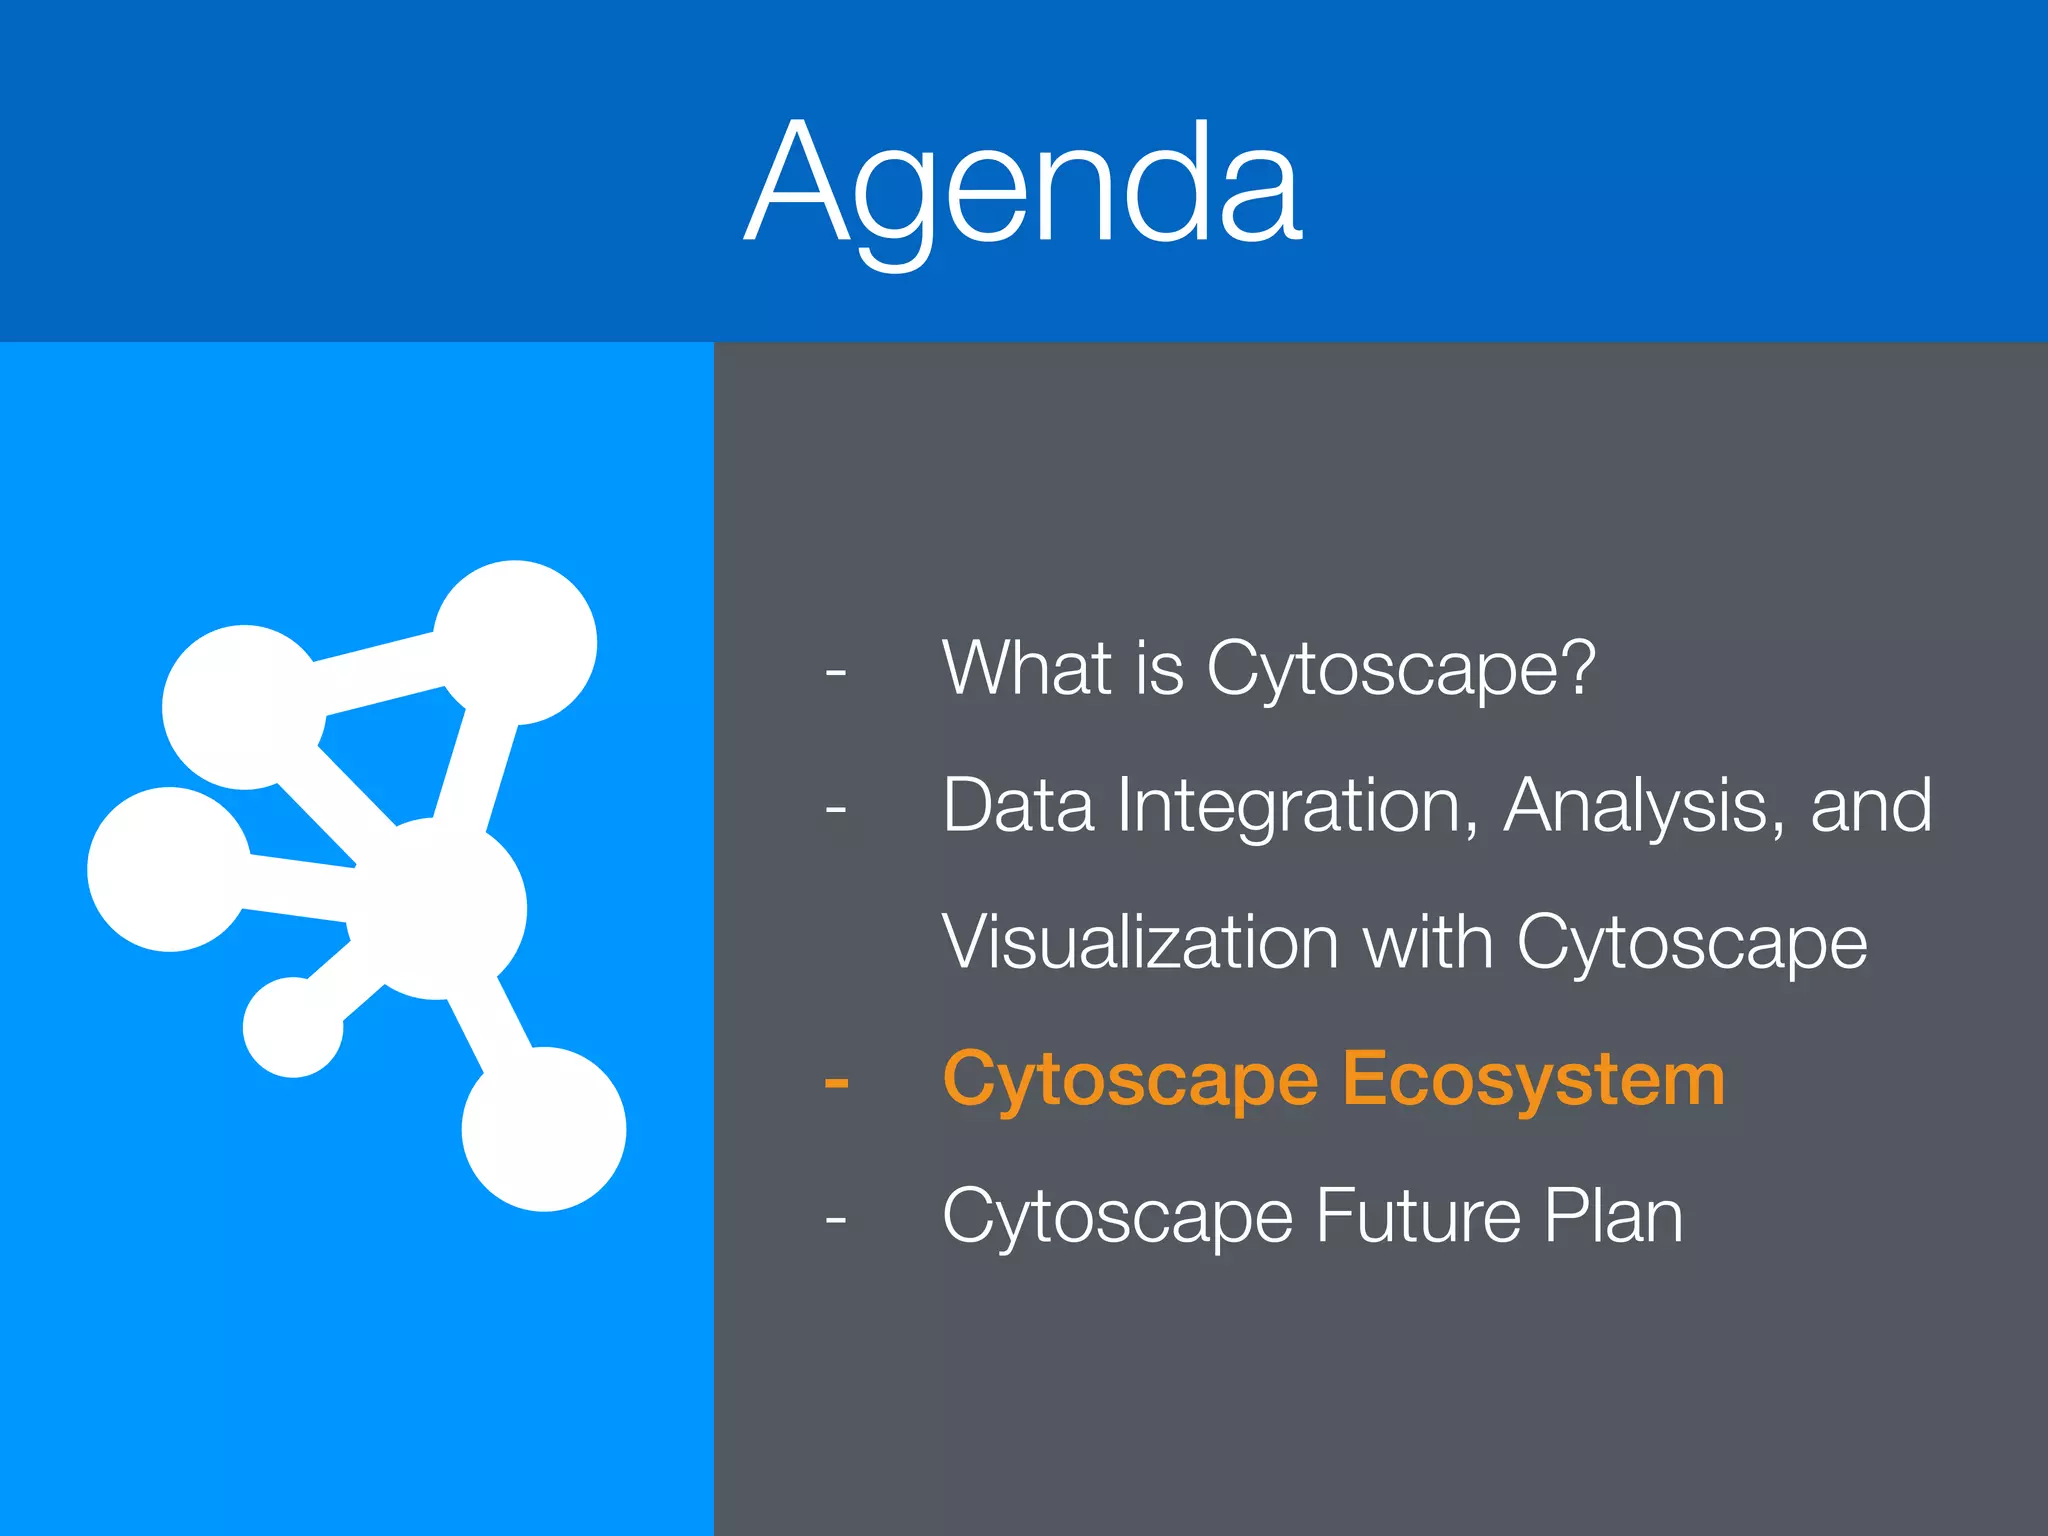
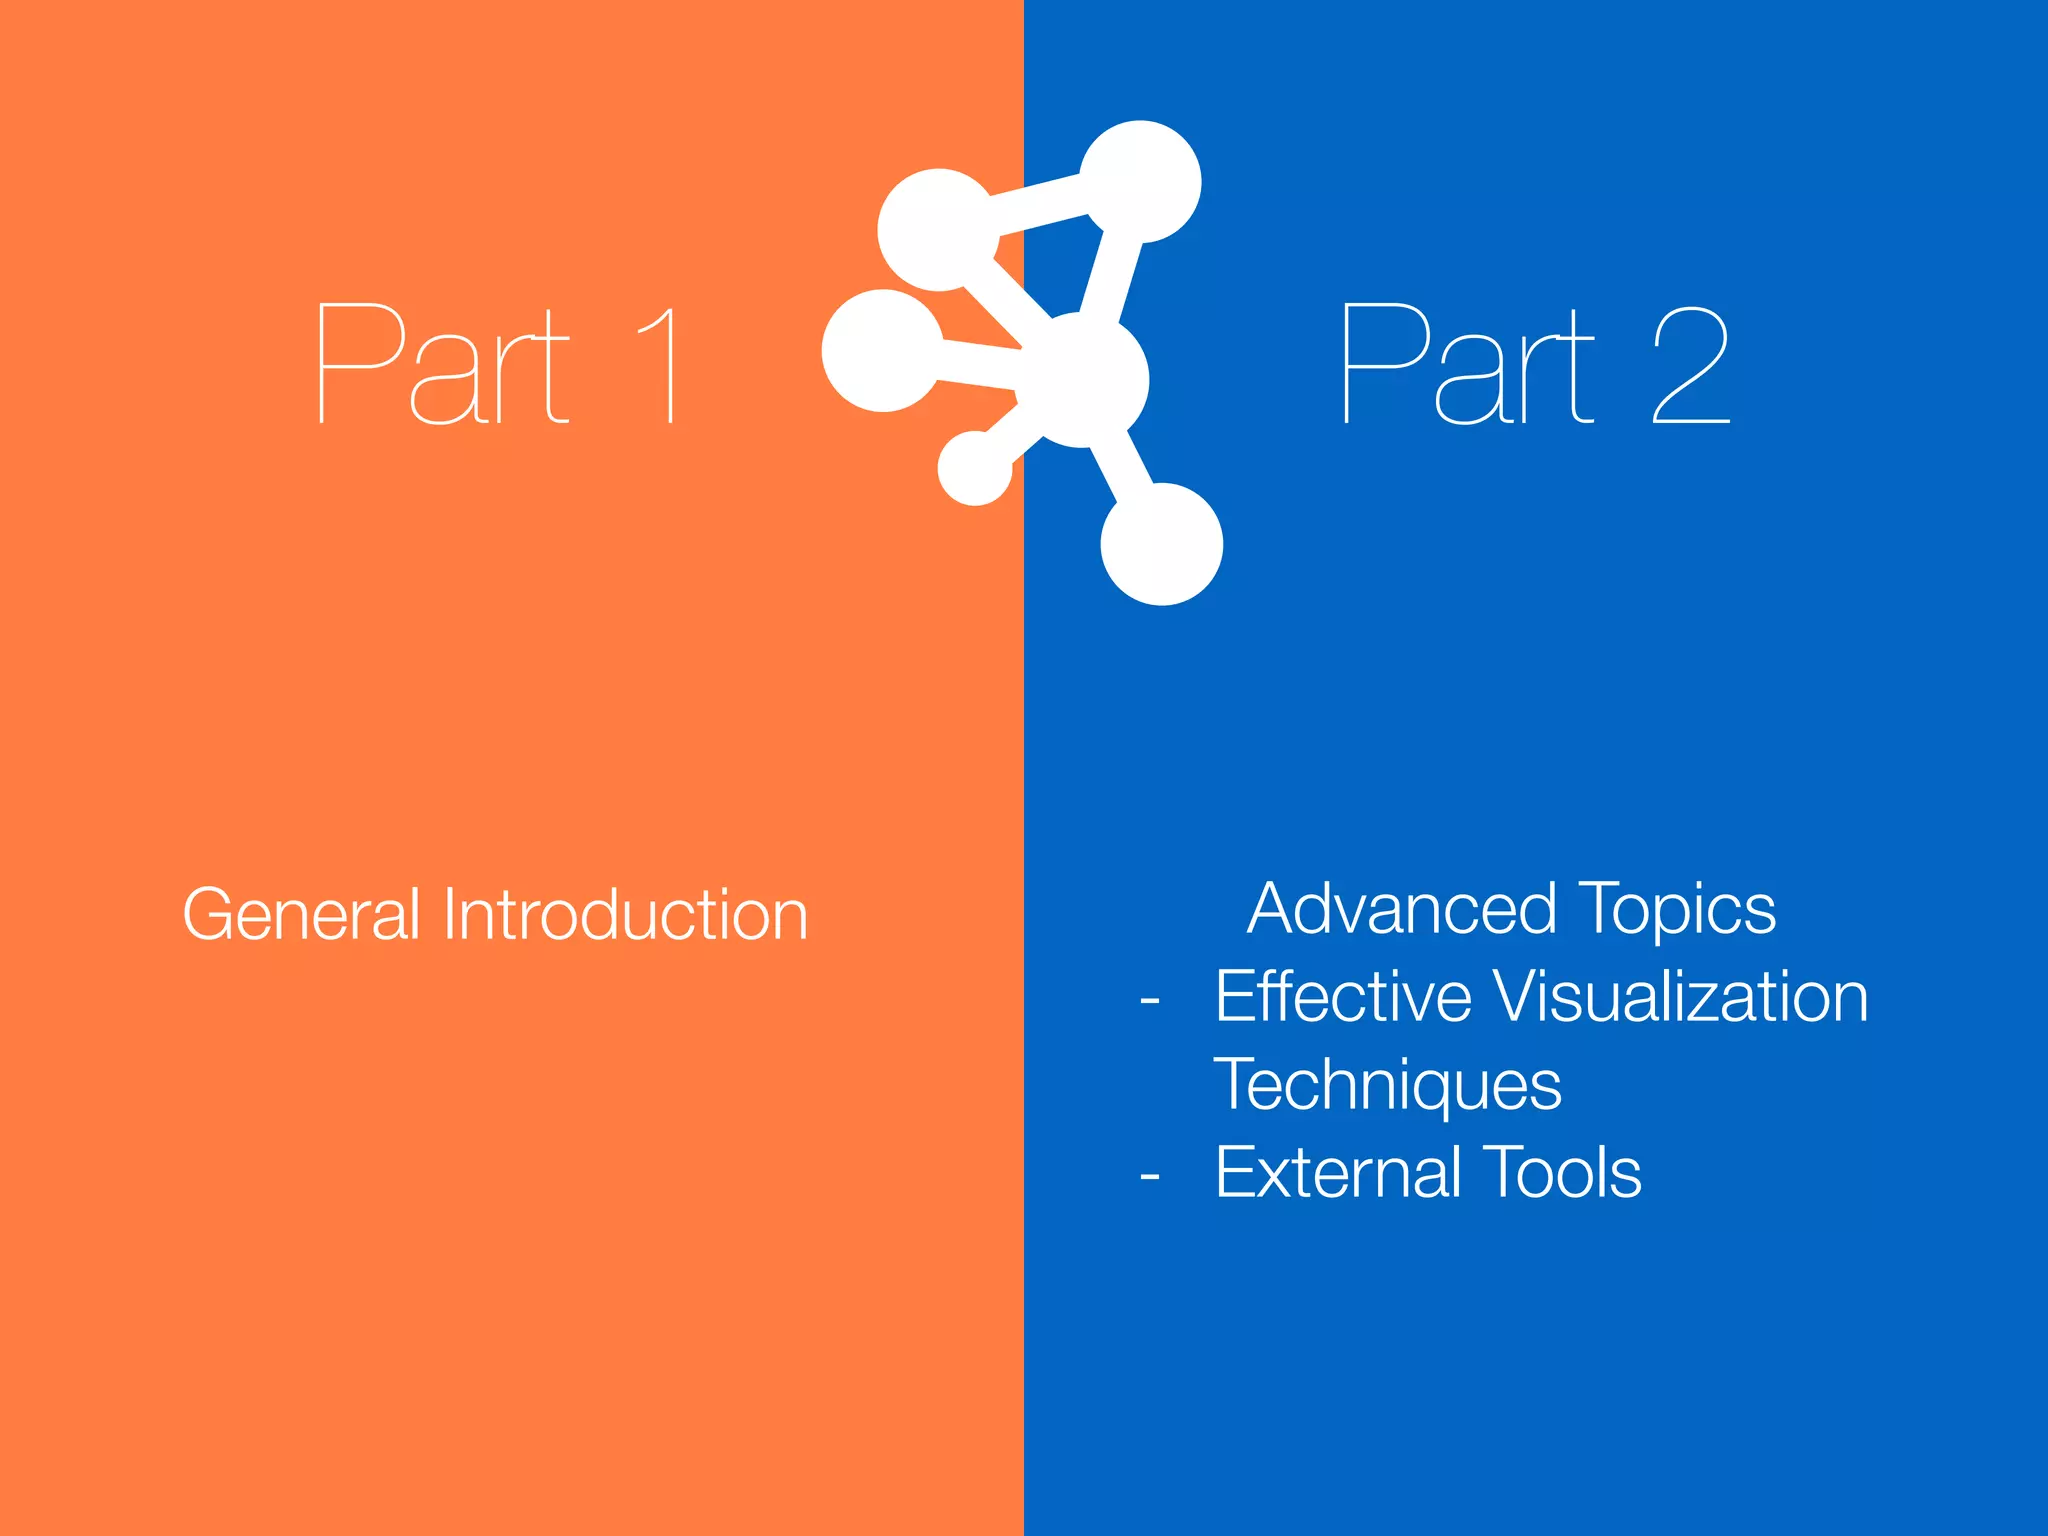
Presents the agenda: what Cytoscape is, its data integration, analysis, visualization capabilities, ecosystem, and future plans.
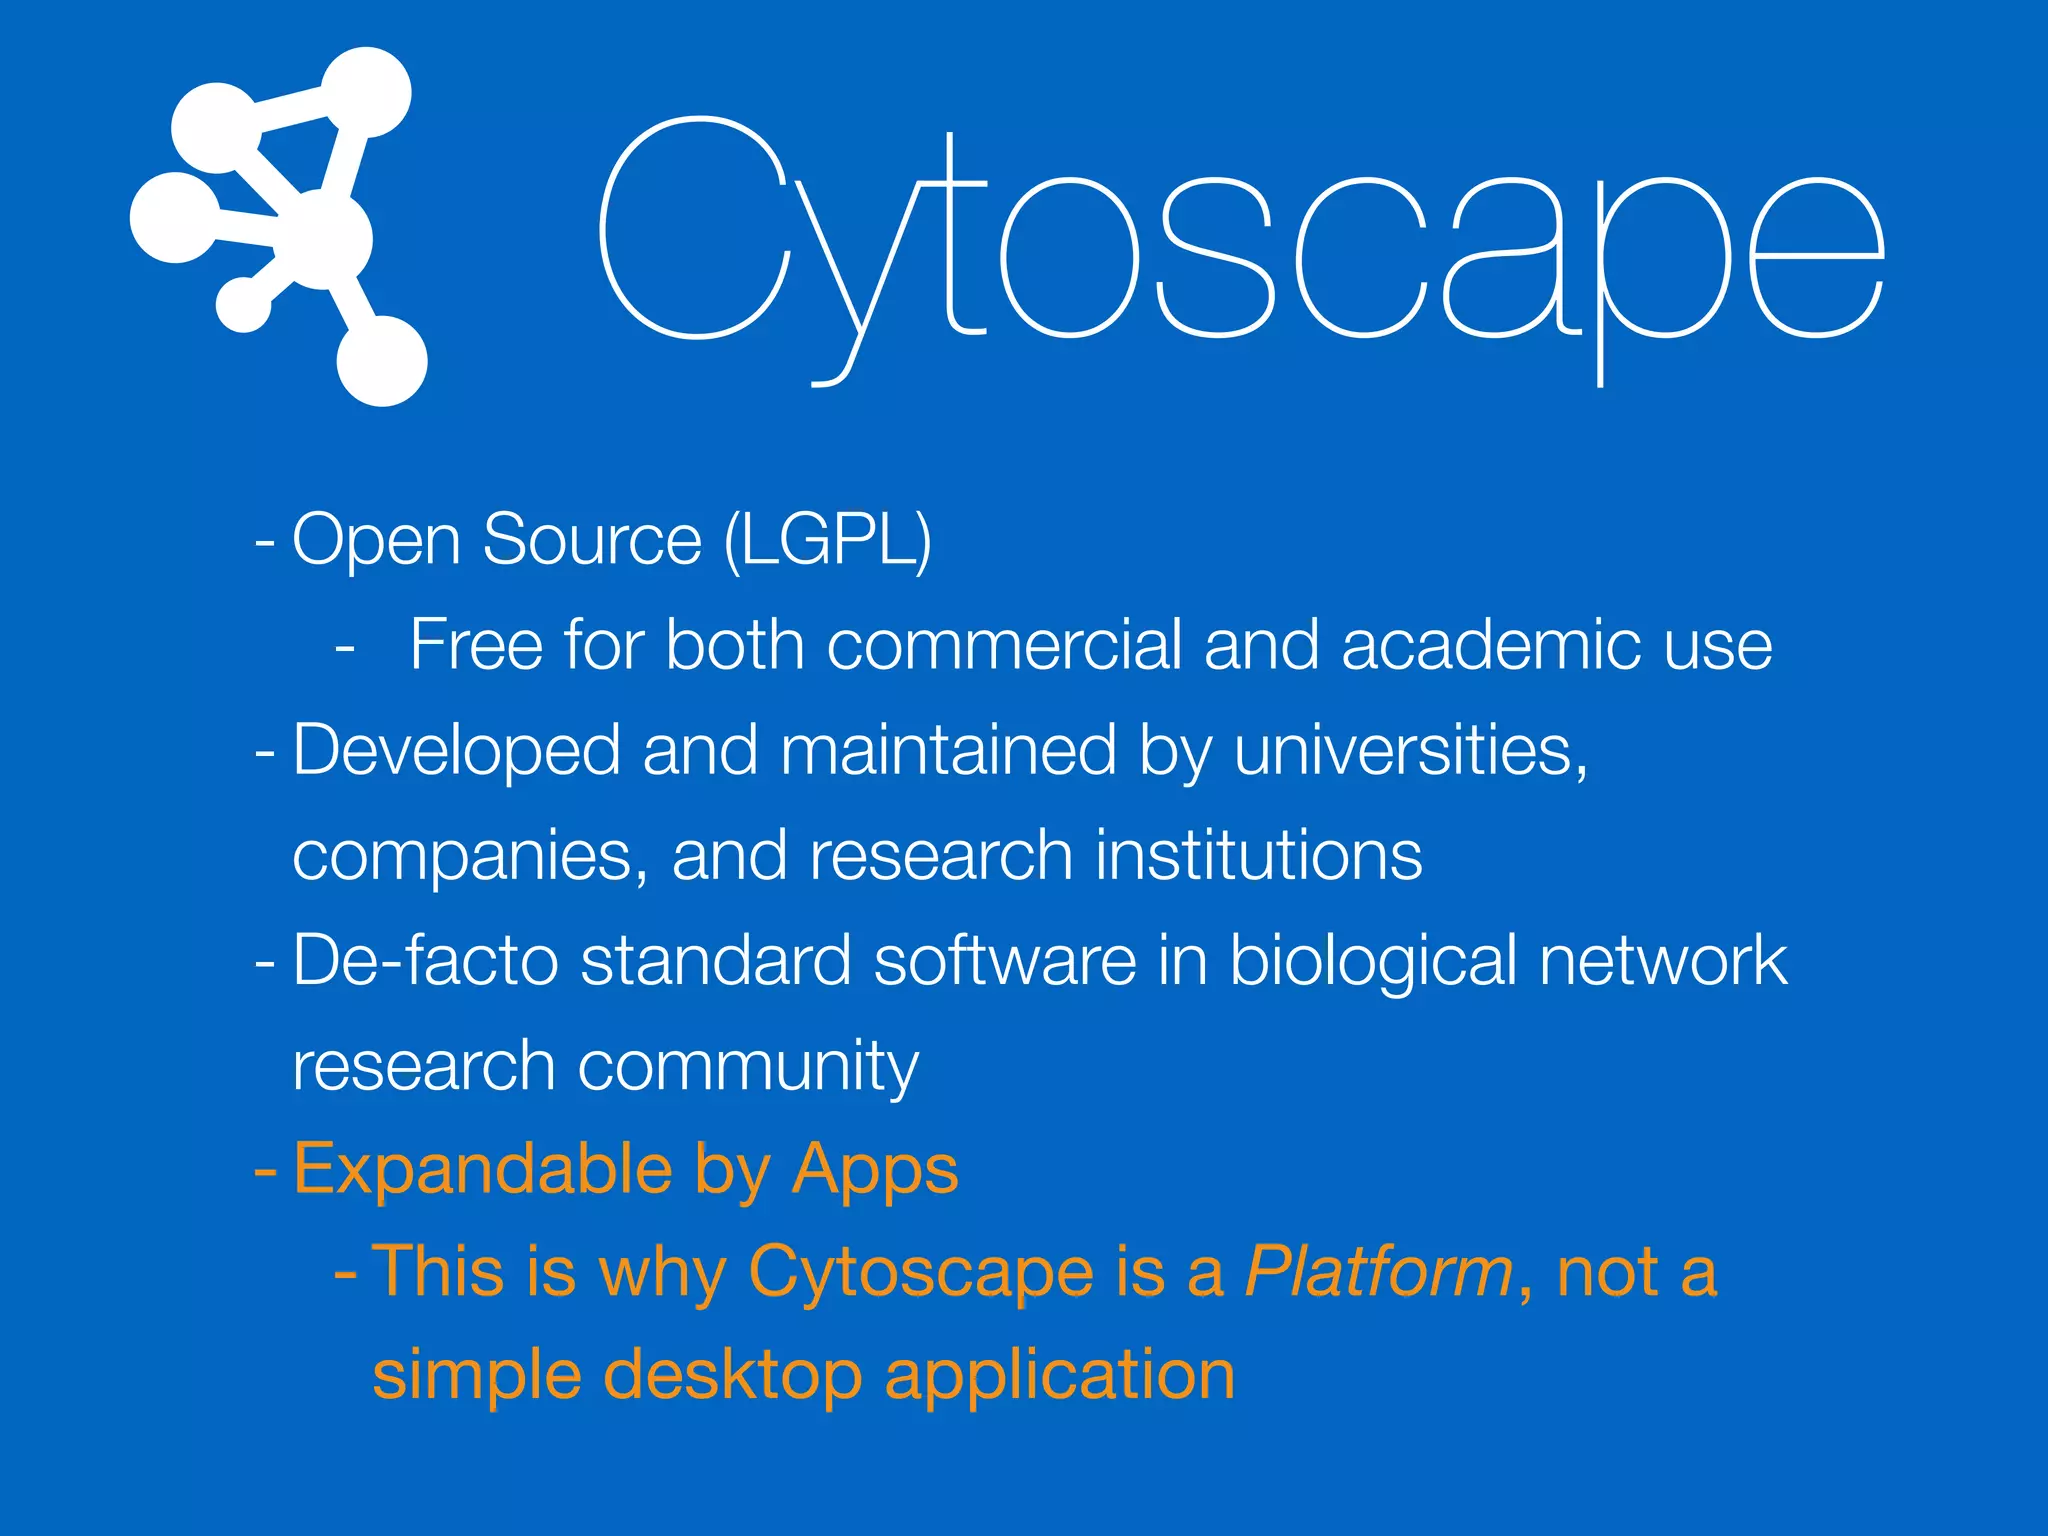
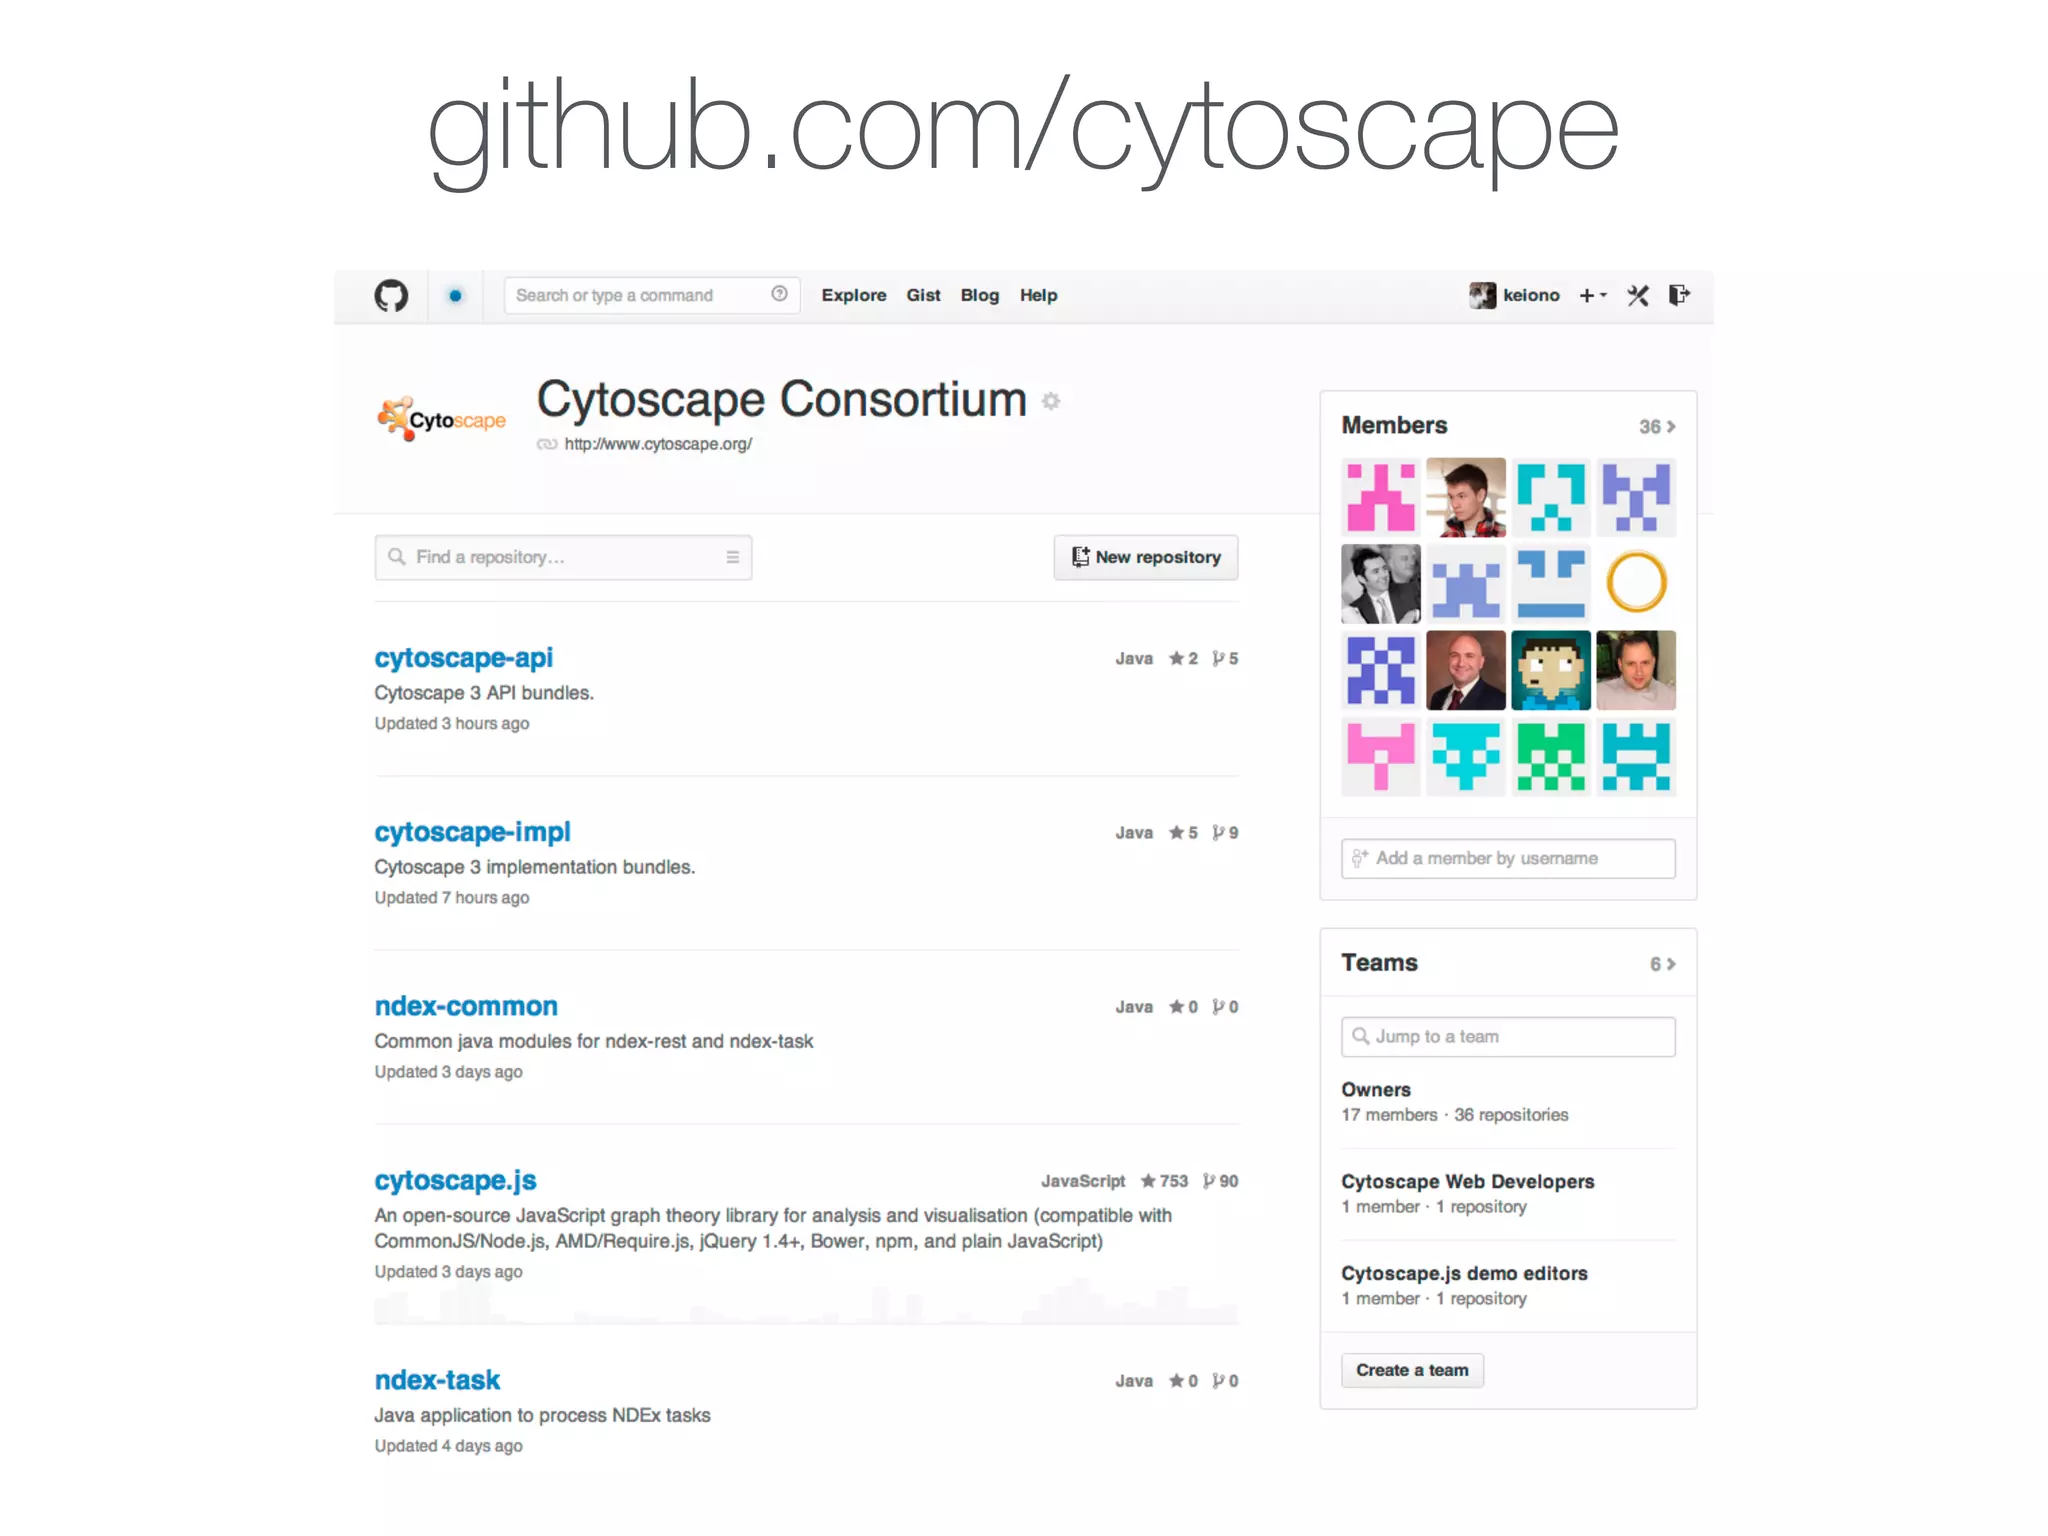
Defines Cytoscape as an open-source platform for biological network analysis; emphasizes its community development and extensibility.
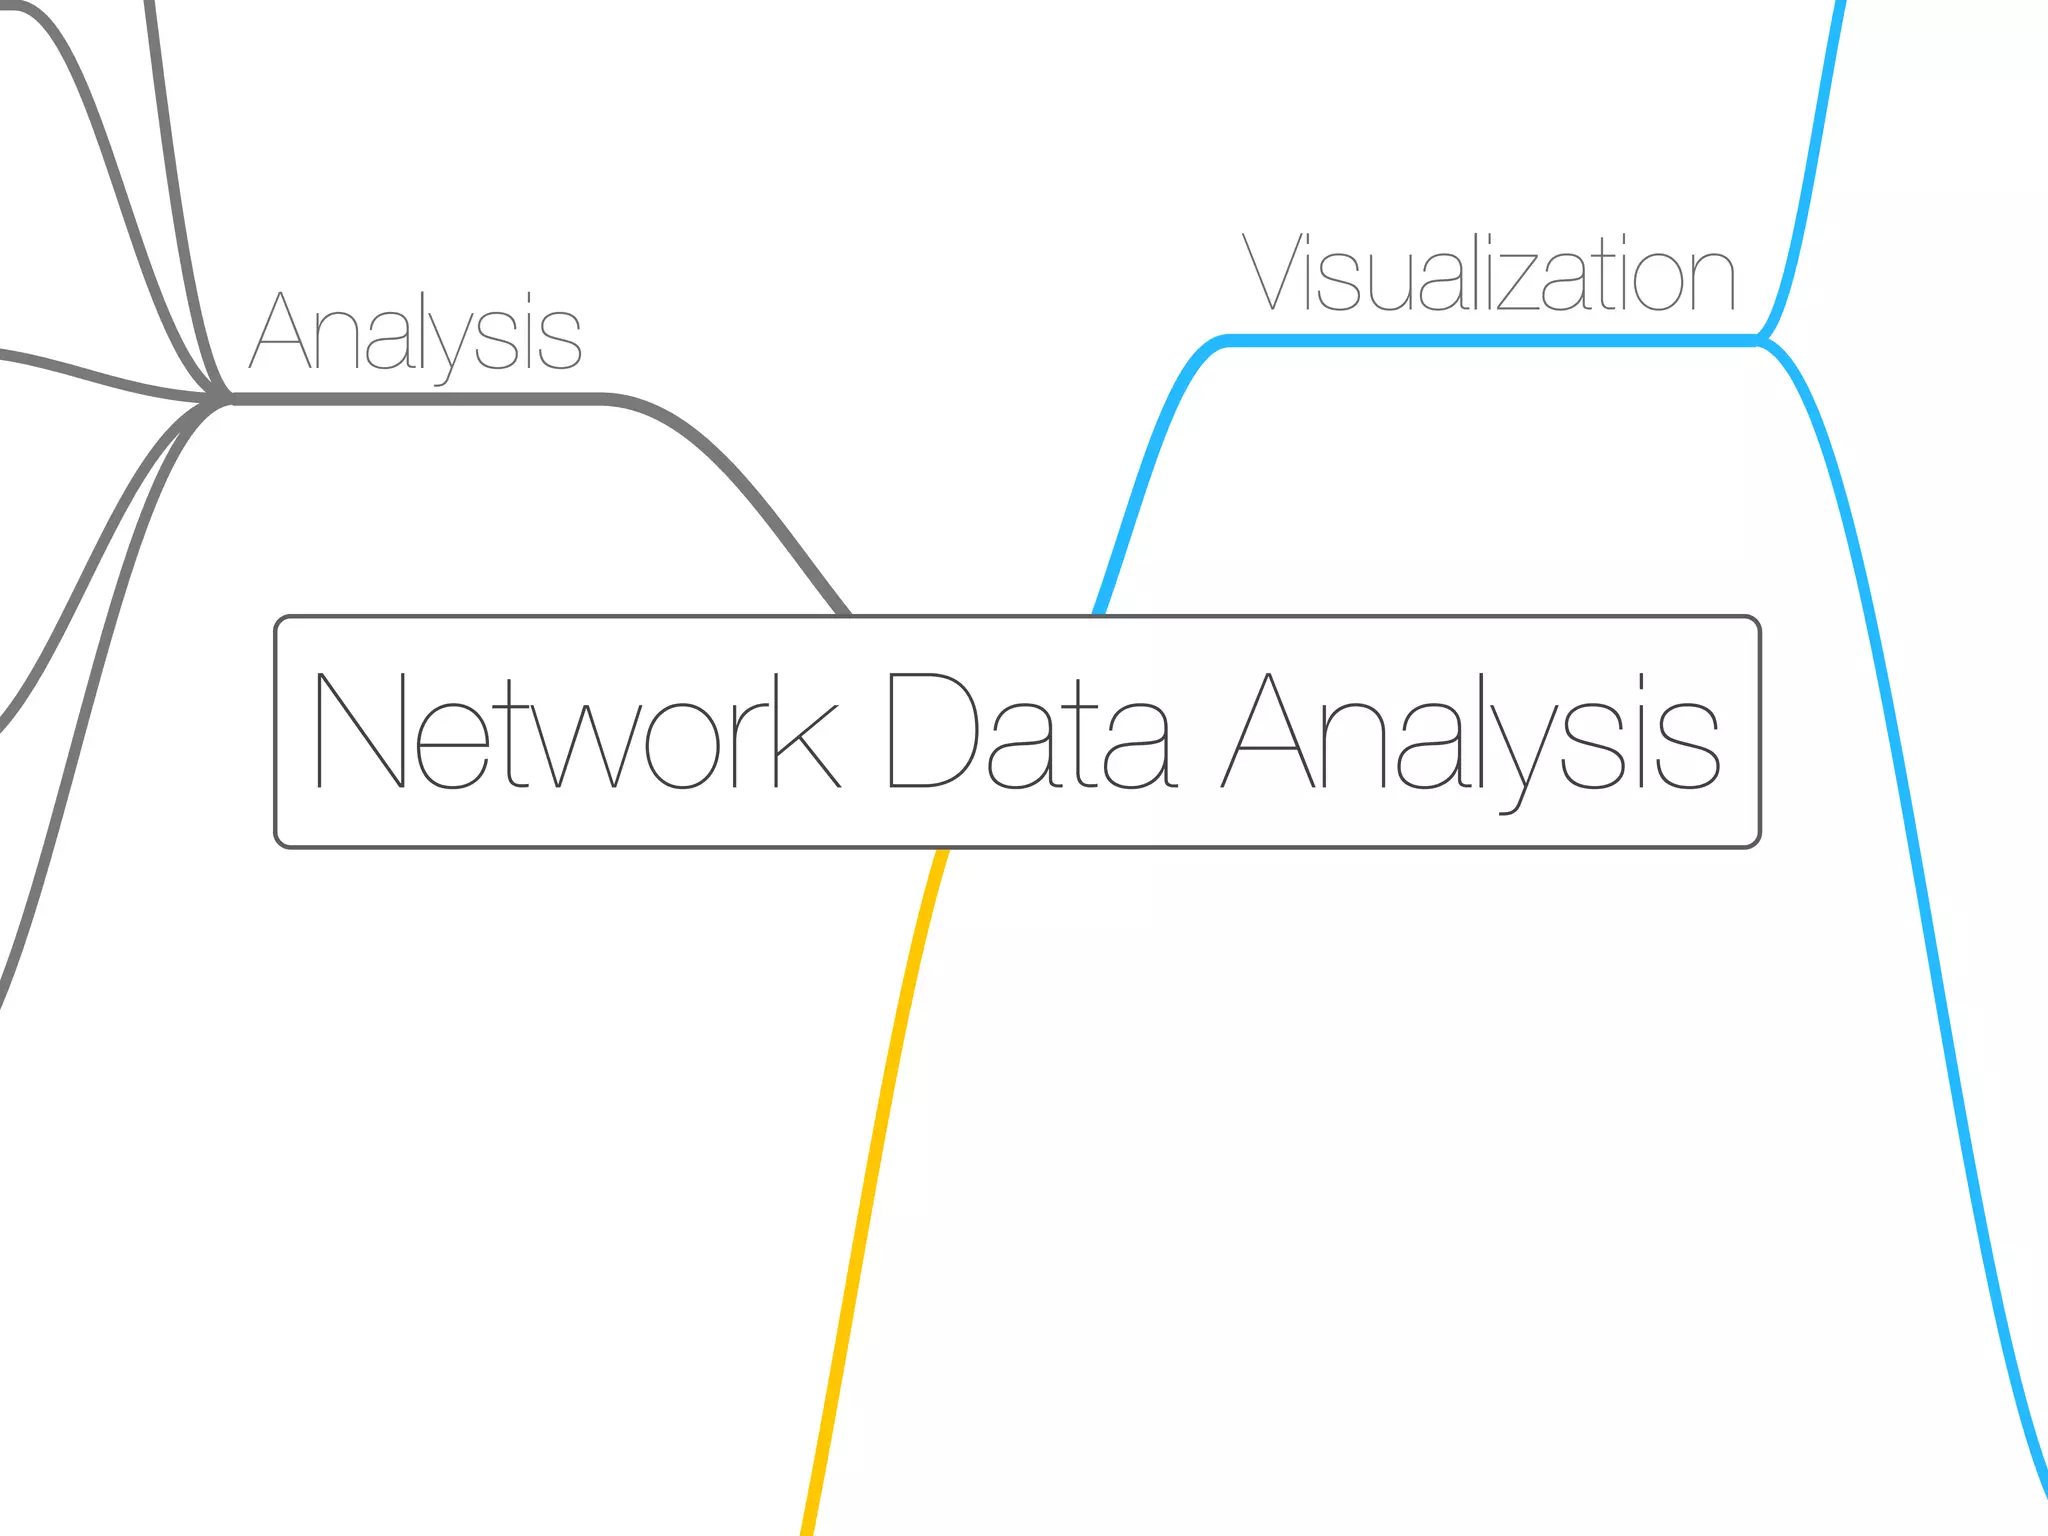
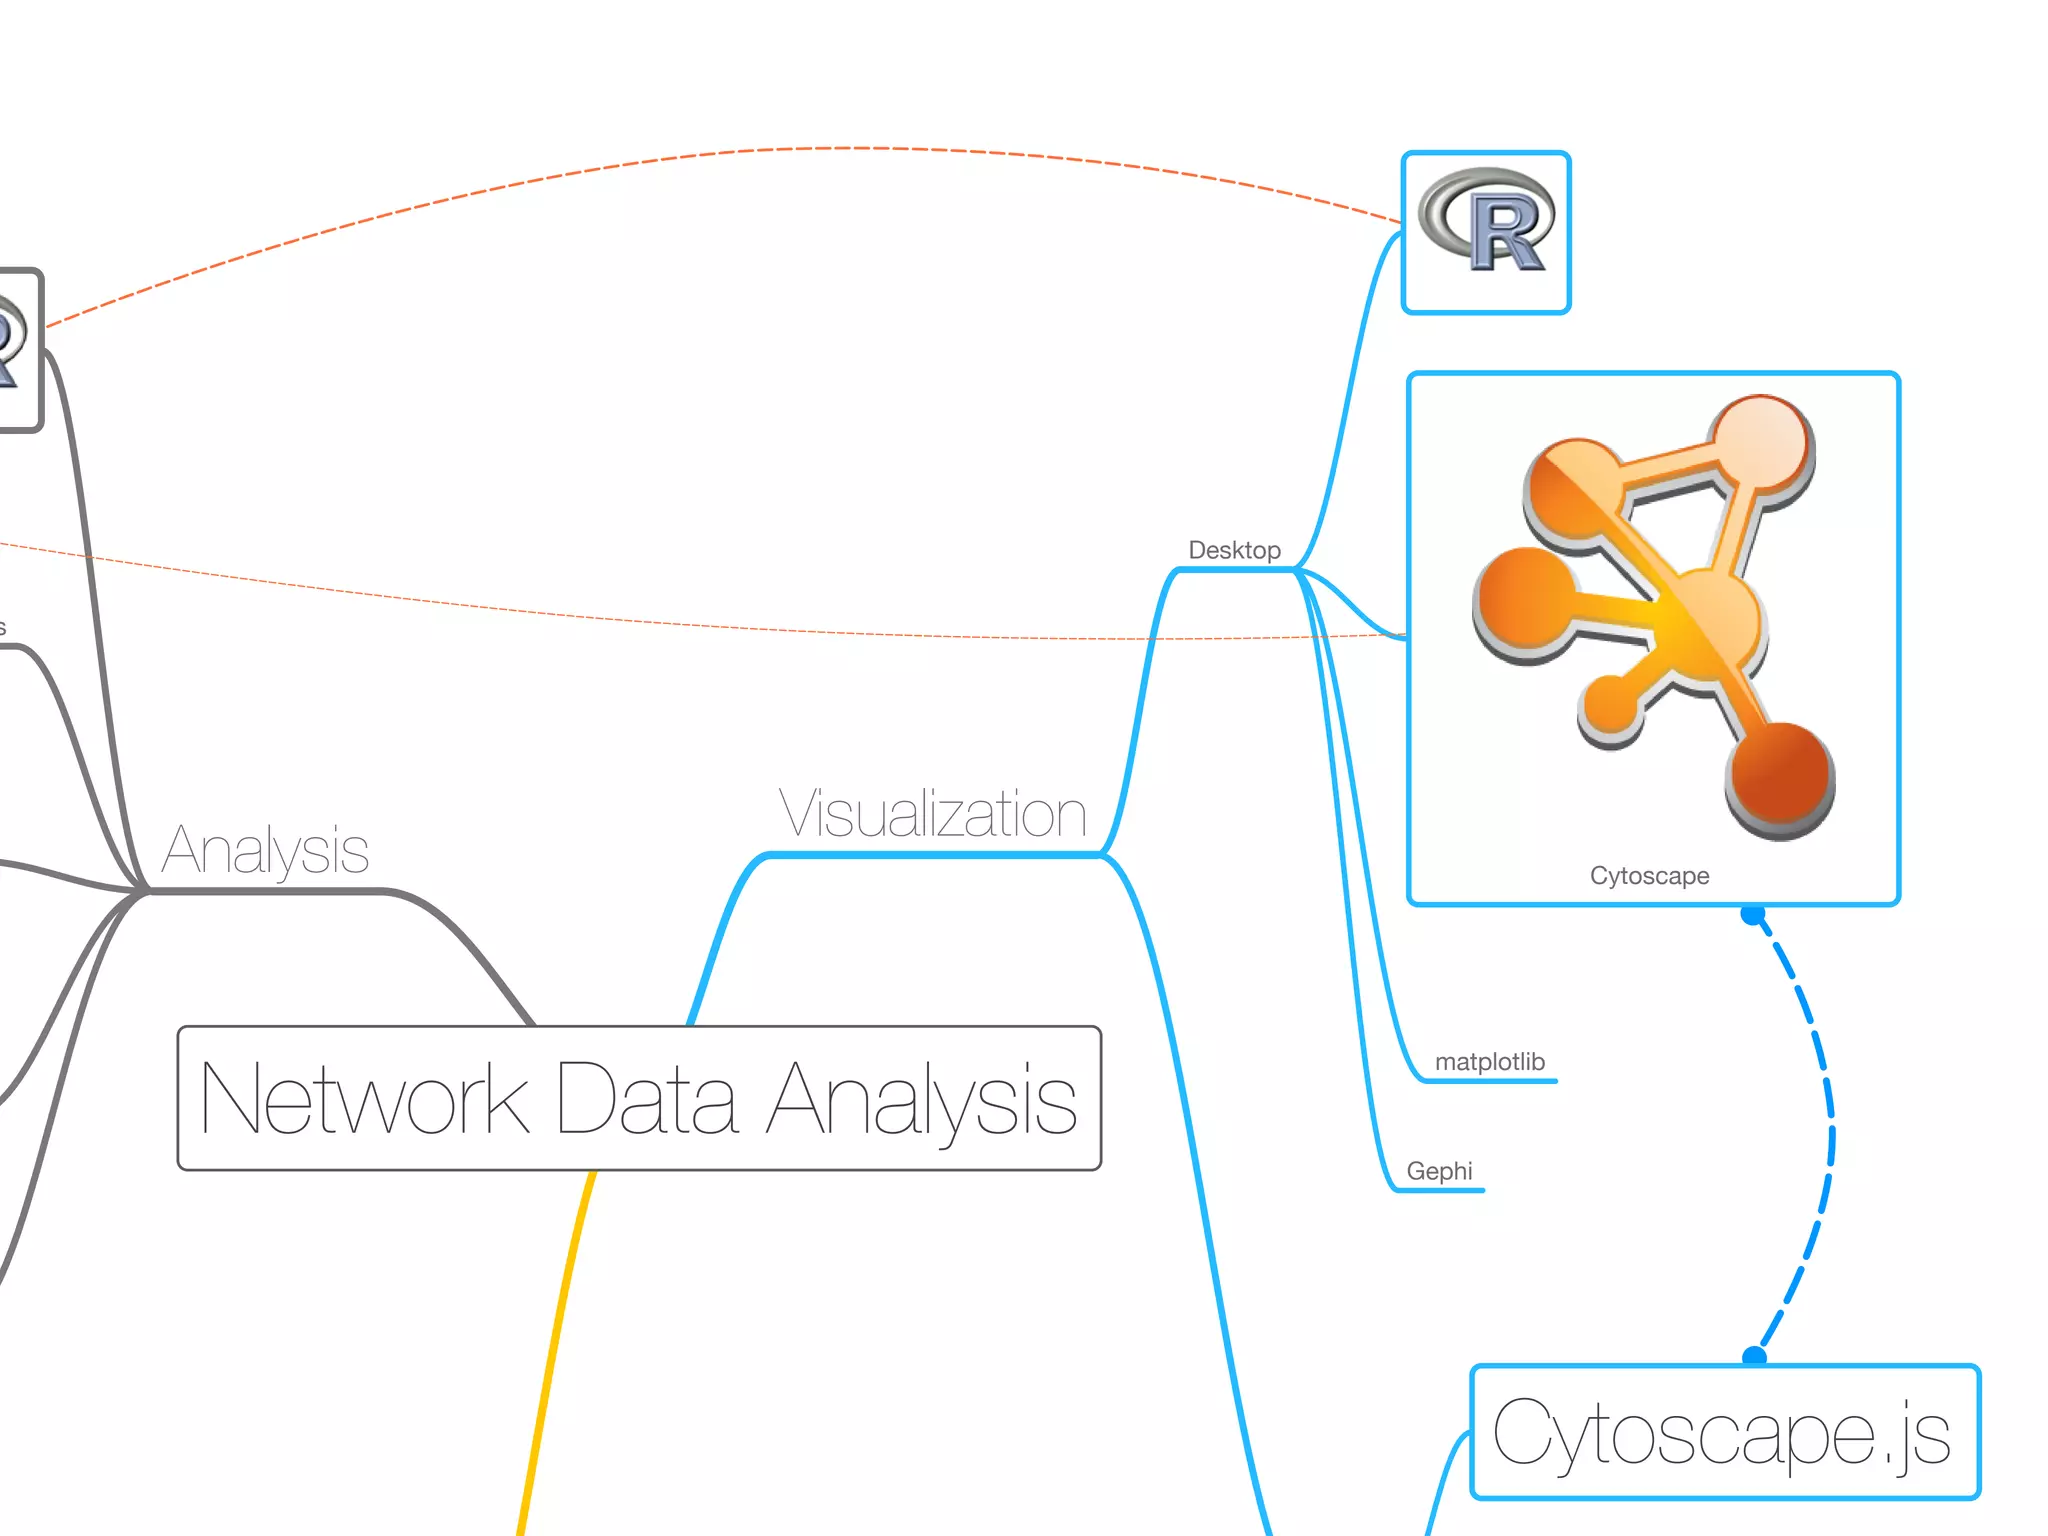
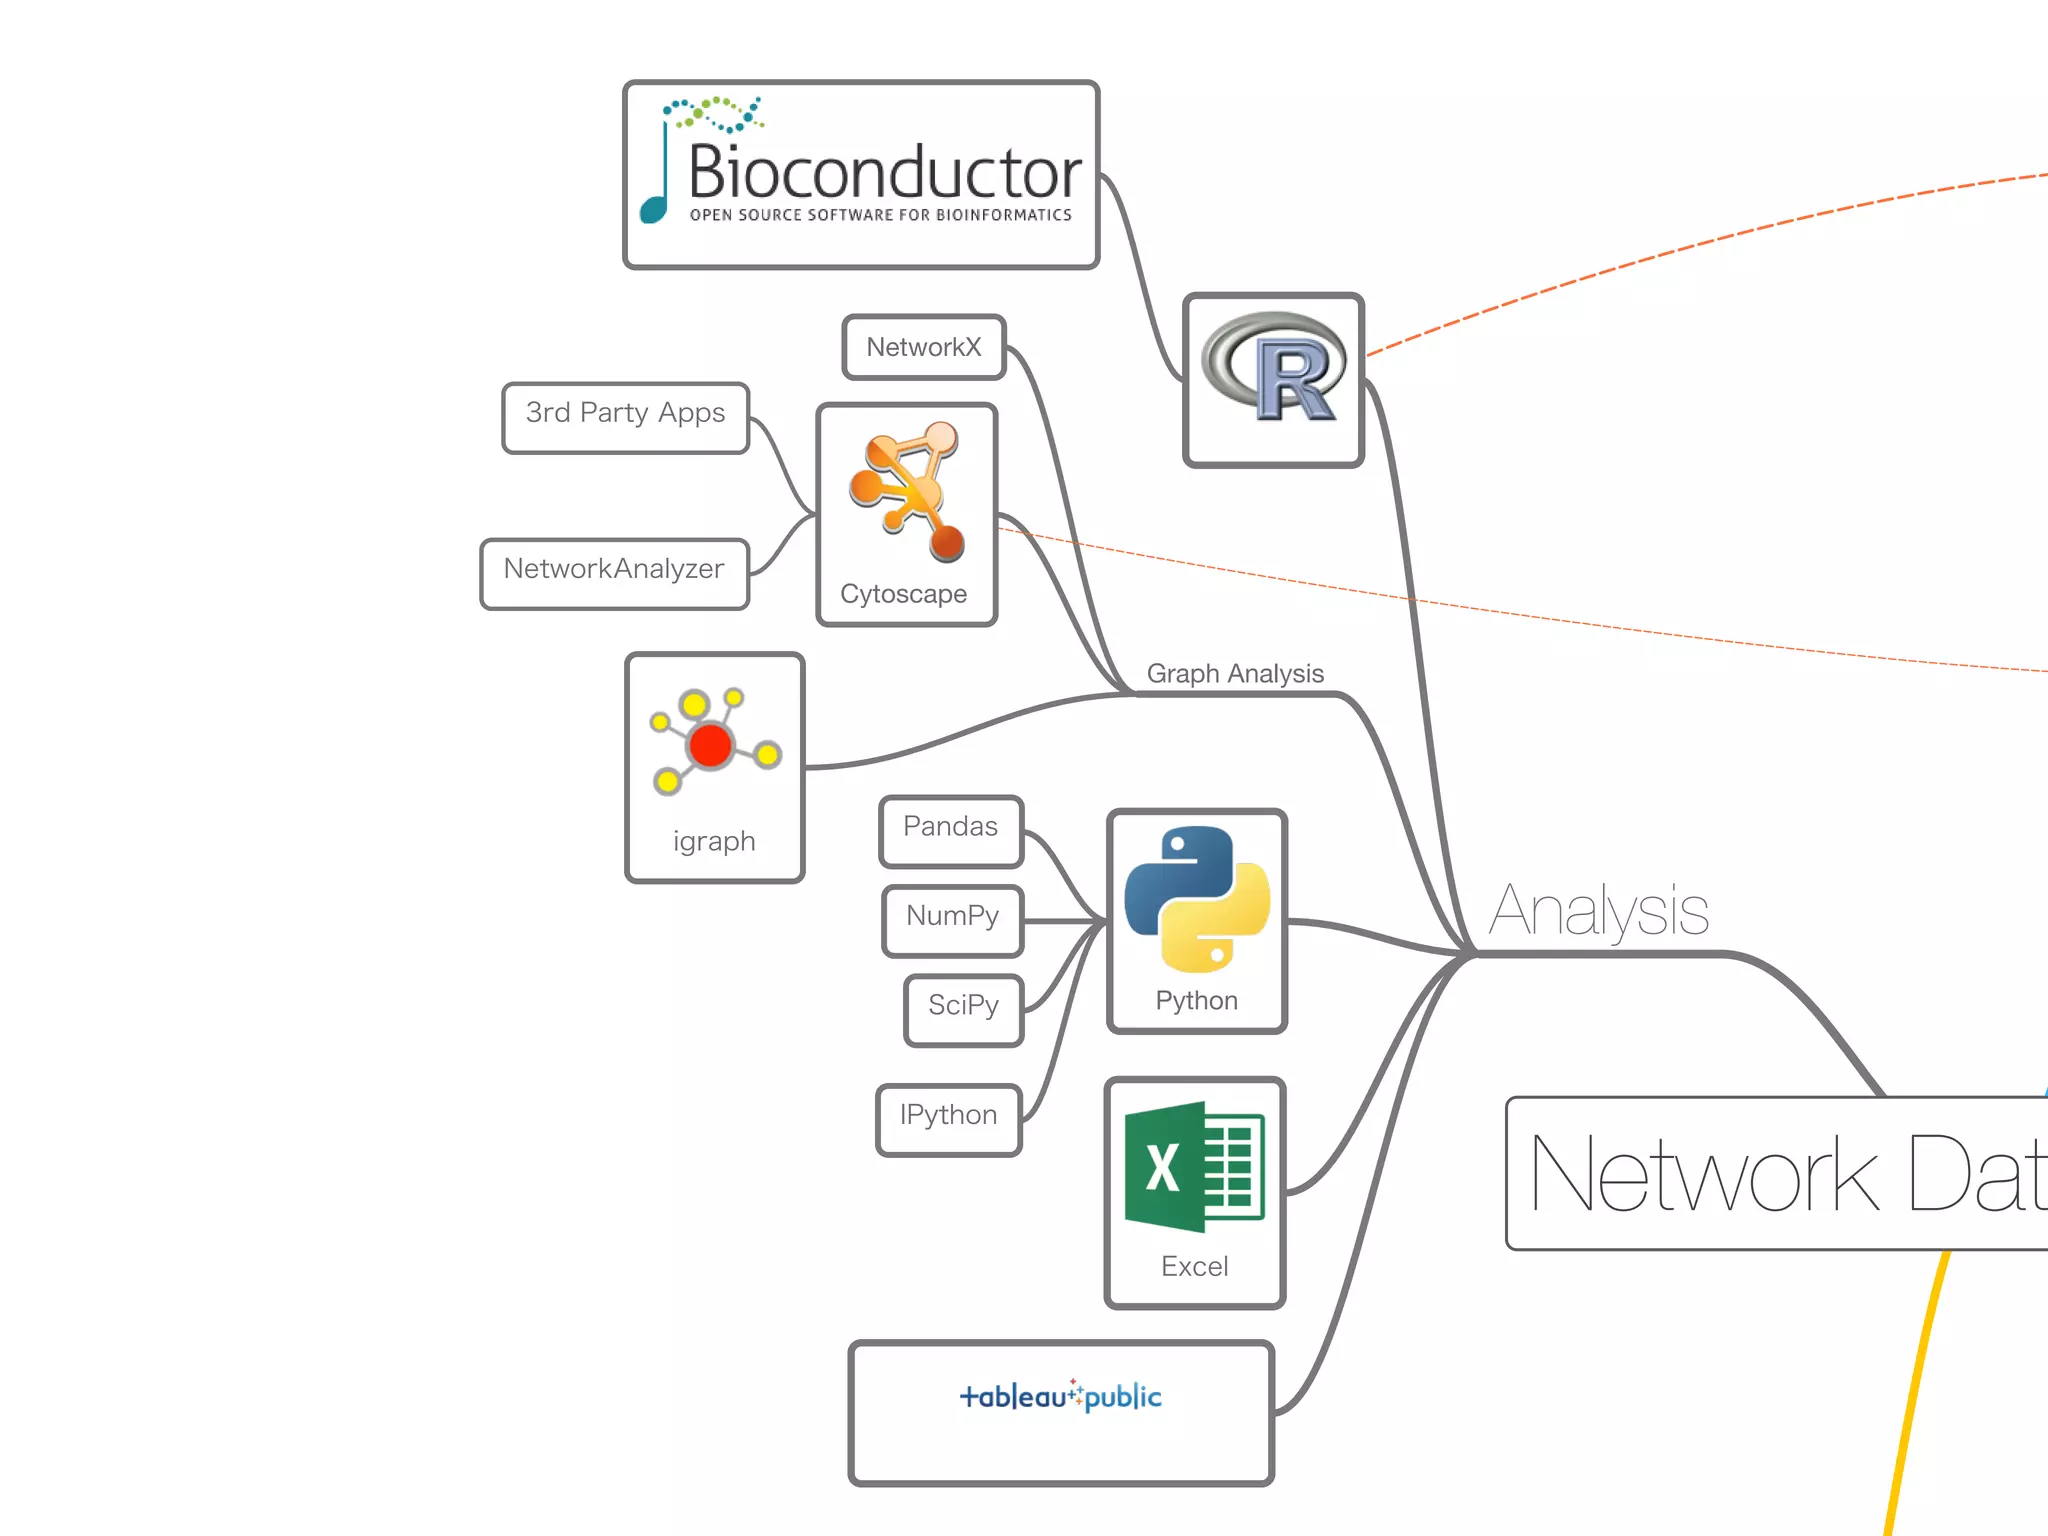
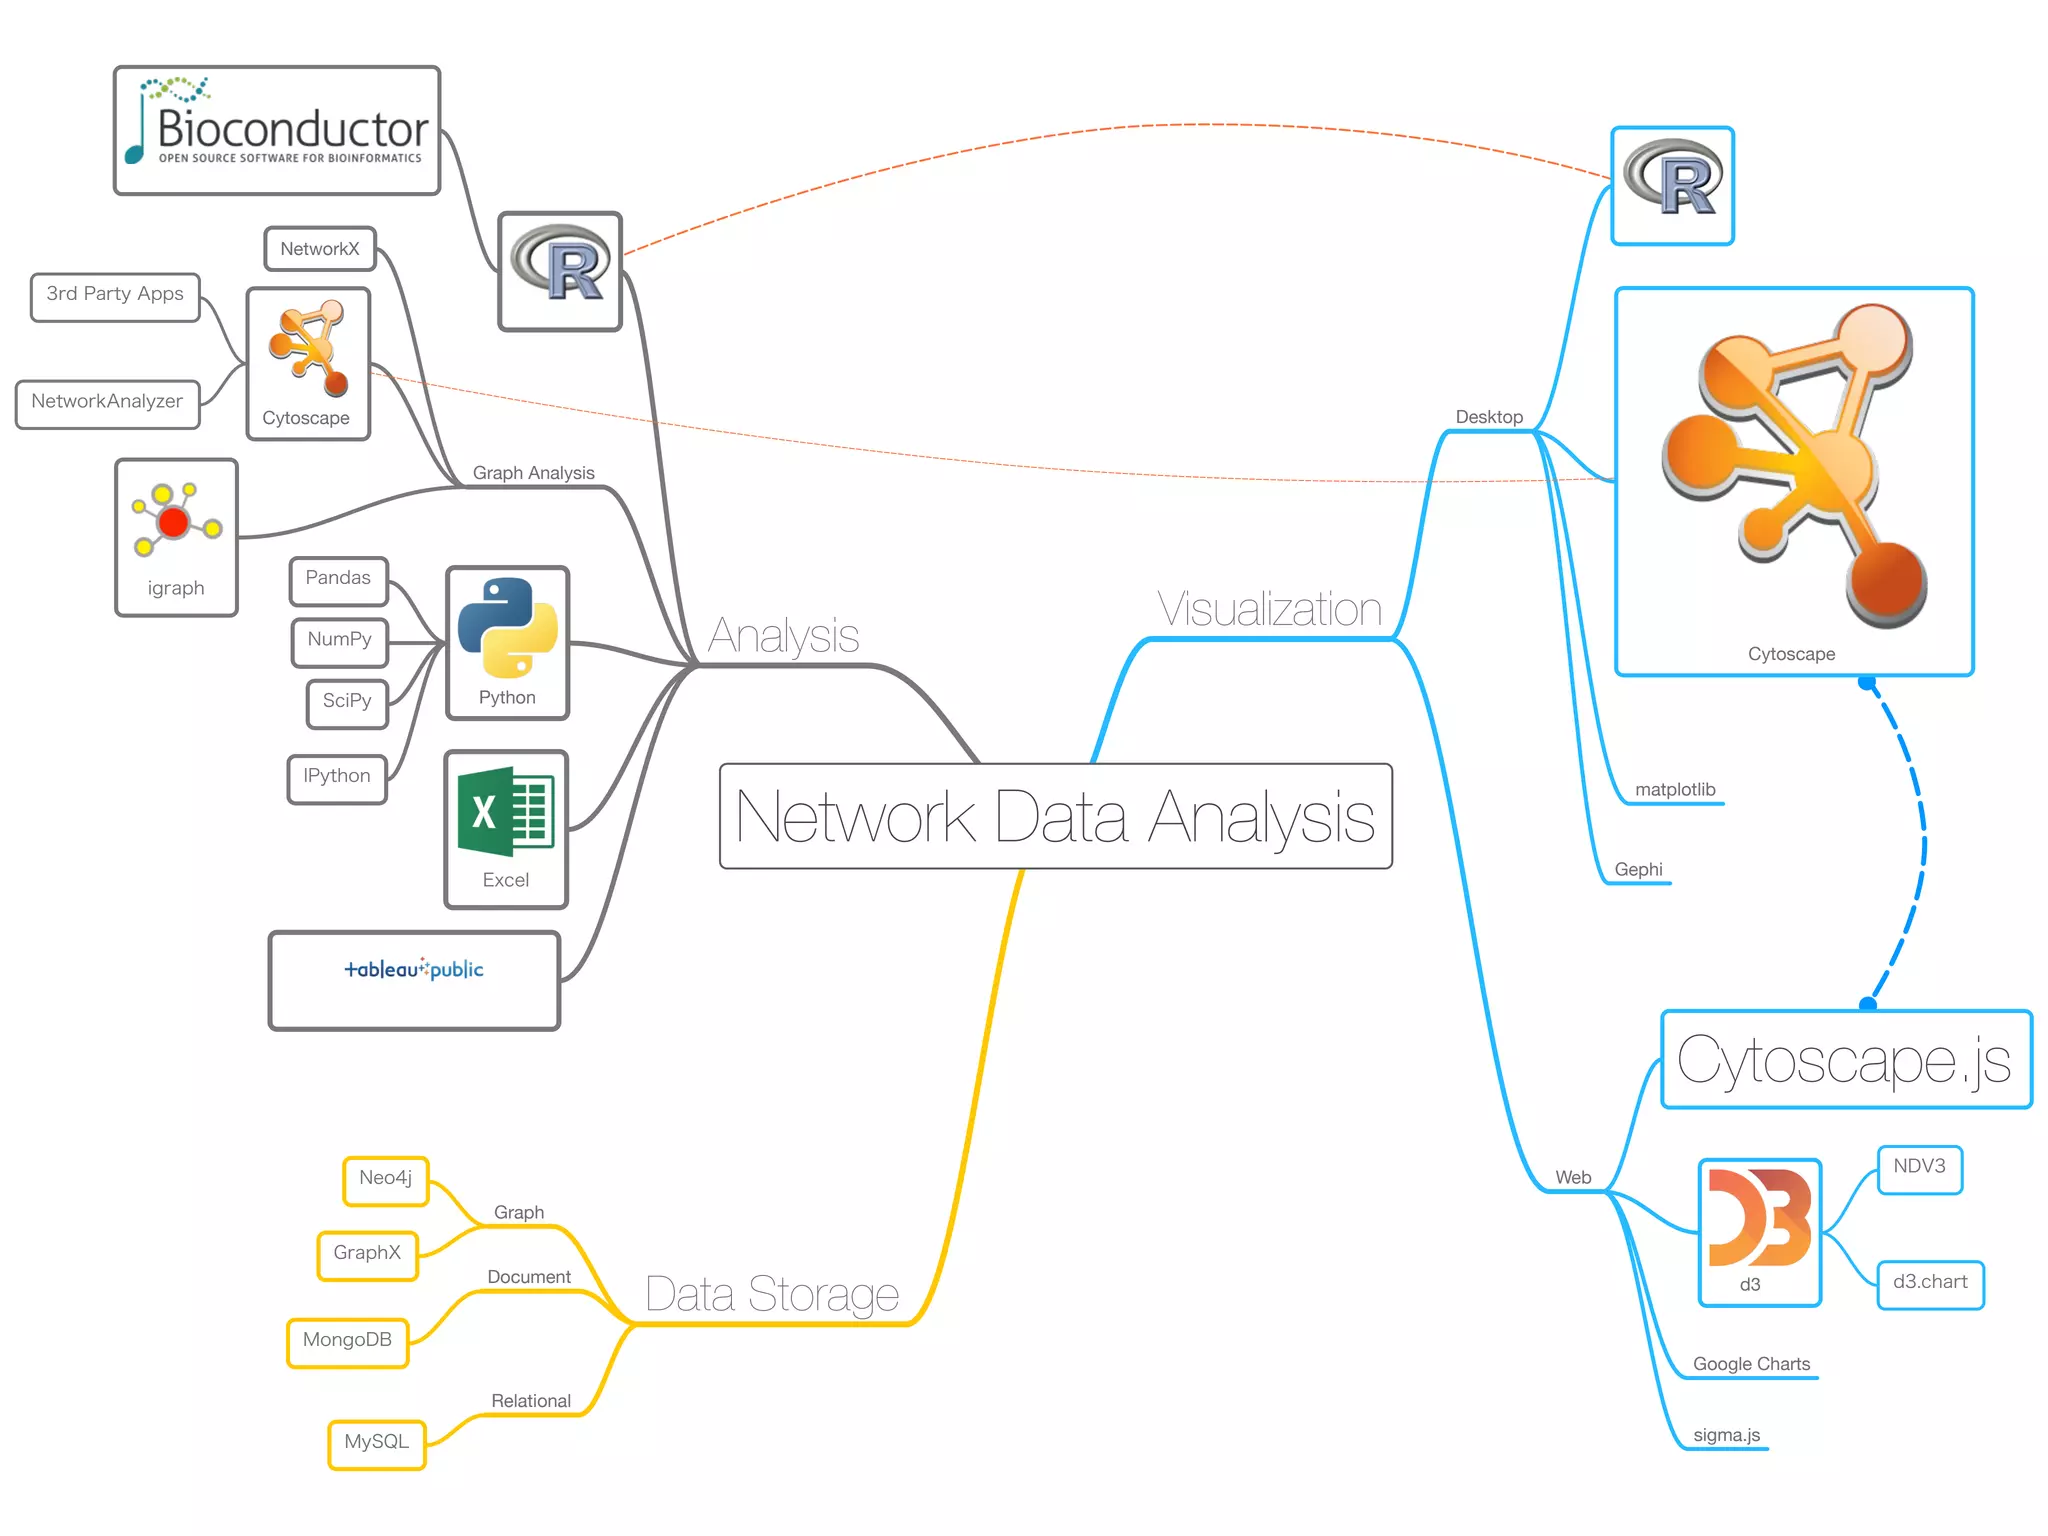
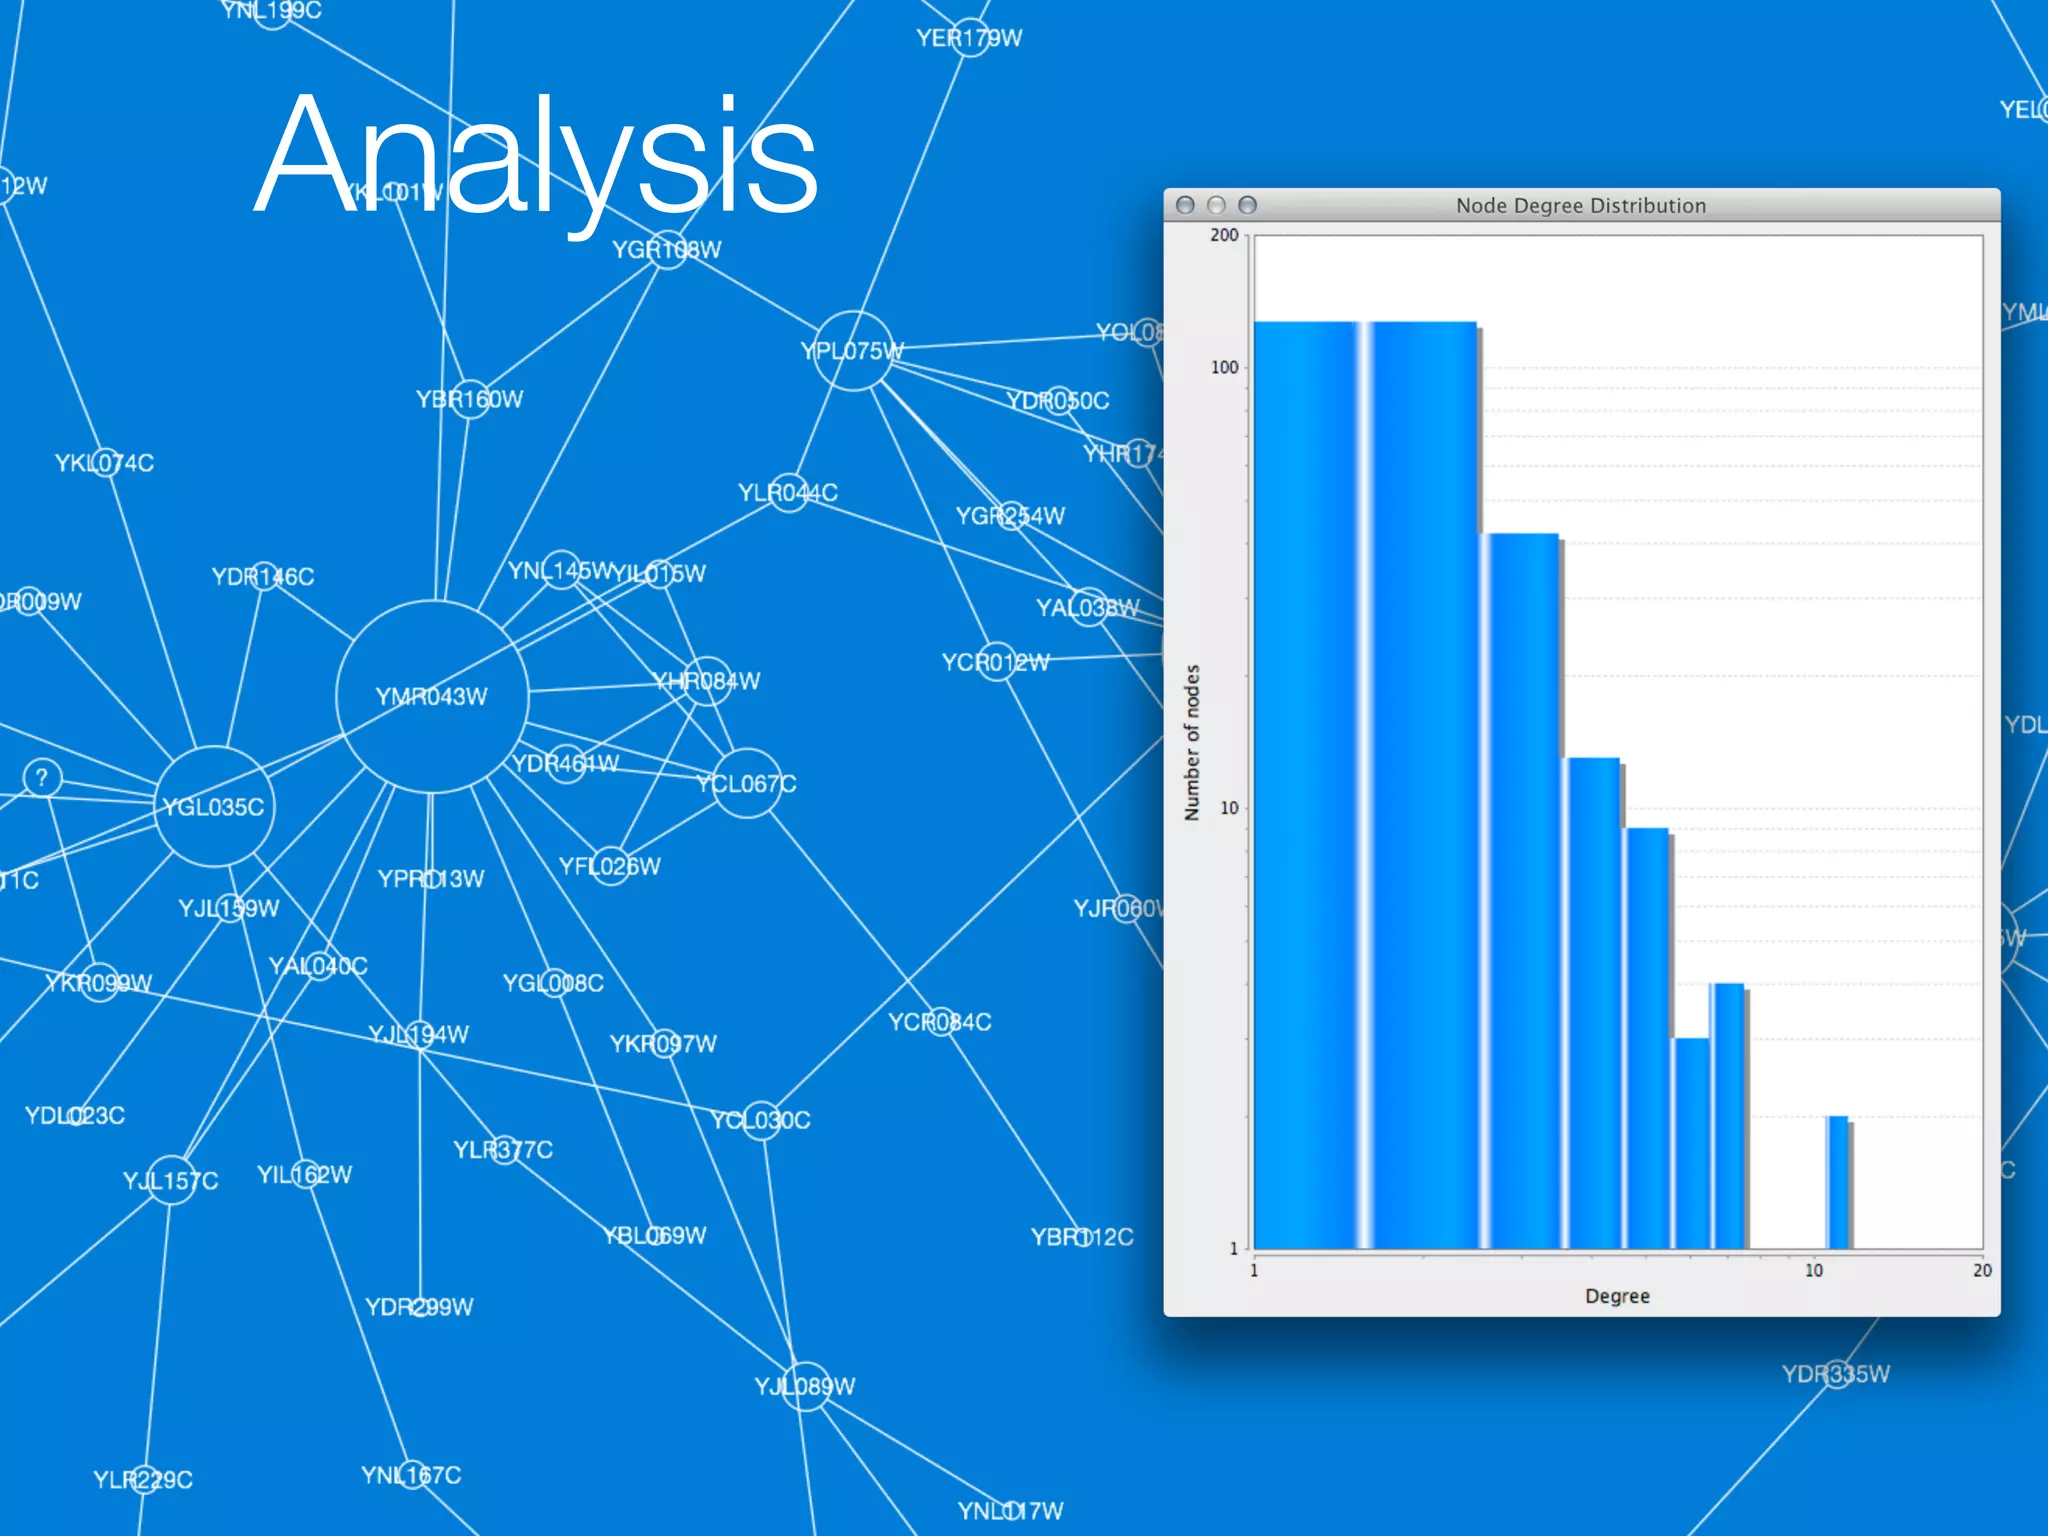
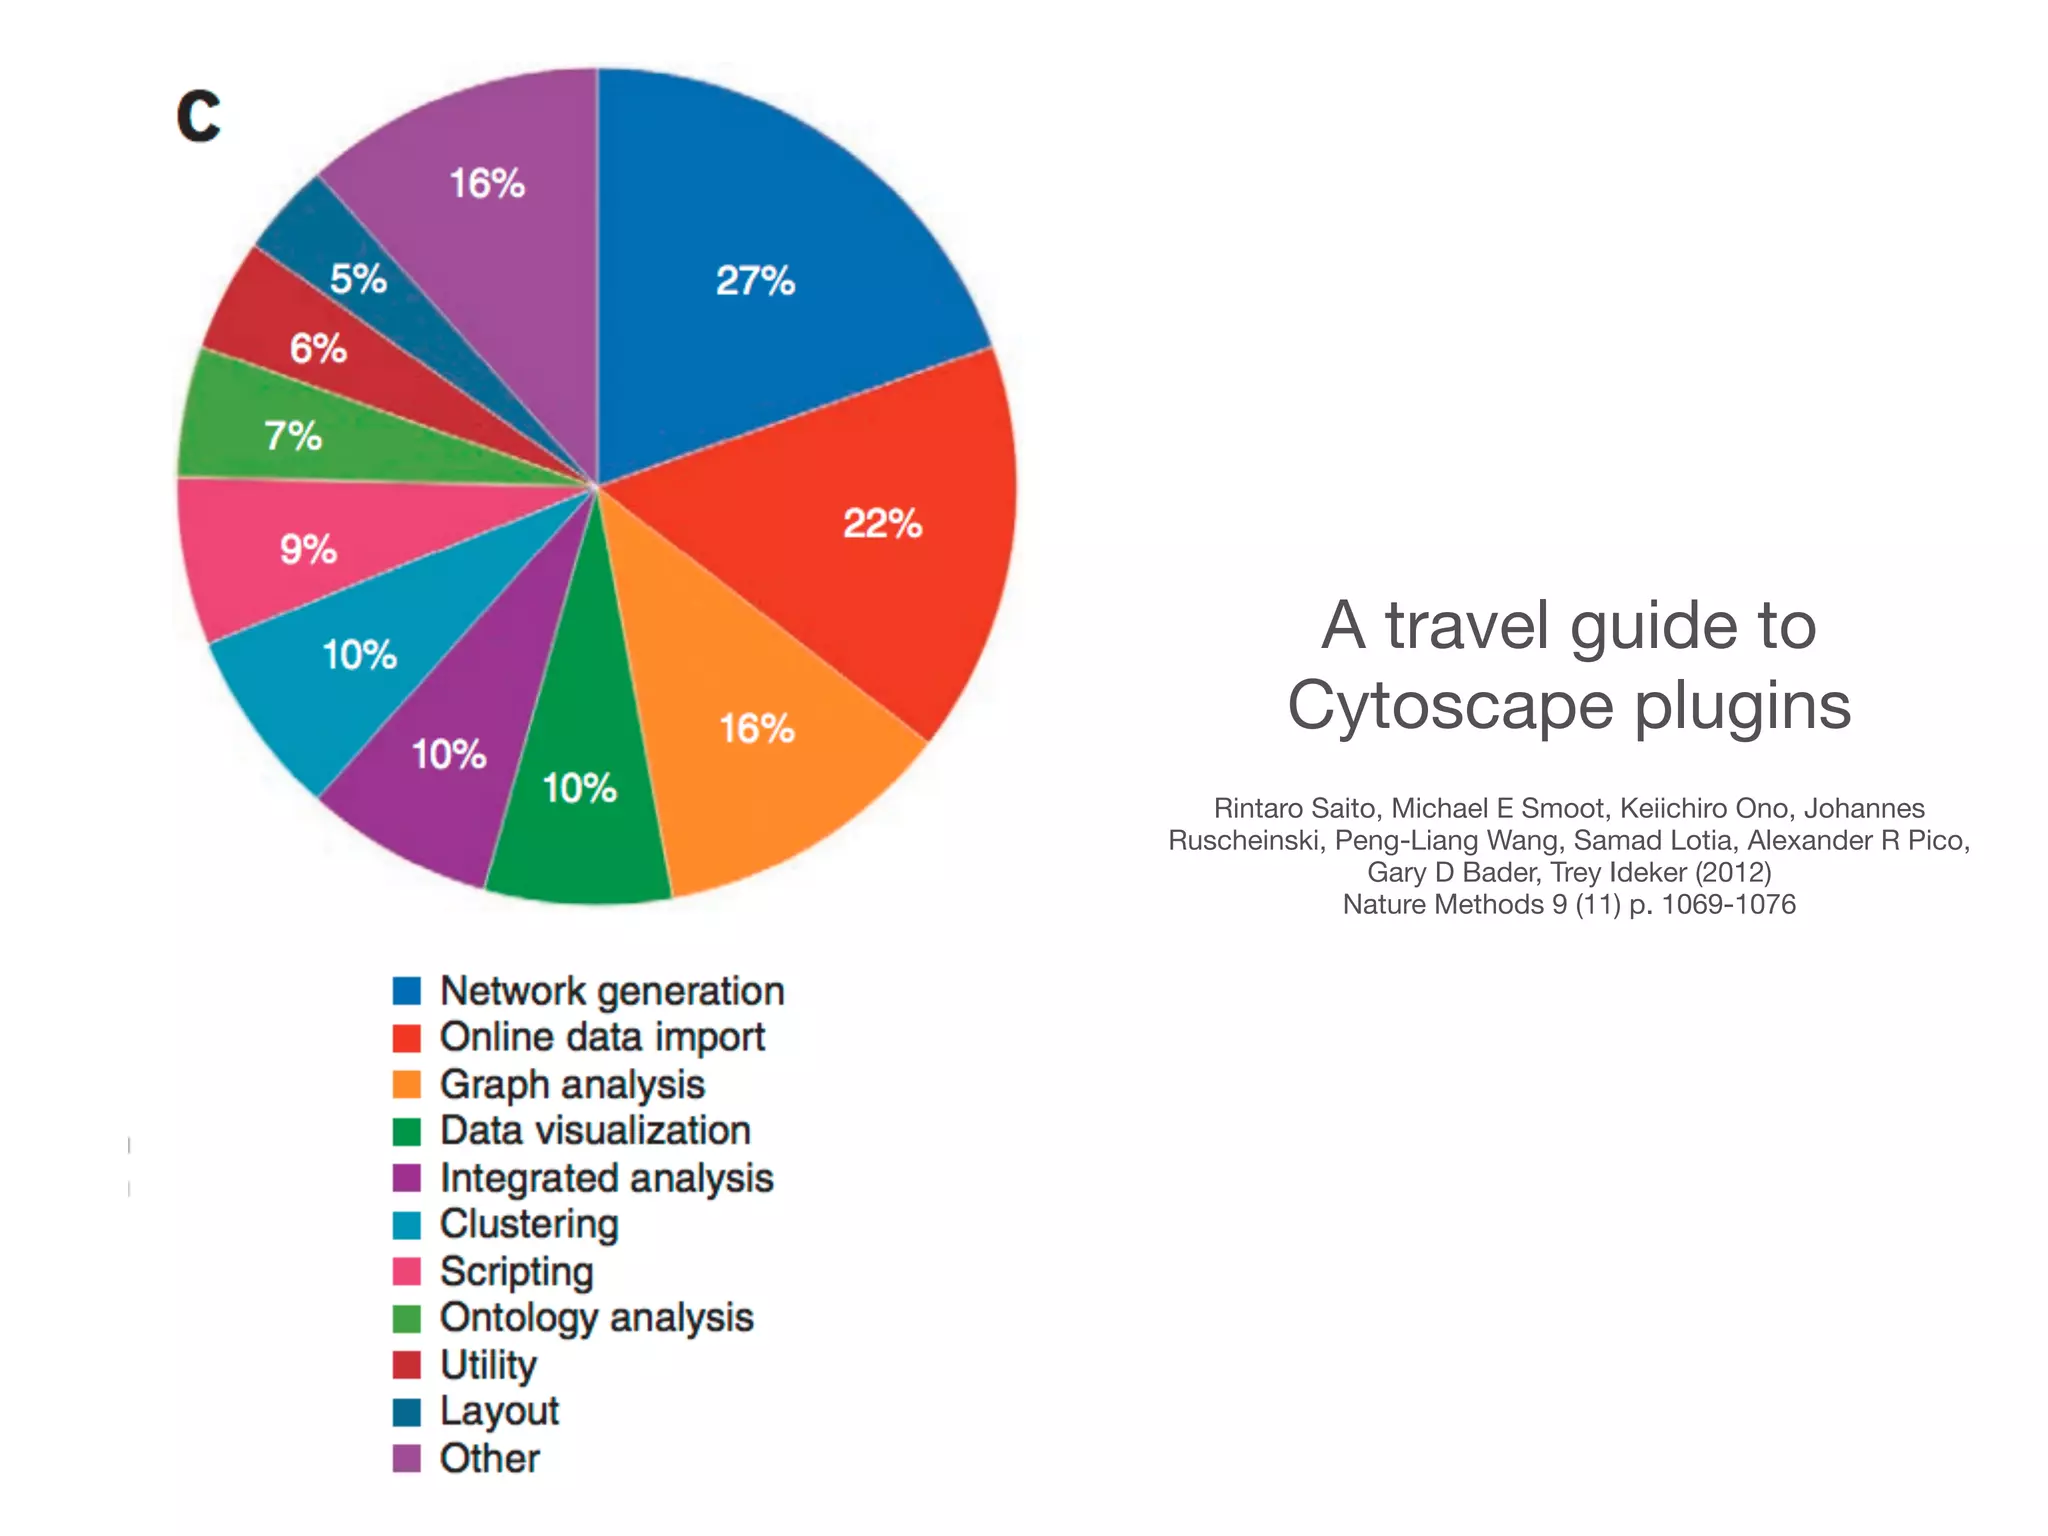
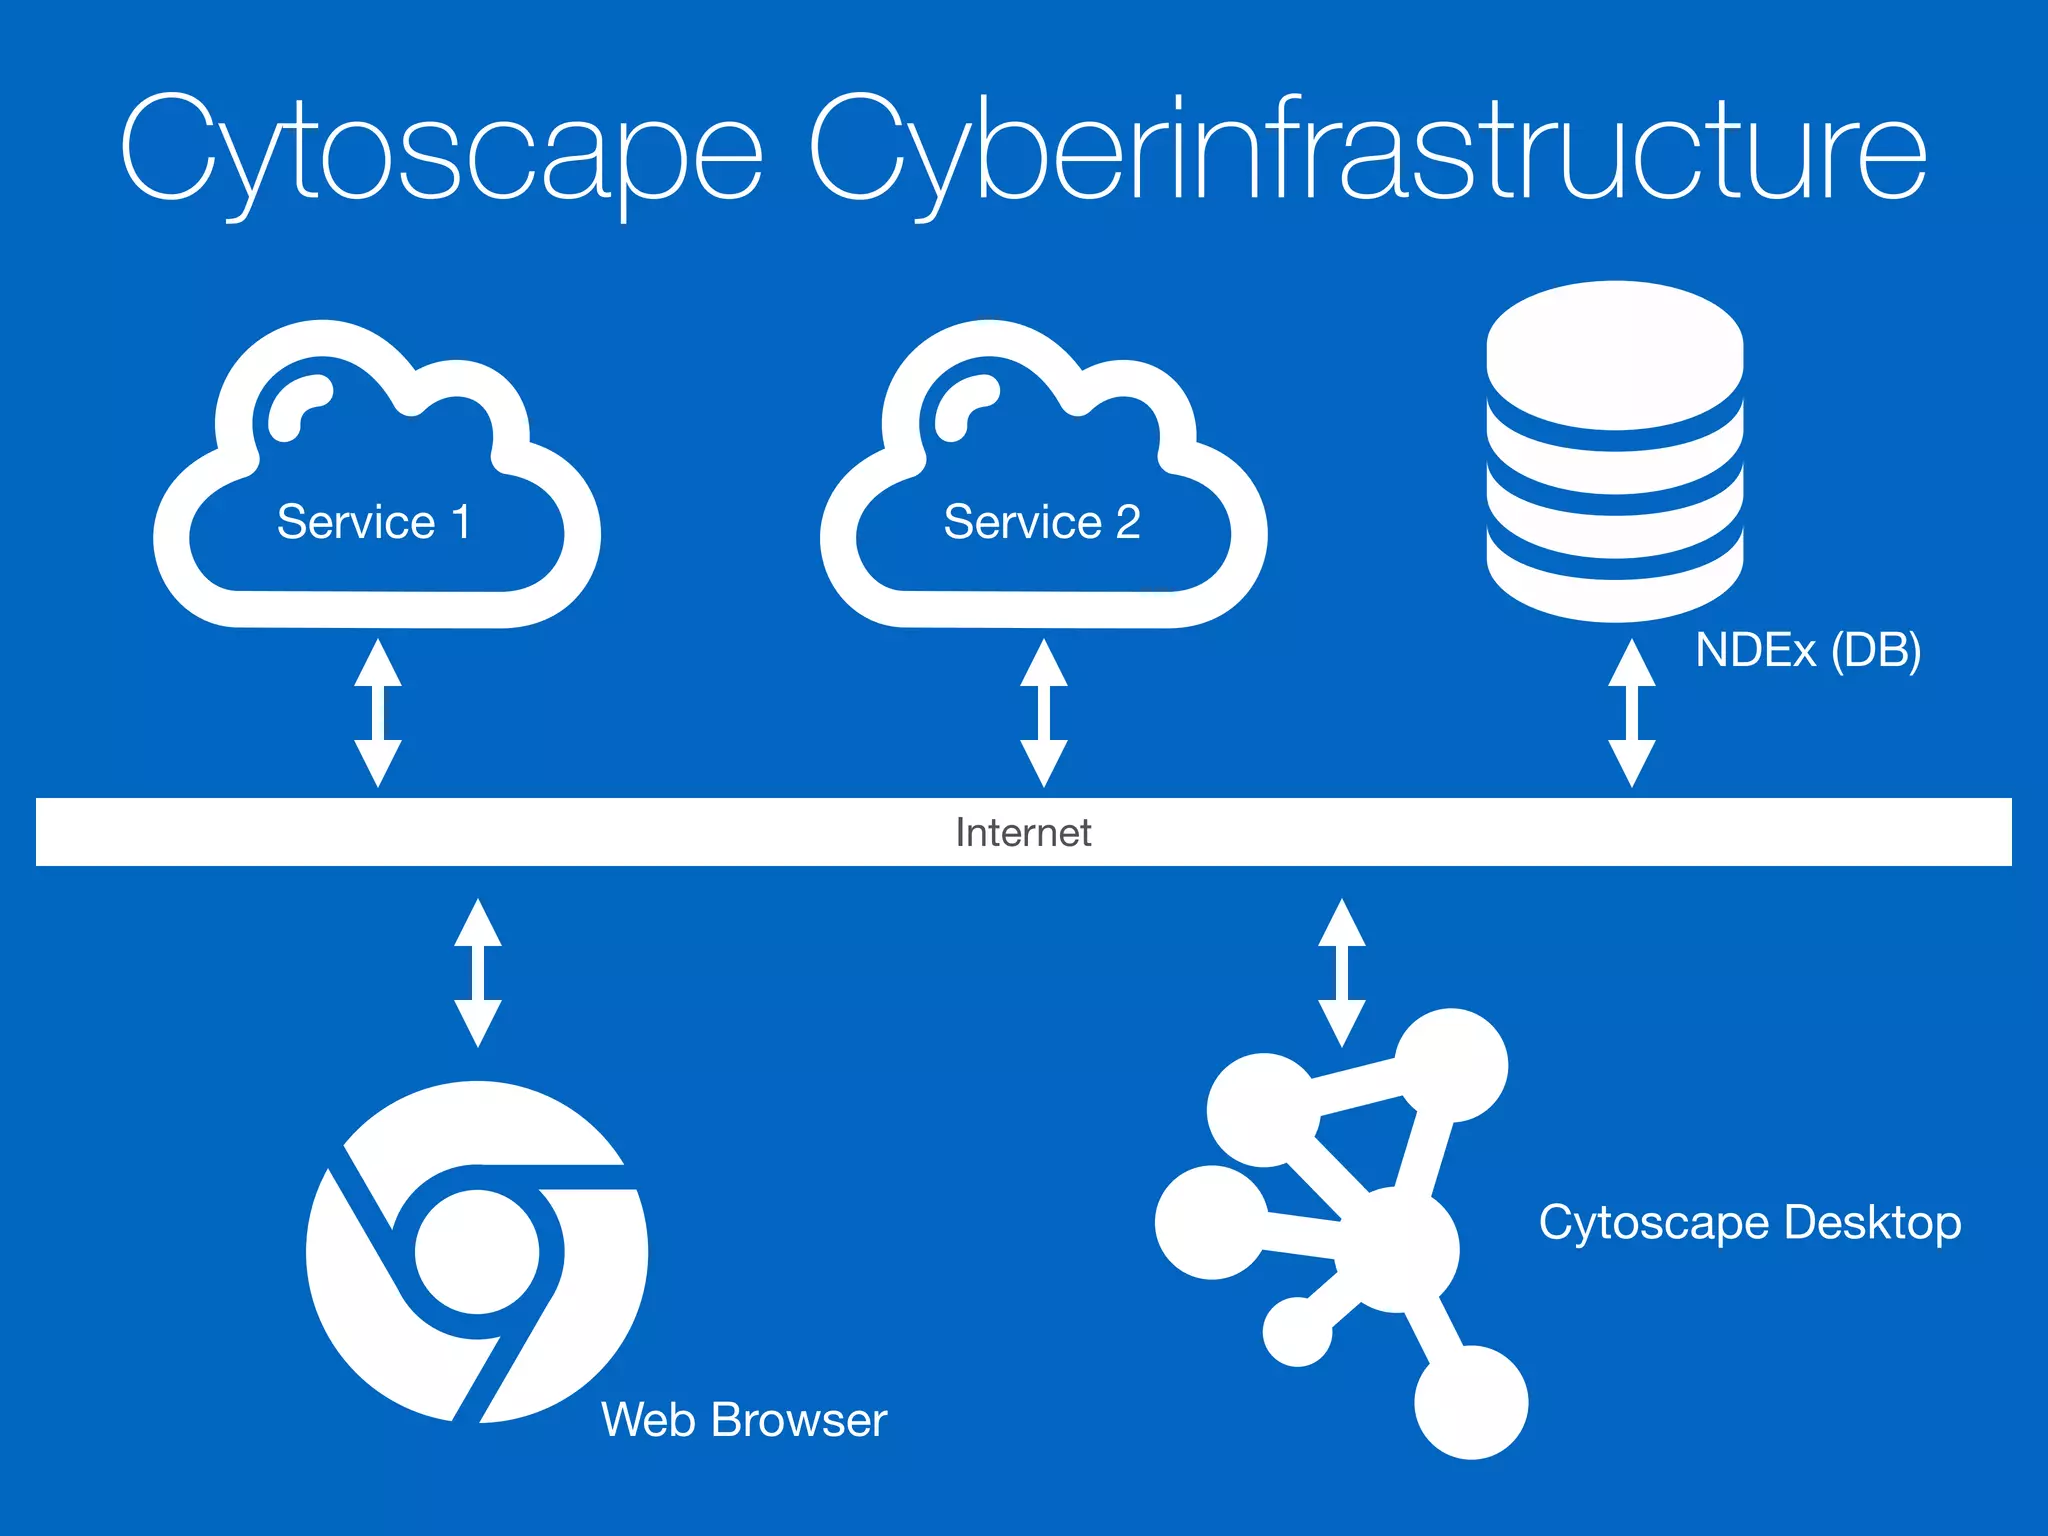
Analyzes network data through various methods (desktop and web tools) and libraries like Graph Analysis and visualization comparisons.
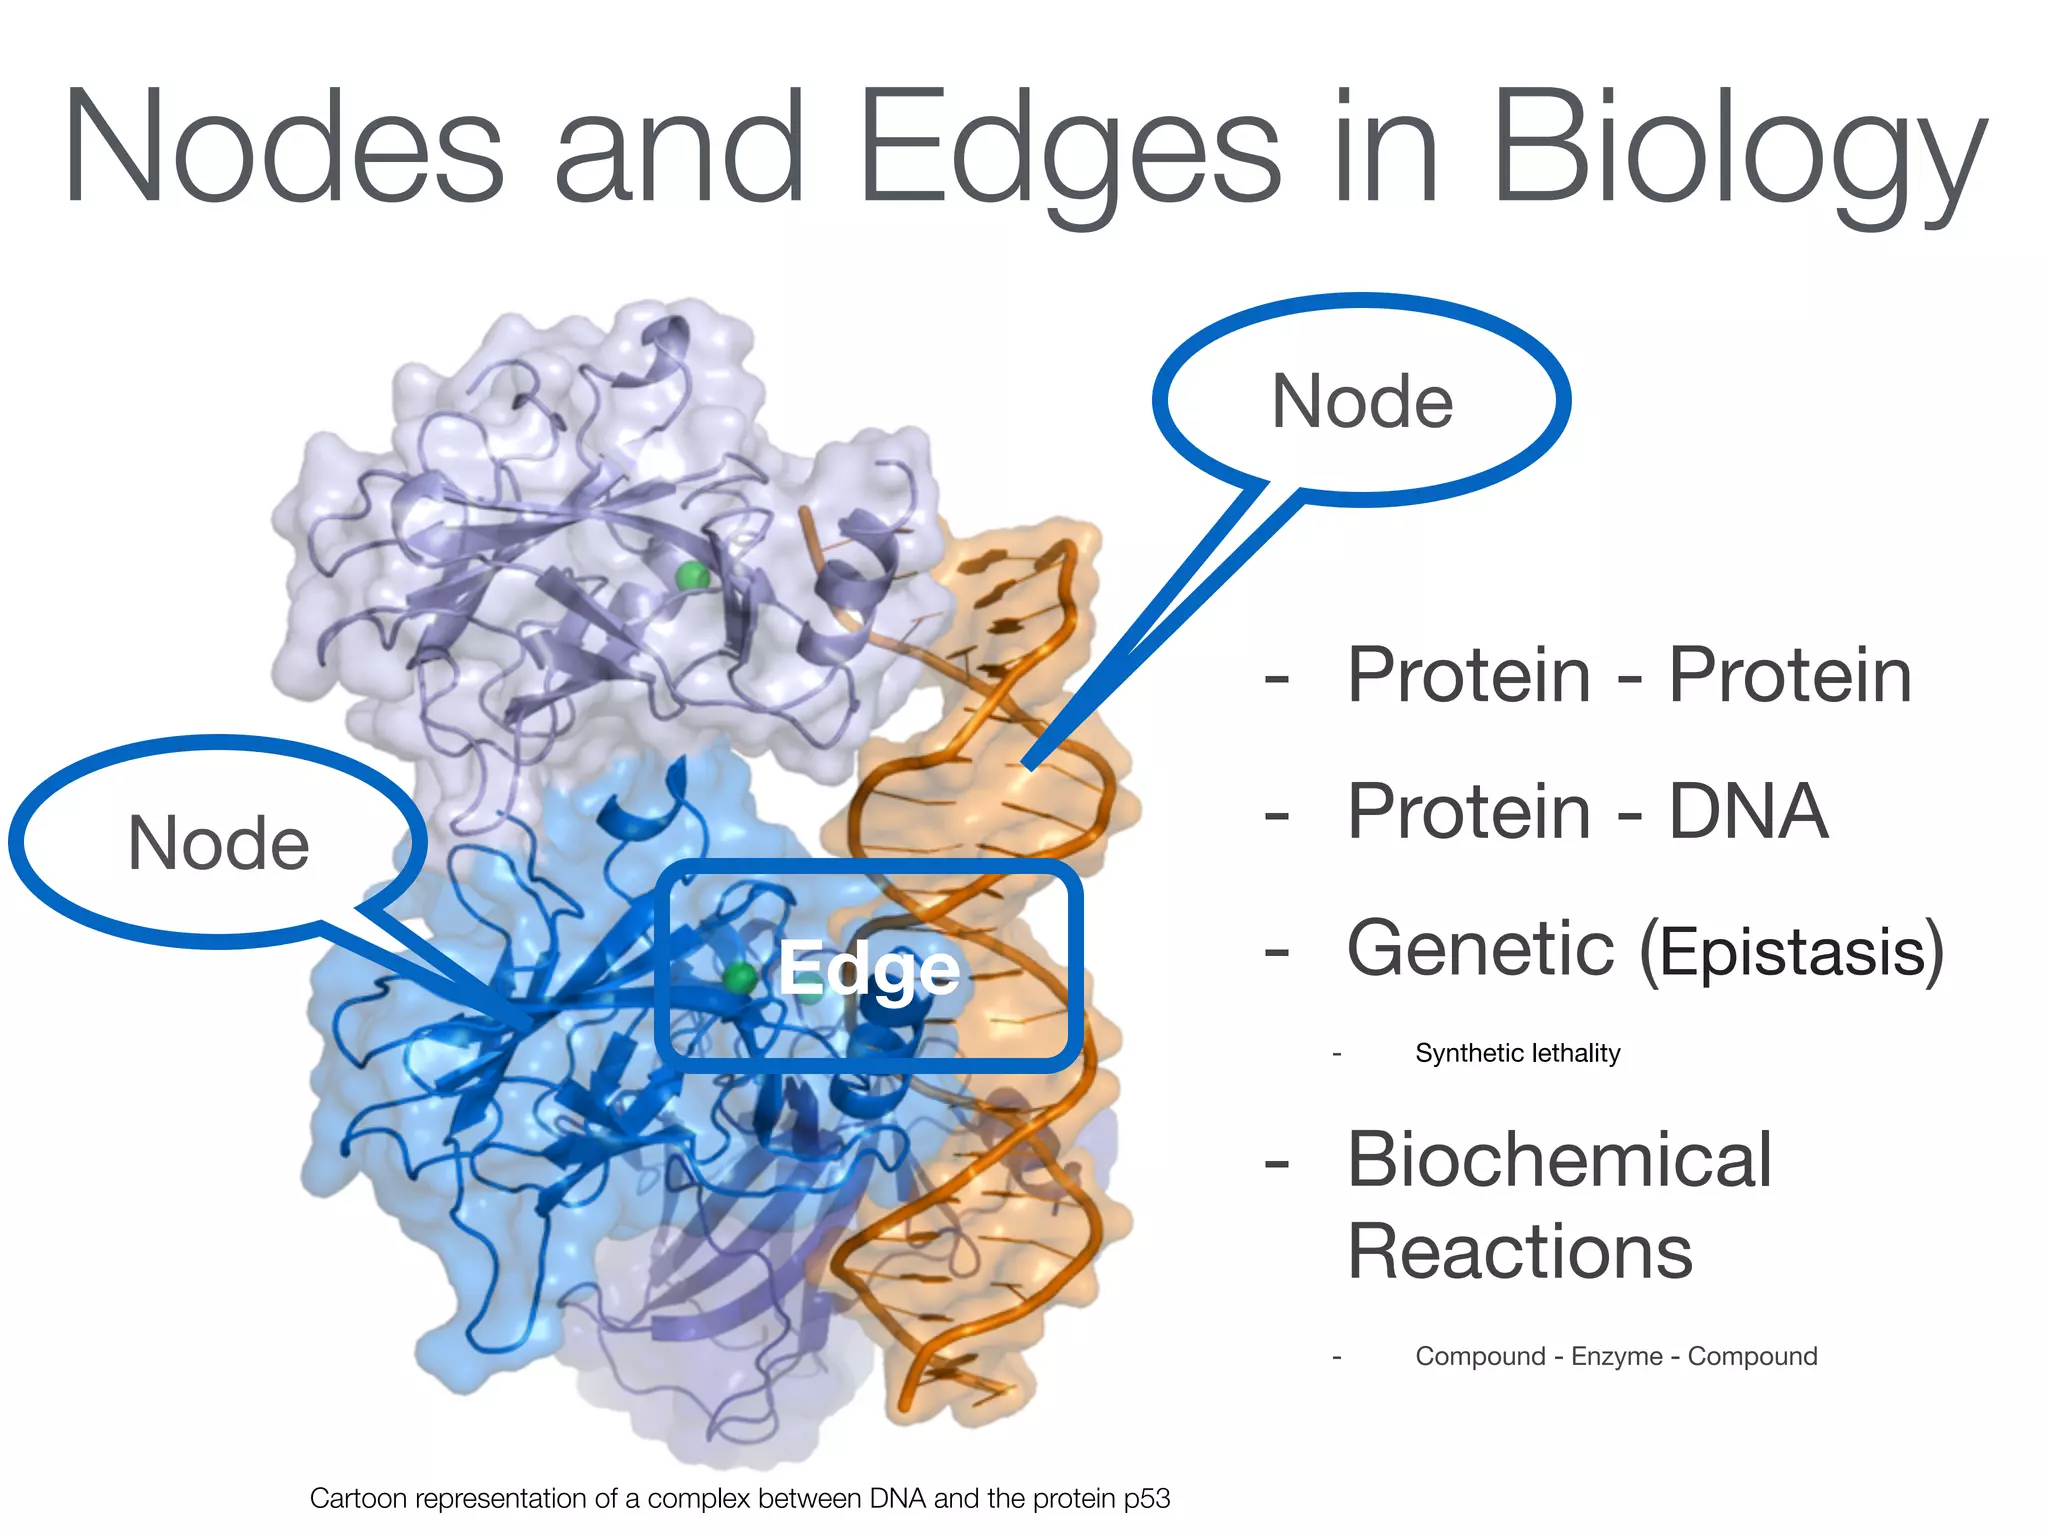
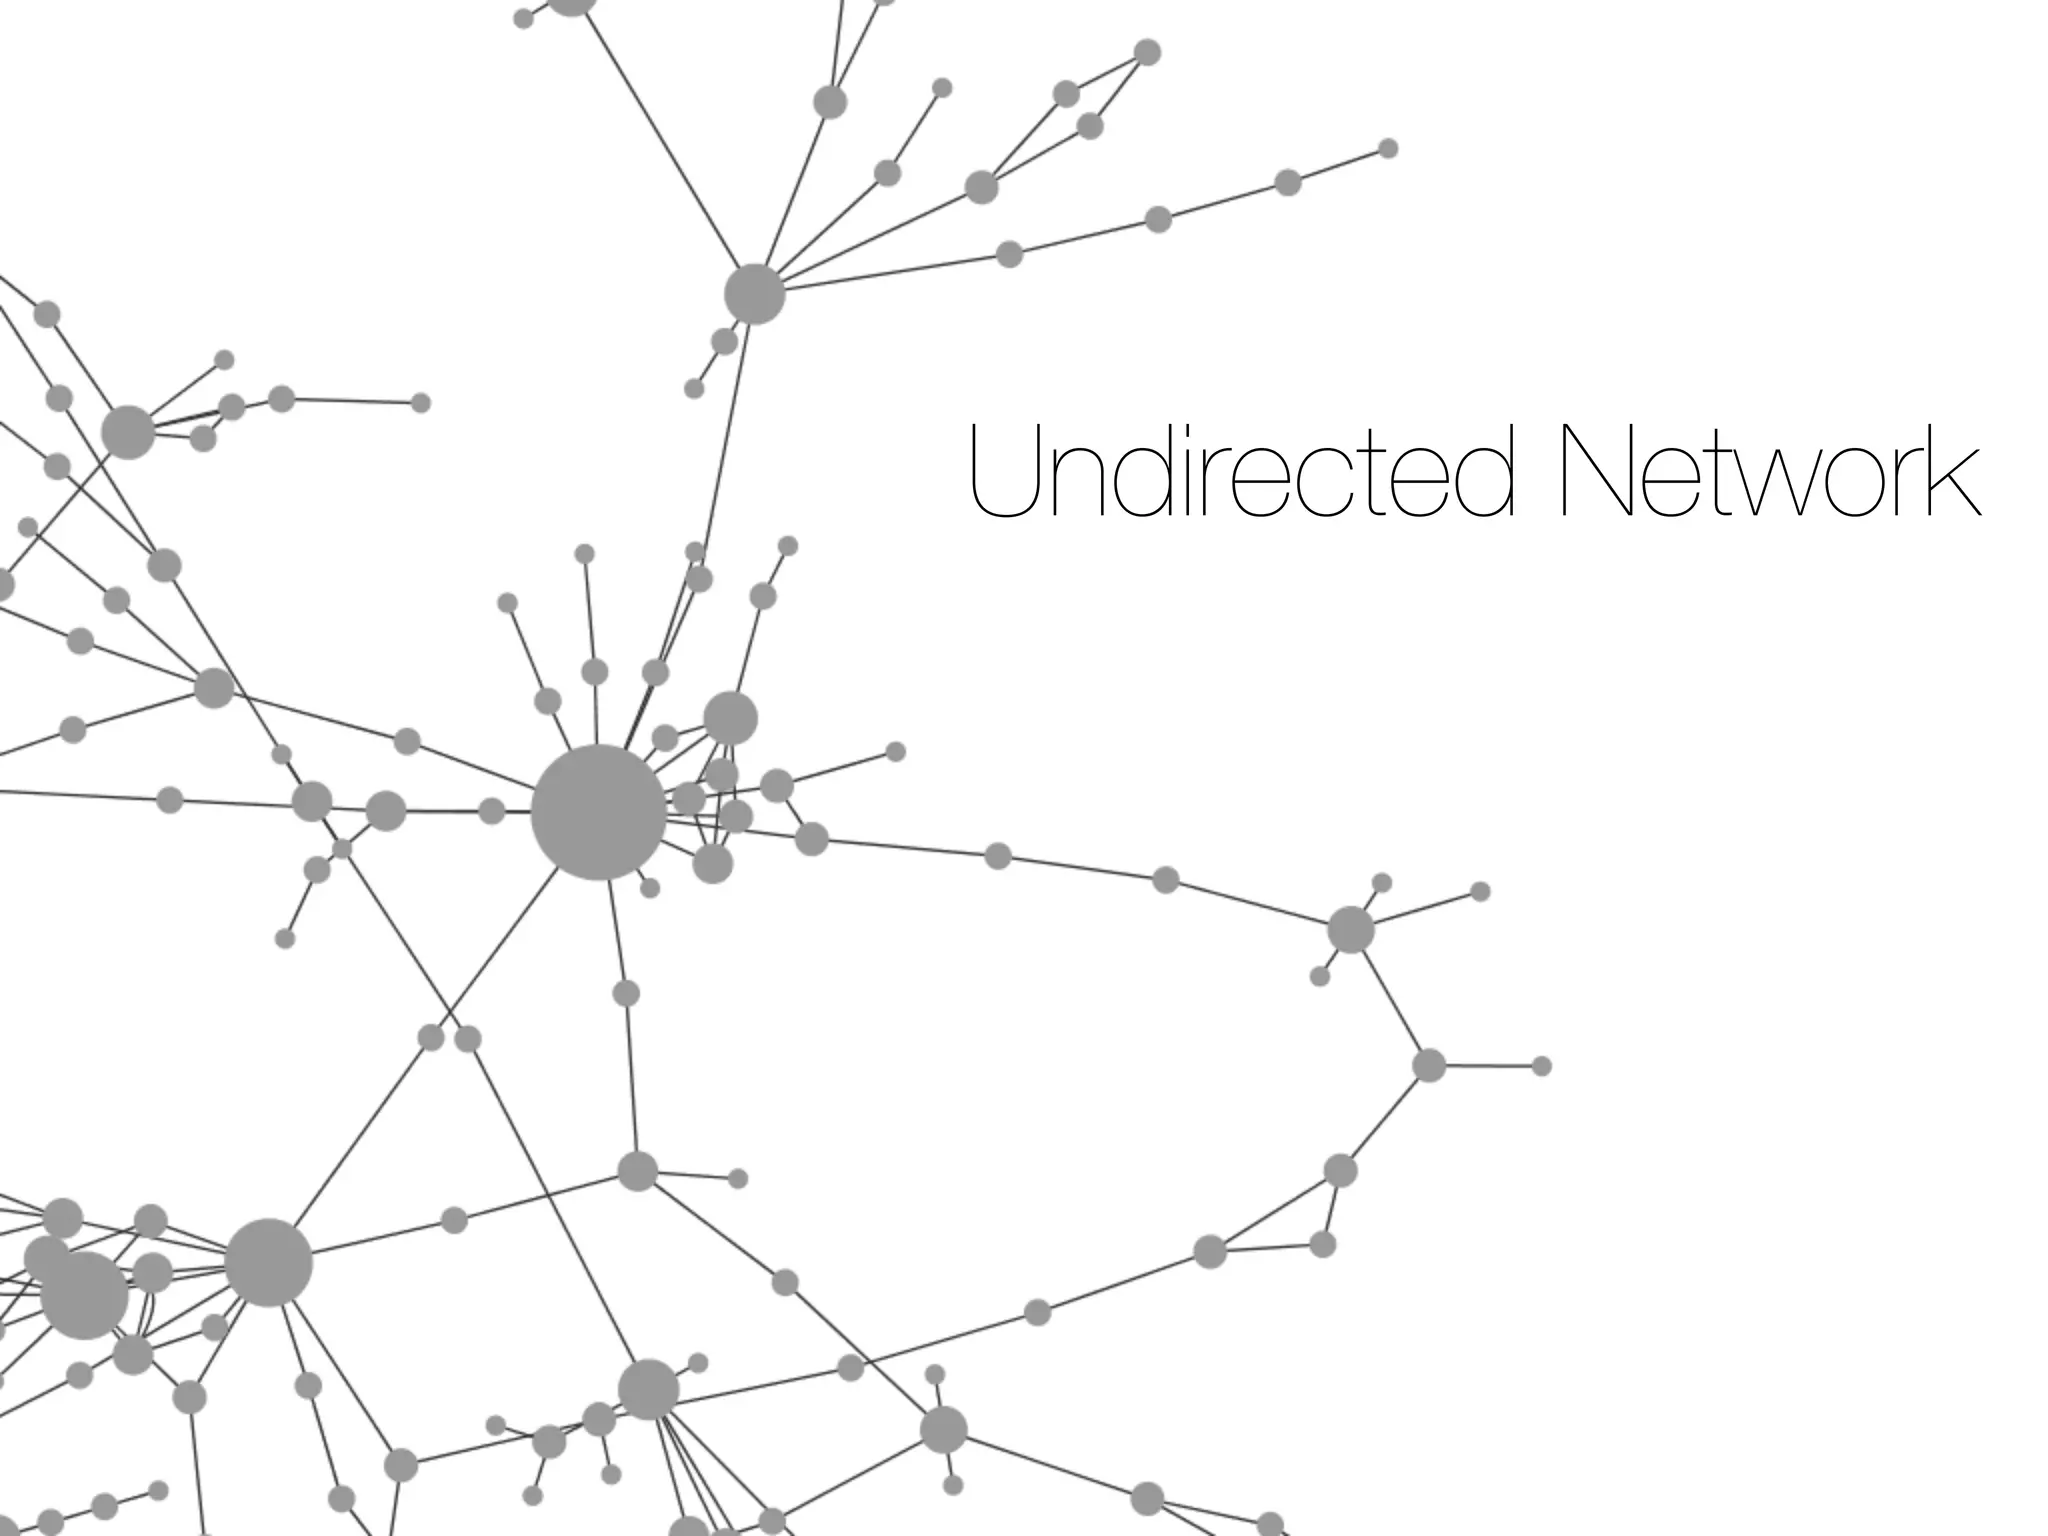
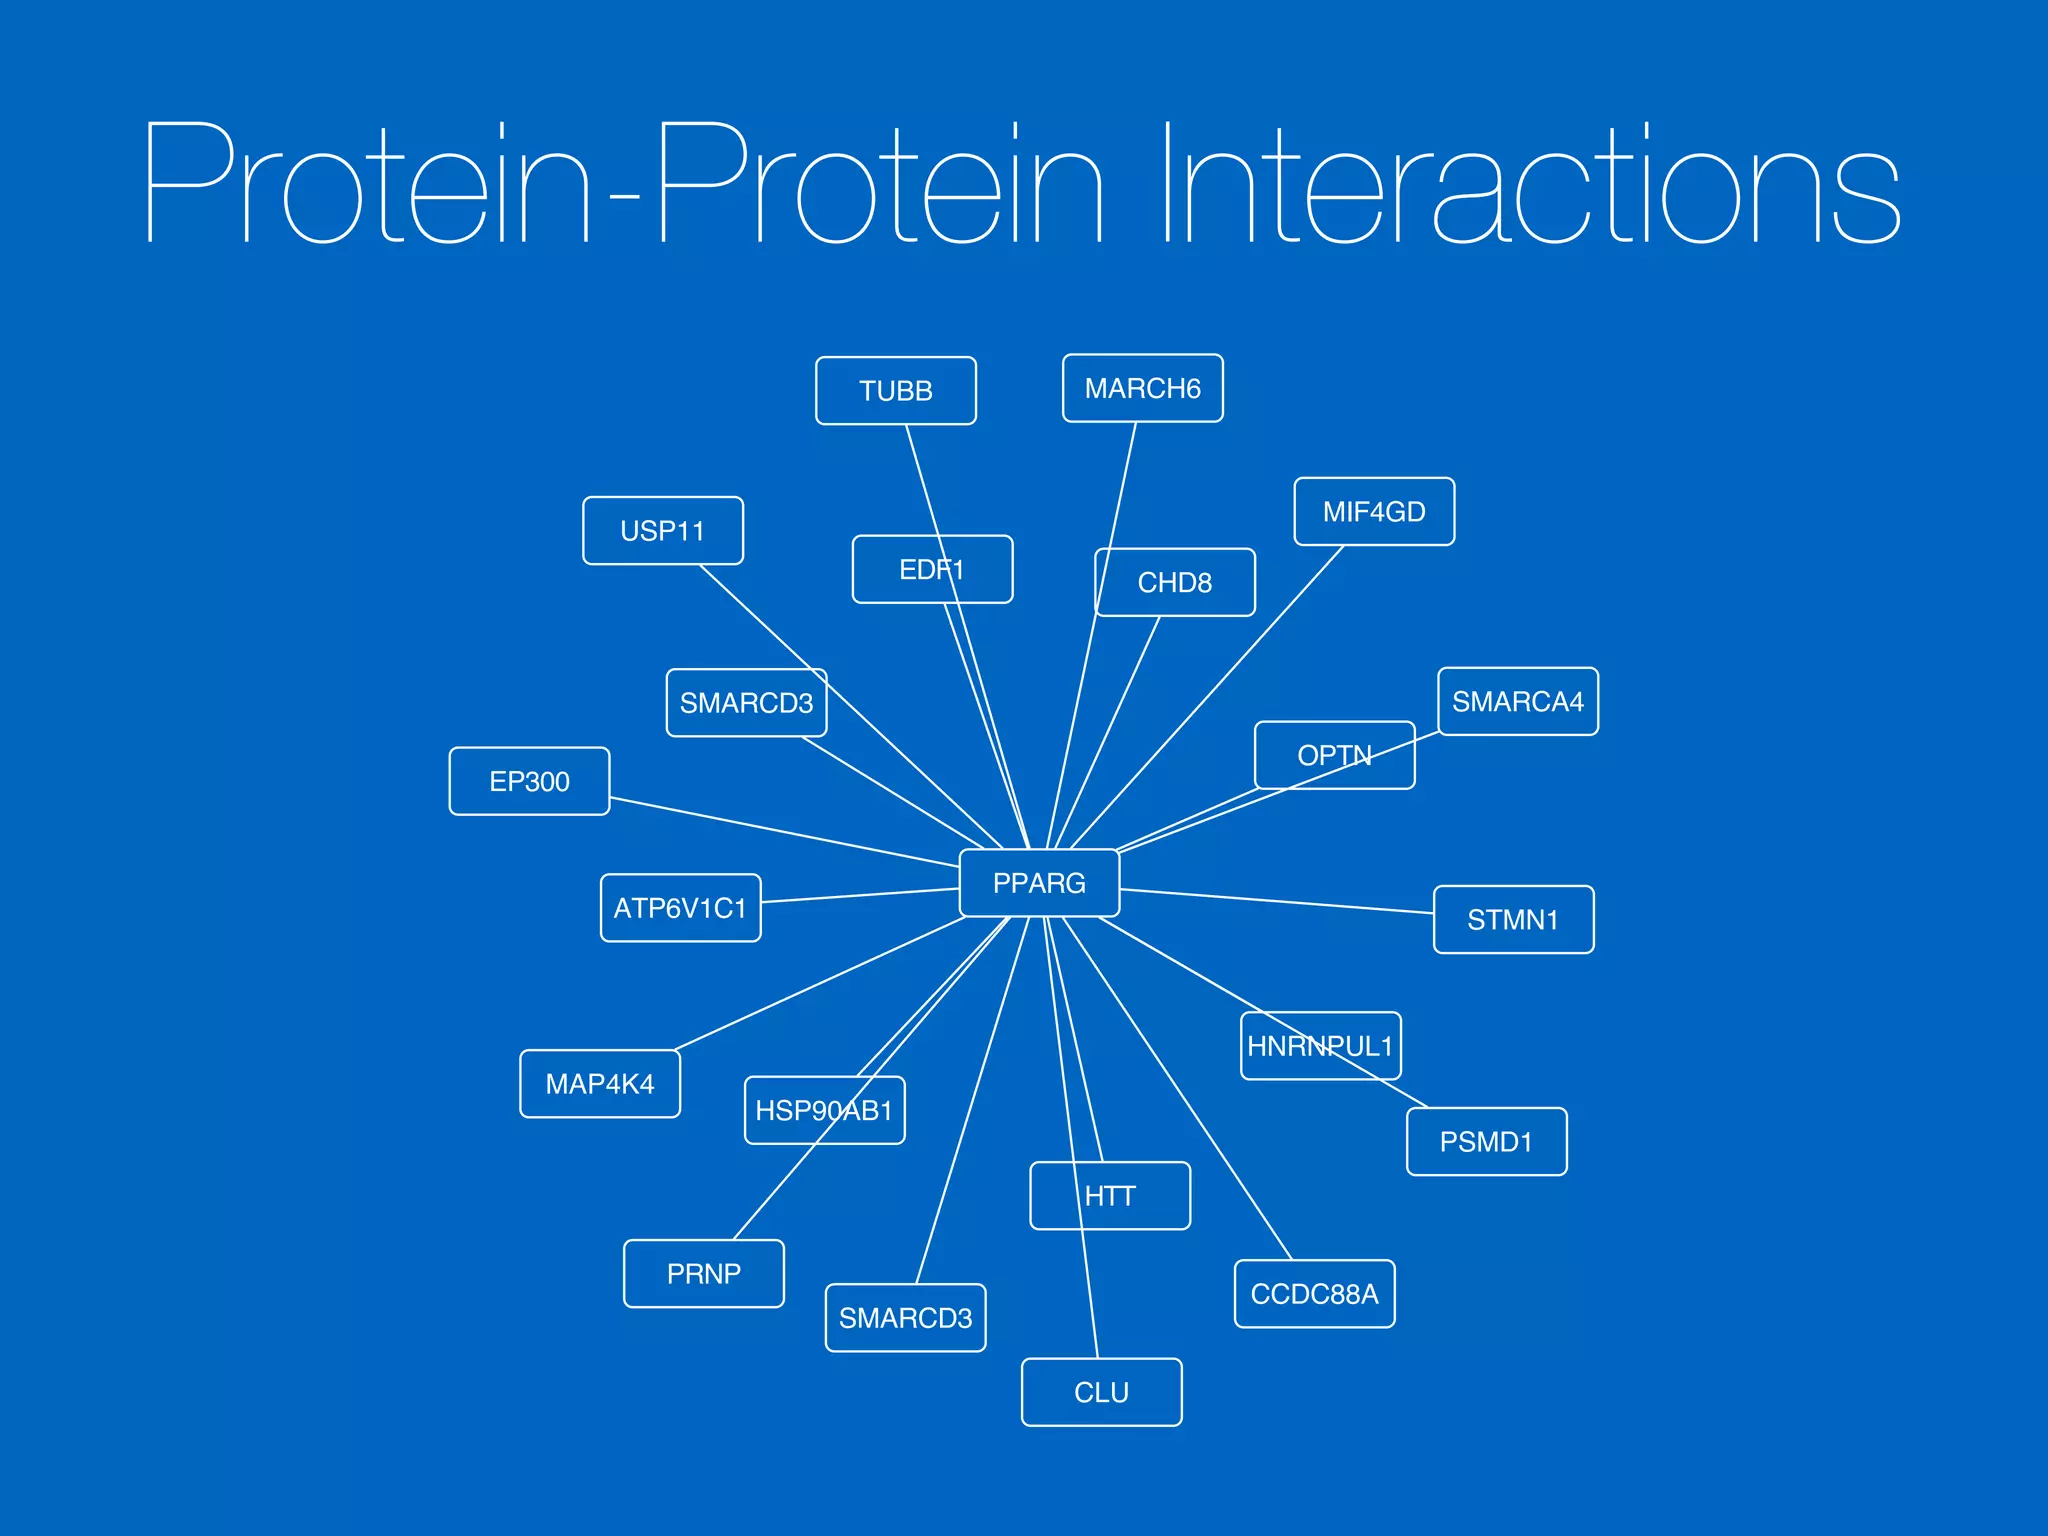
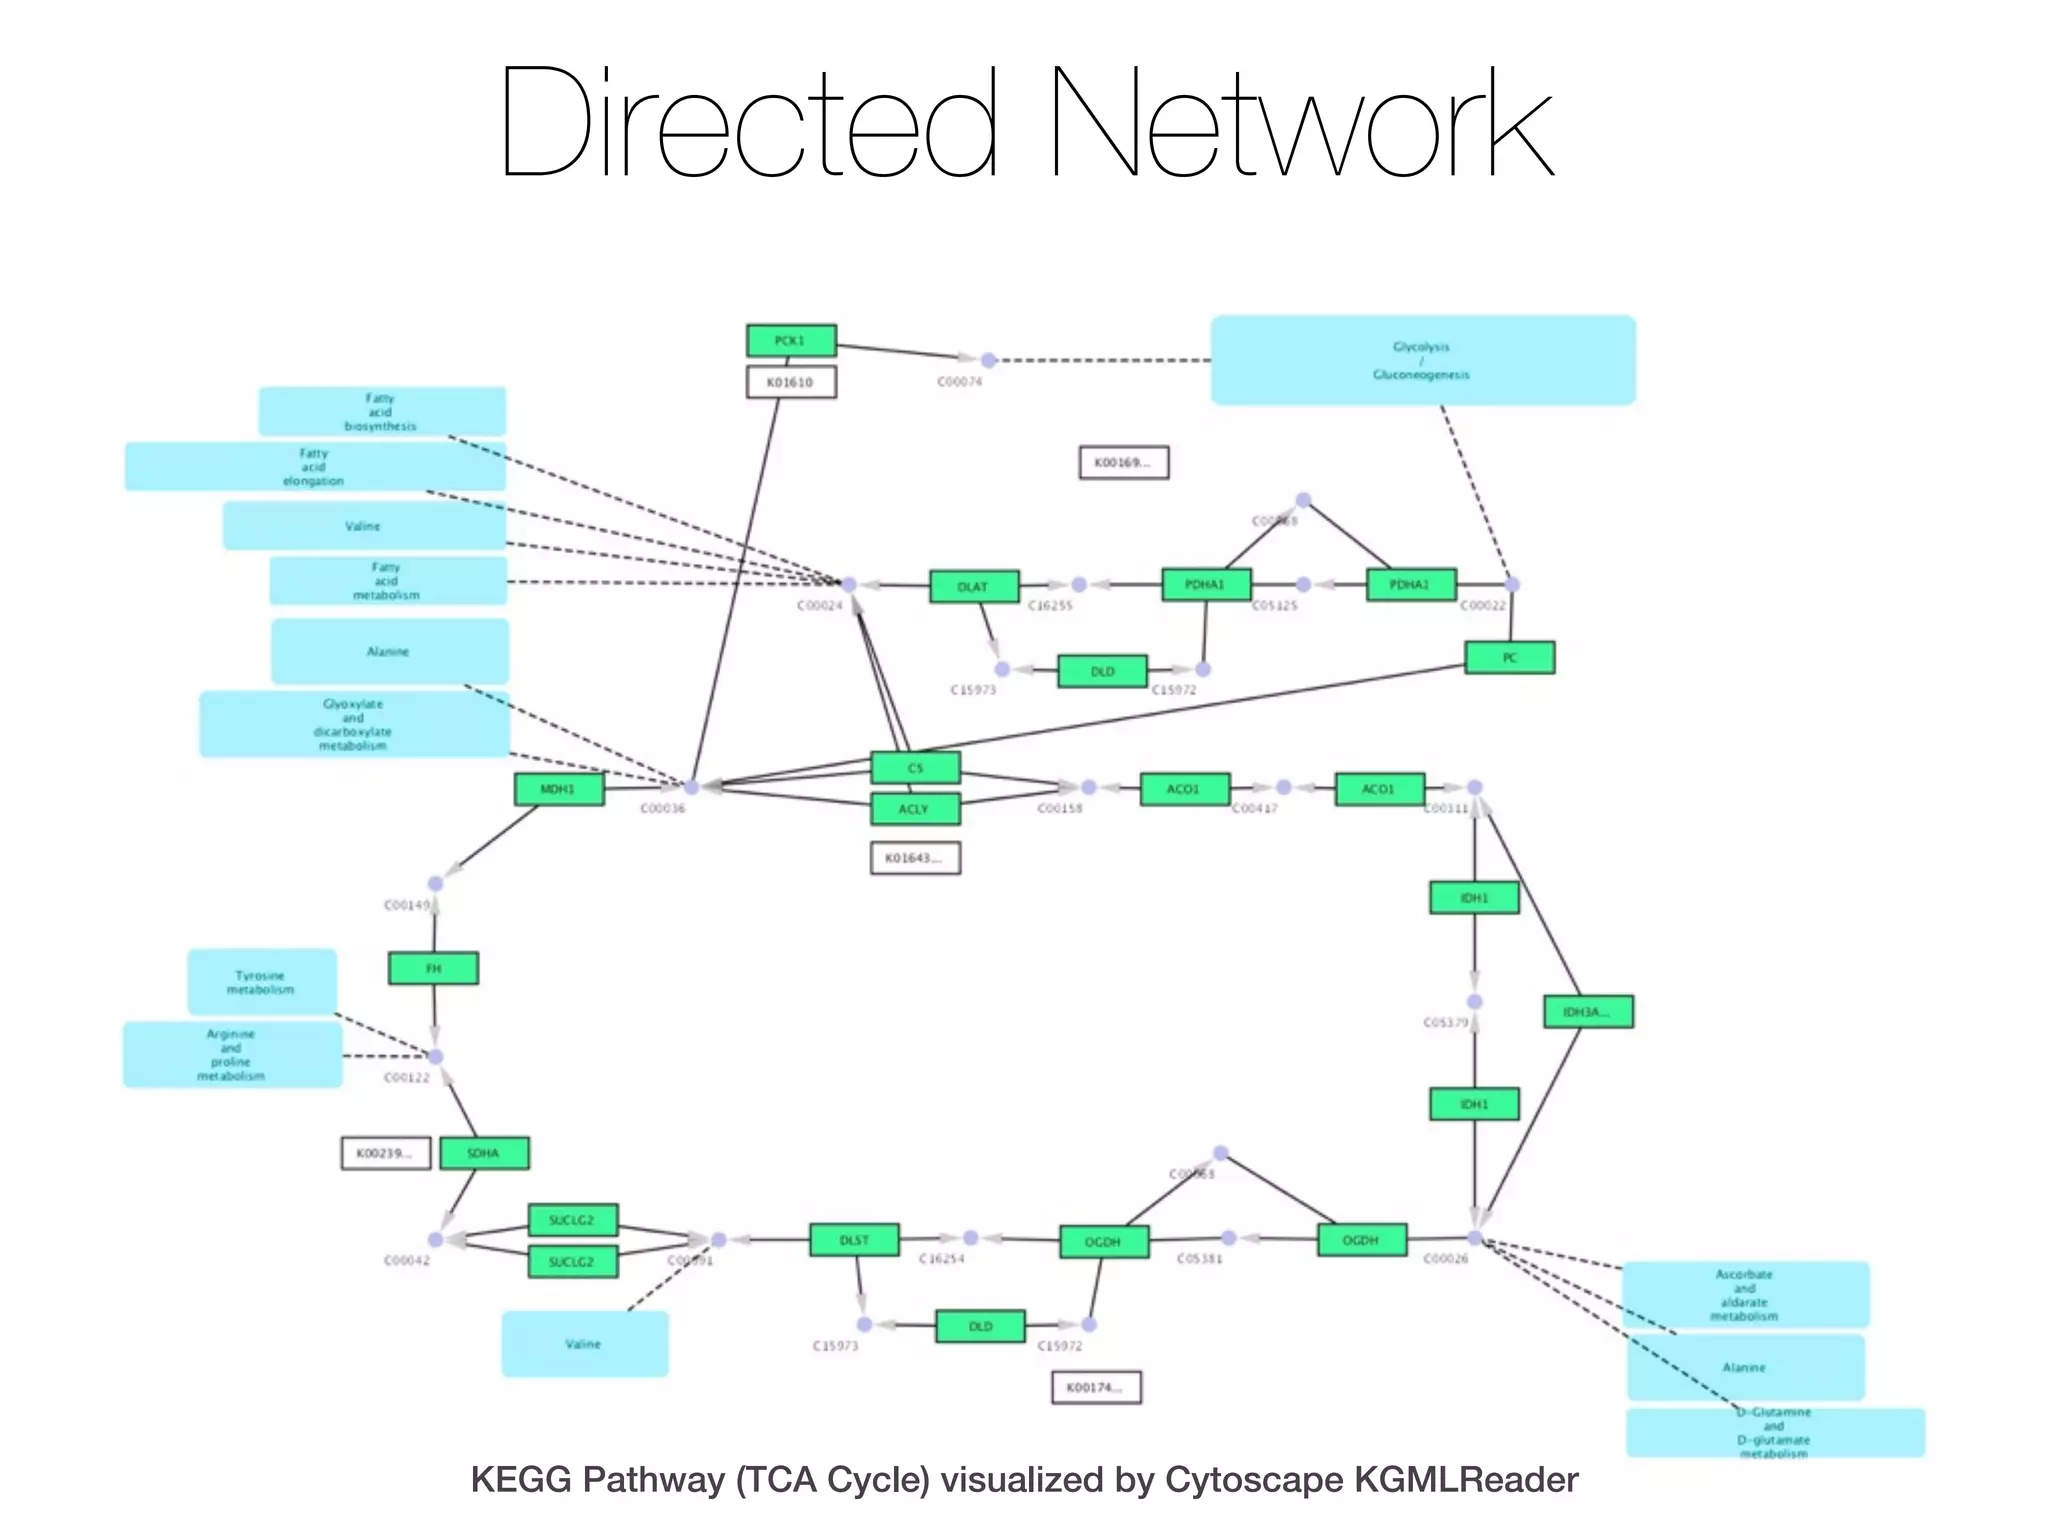
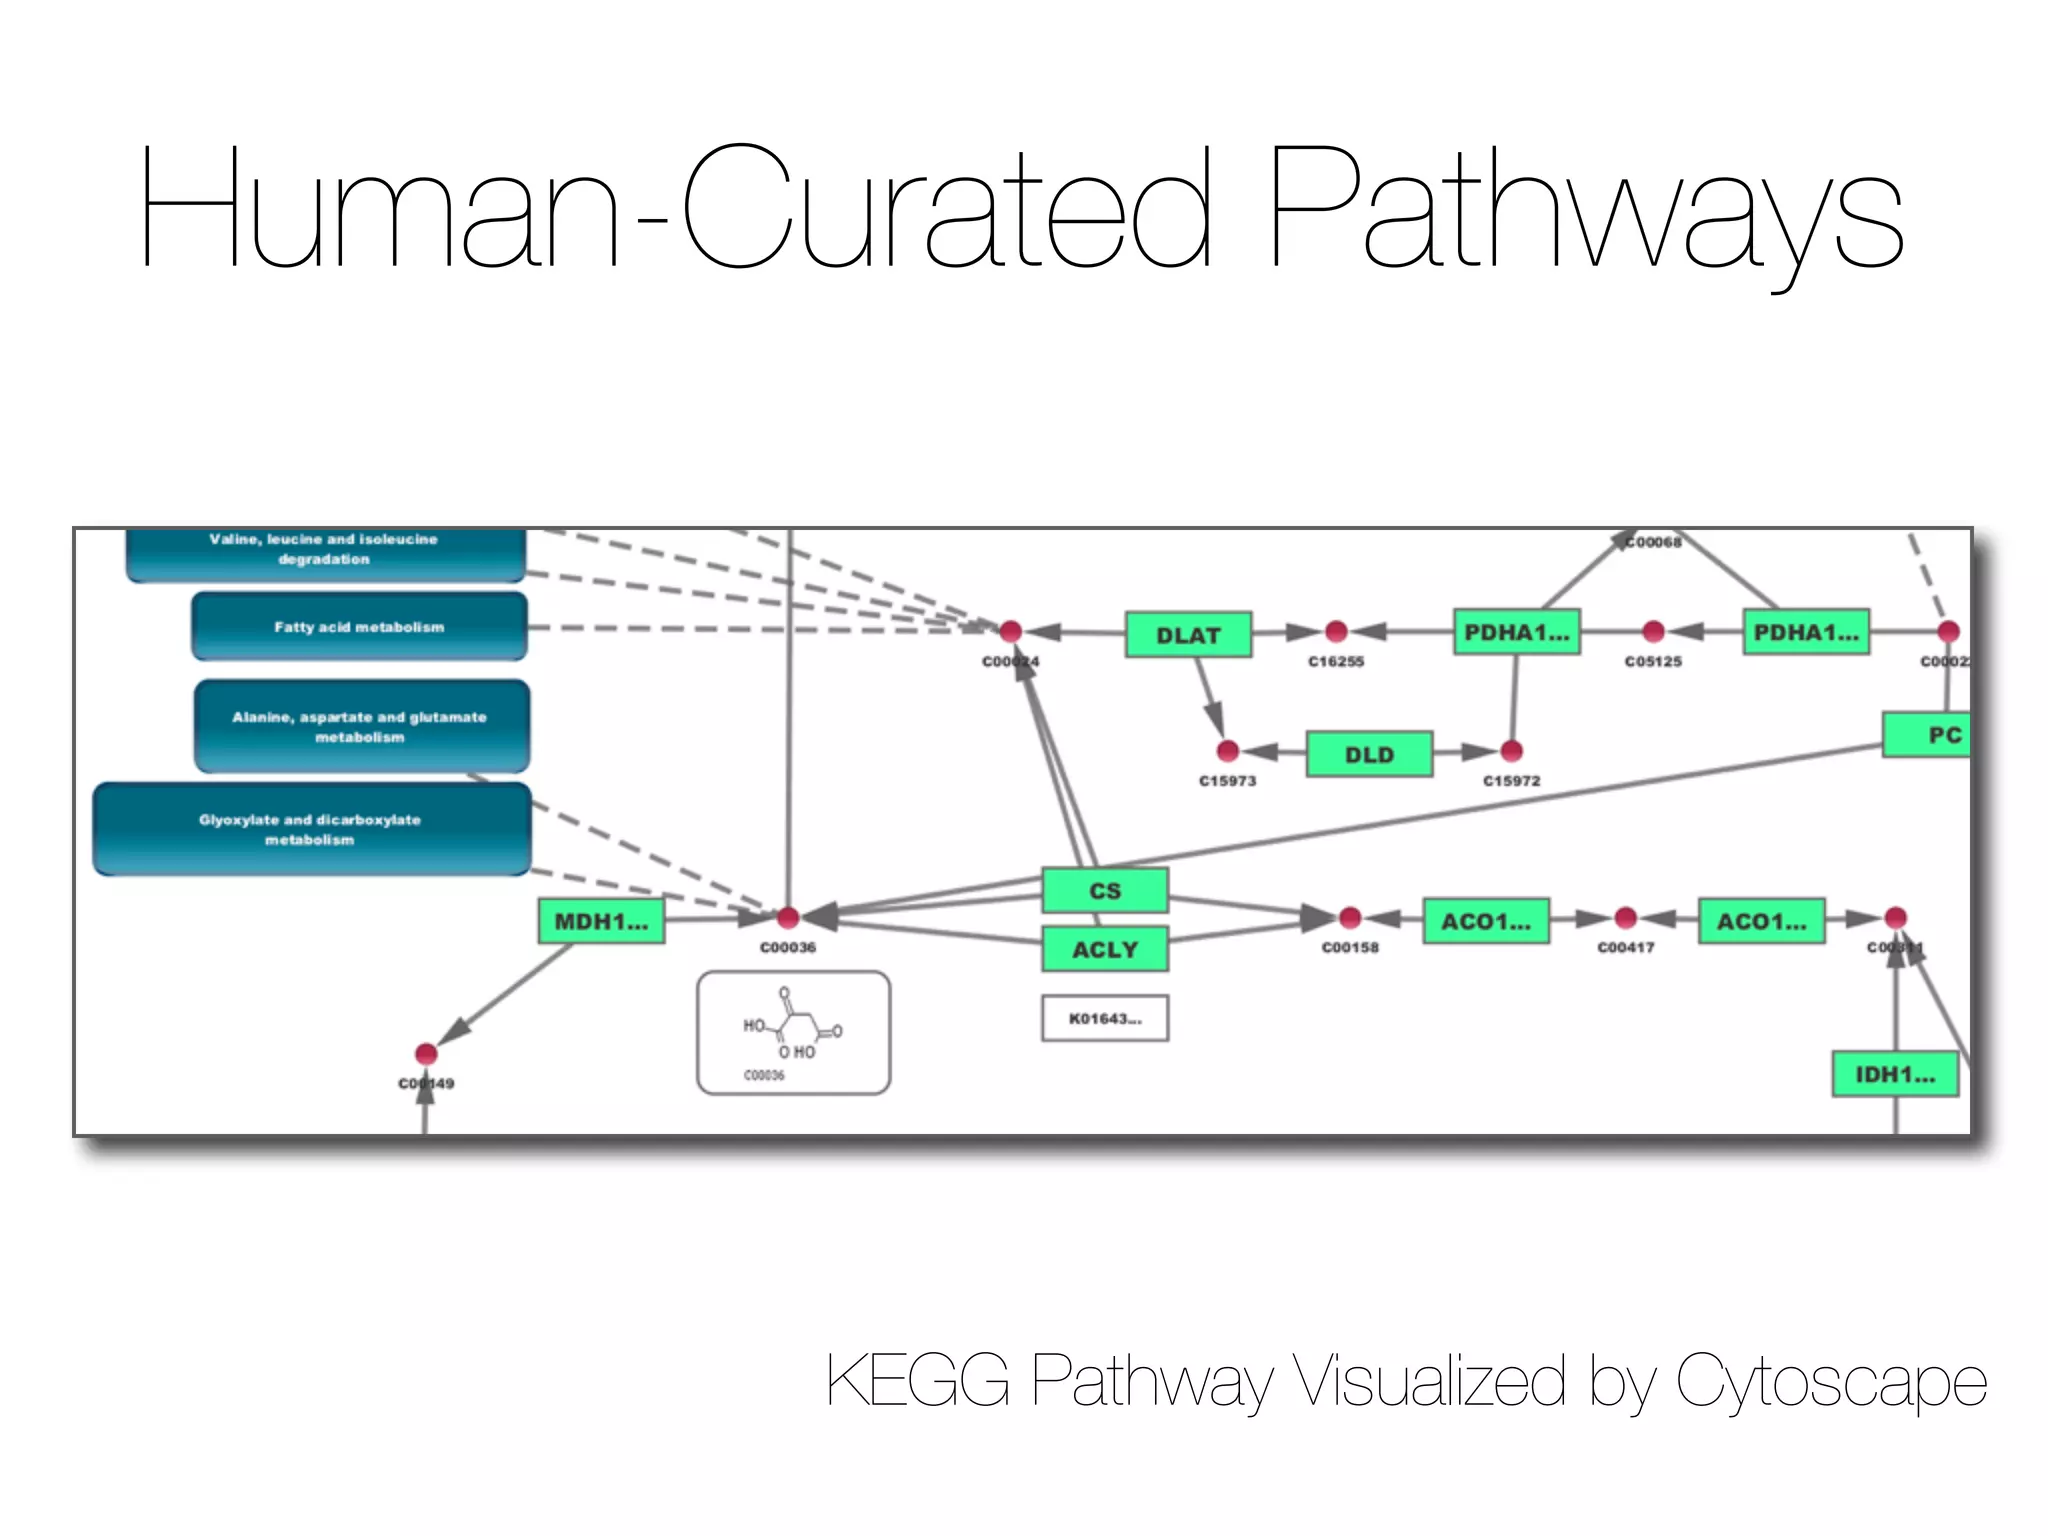
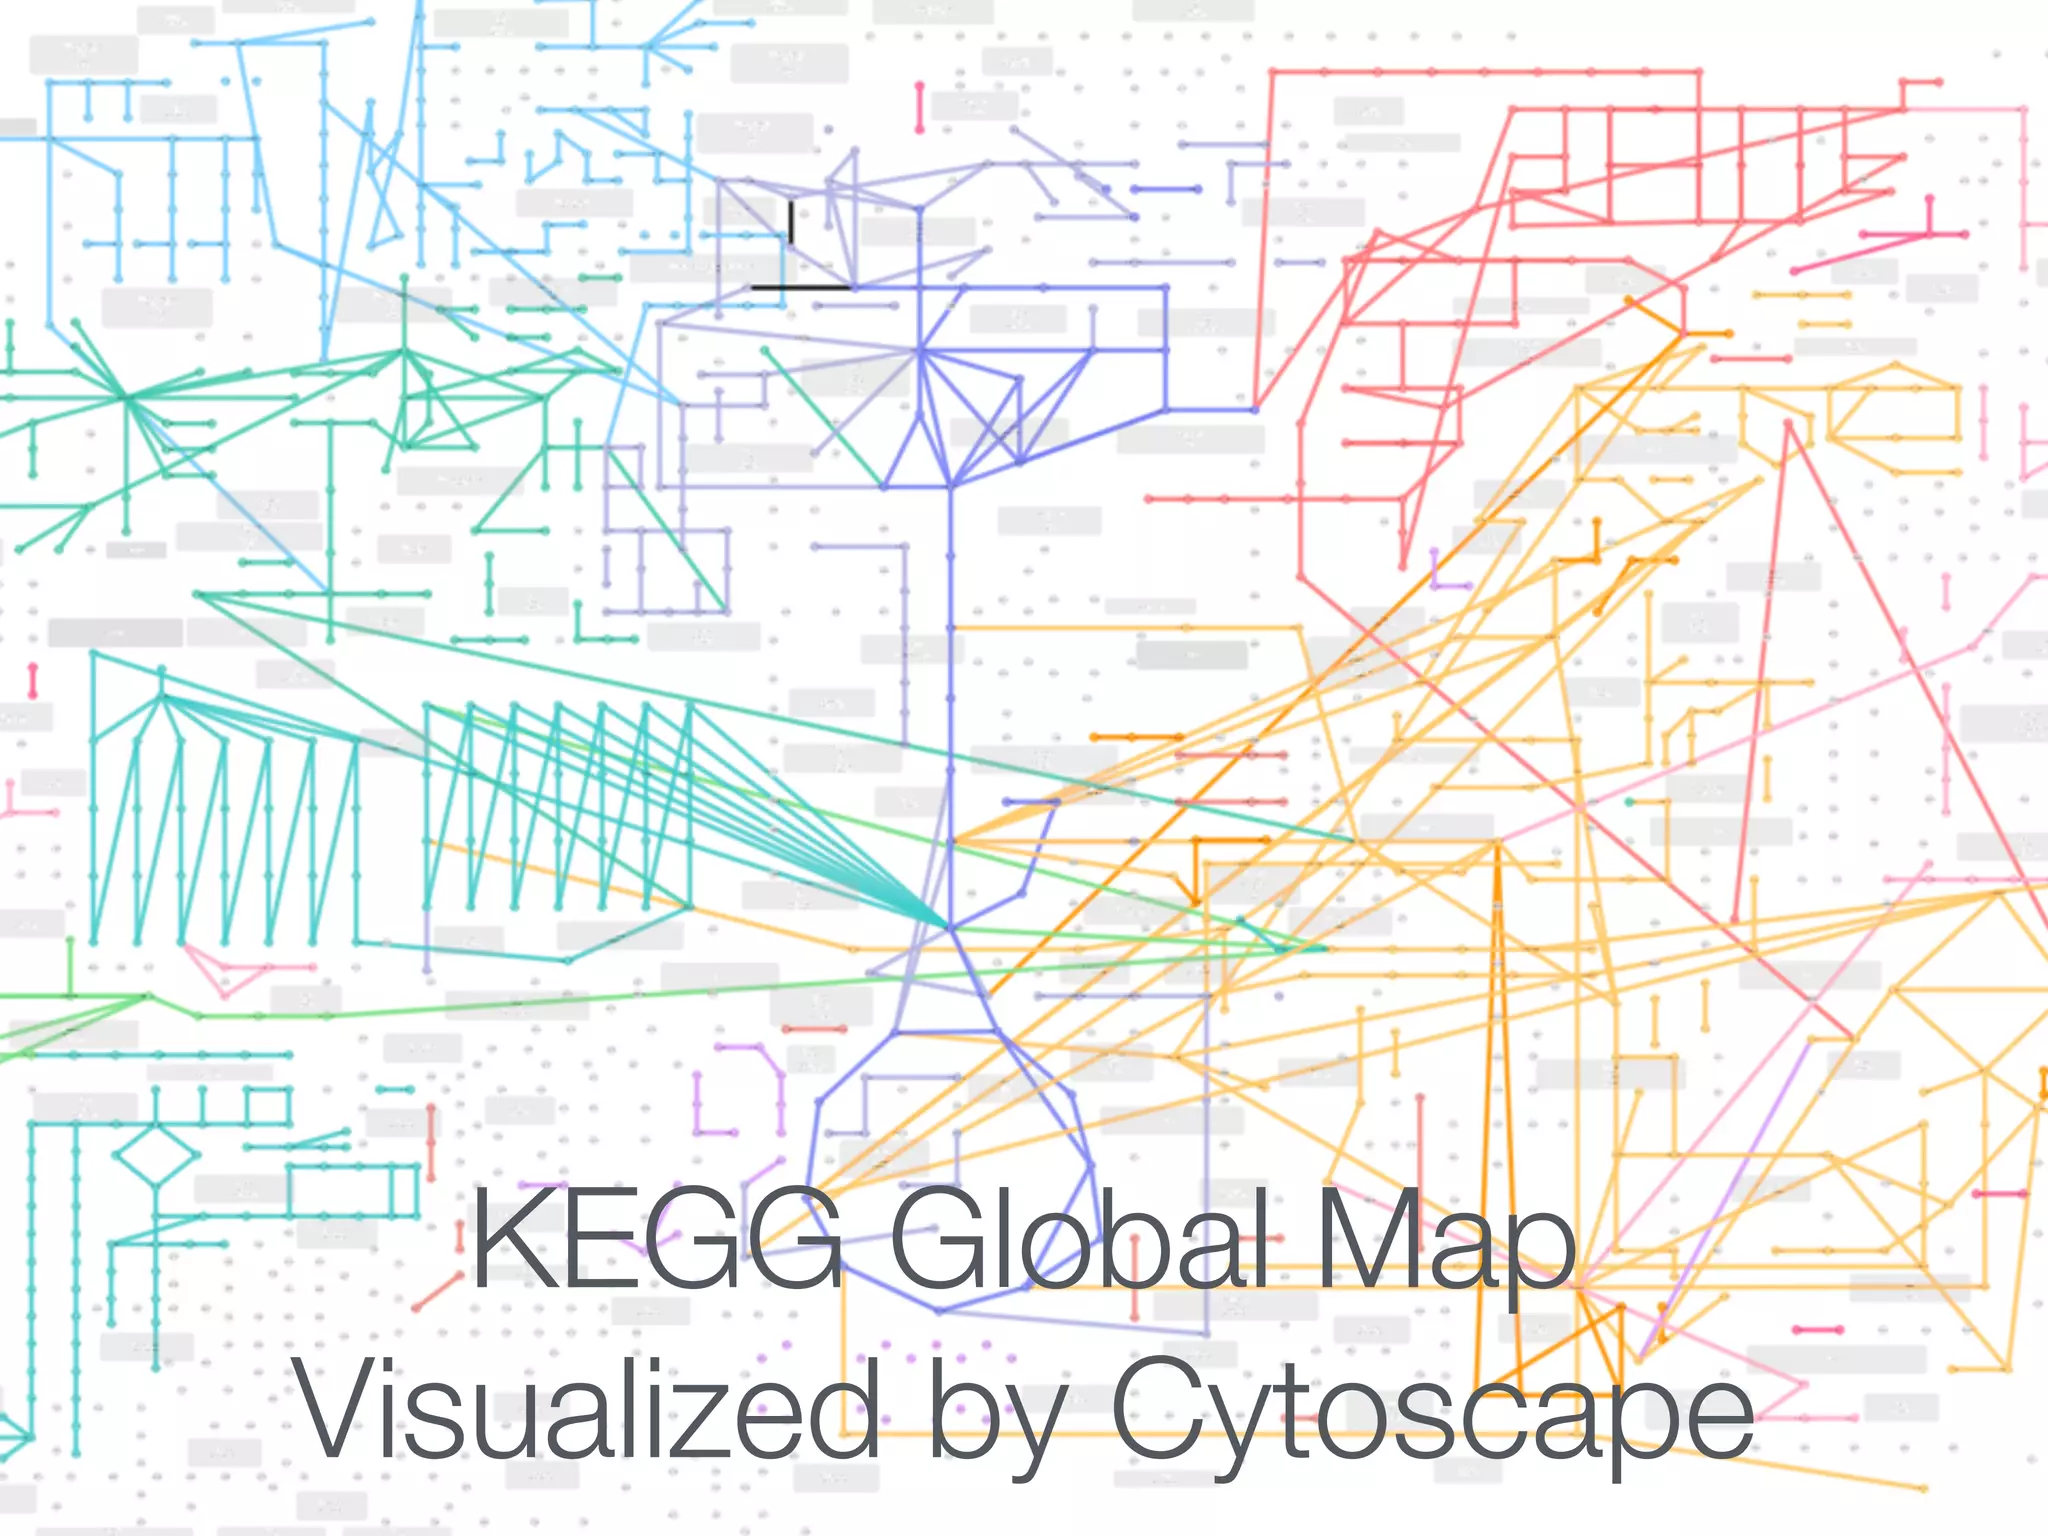
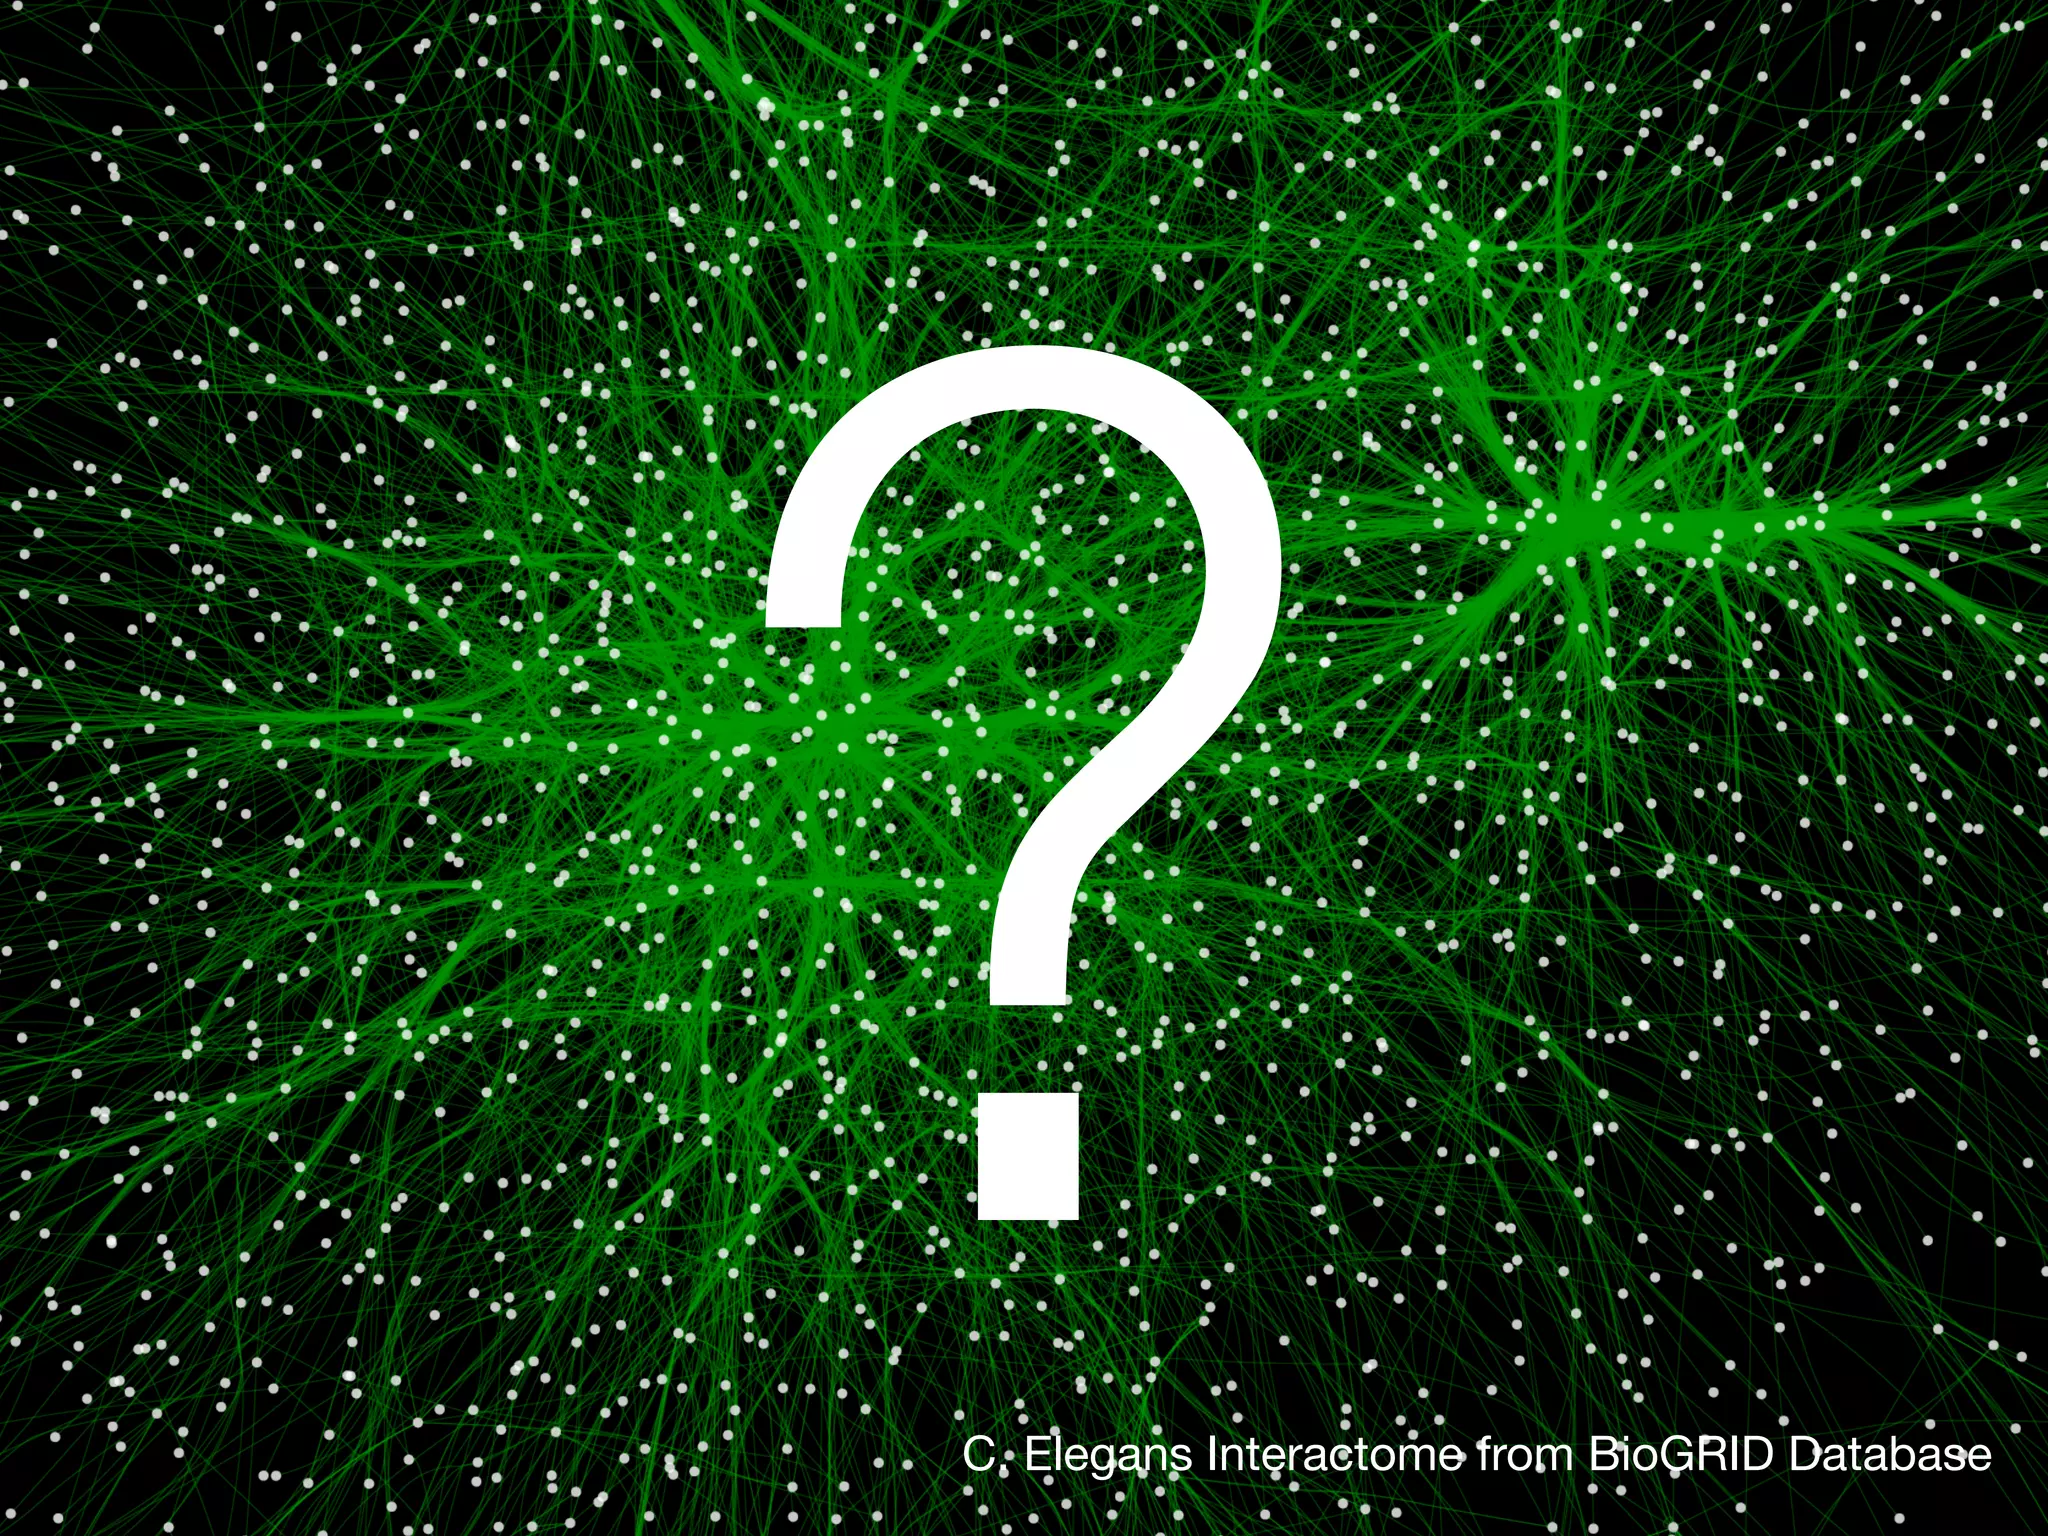
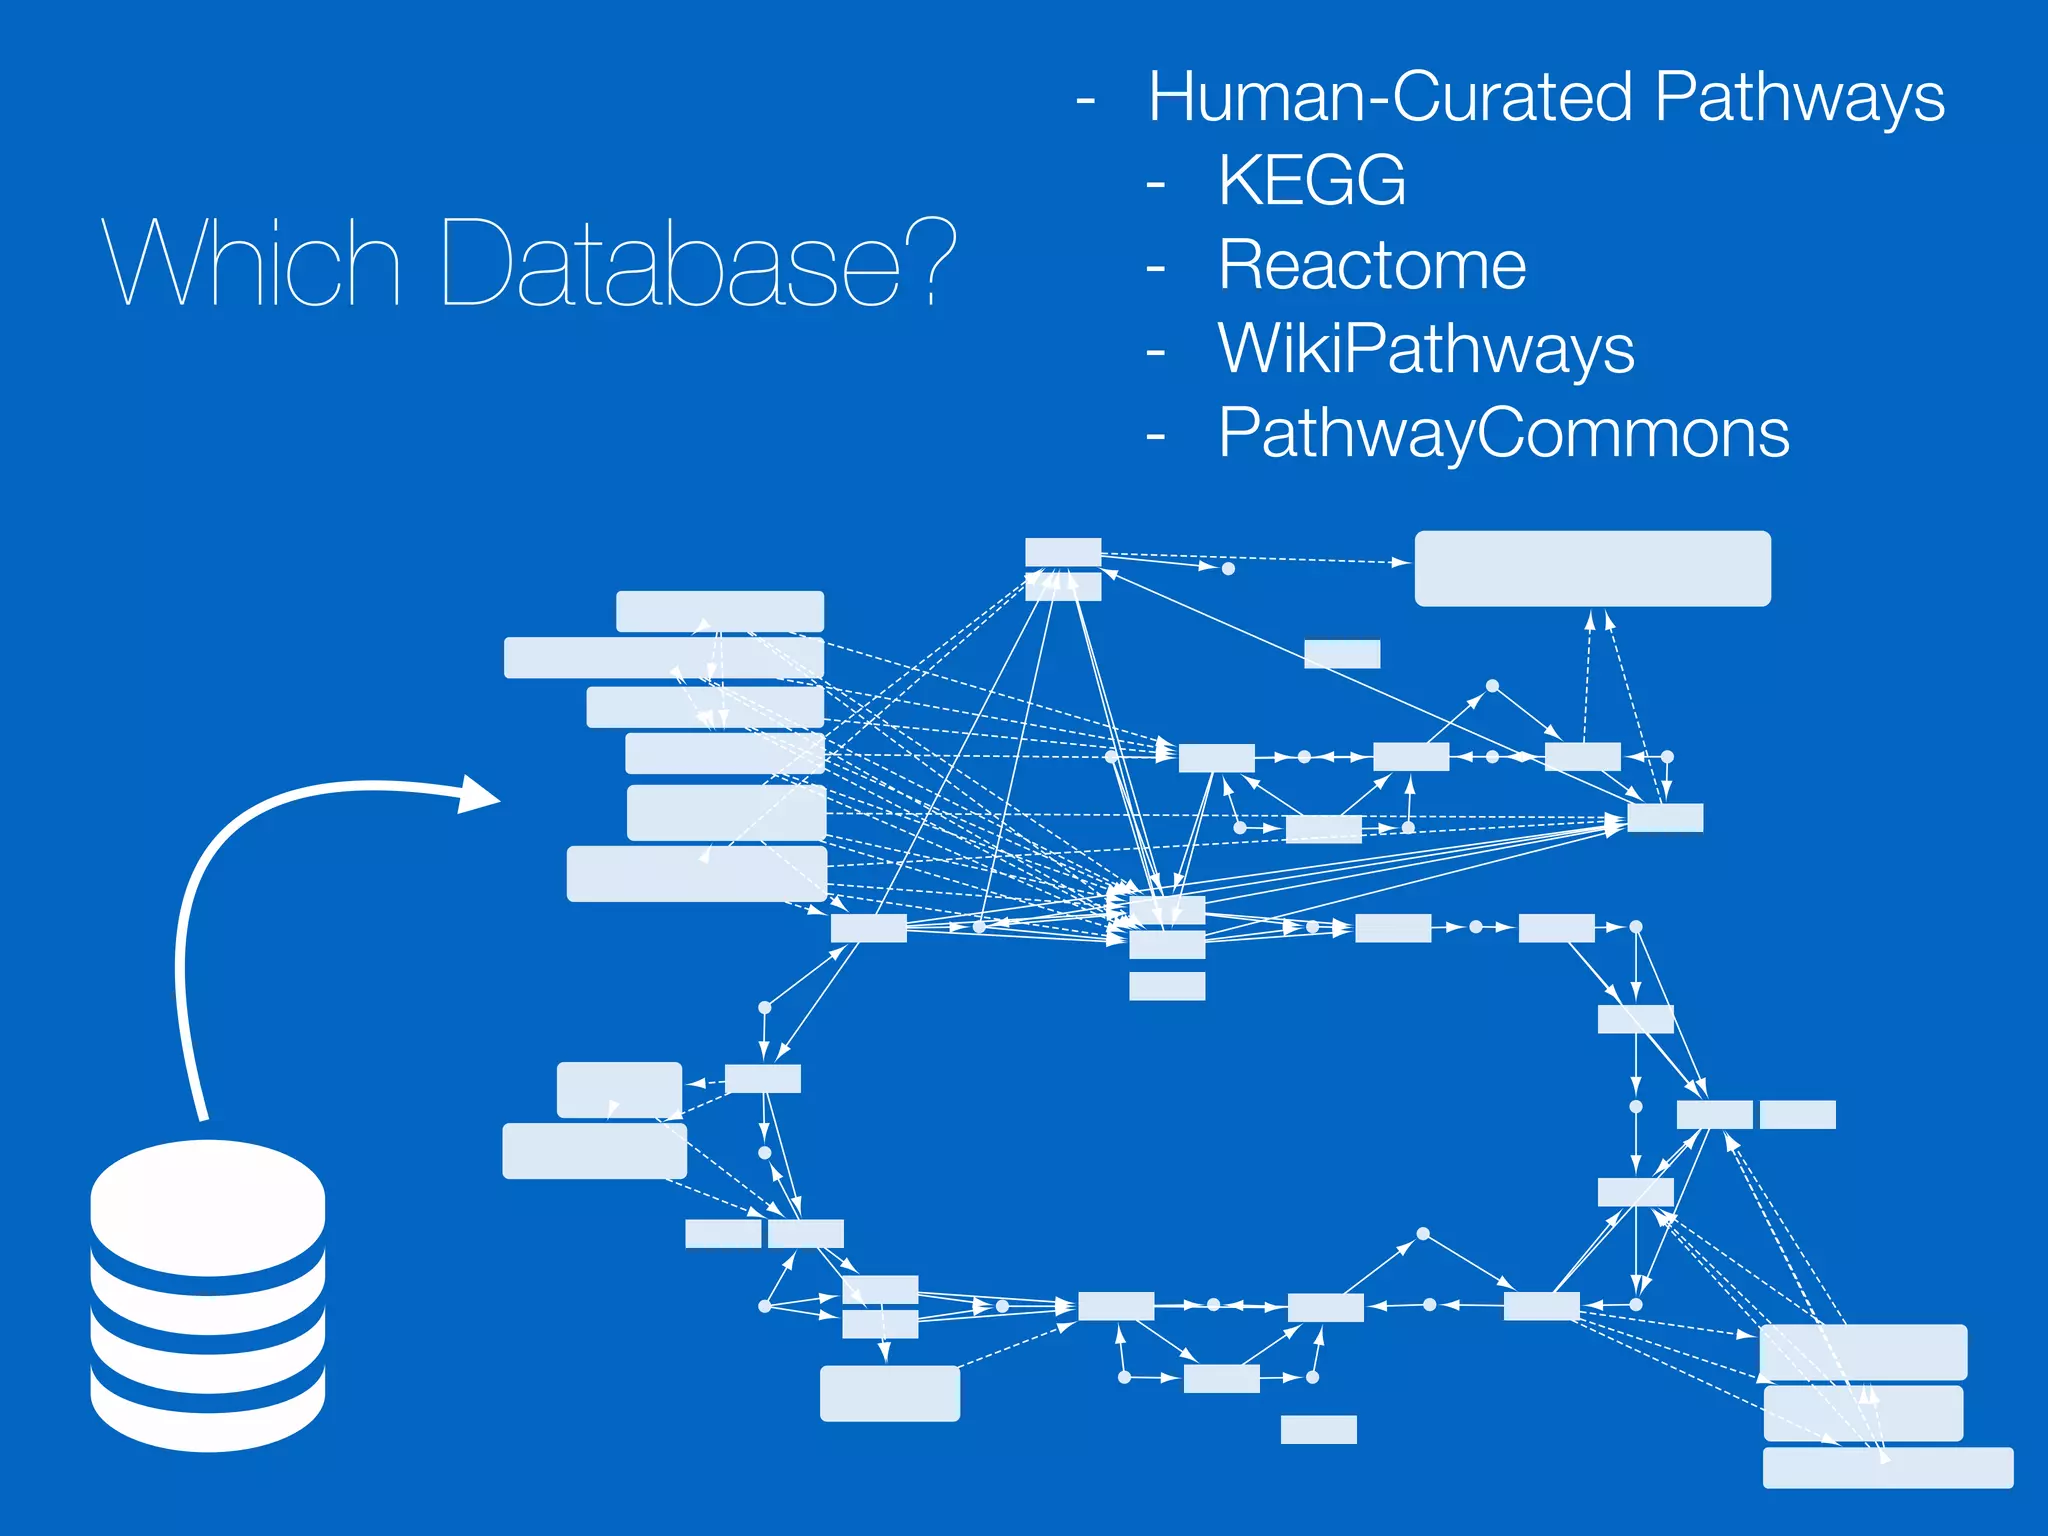
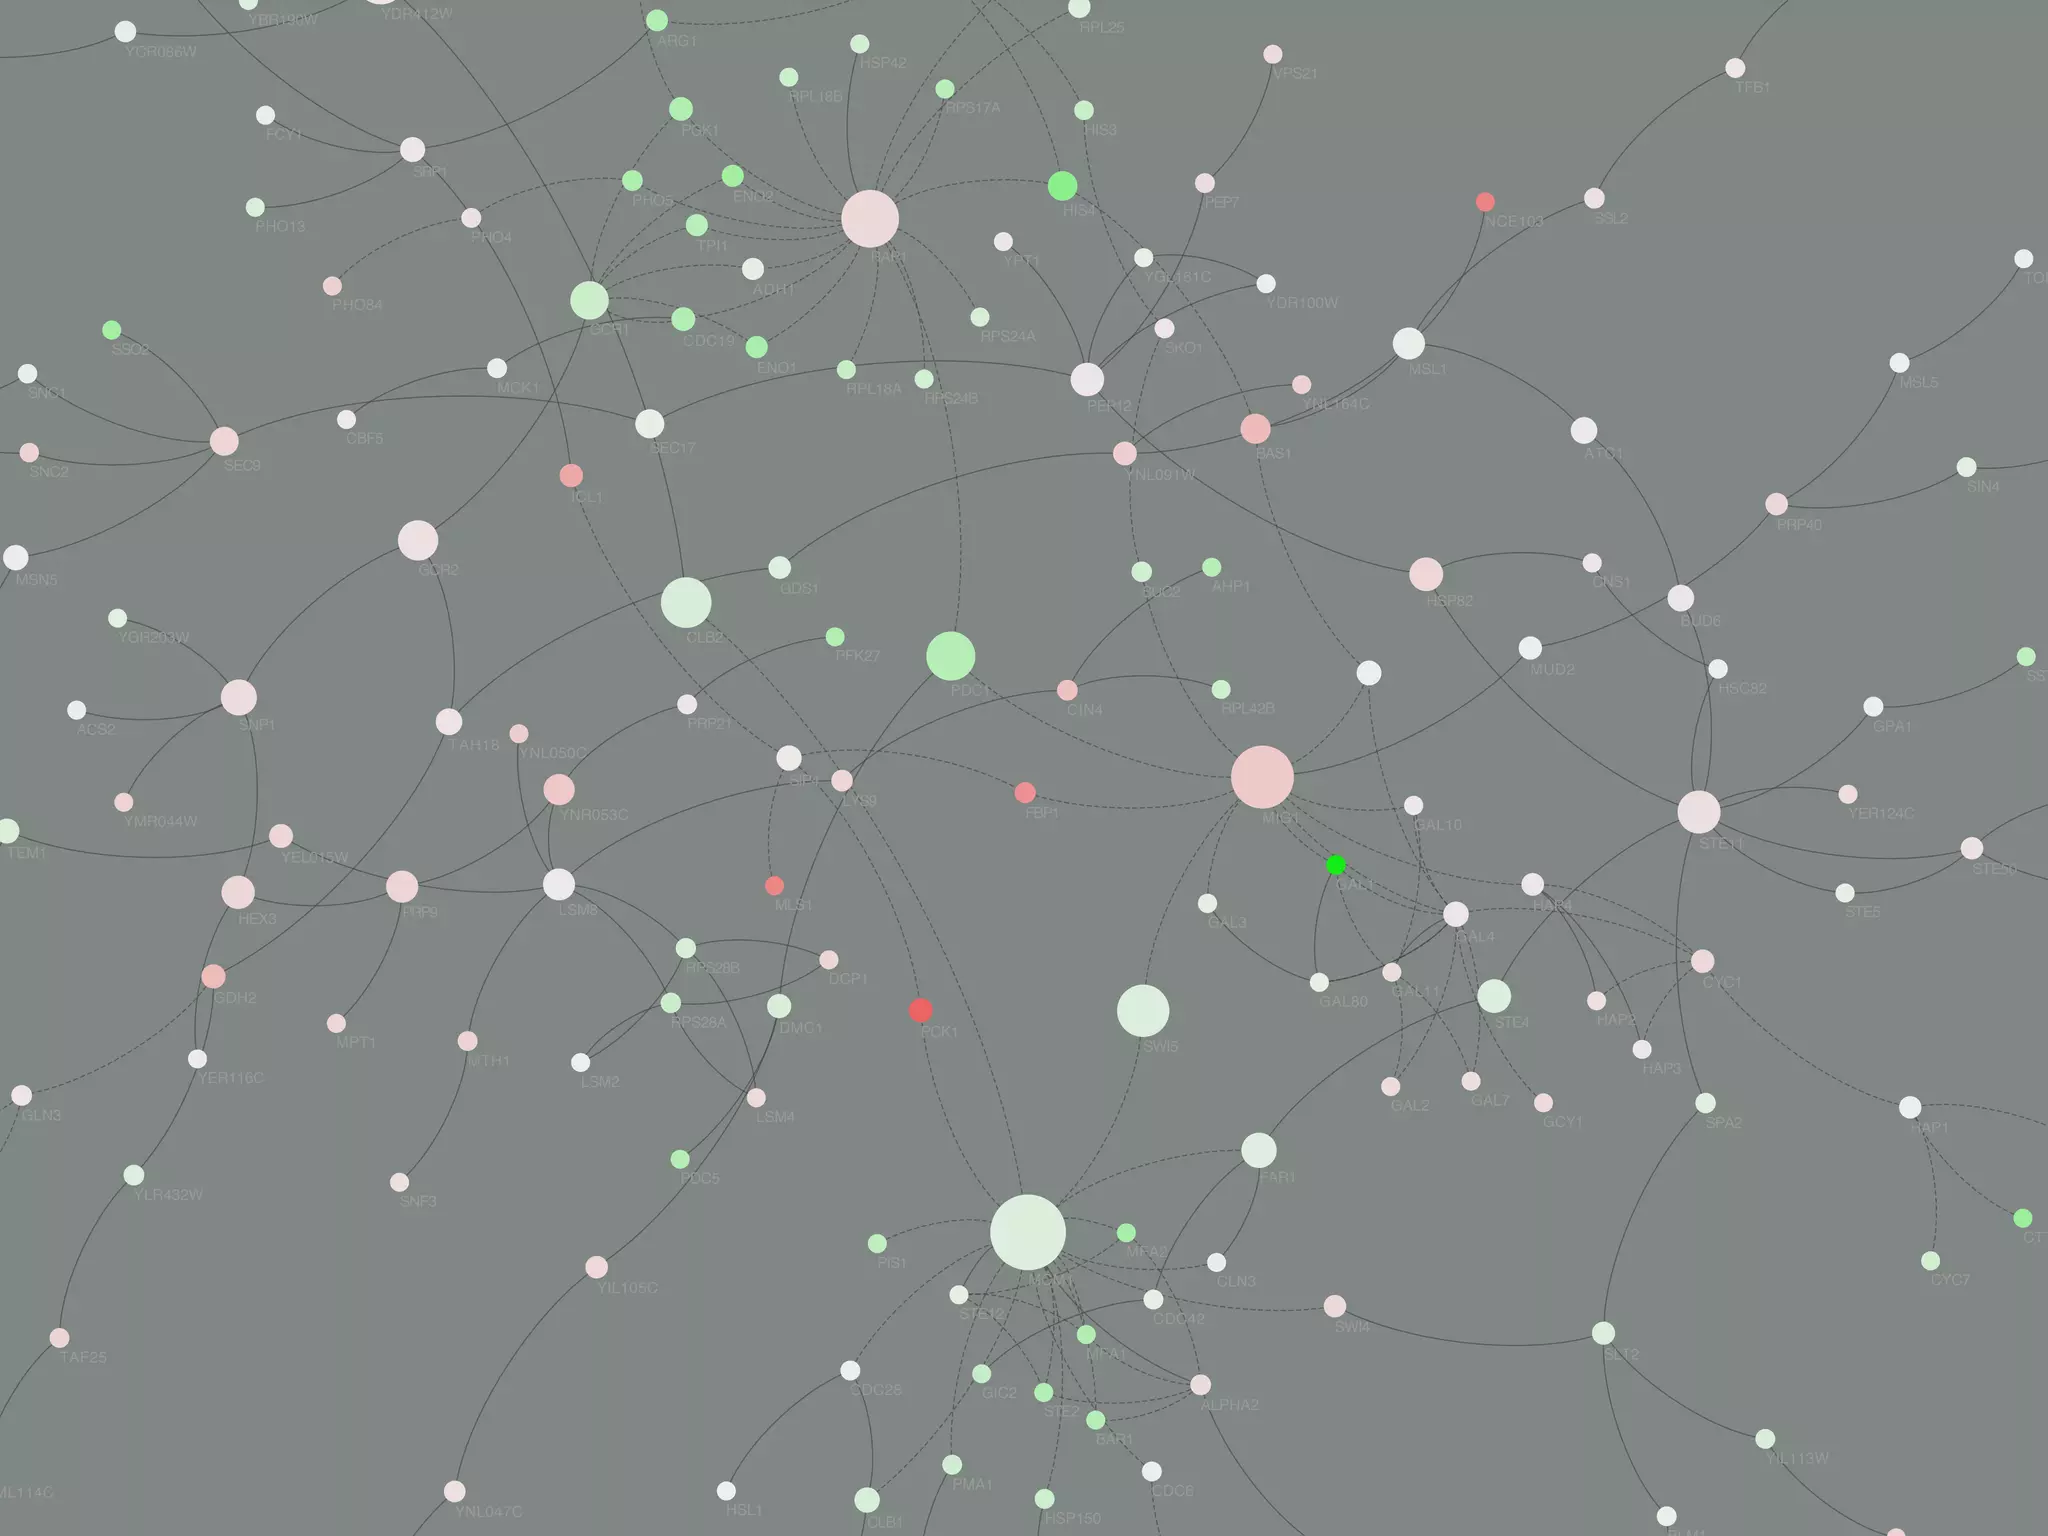
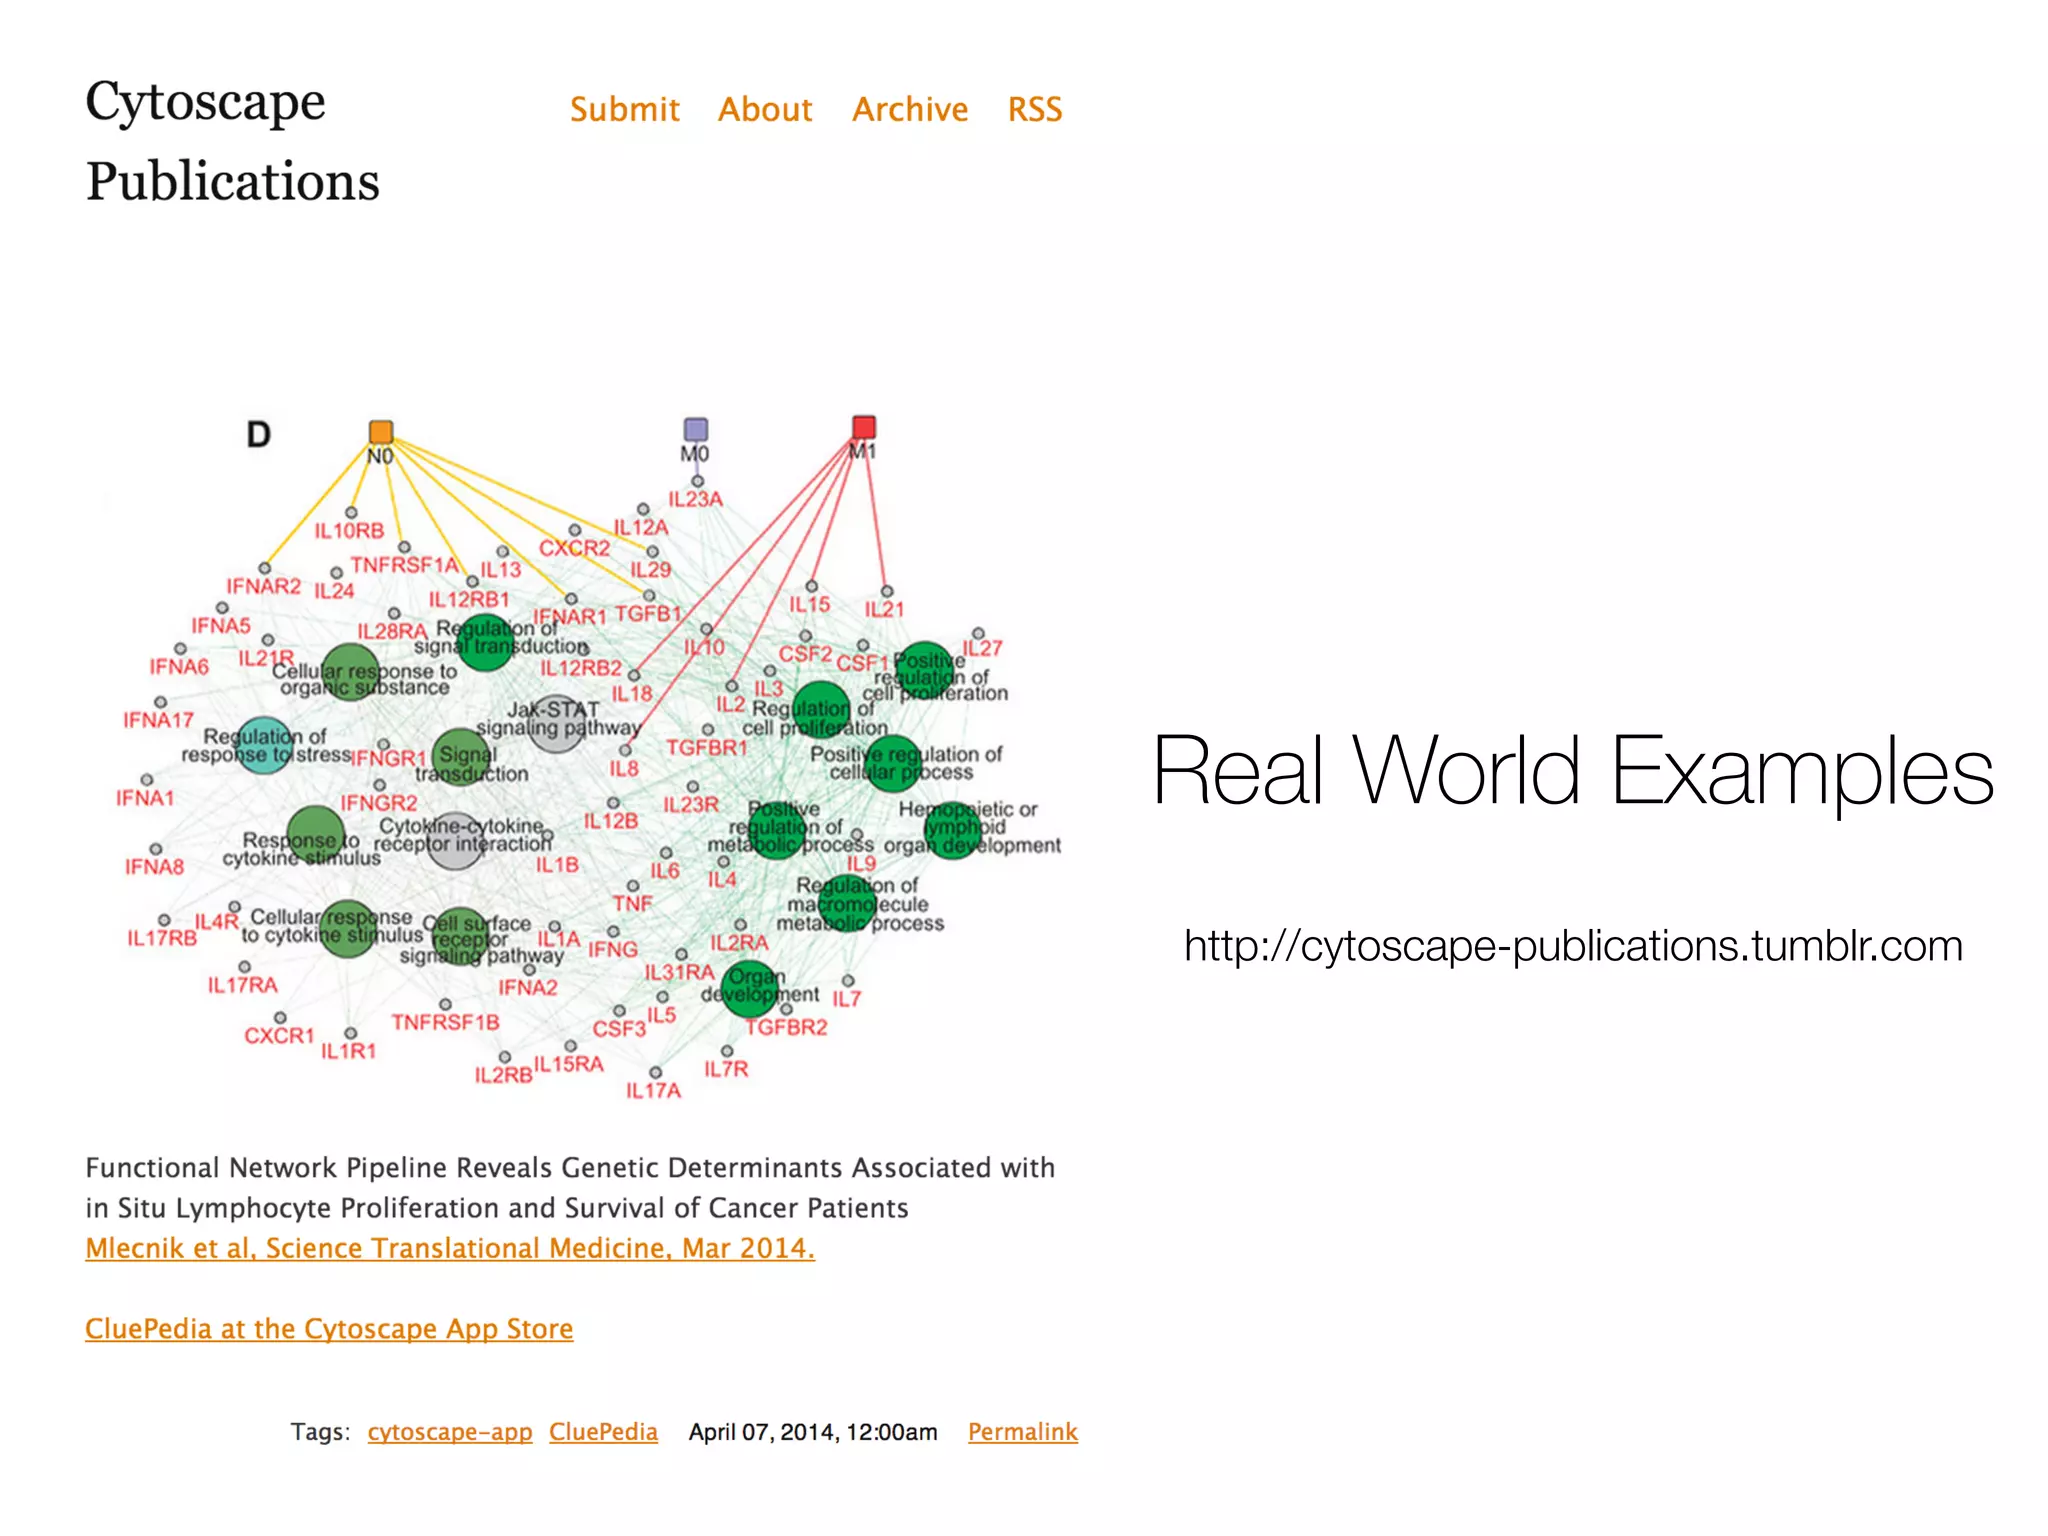
Defines networks in biology using nodes and edges, detailing various biological interactions including protein-protein and biochemical reactions. Illustrates undirected and directed networks with examples including KEGG pathways, showing how Cytoscape visualizes complex biological relationships.
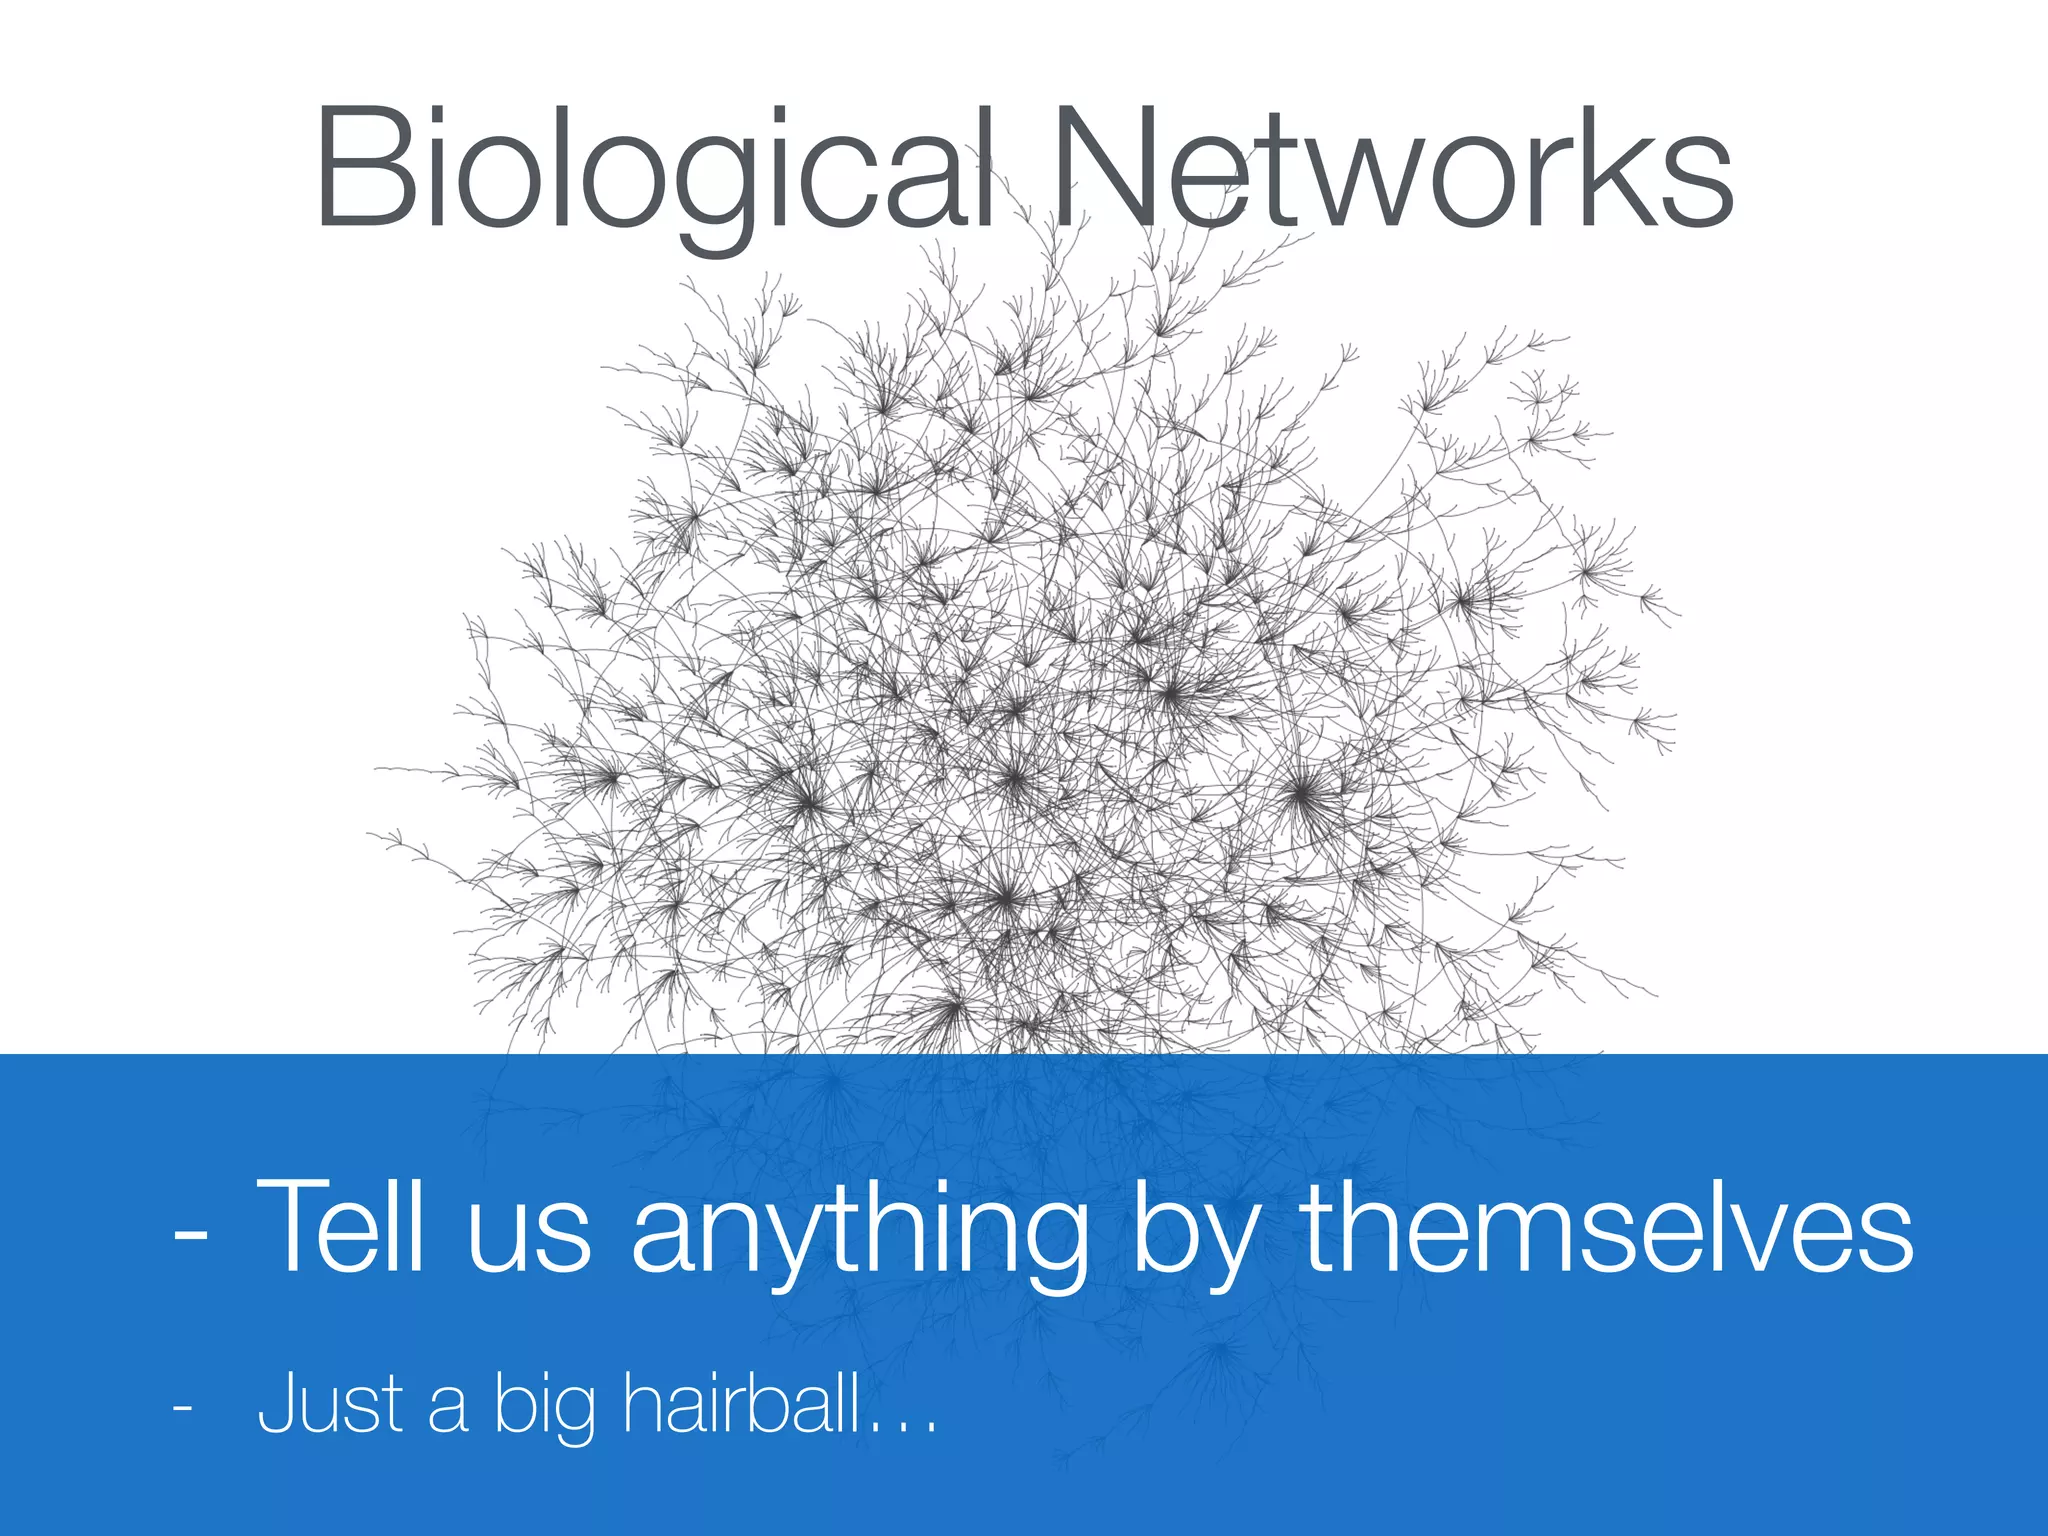
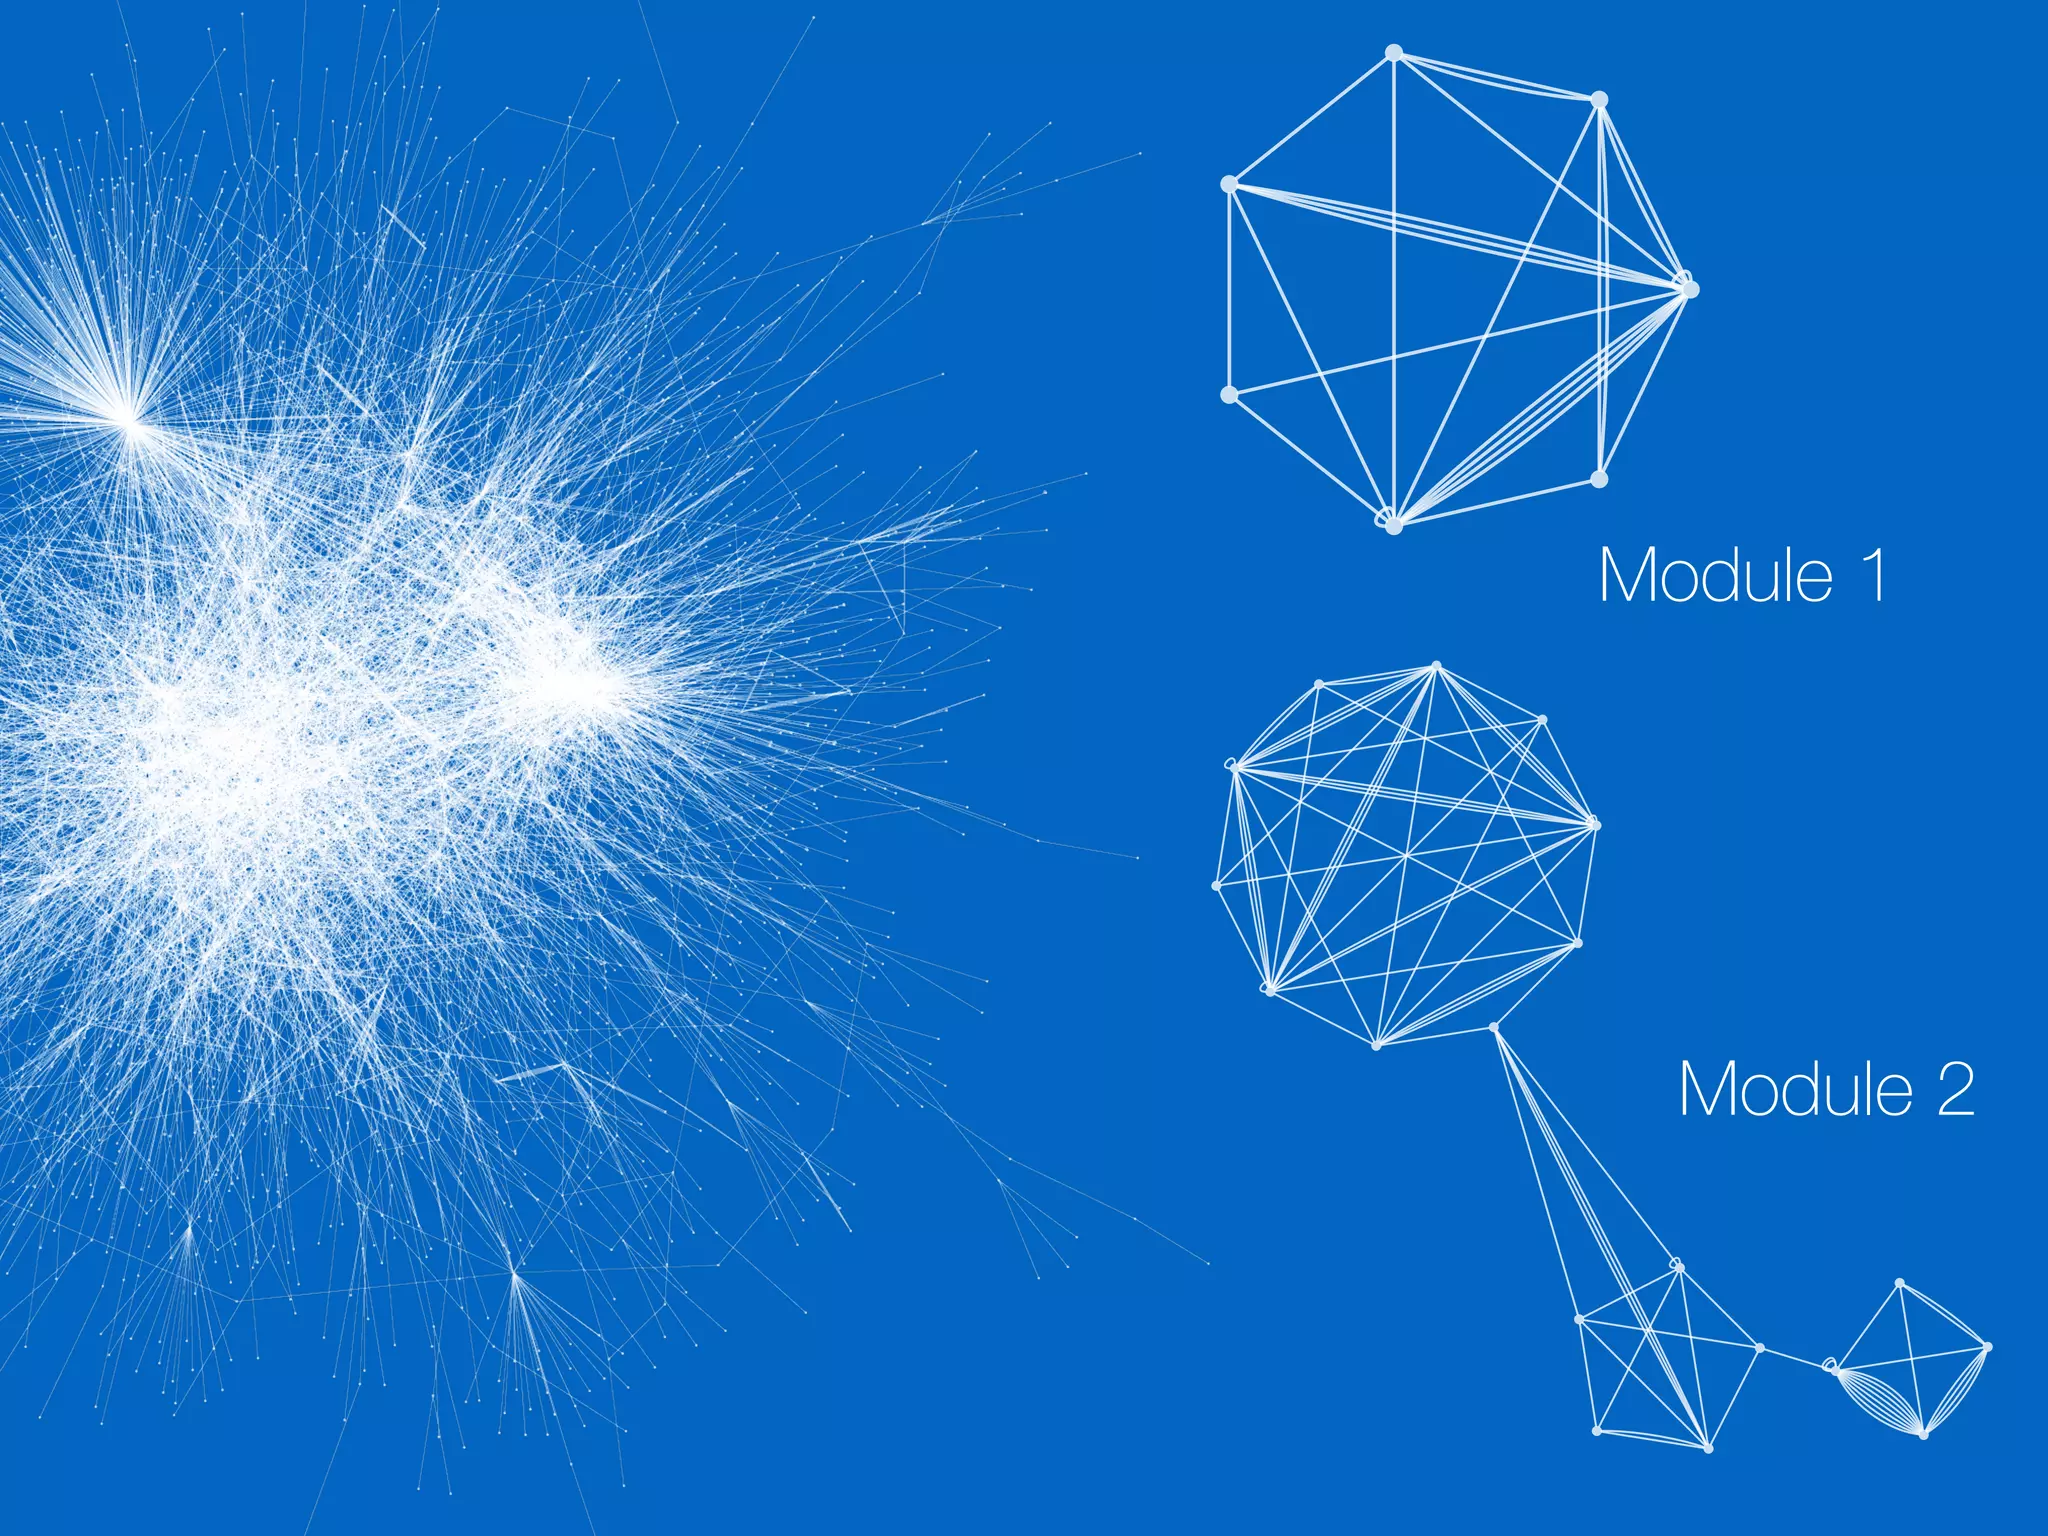
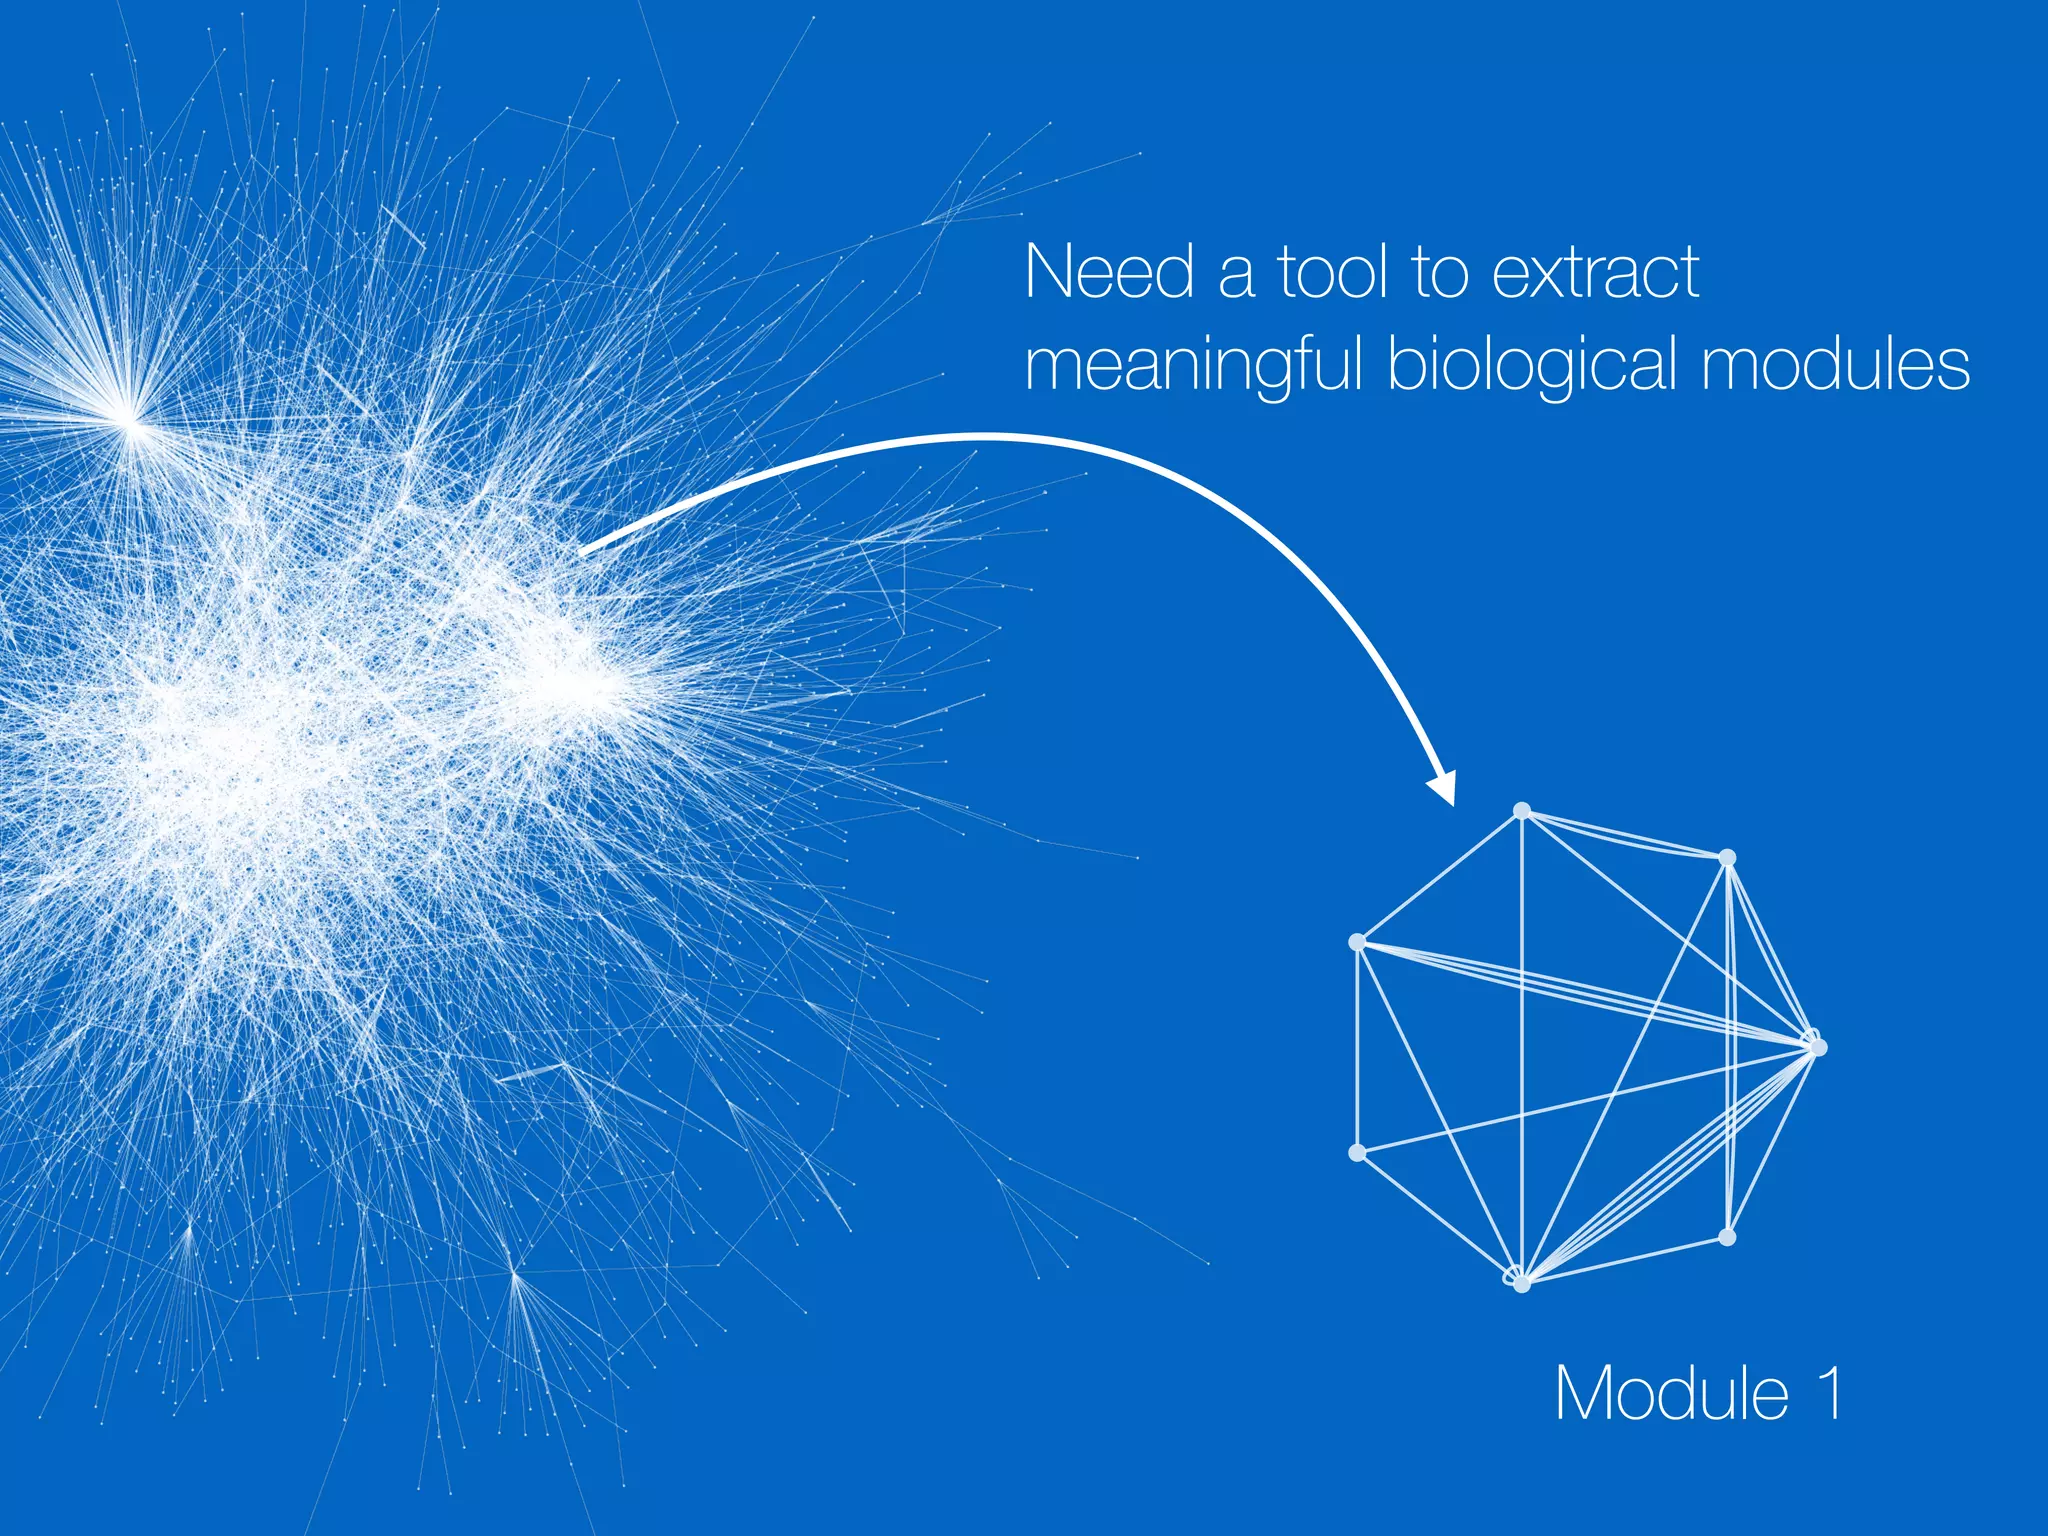
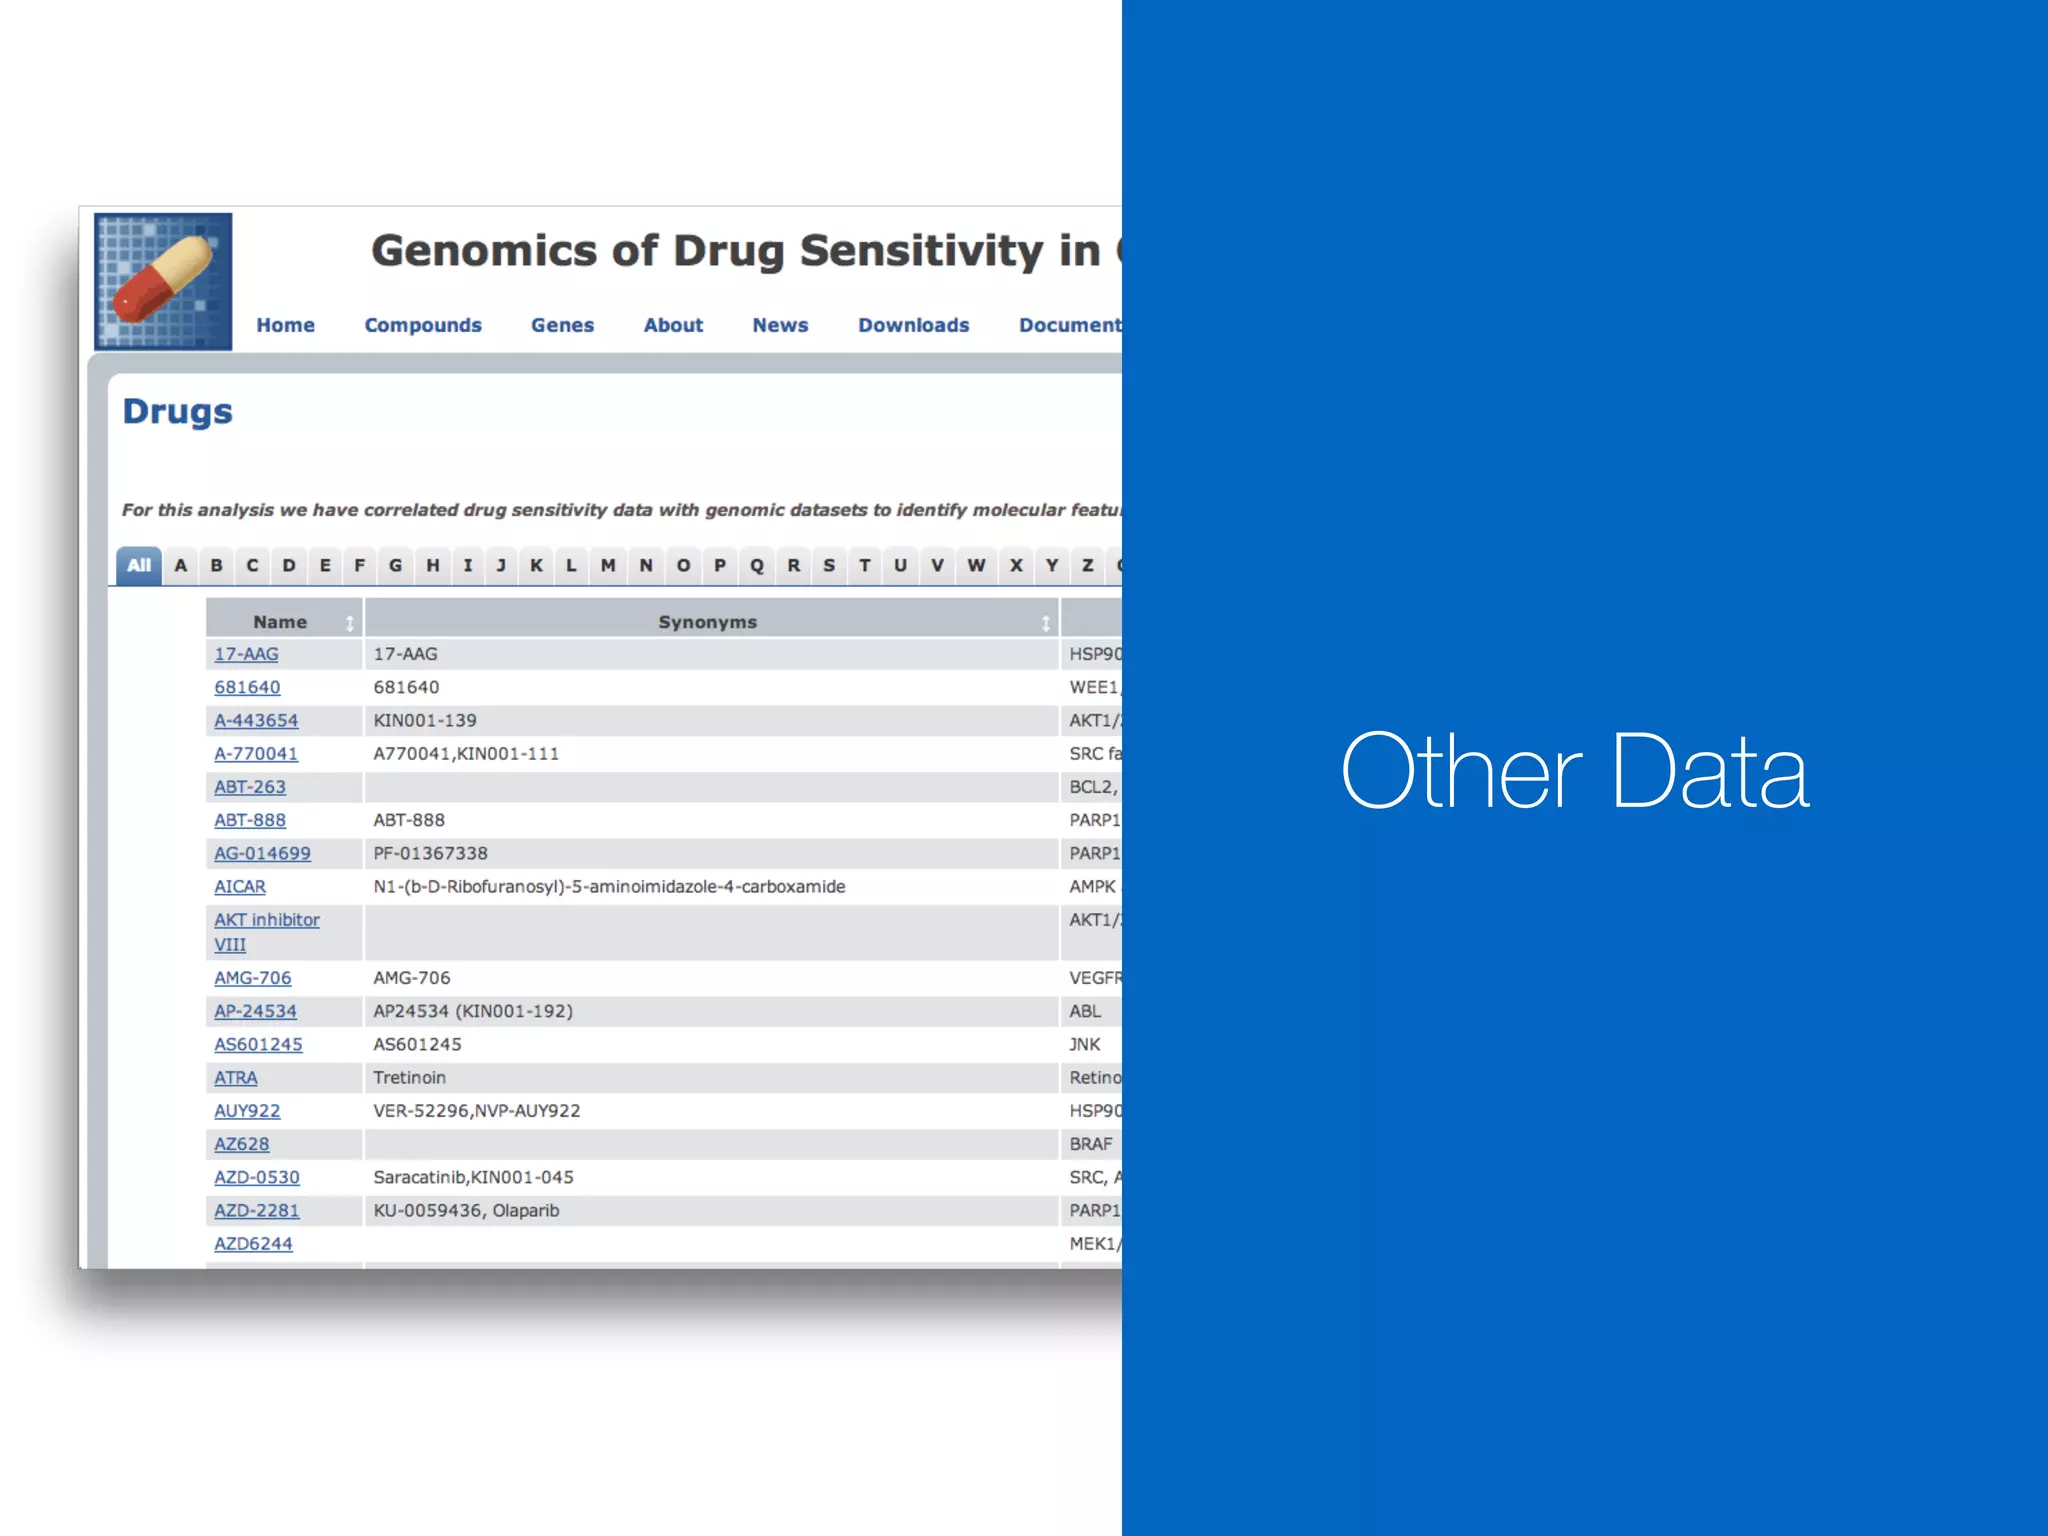
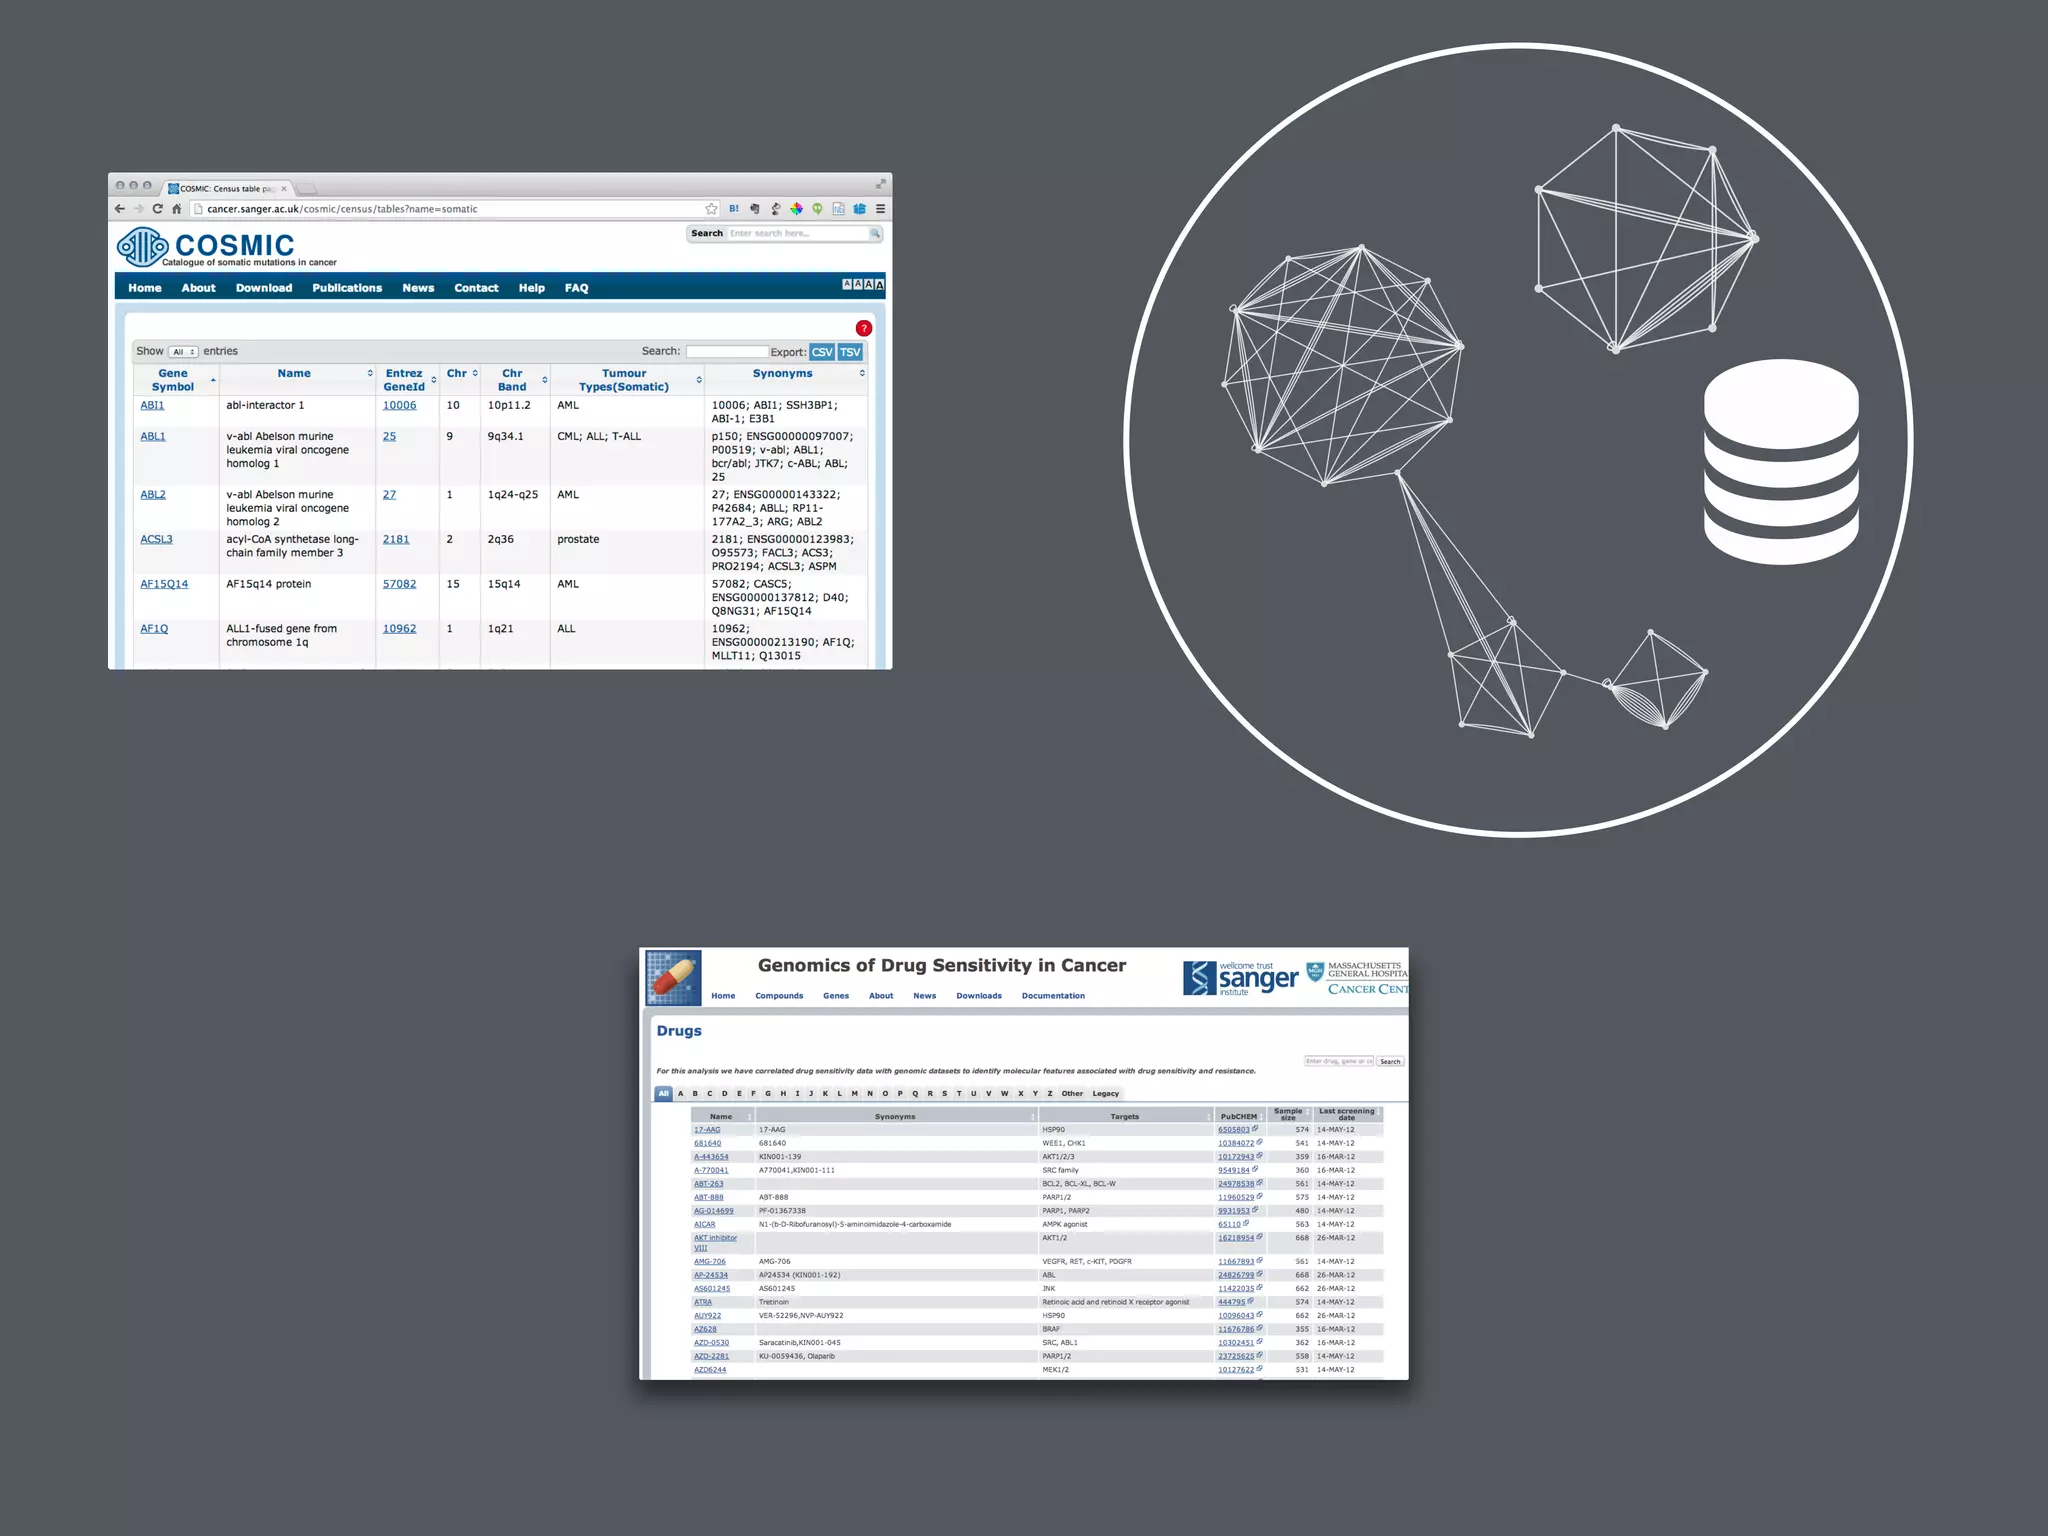
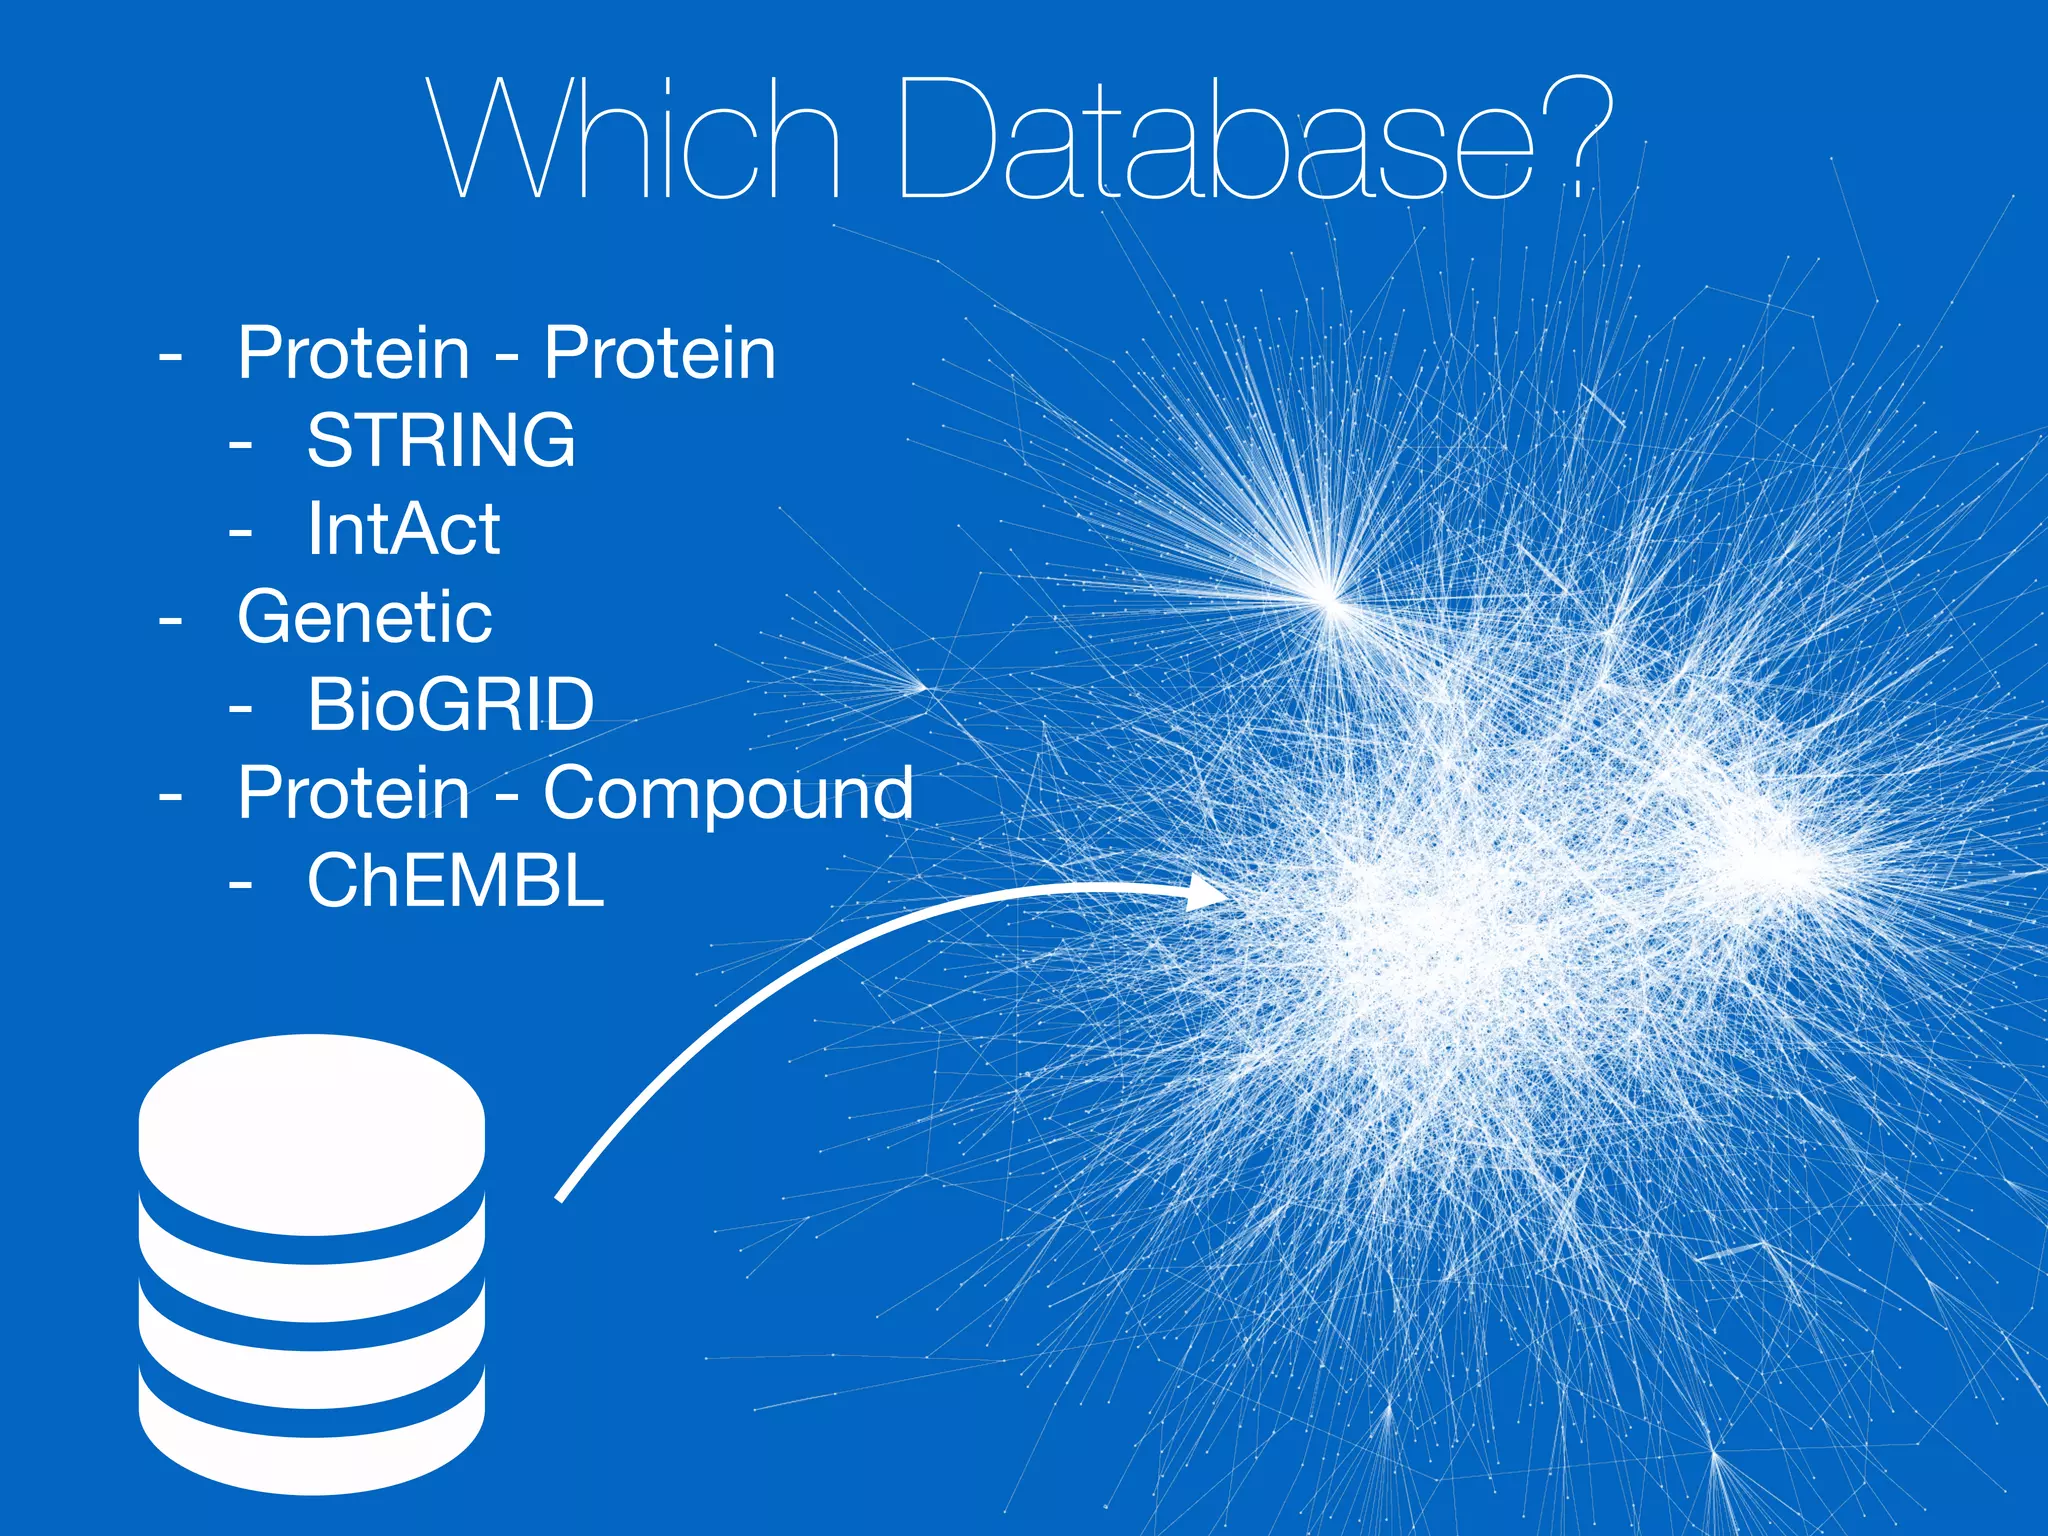
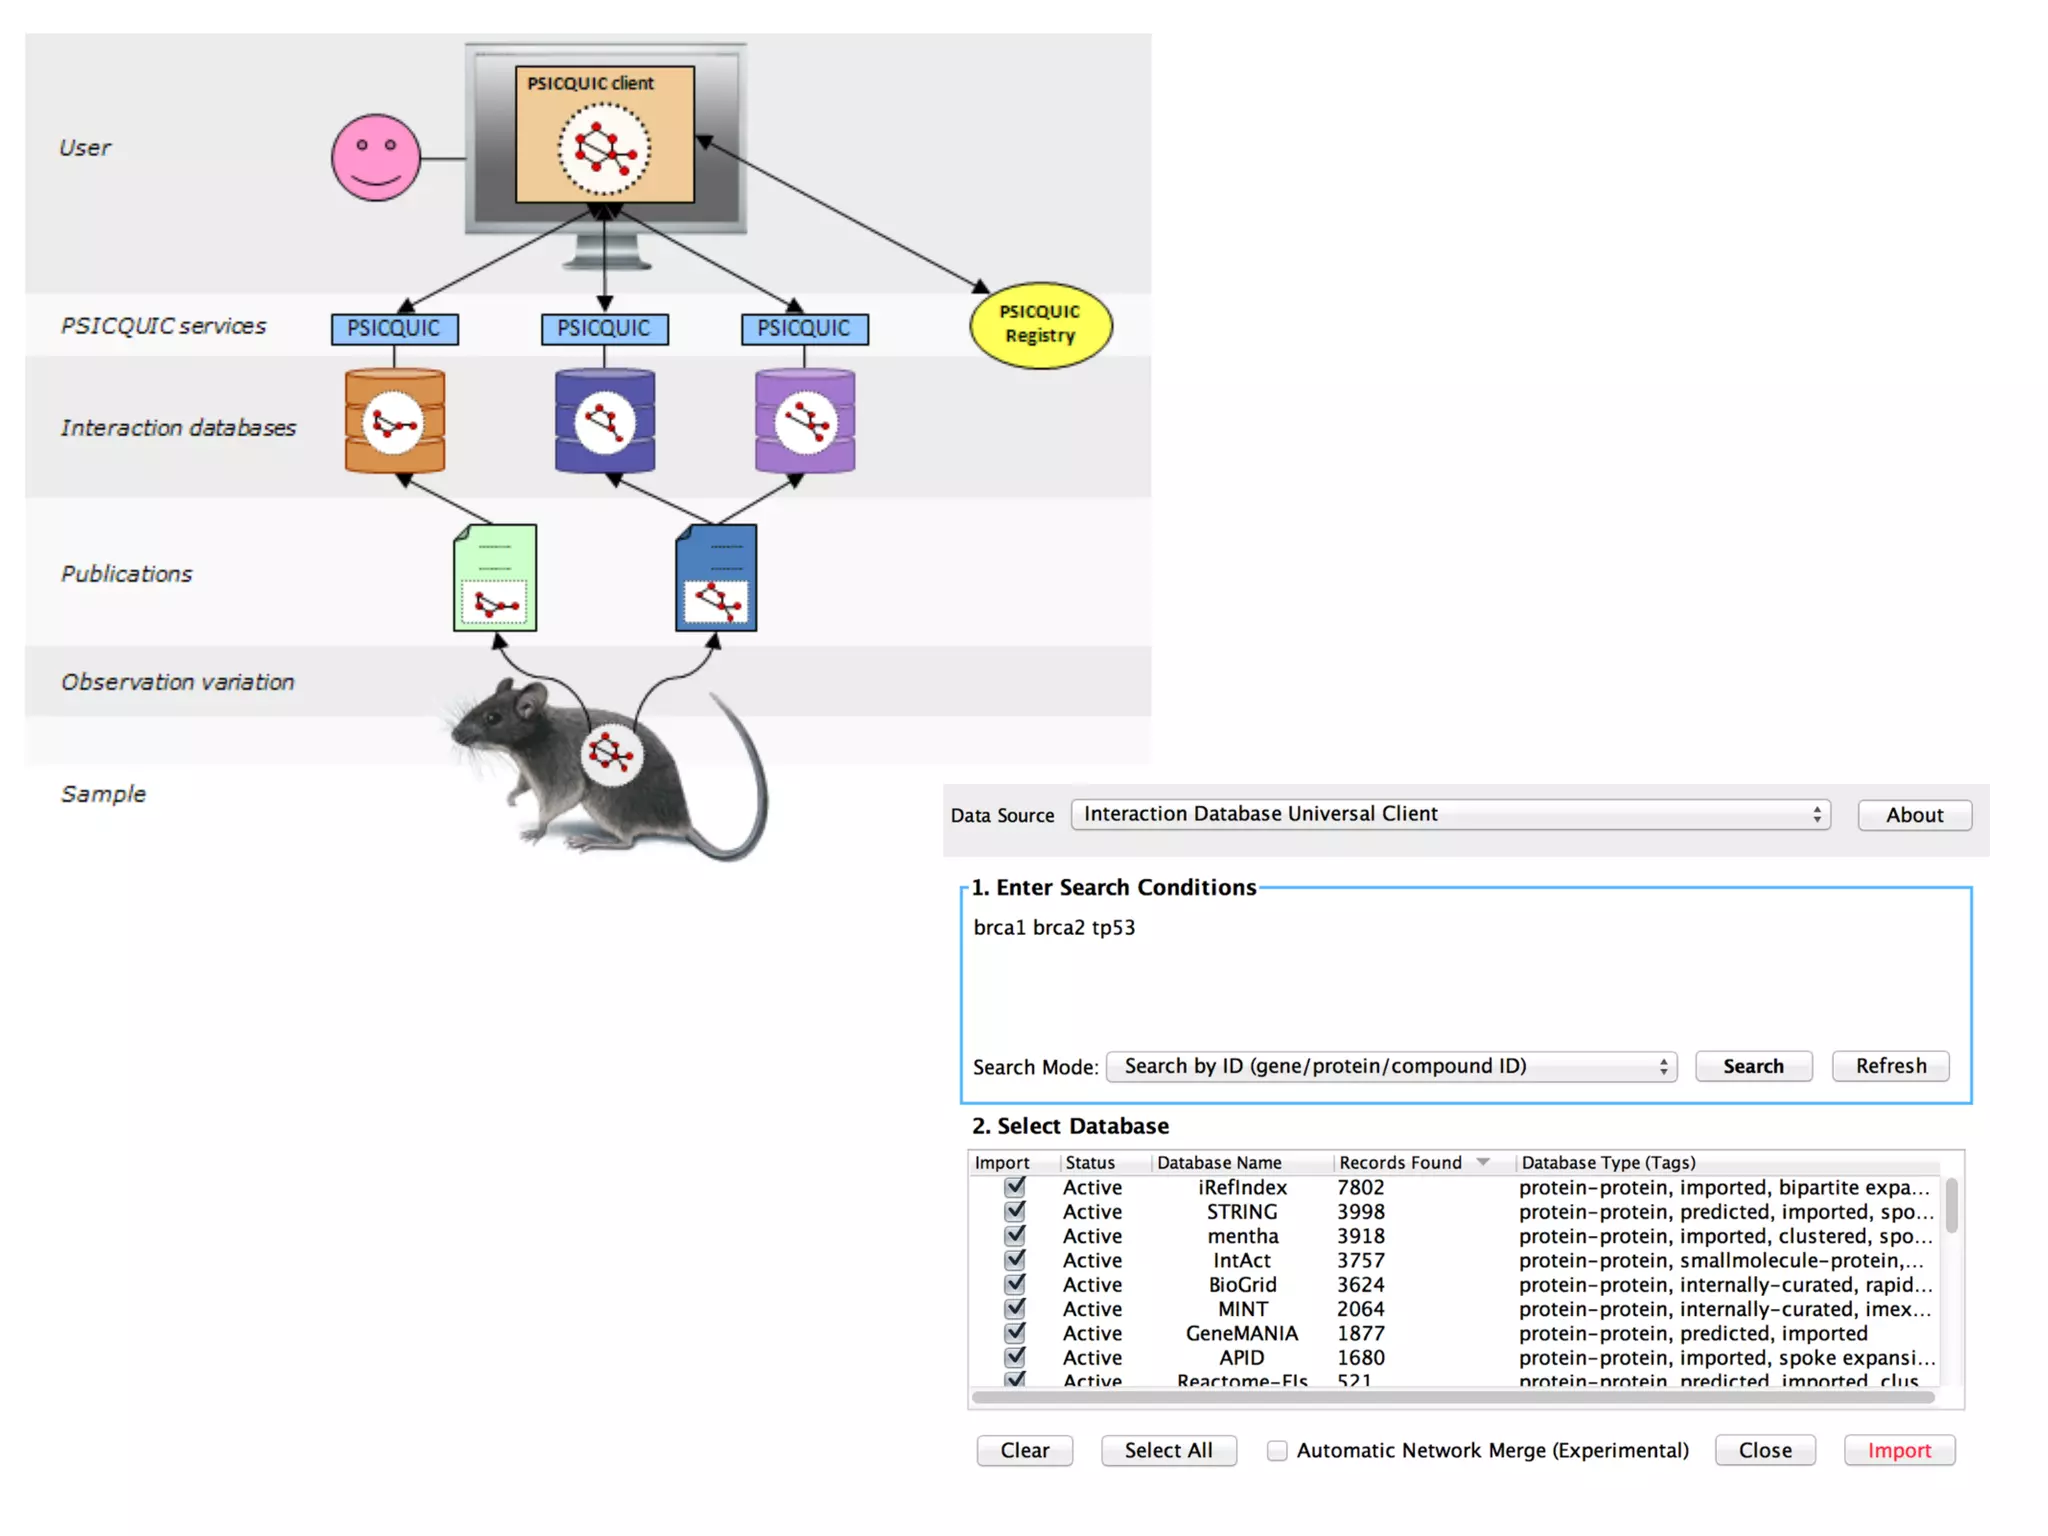
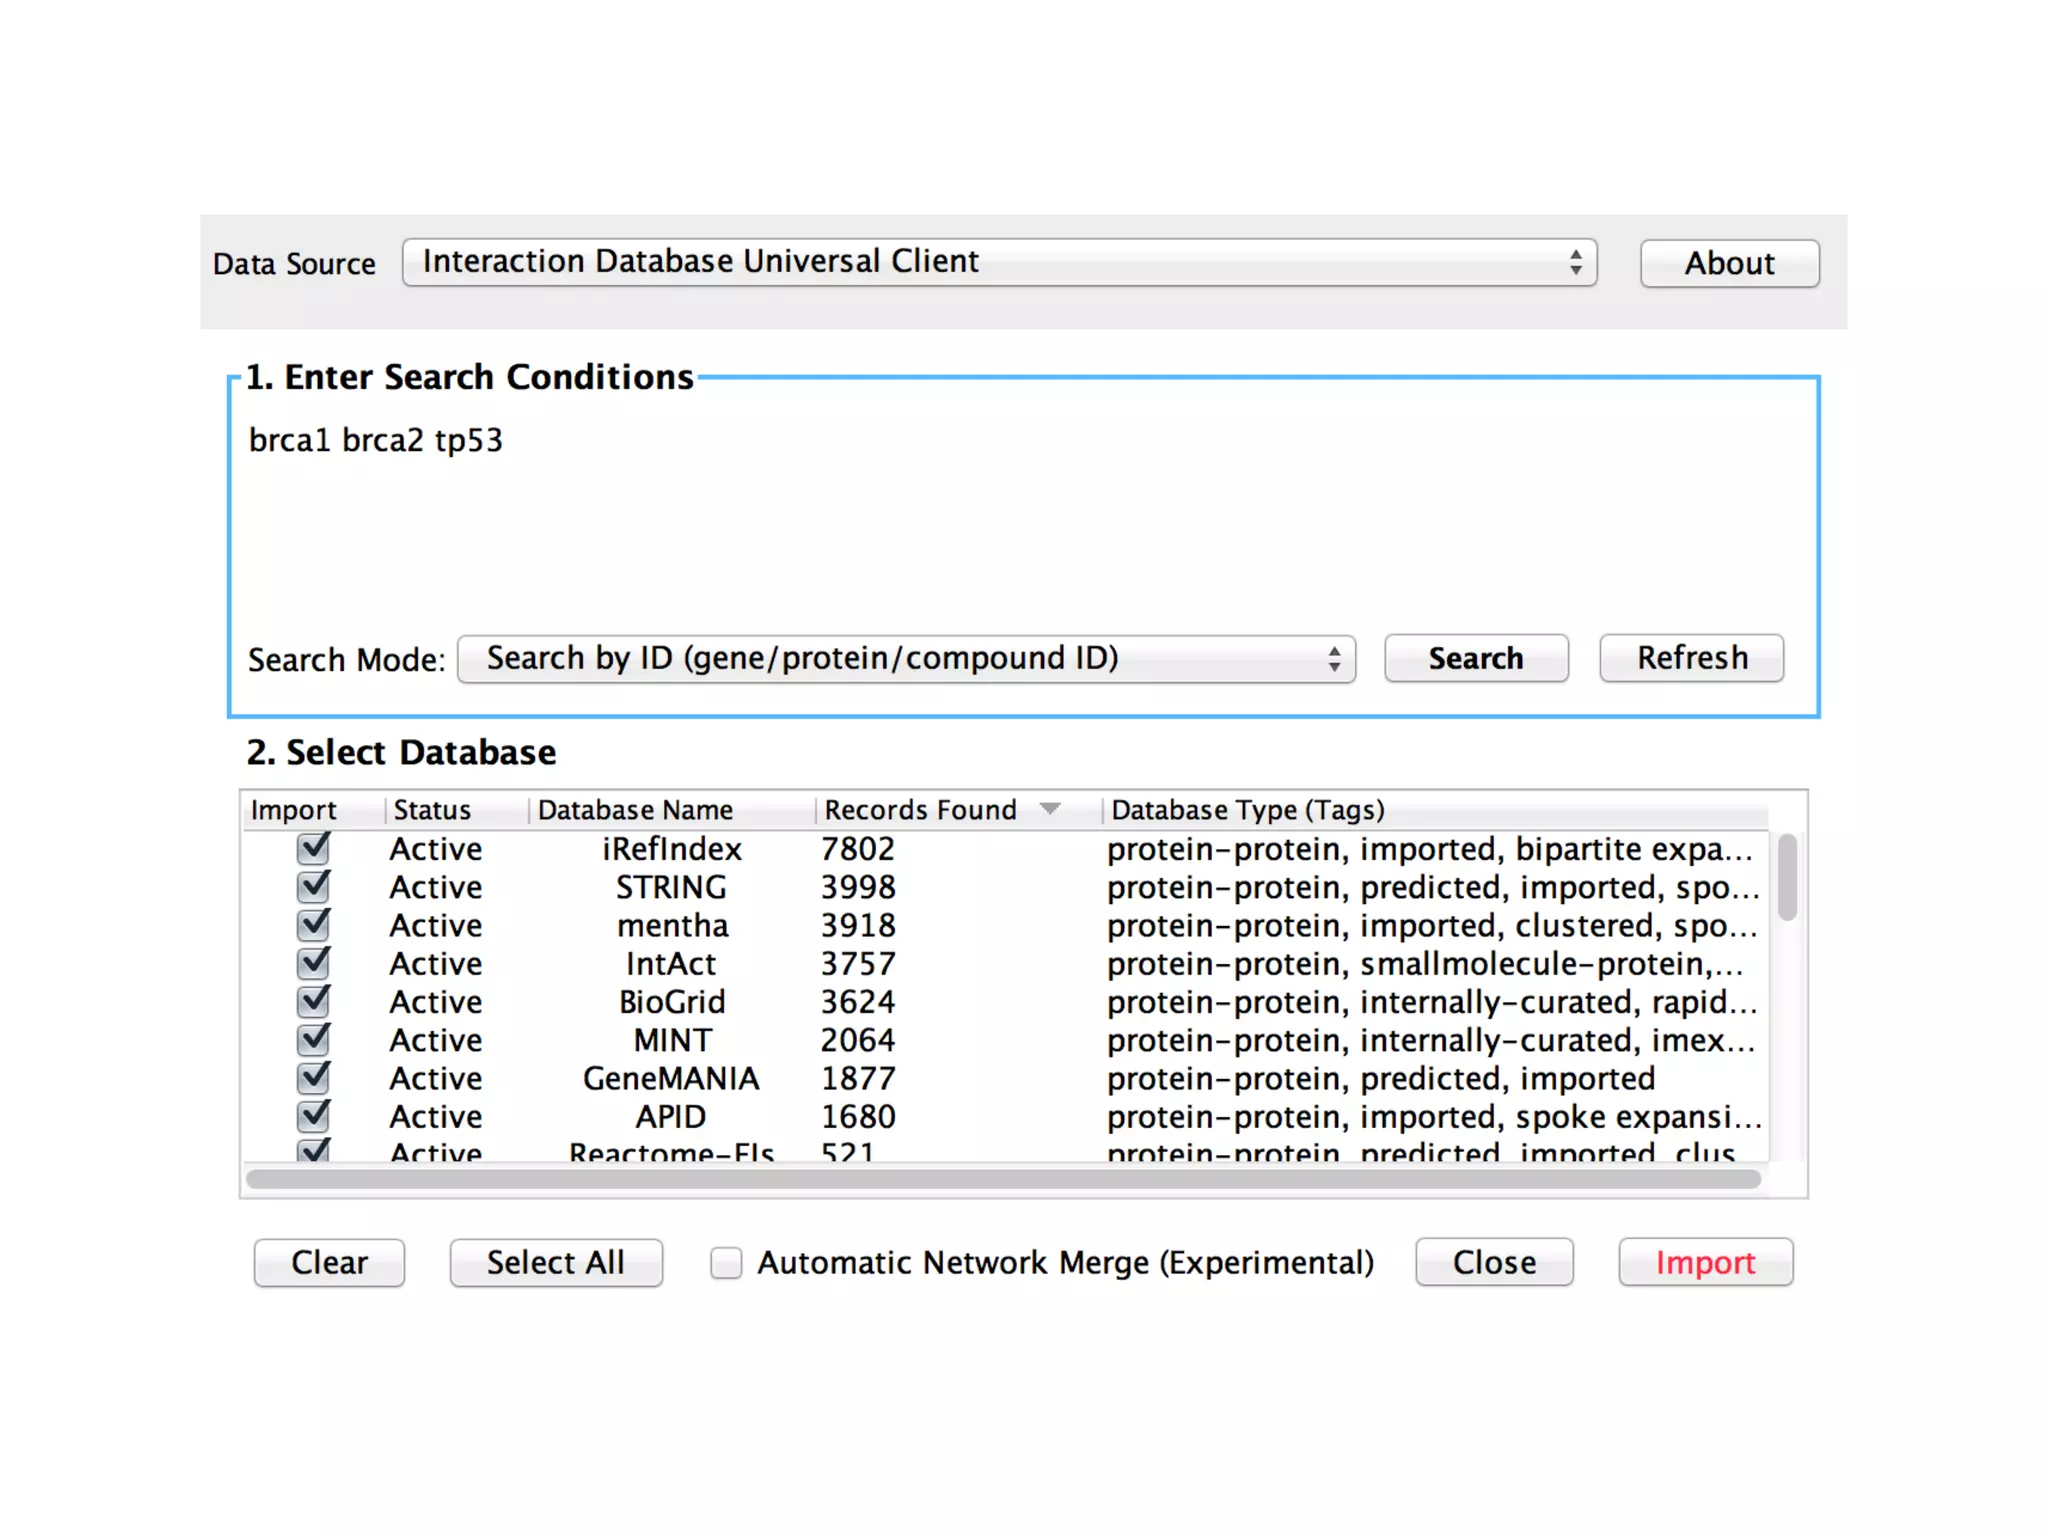
Explains the need for tools to extract biological modules and use various data interaction databases for analysis.
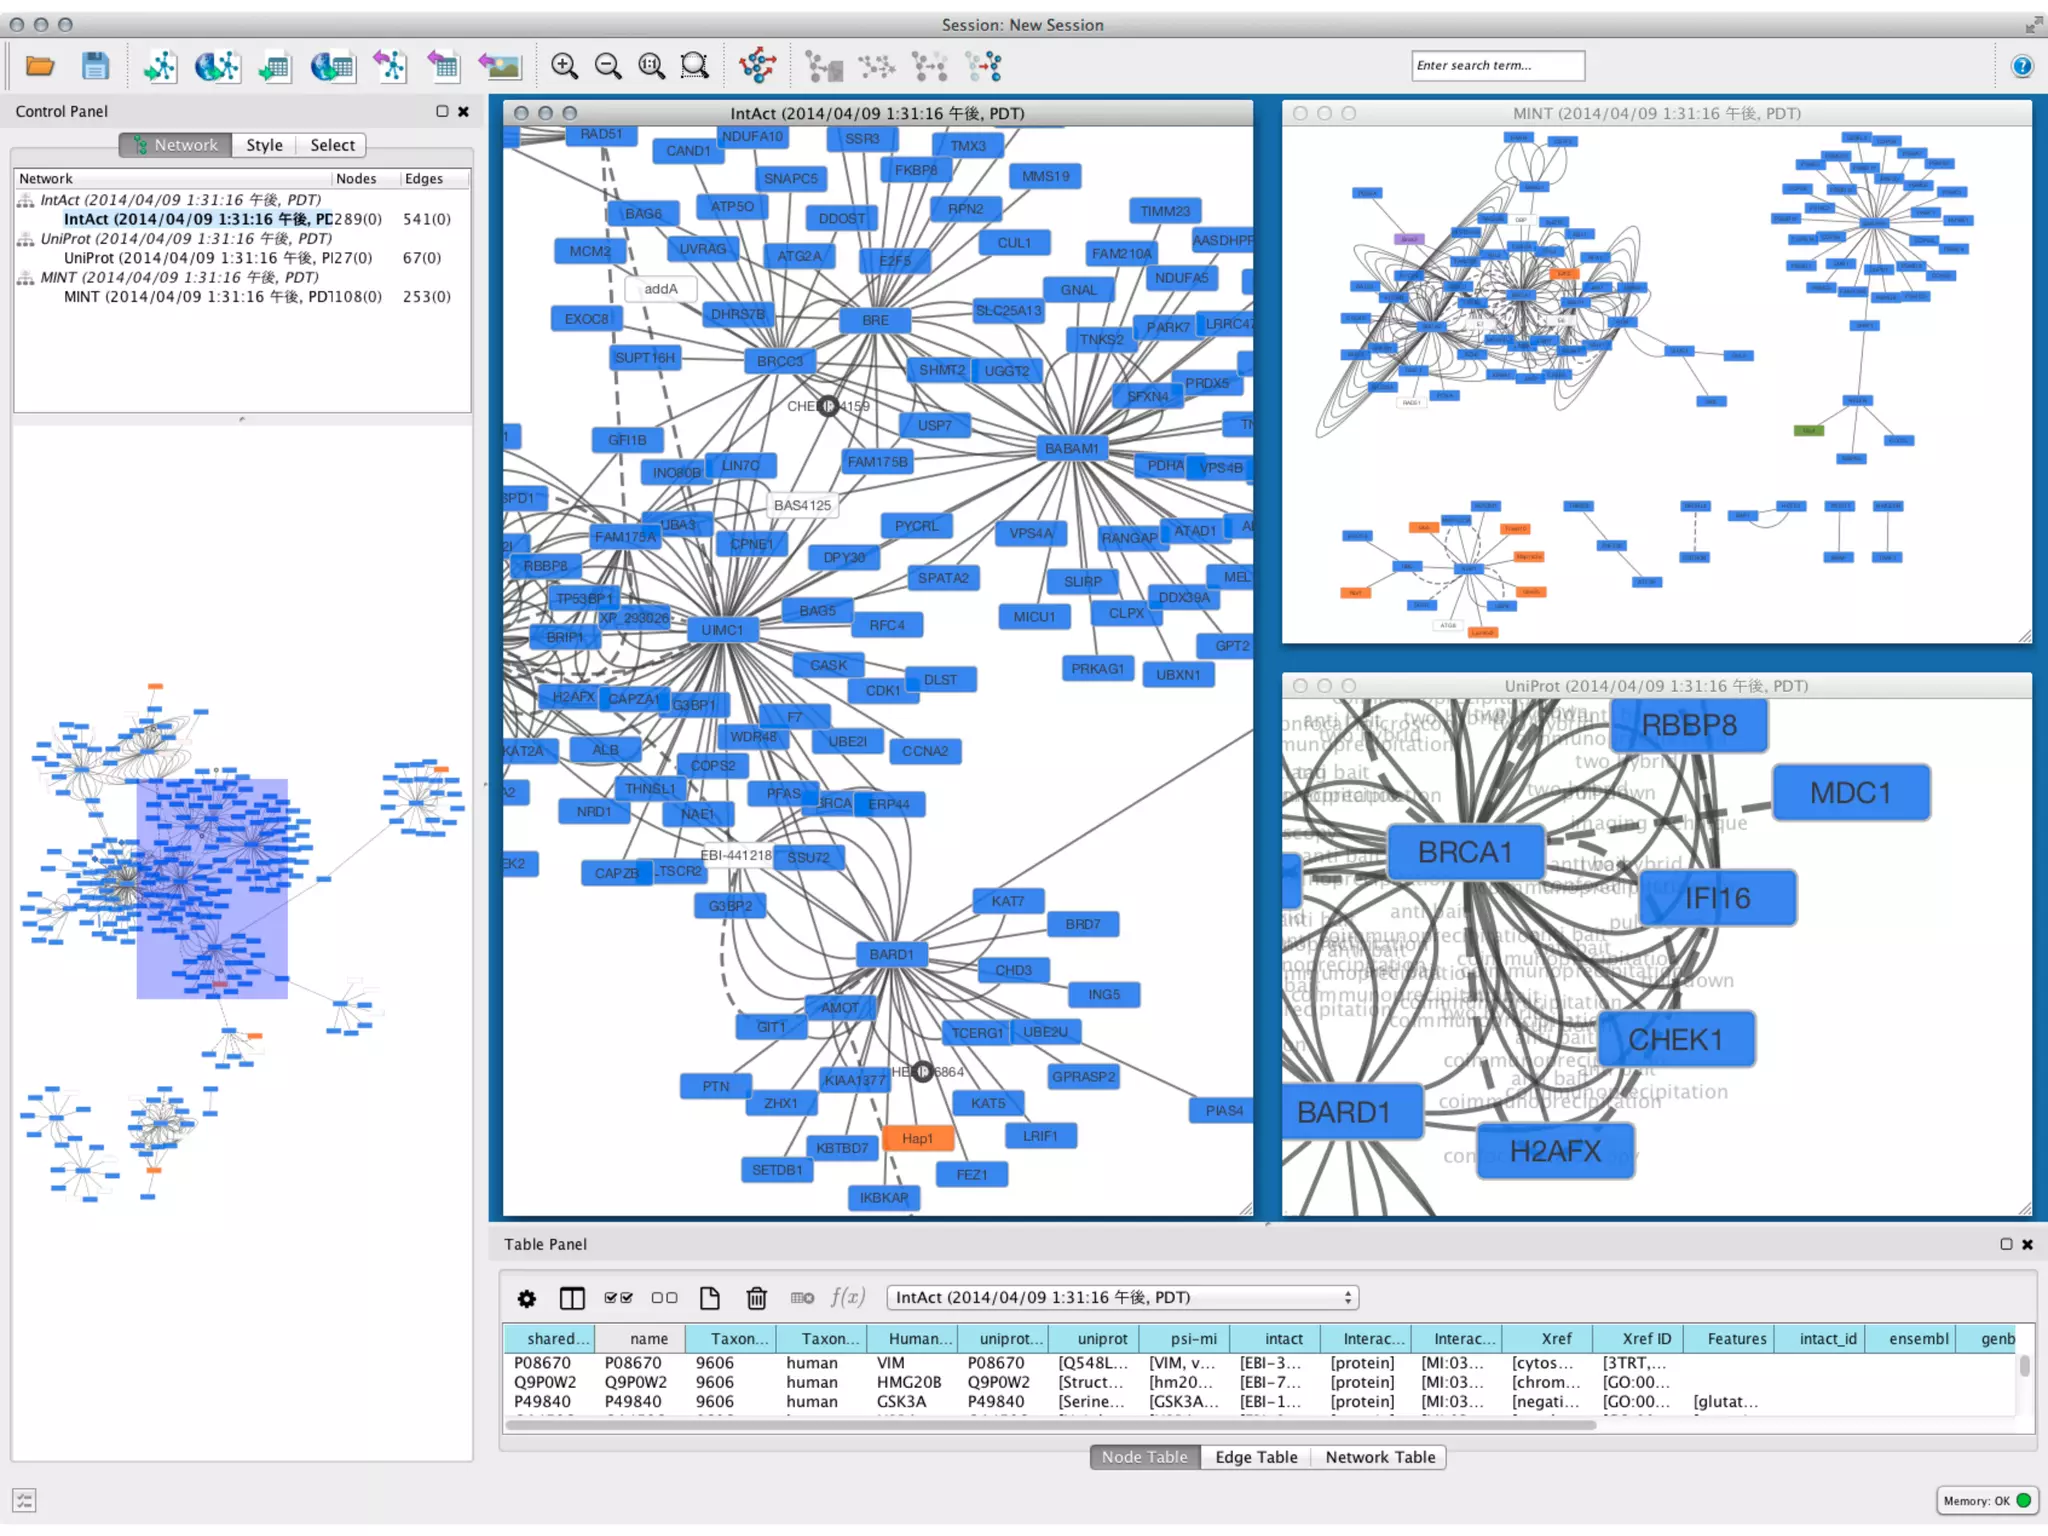
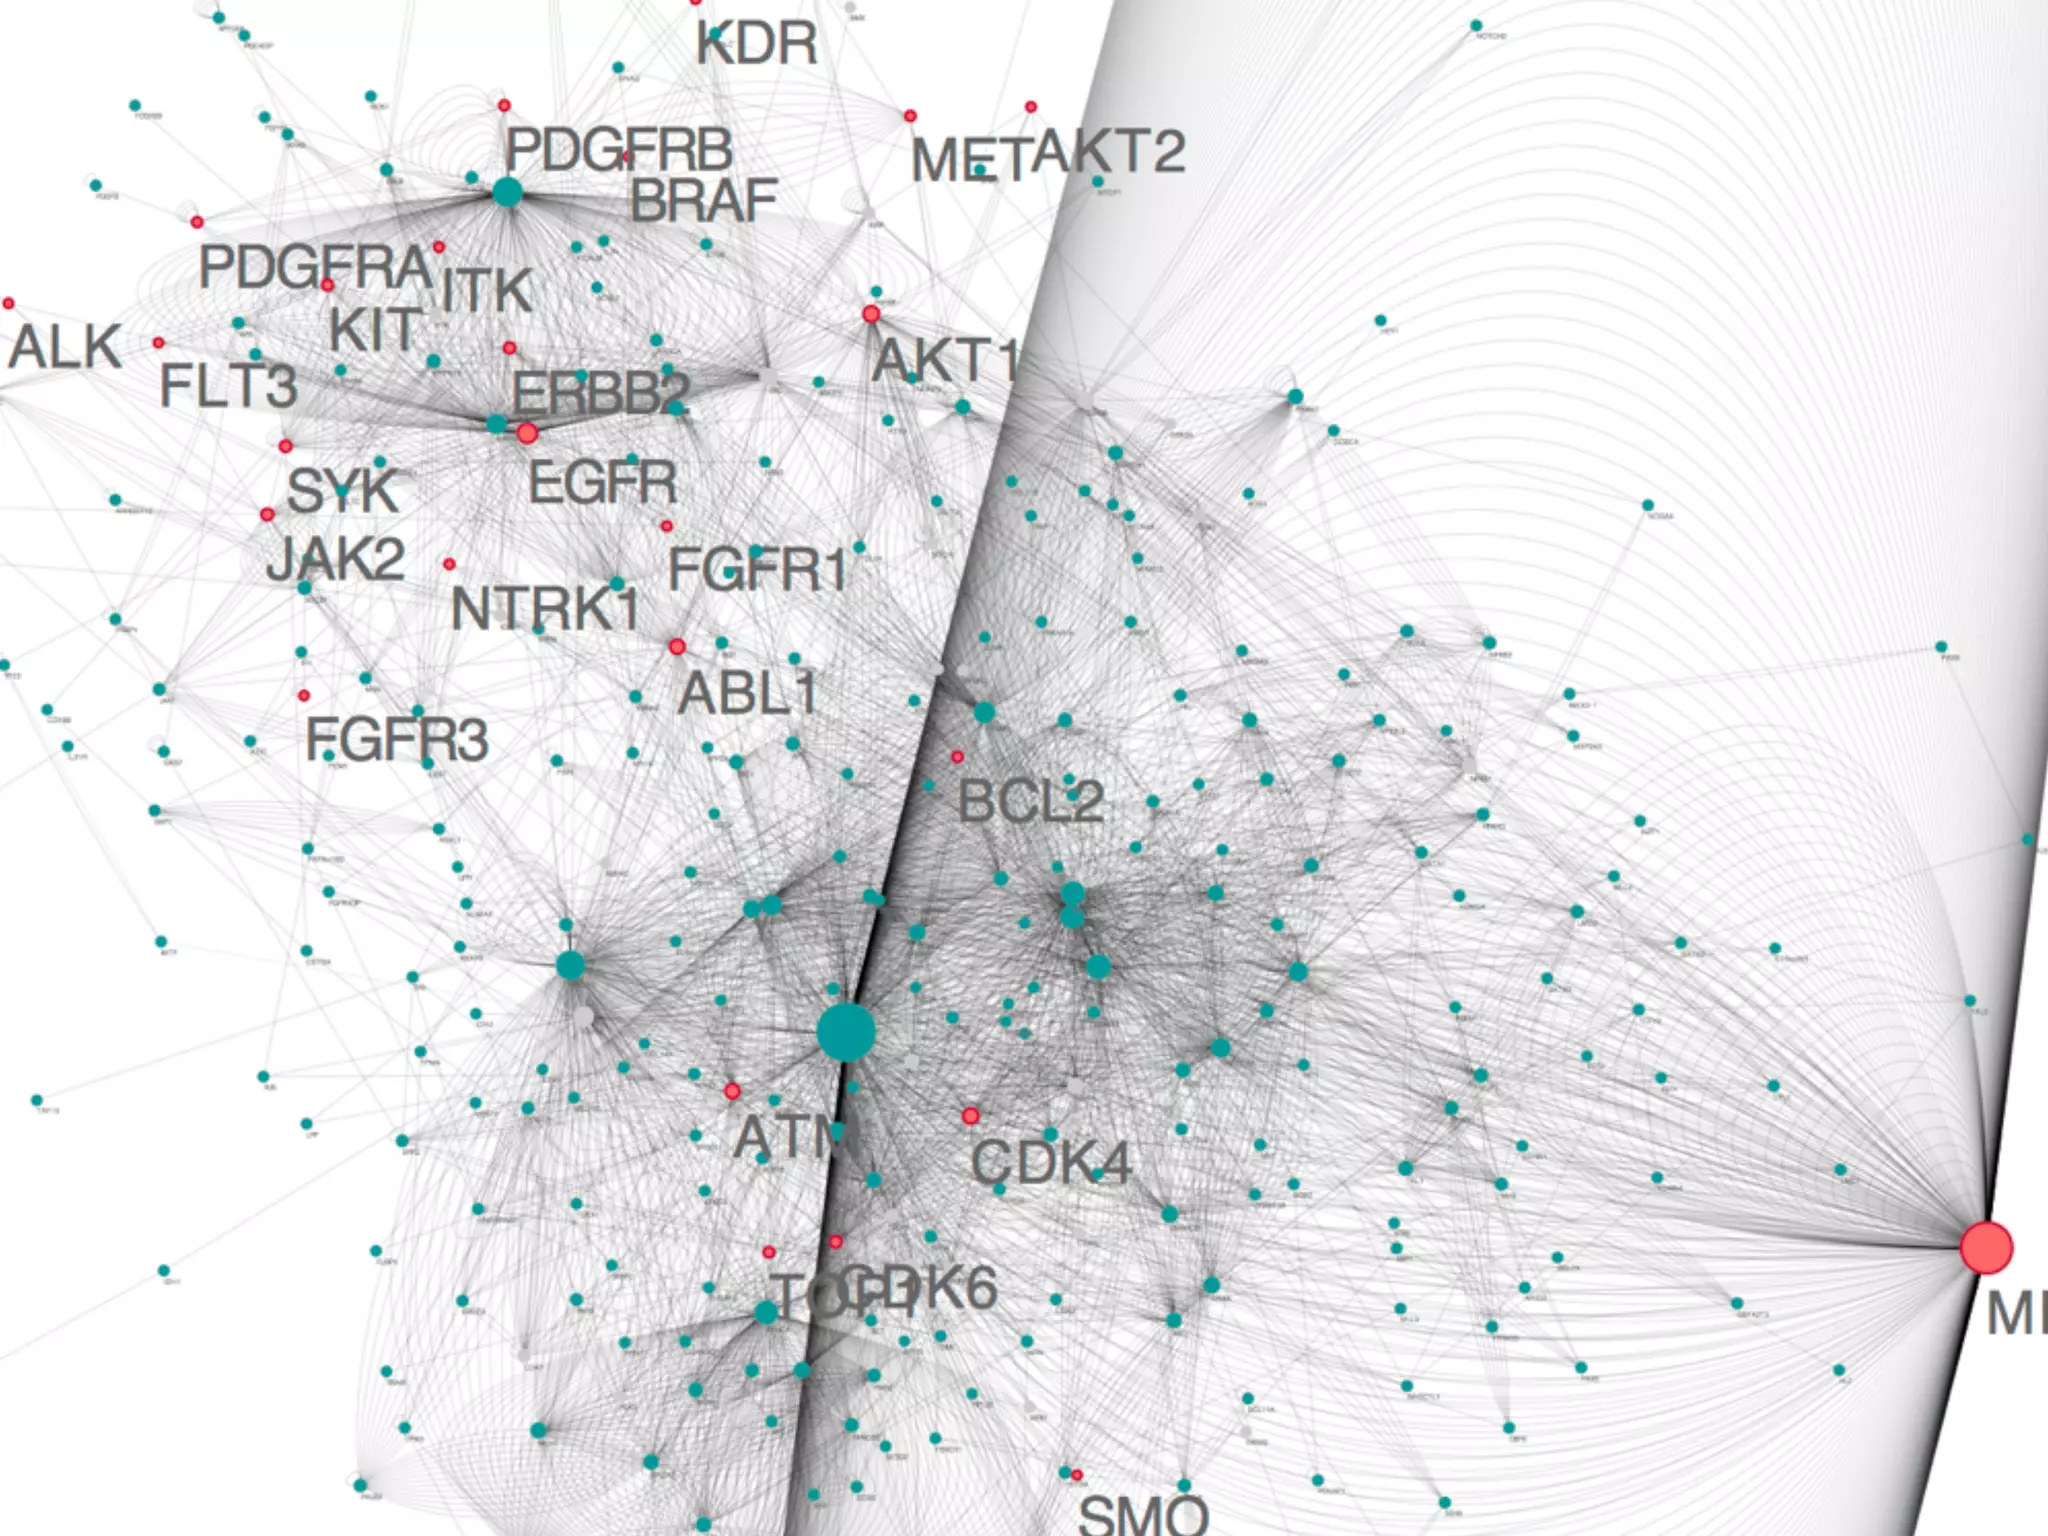
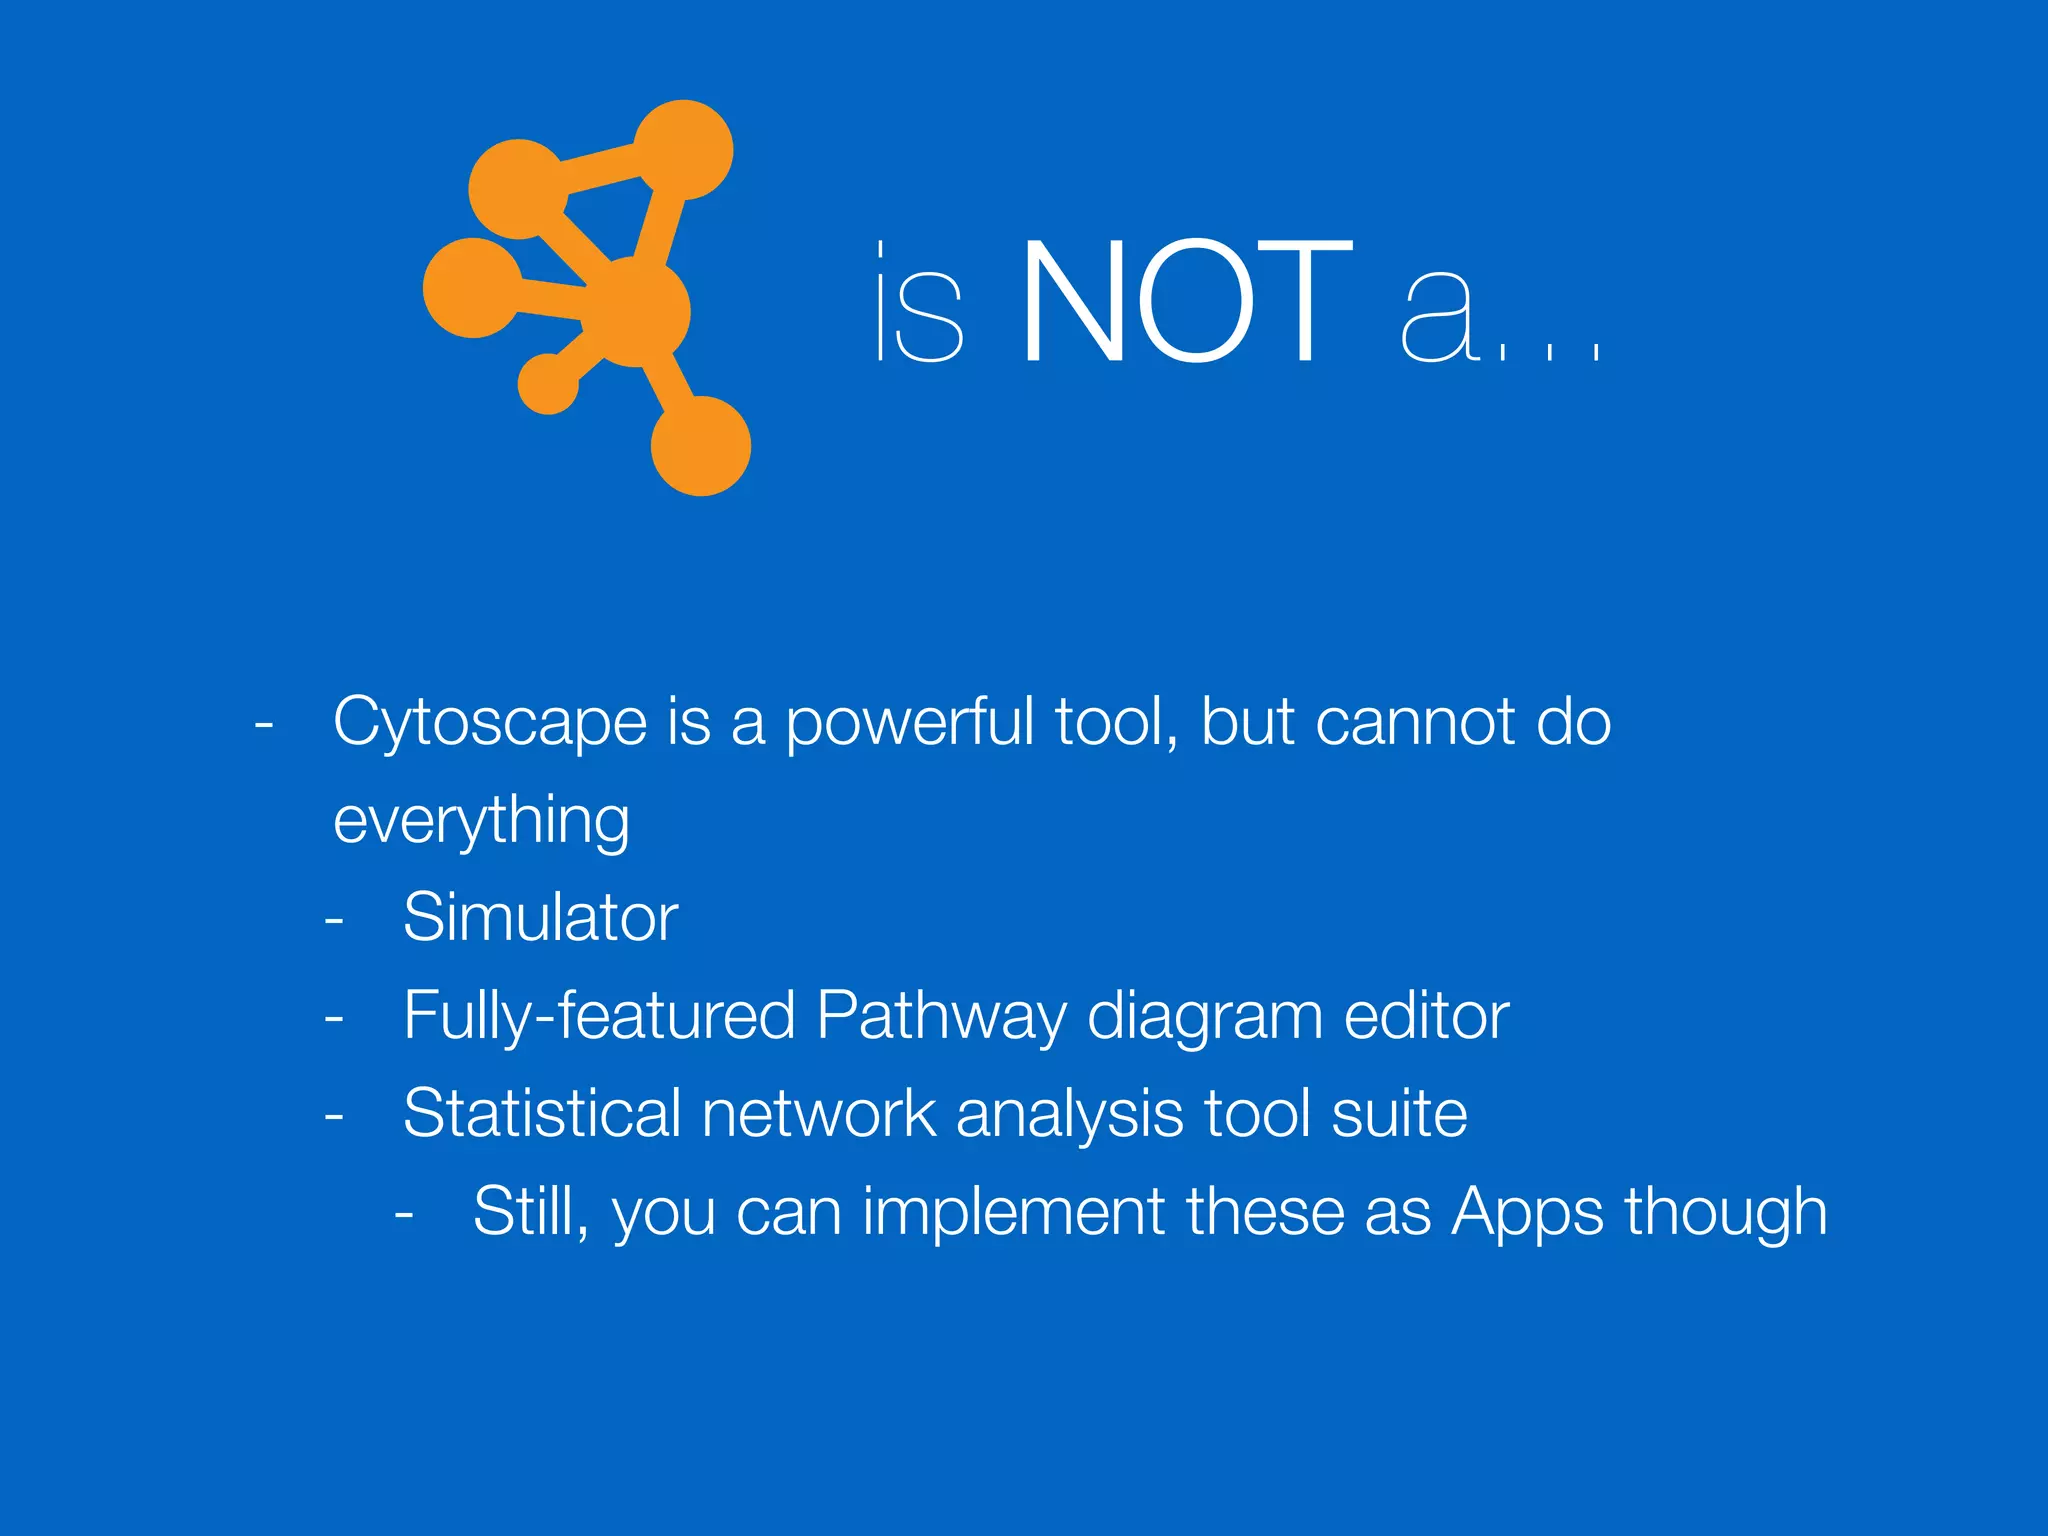
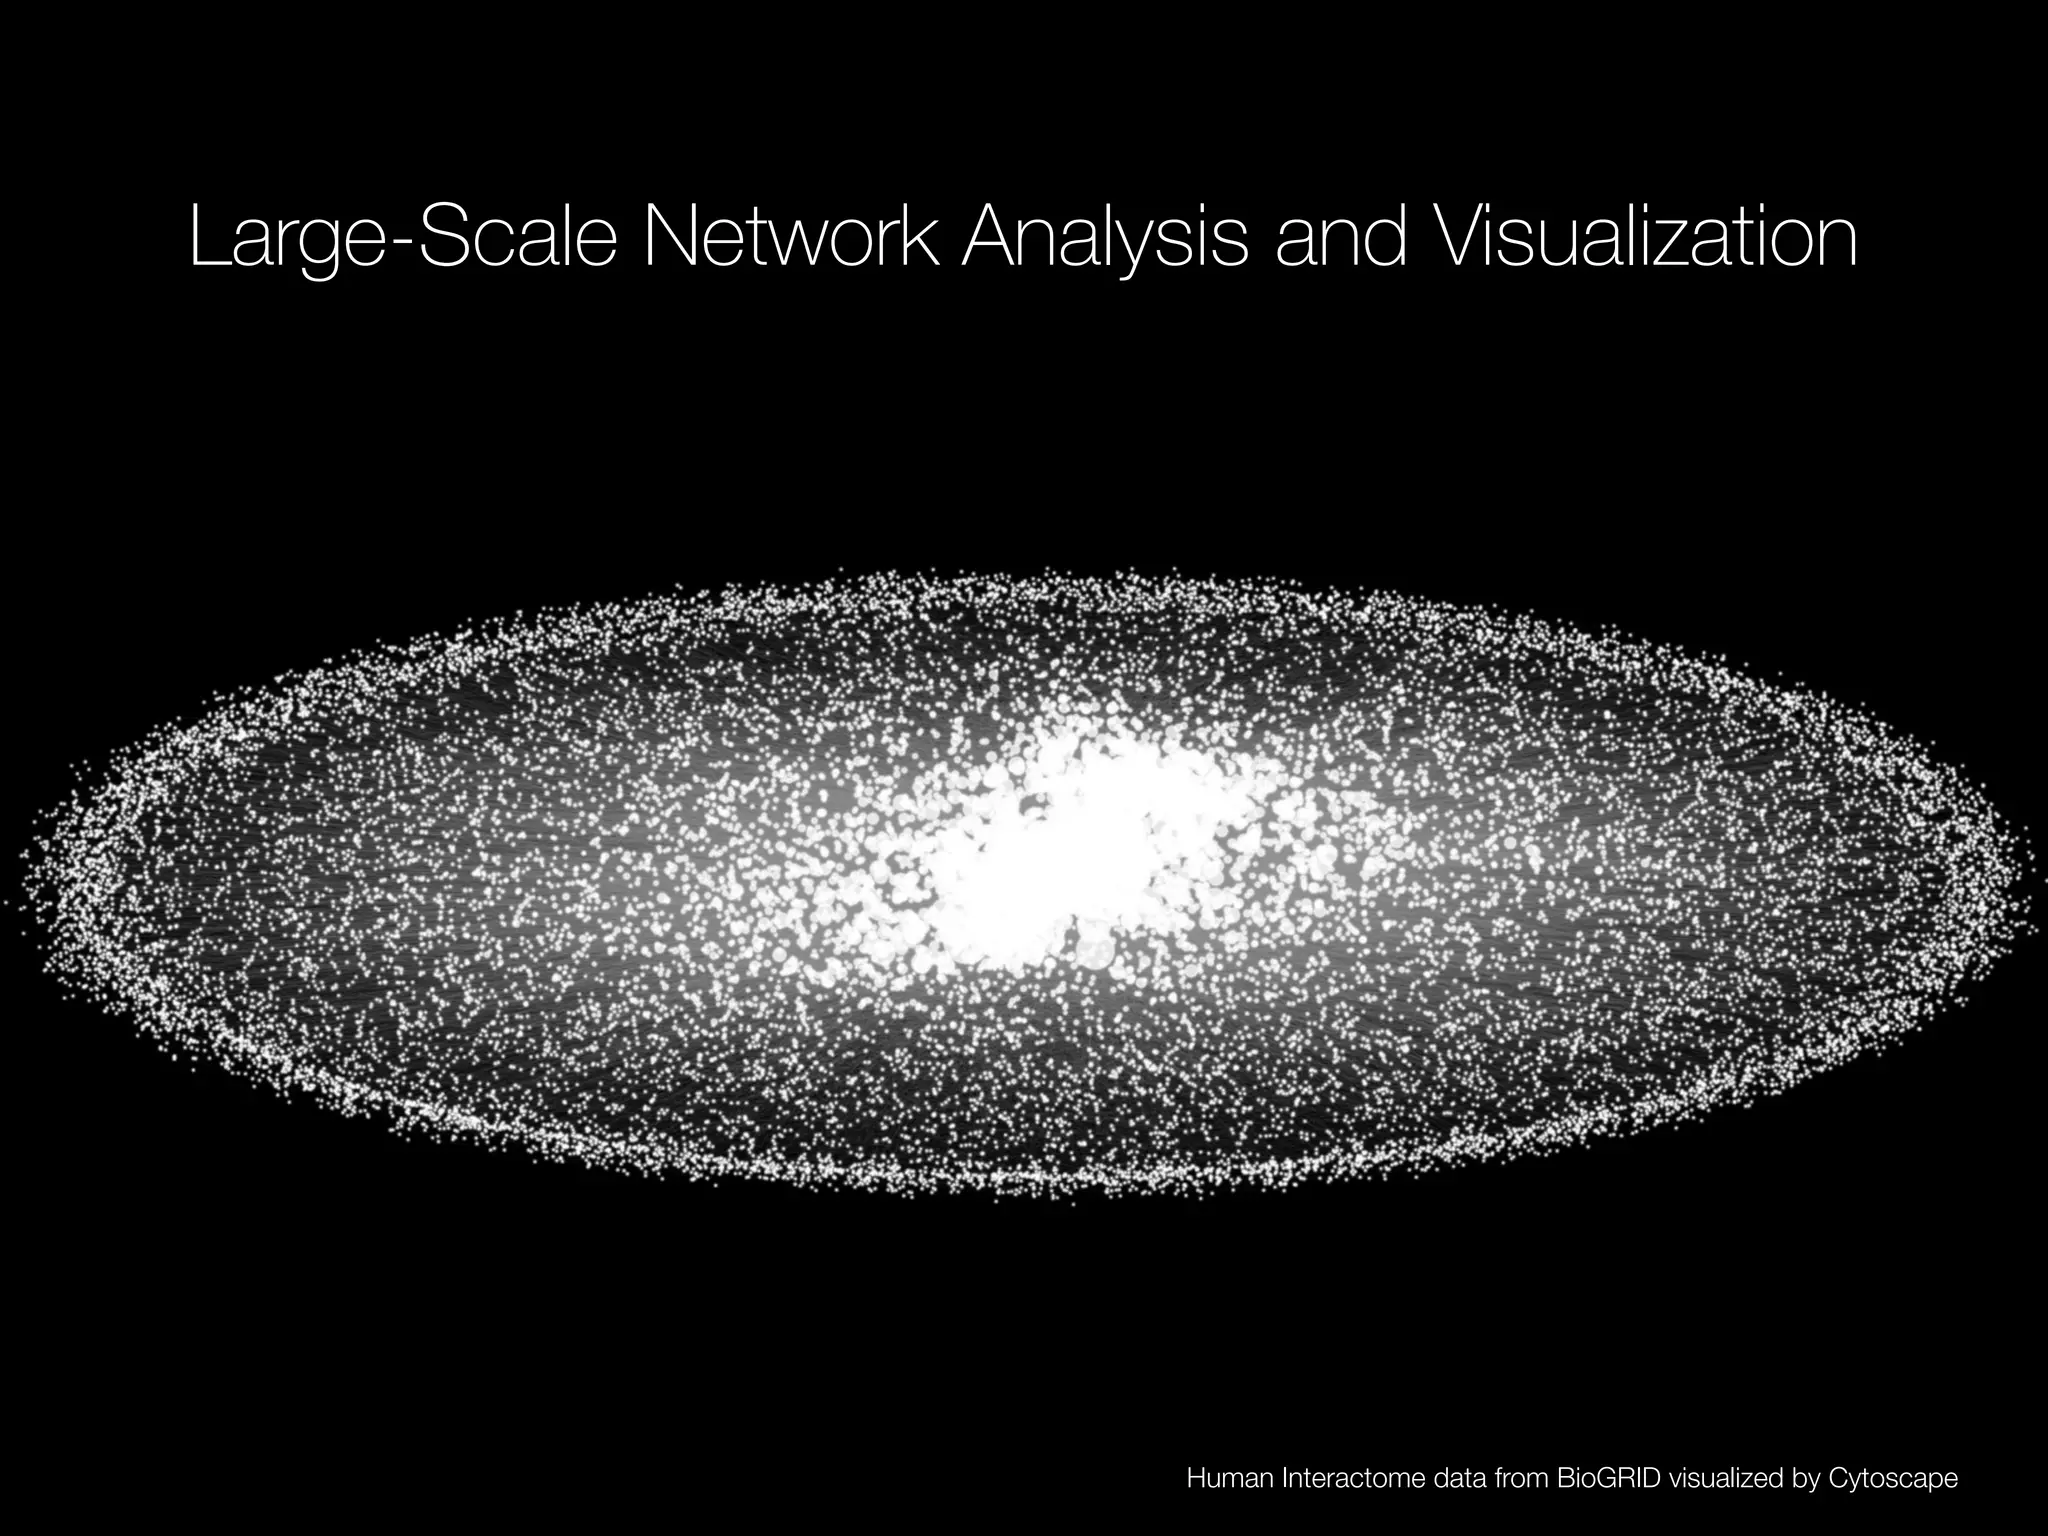
Clarifies limitations of Cytoscape while focusing on large-scale network analysis and visualization using BioGRID data.
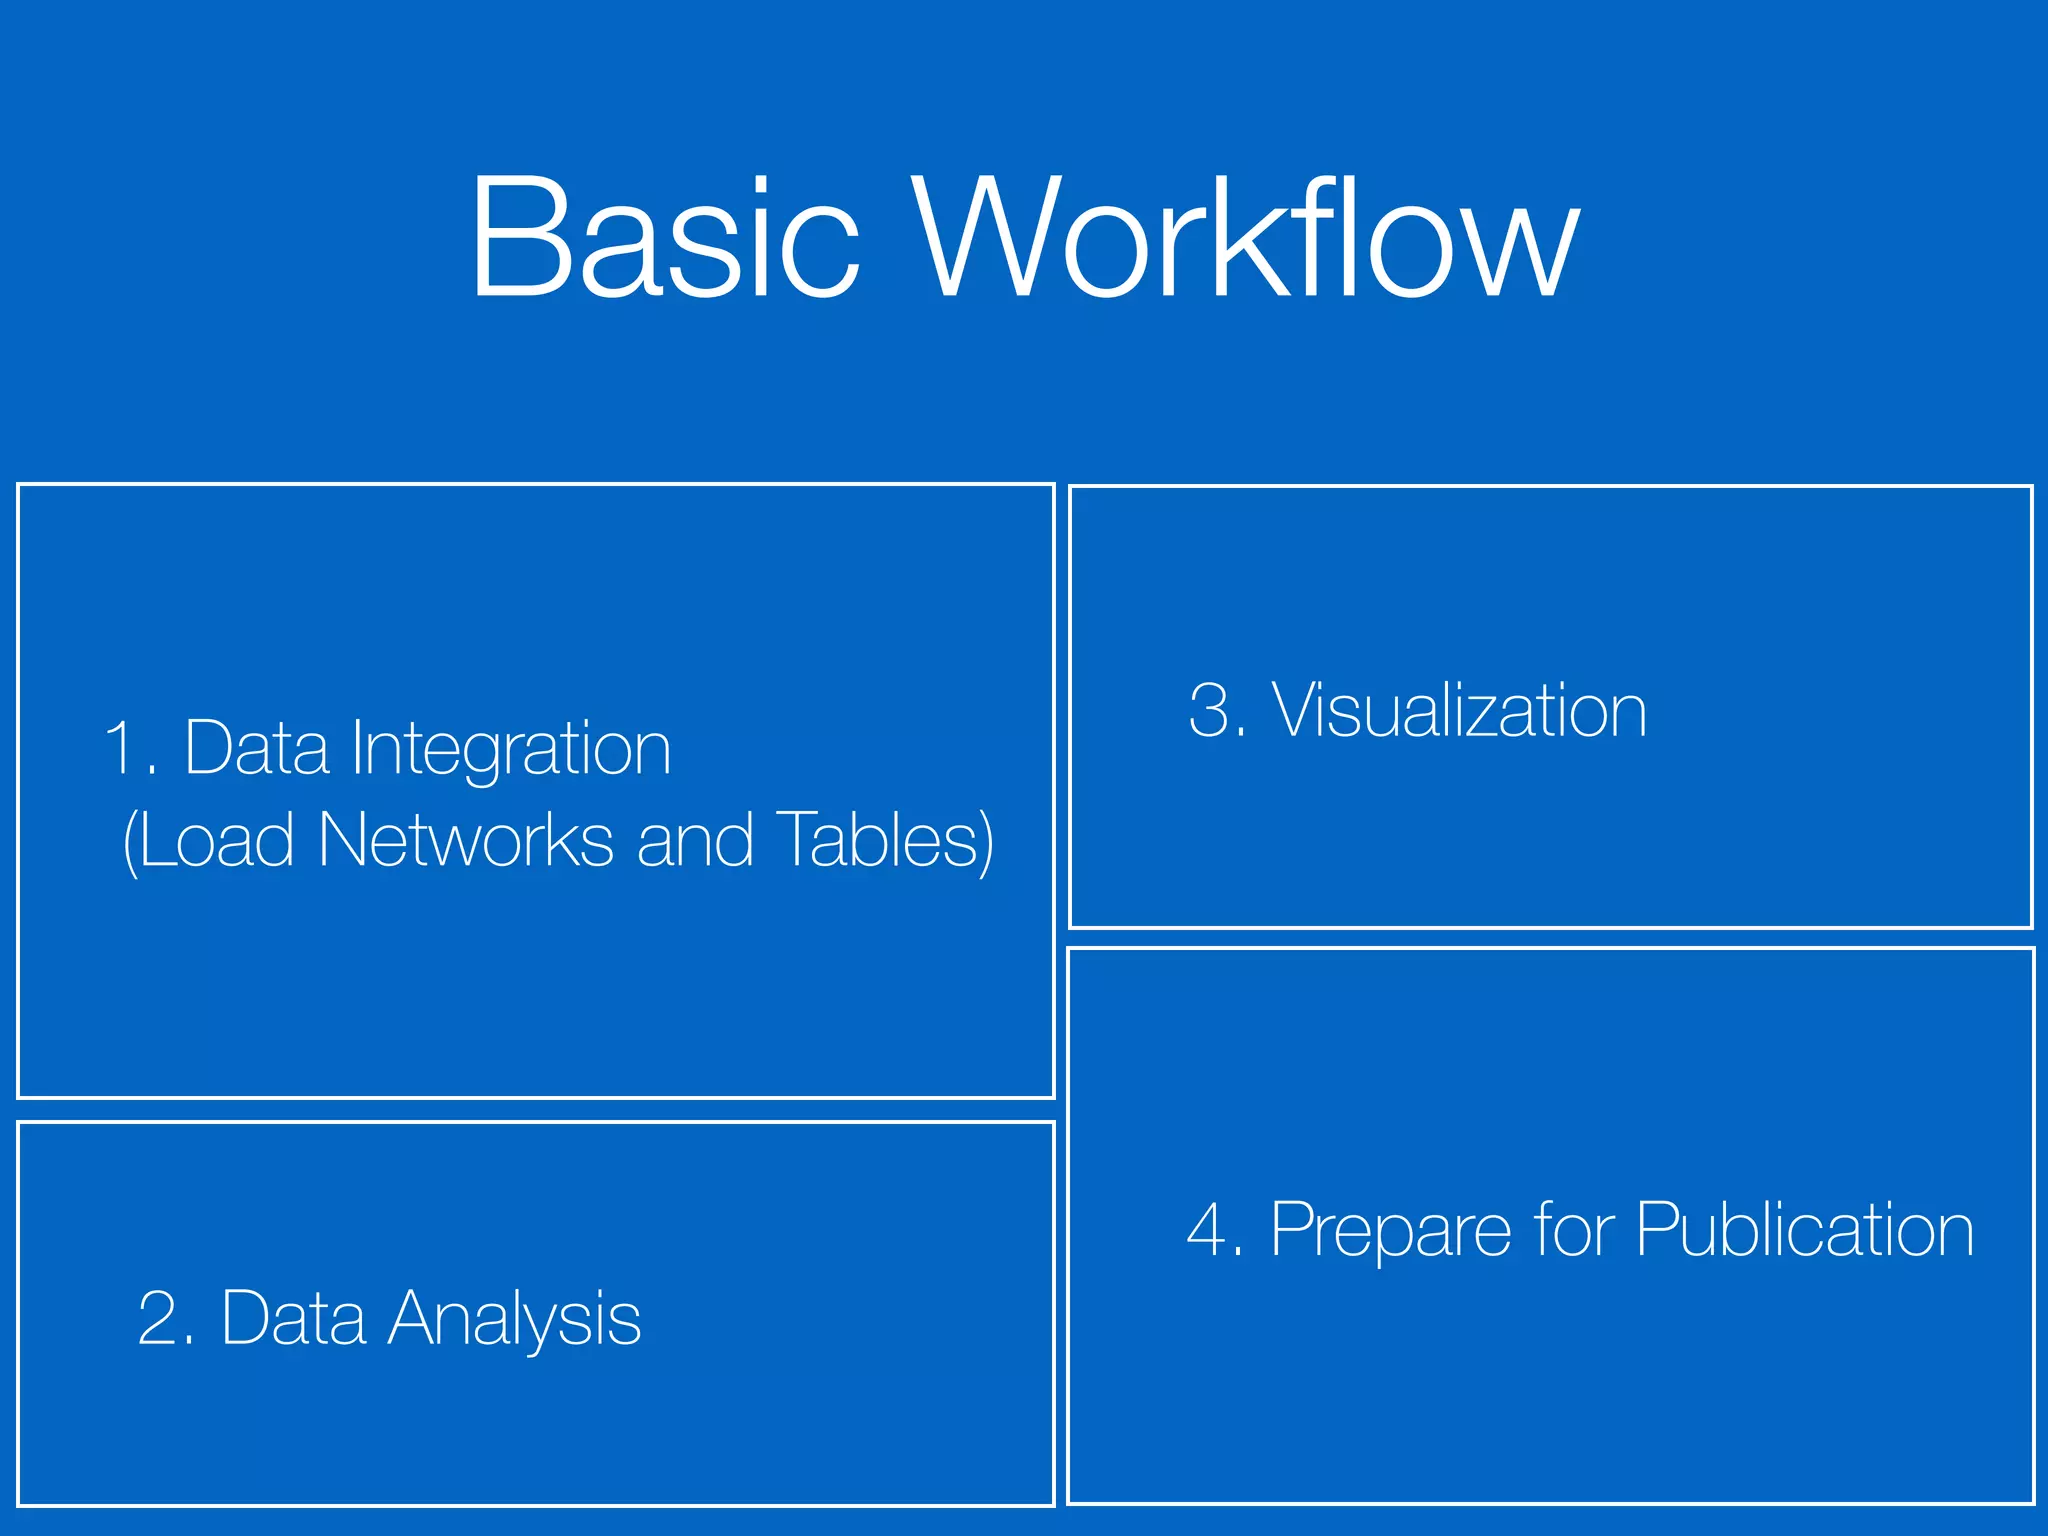
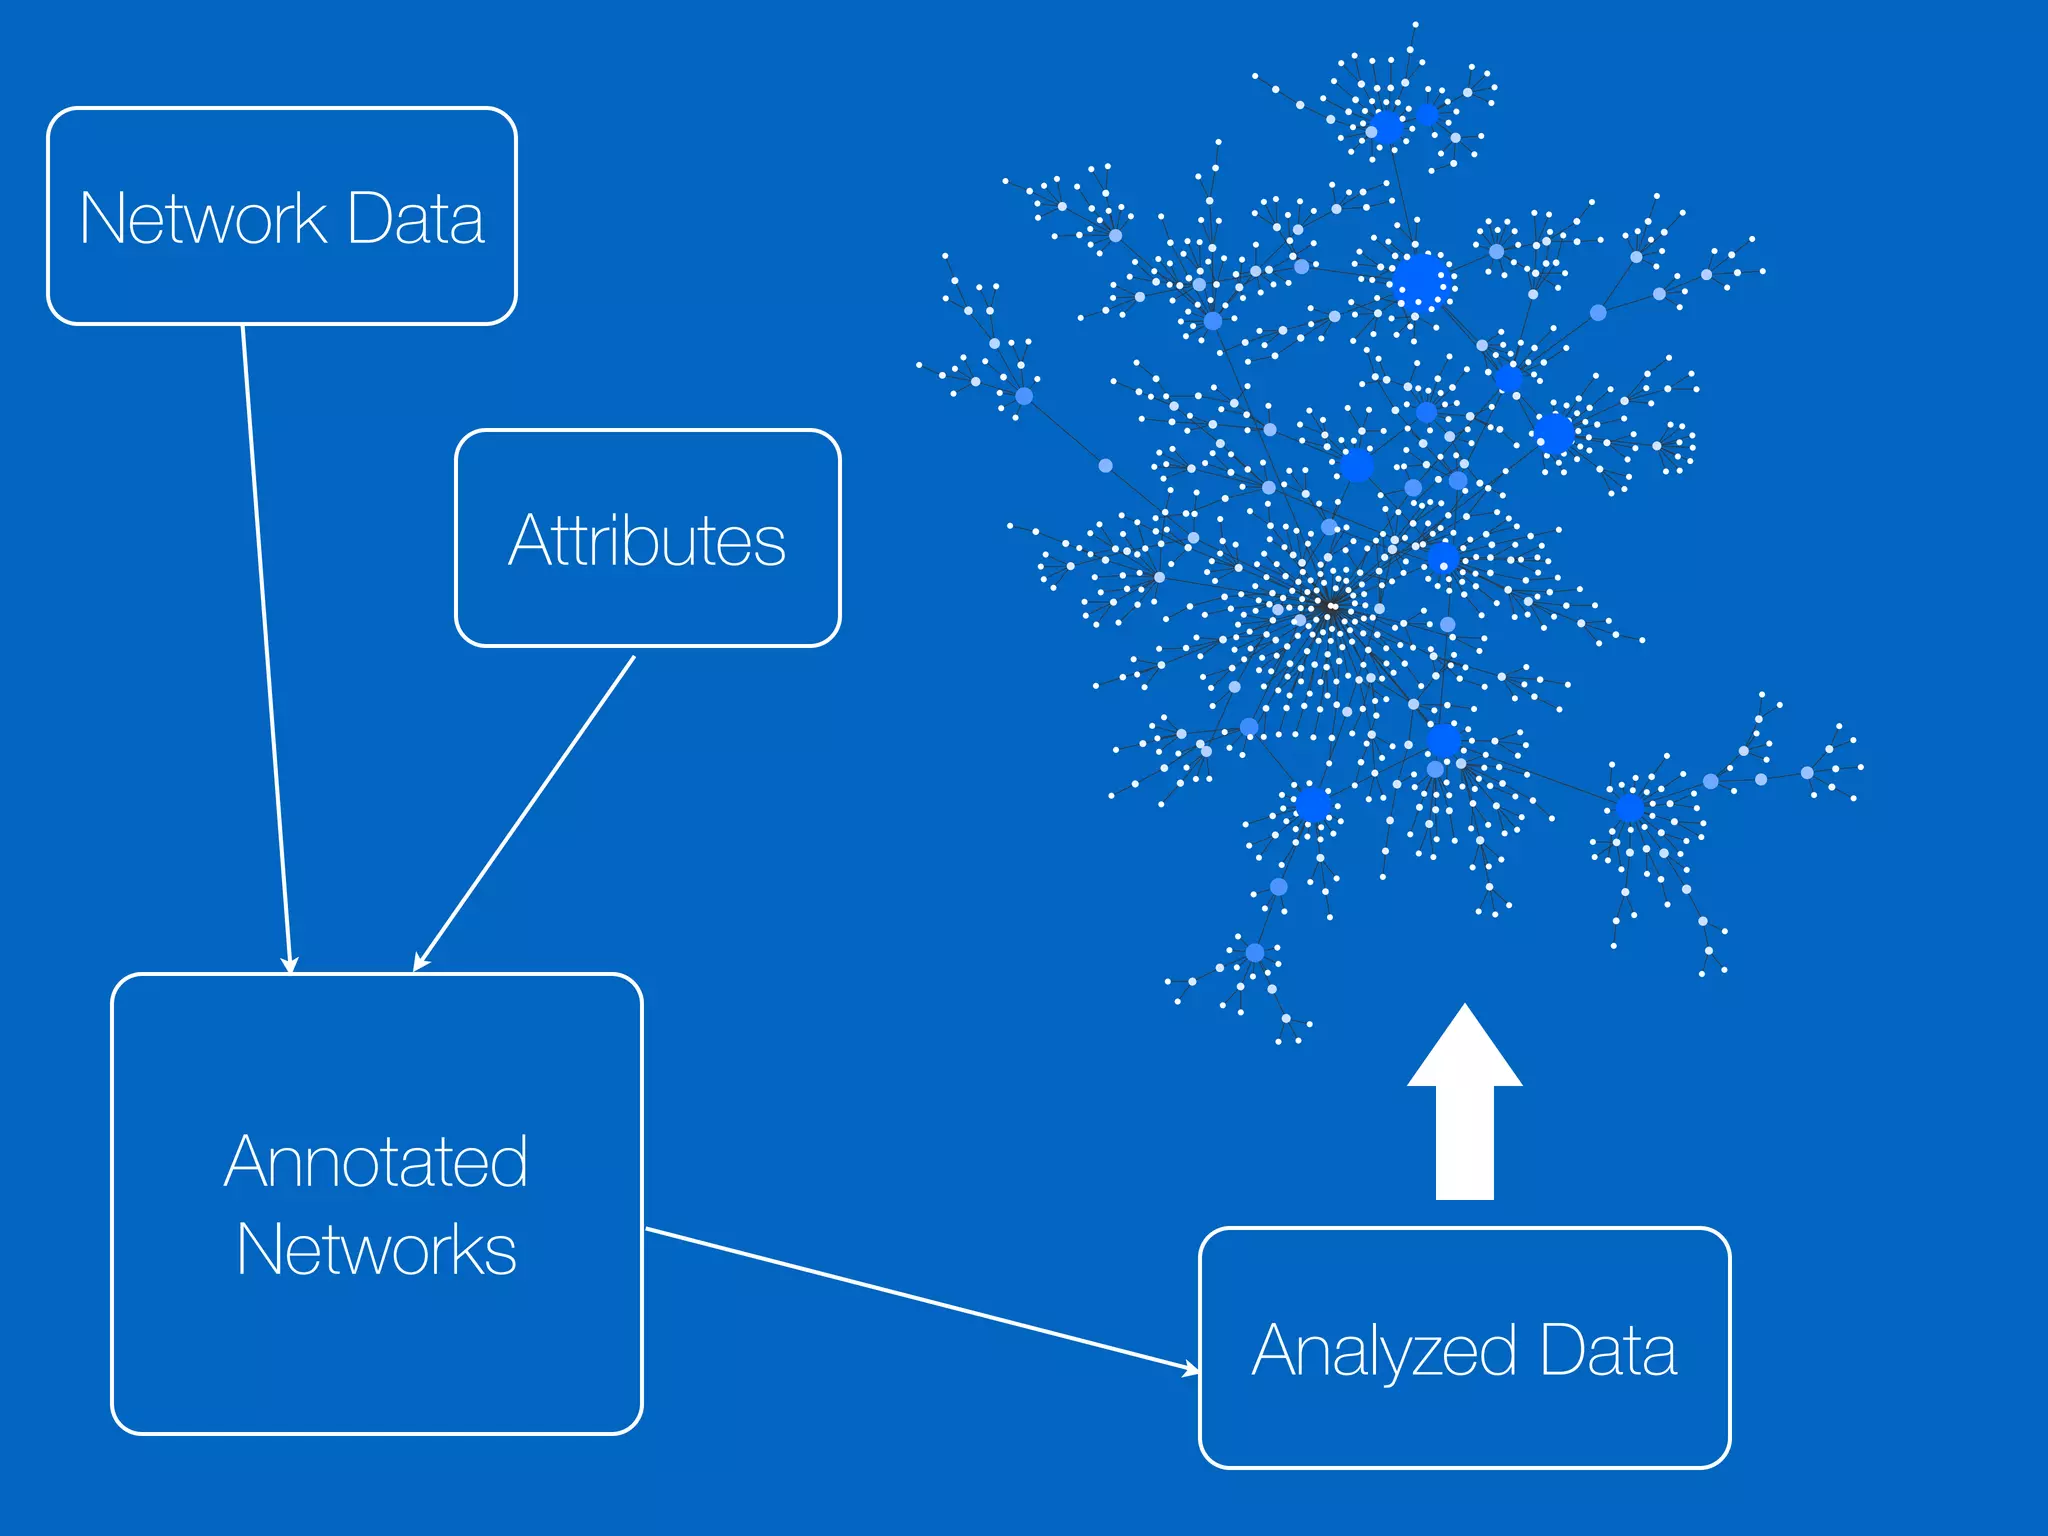
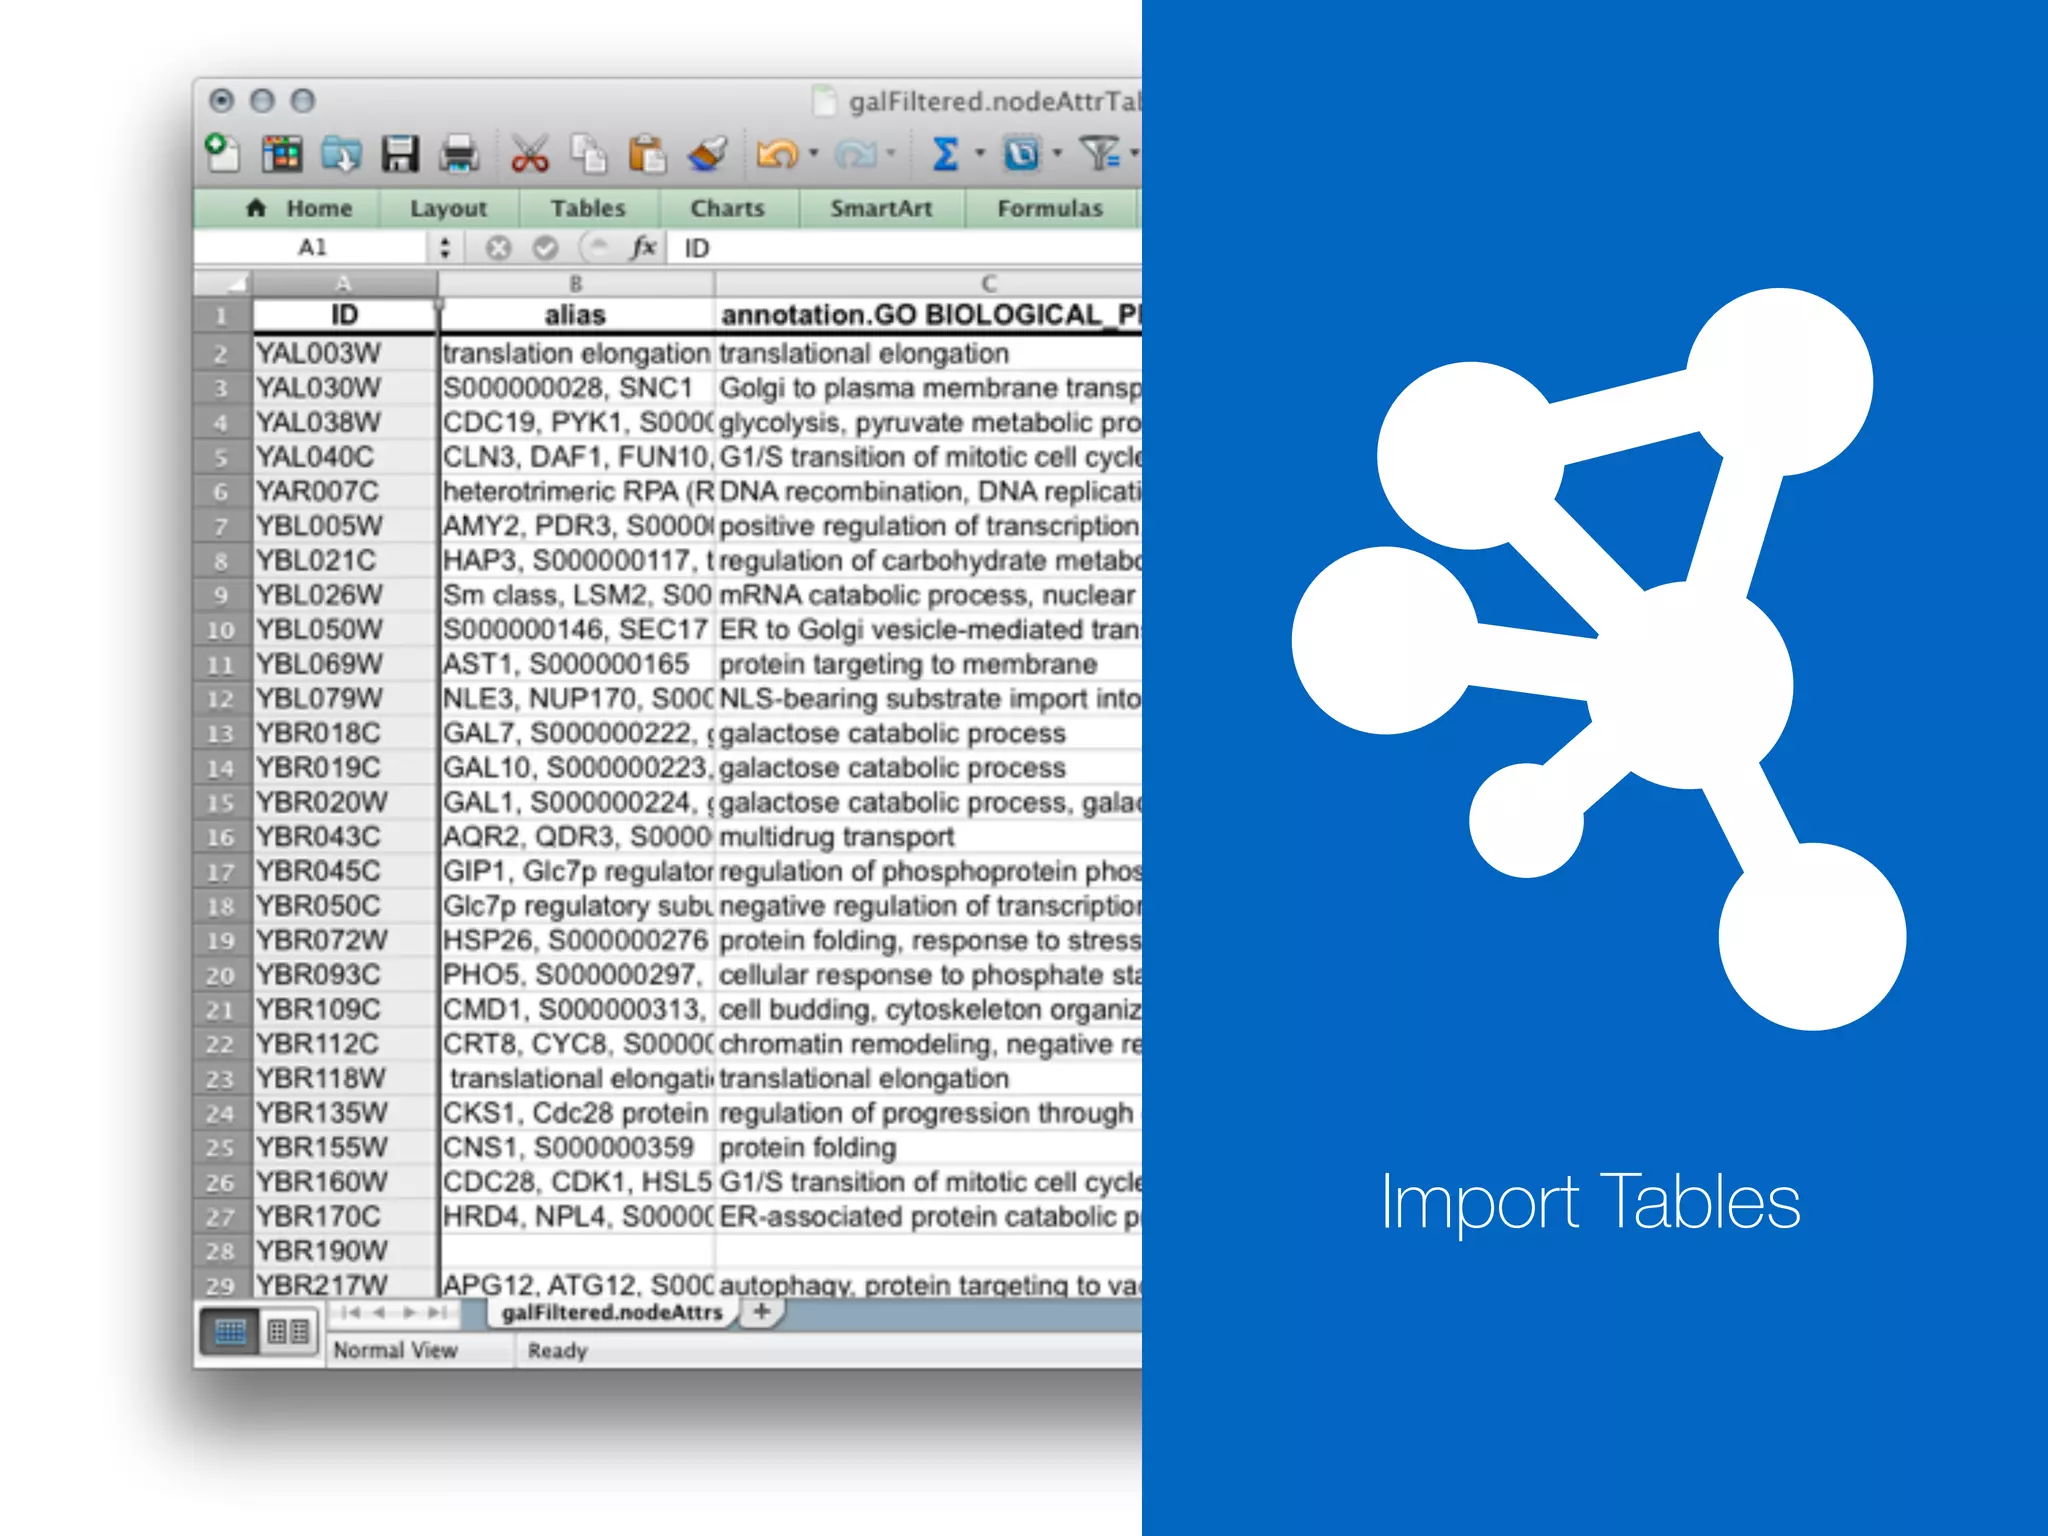
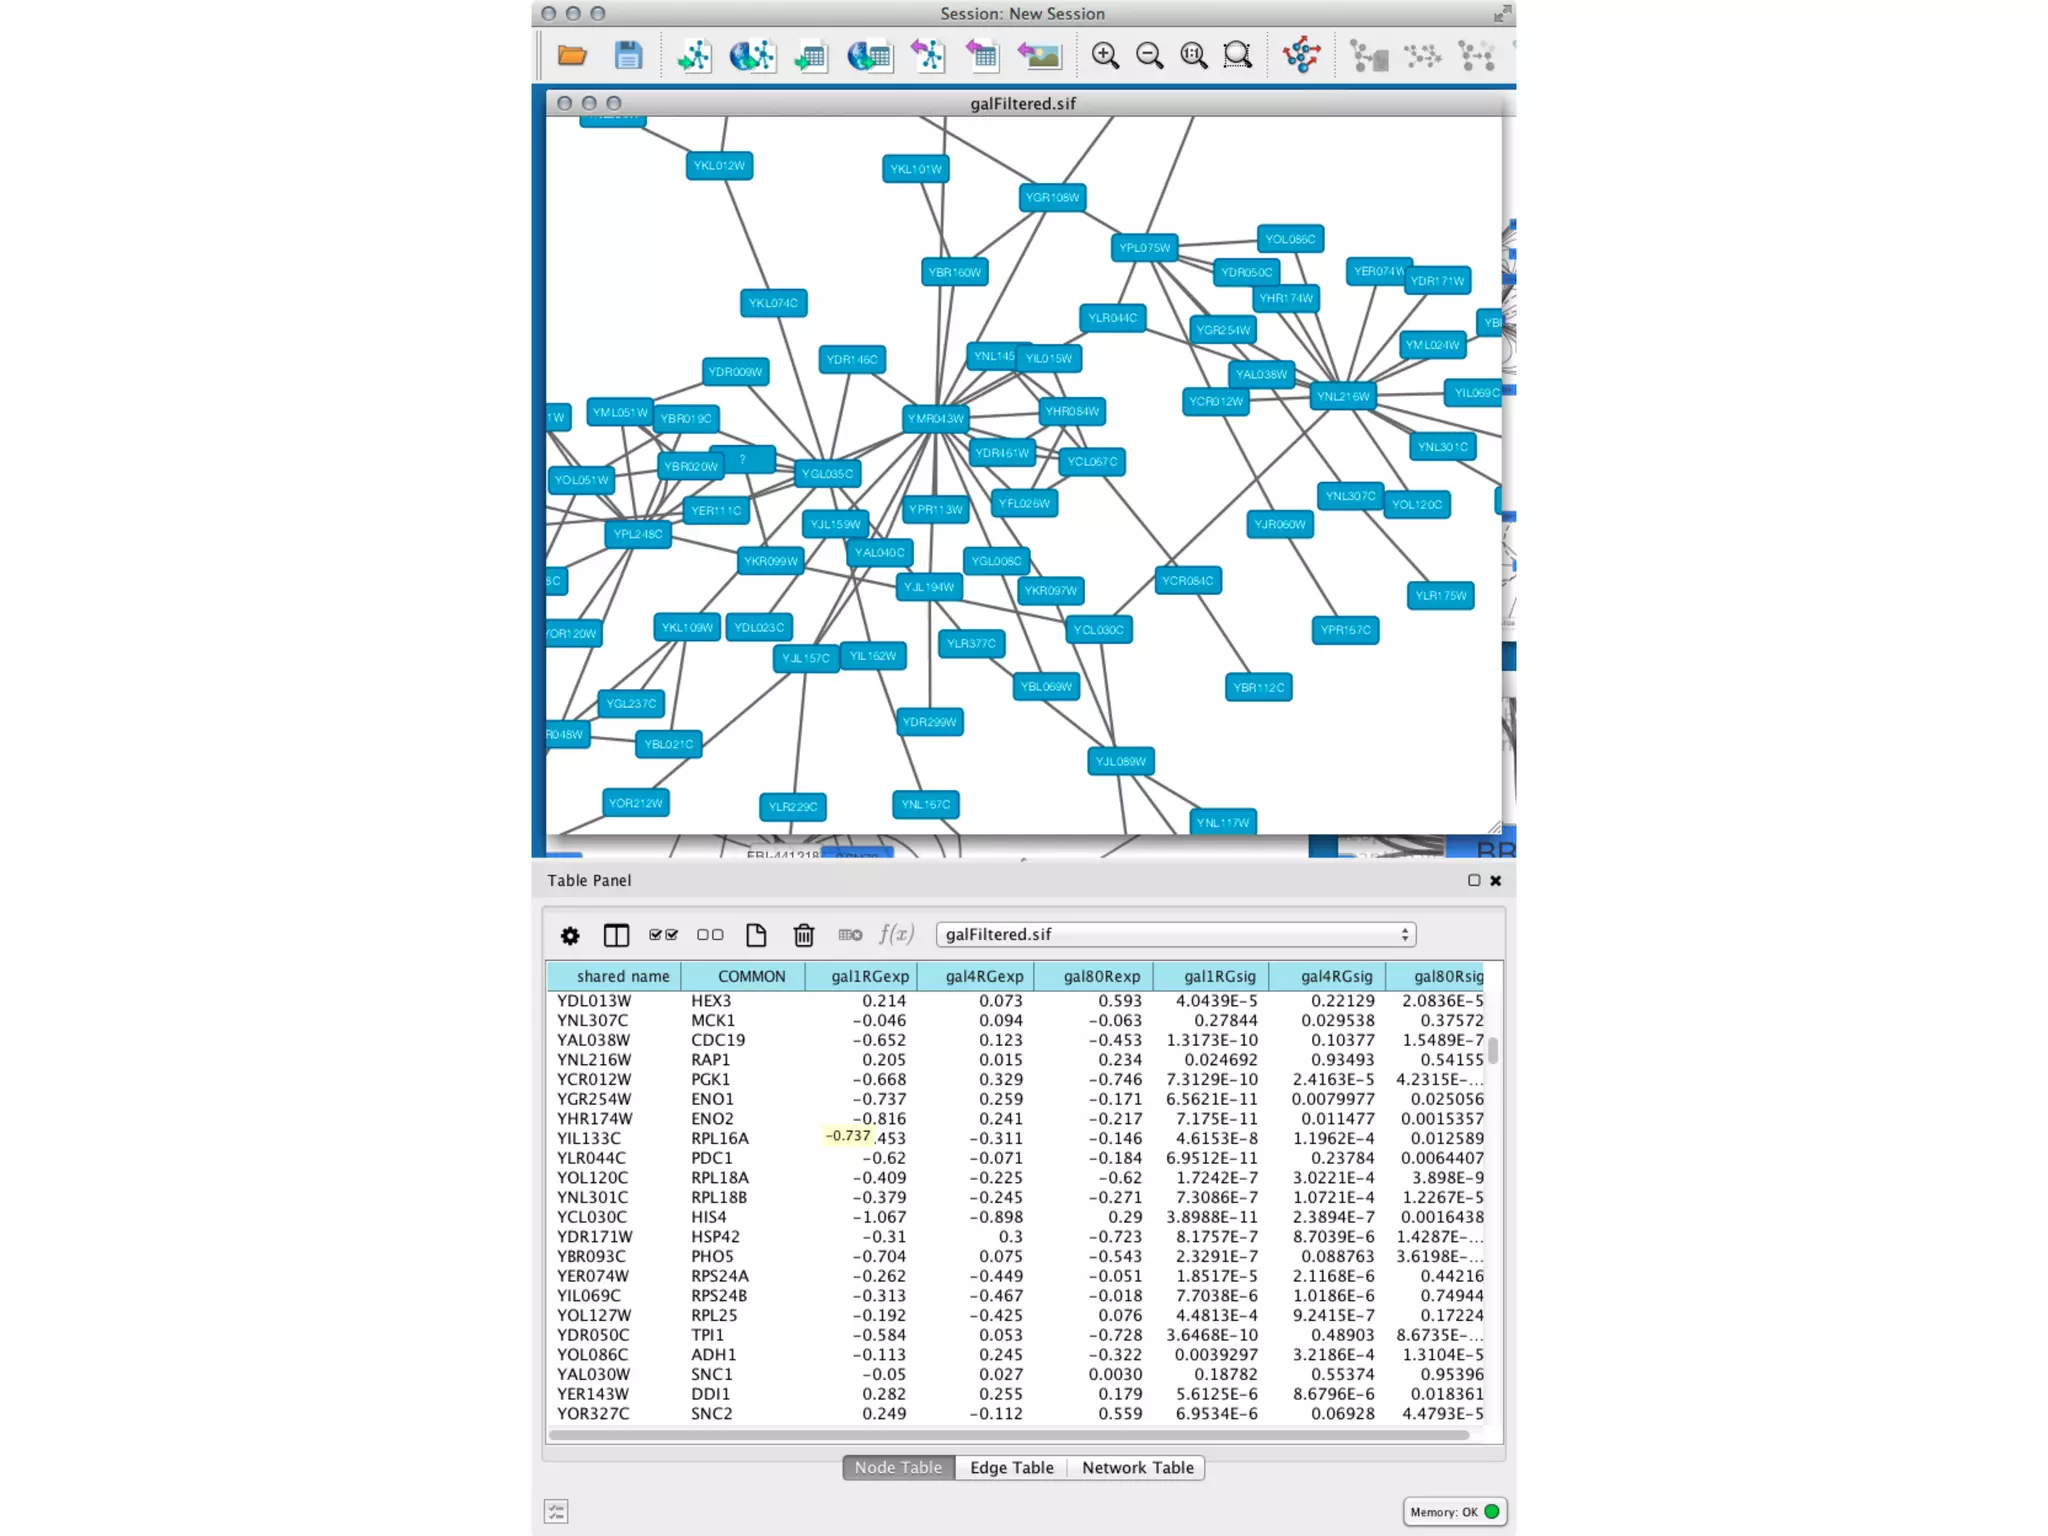
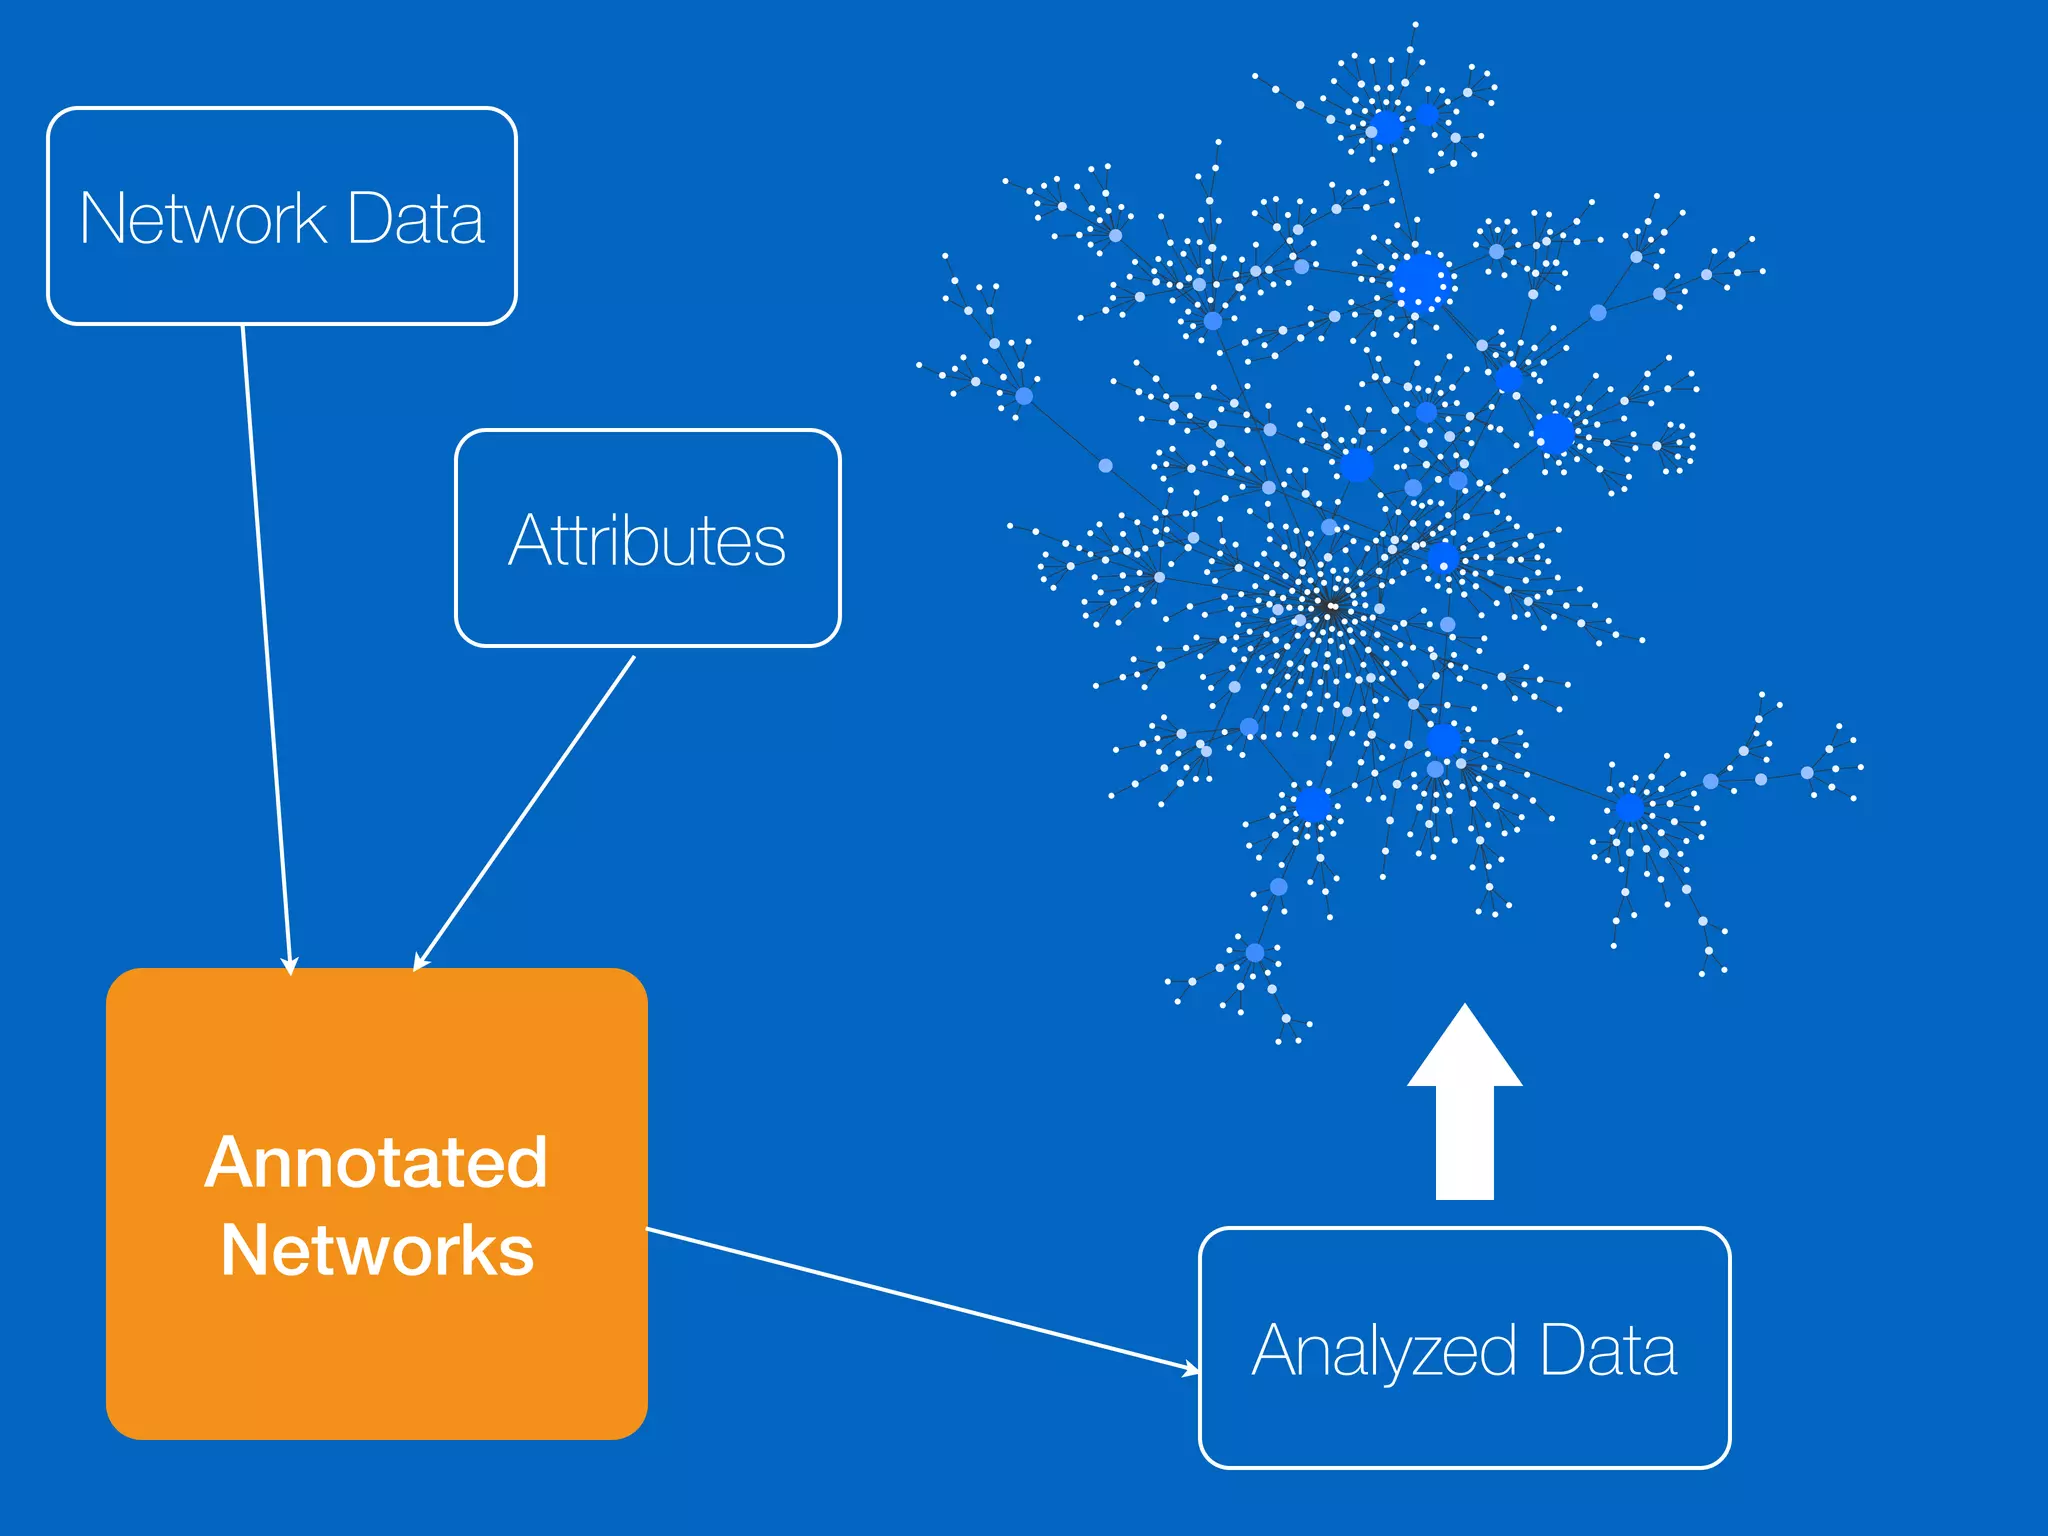
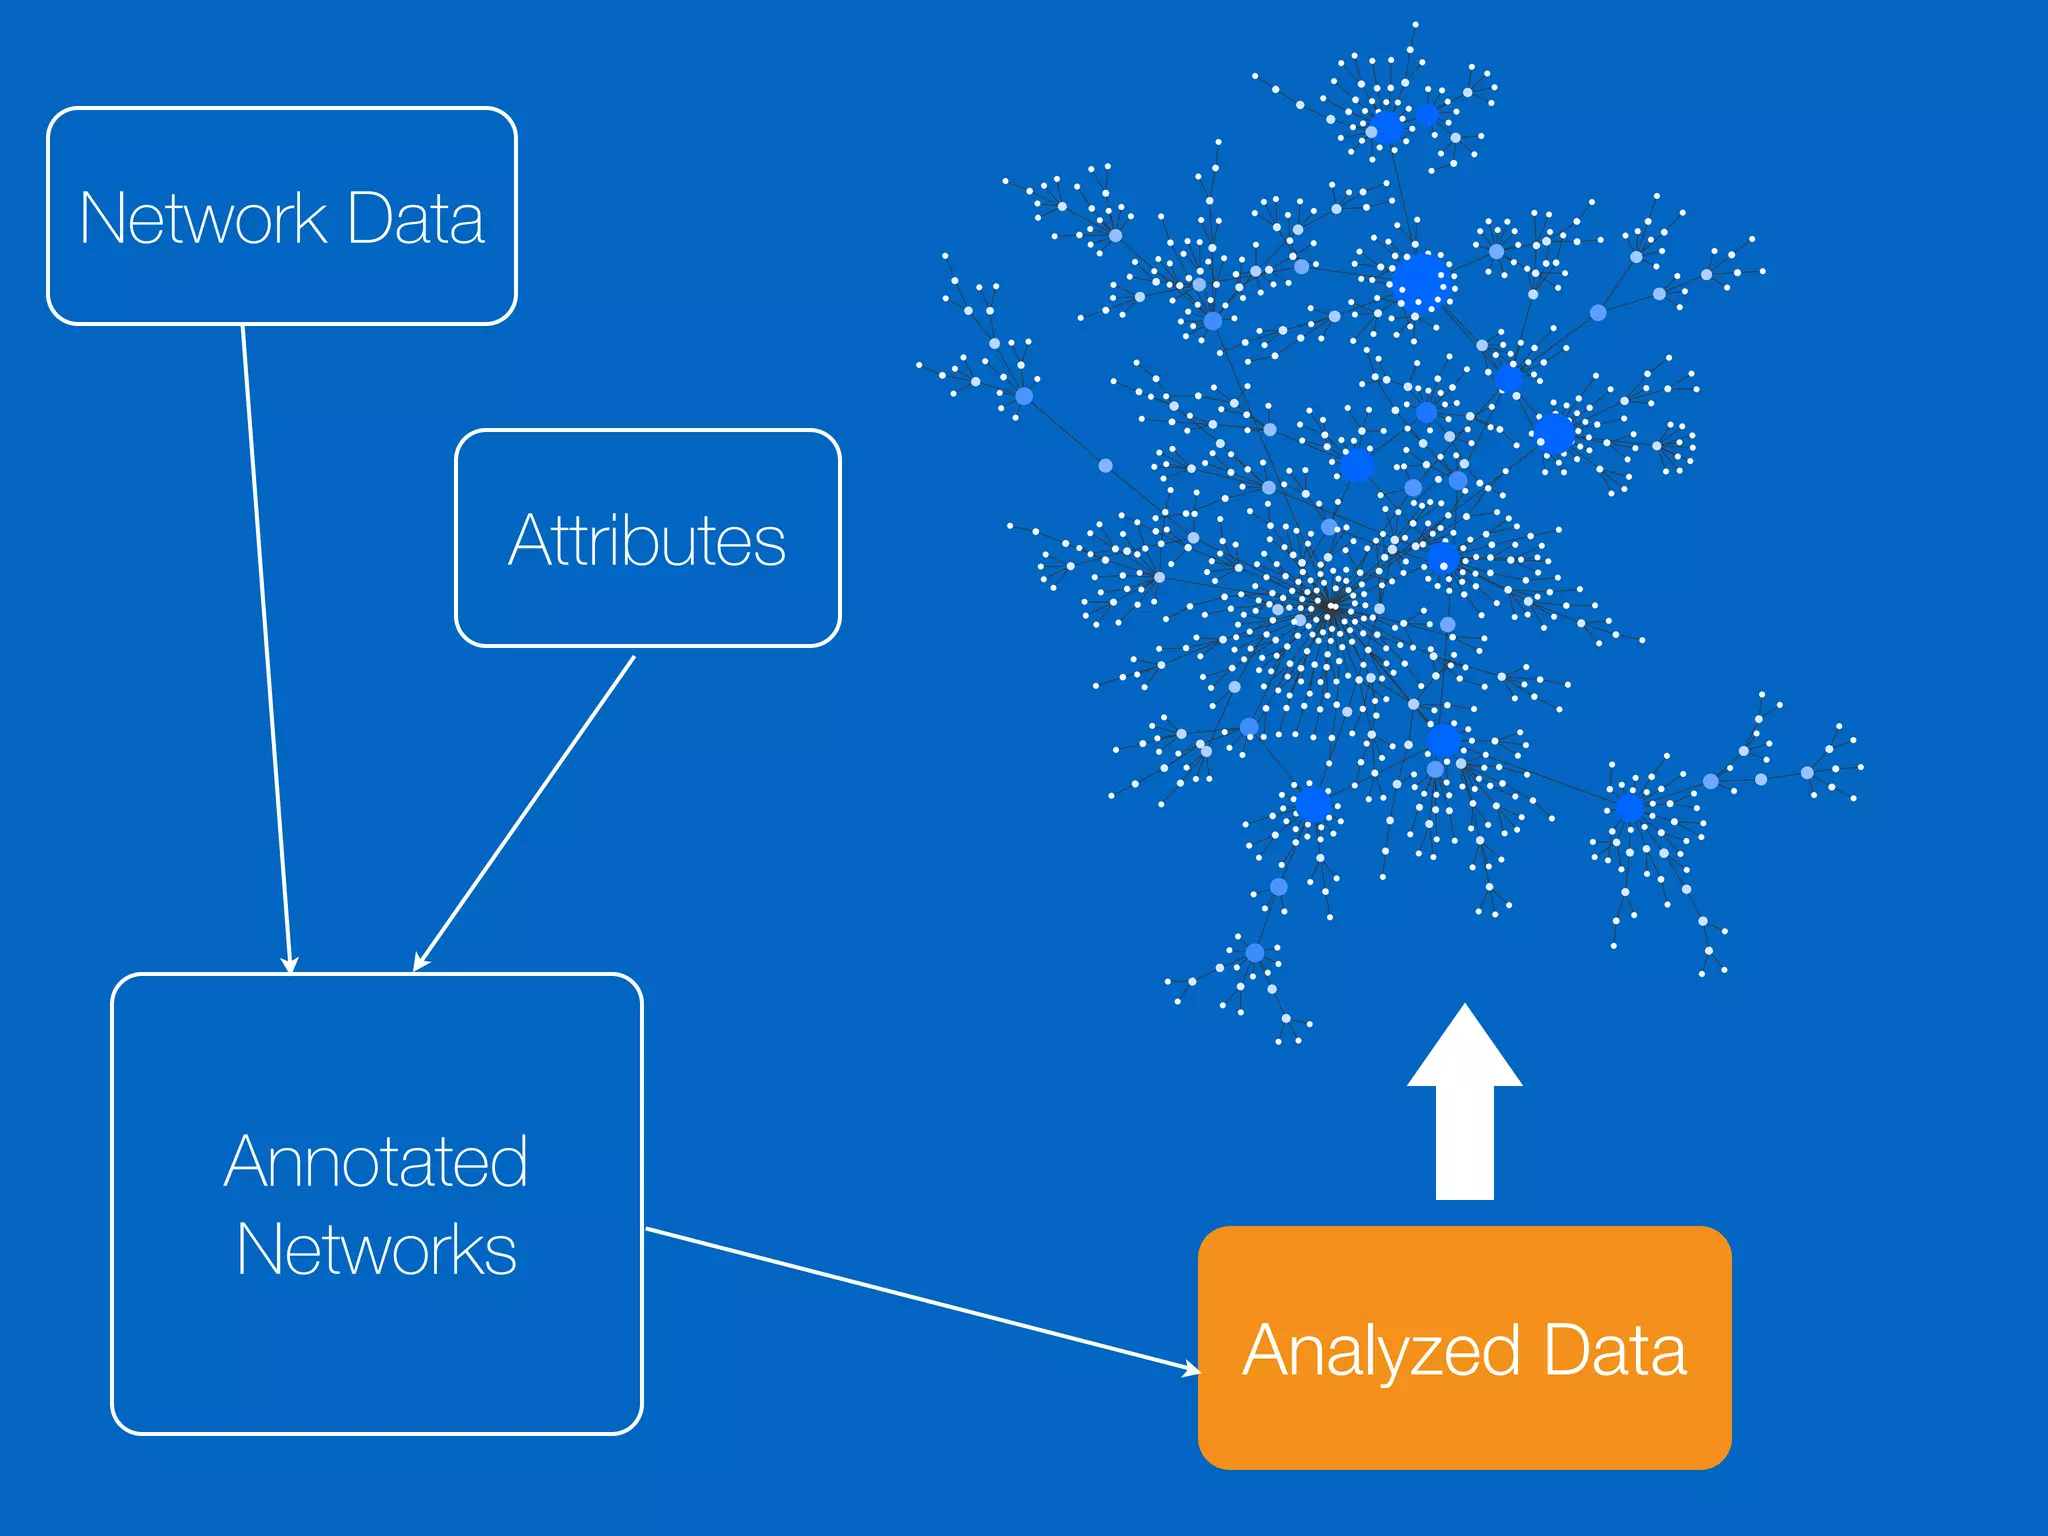
Describes the basic workflow for biological analysis with Cytoscape including data integration, analysis, and visualization.
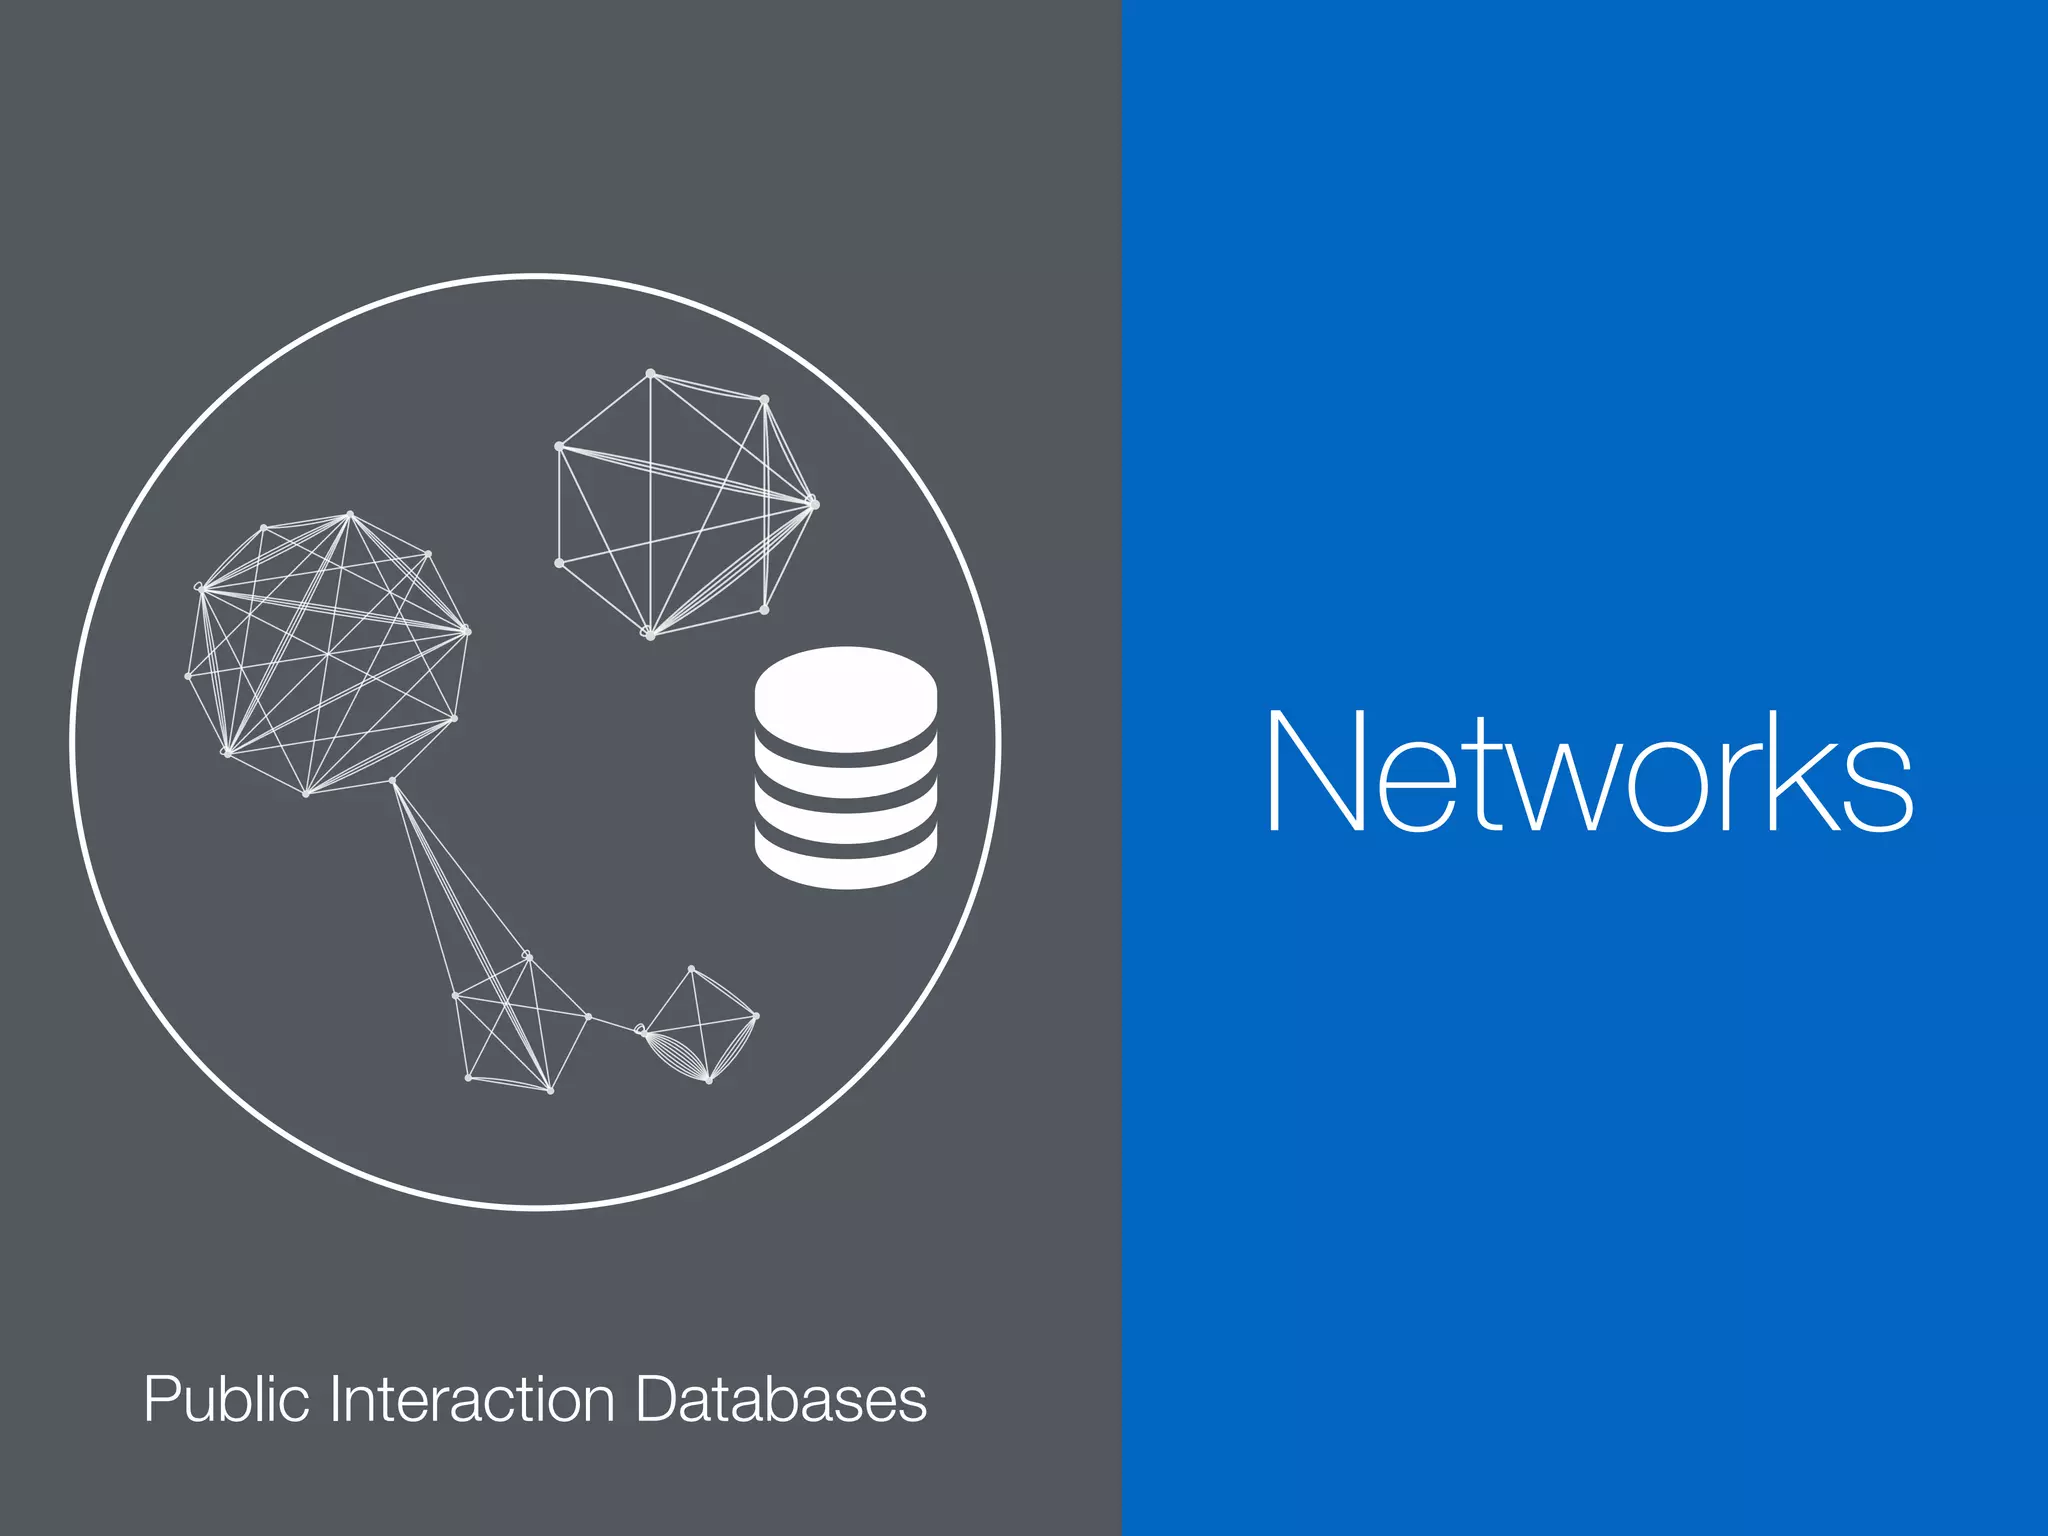
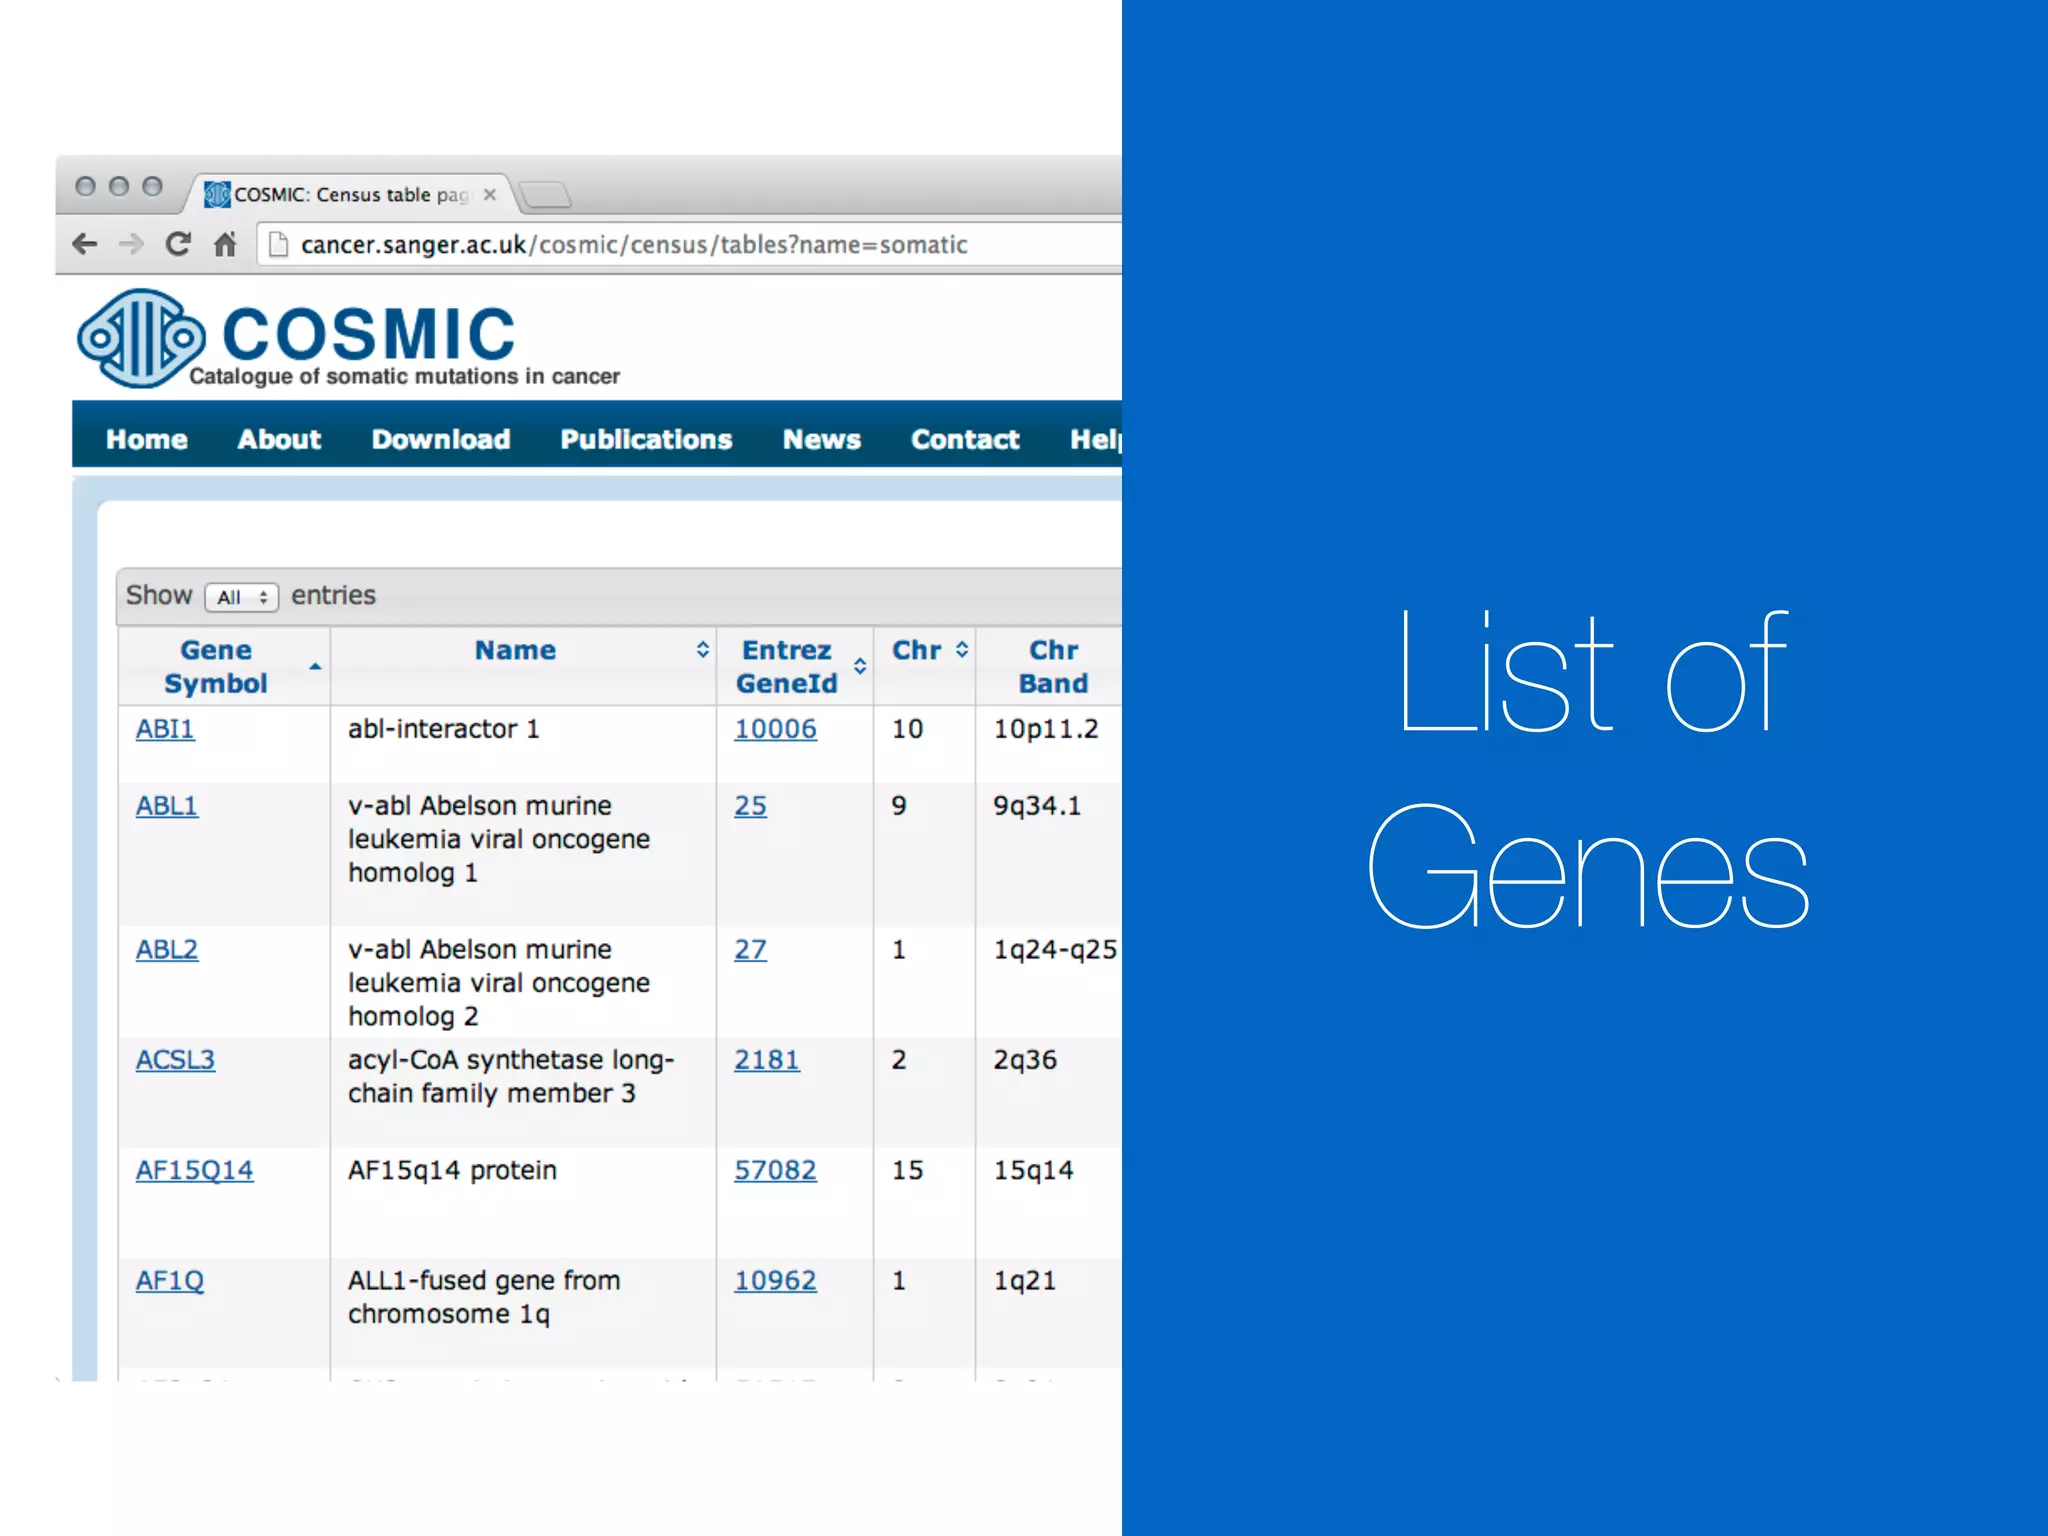
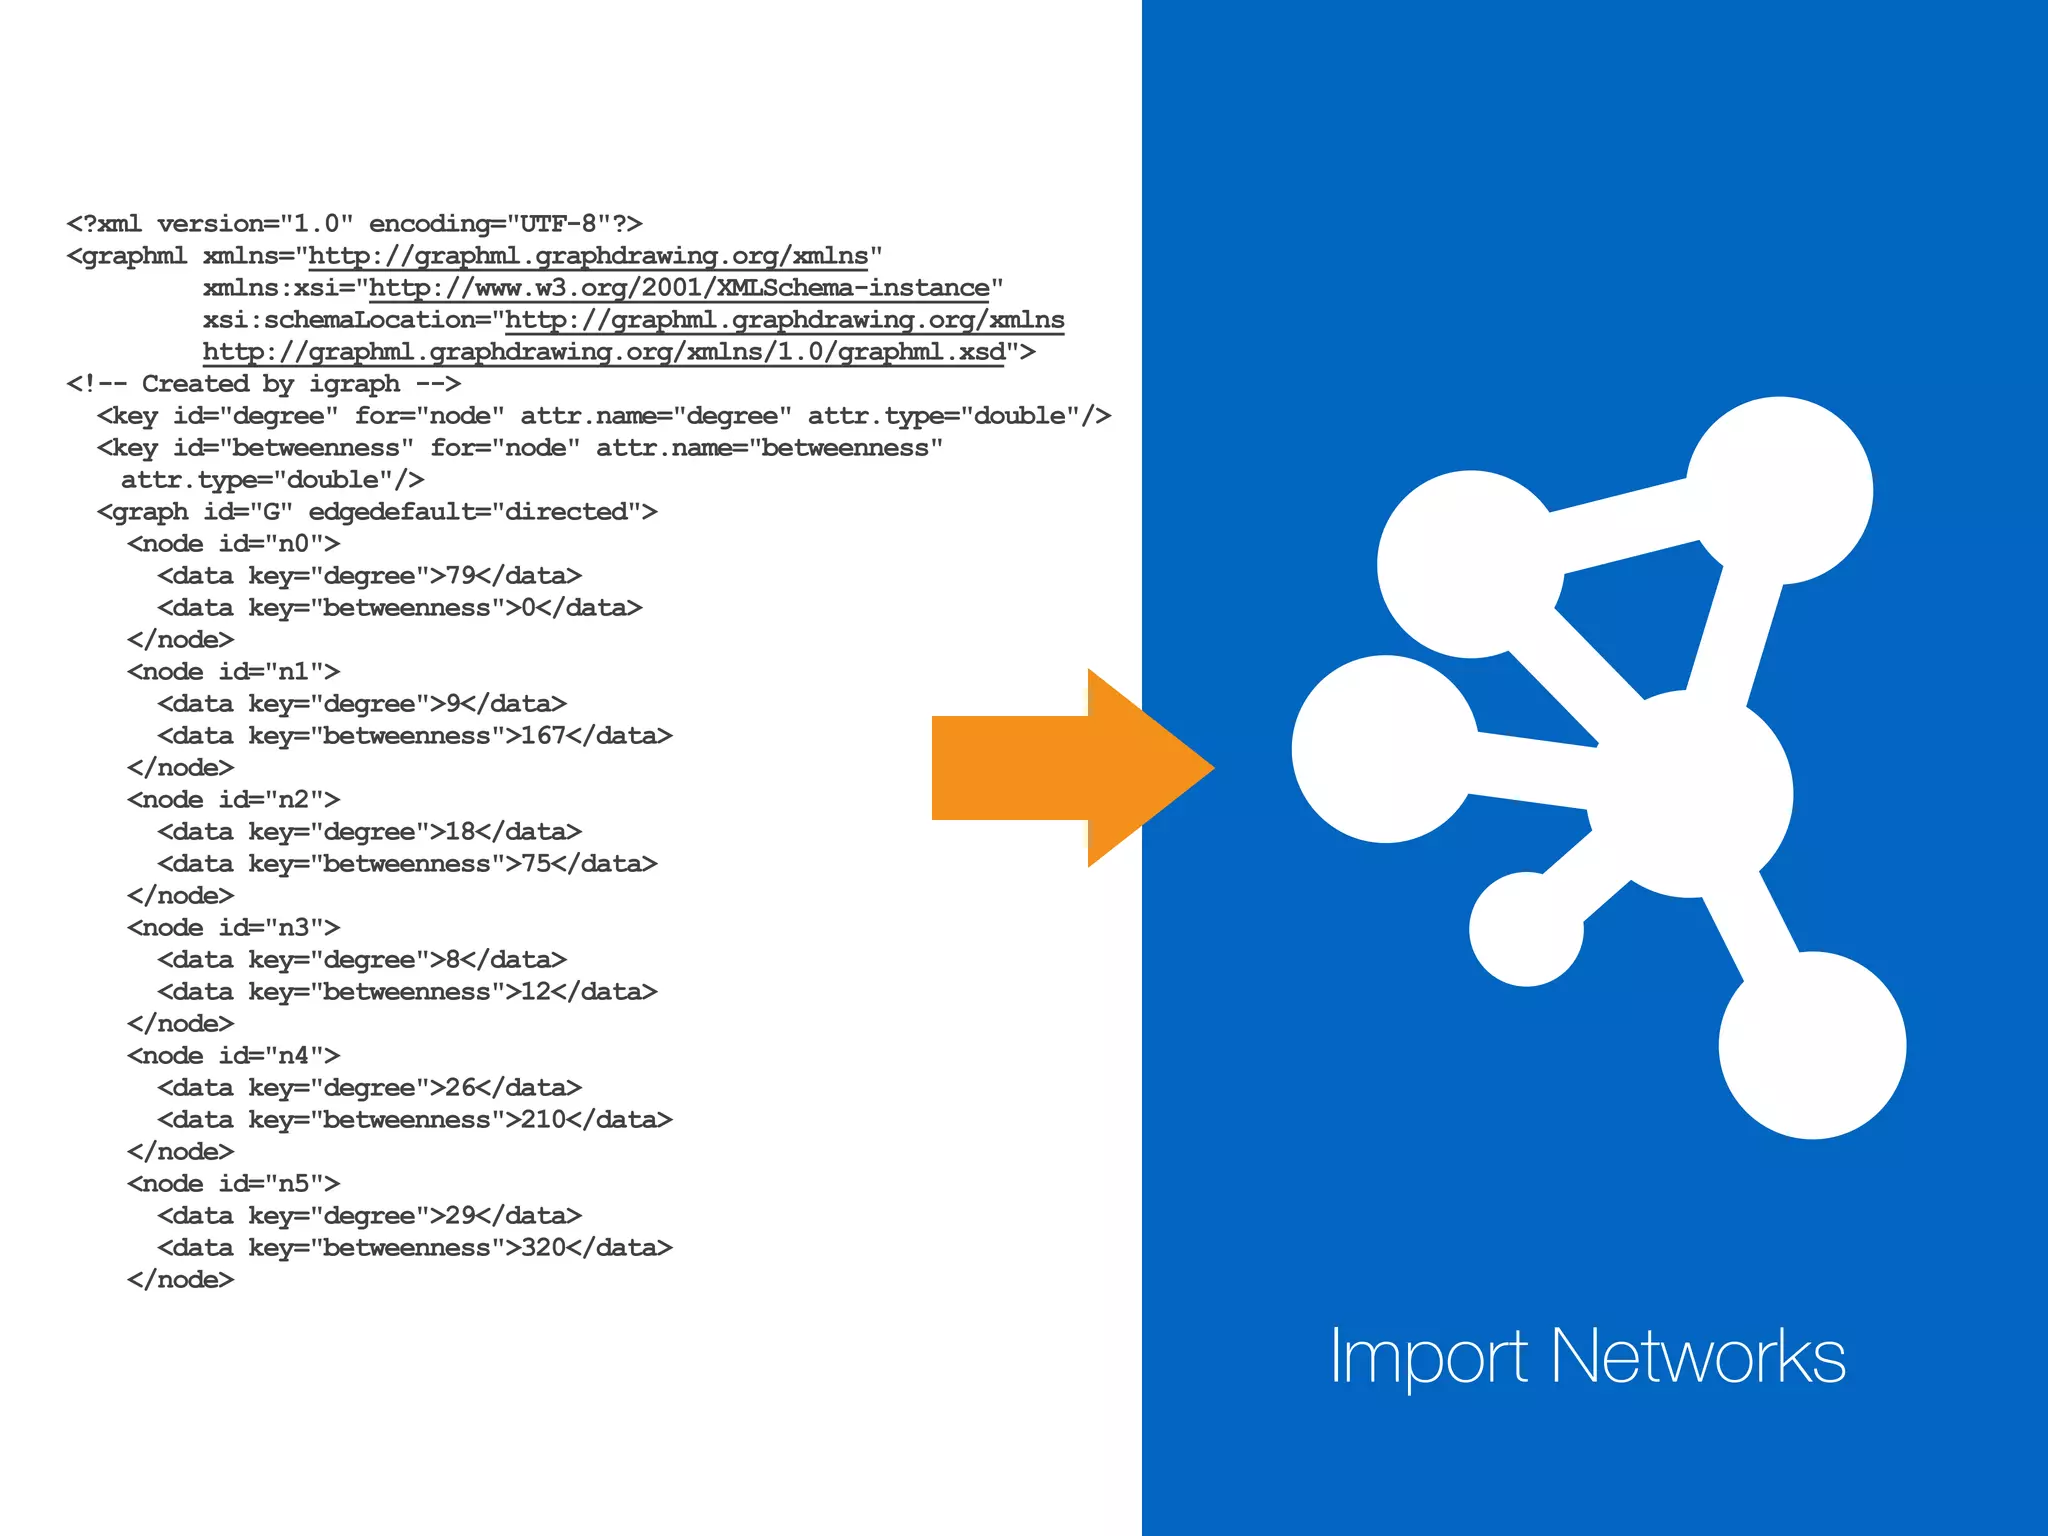
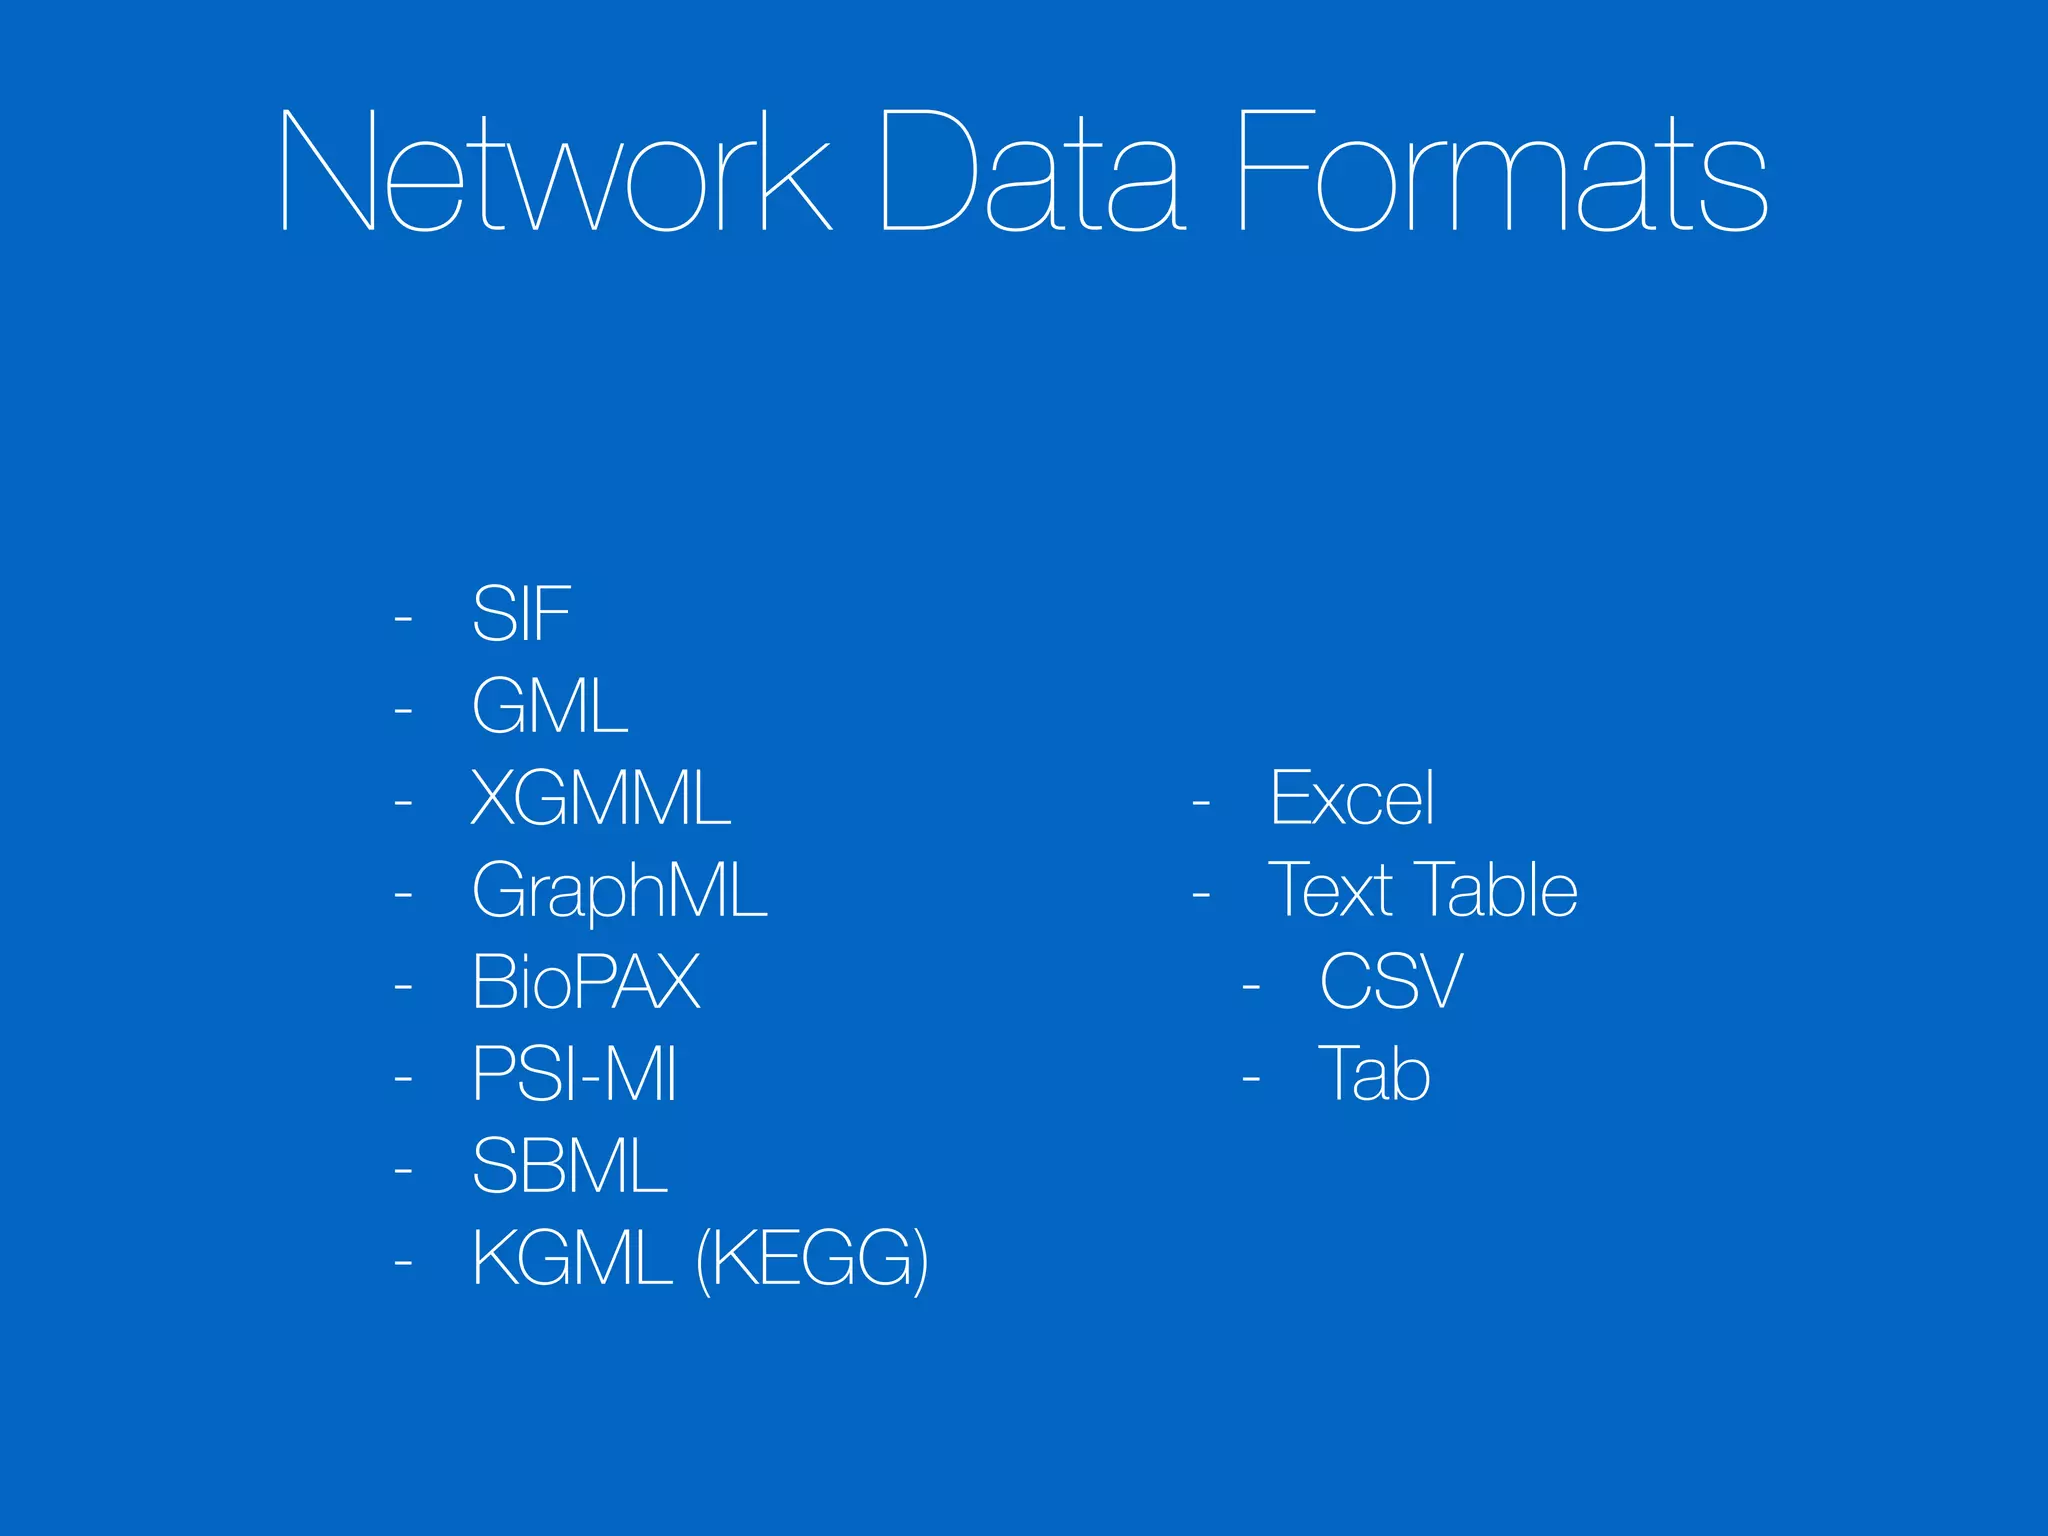
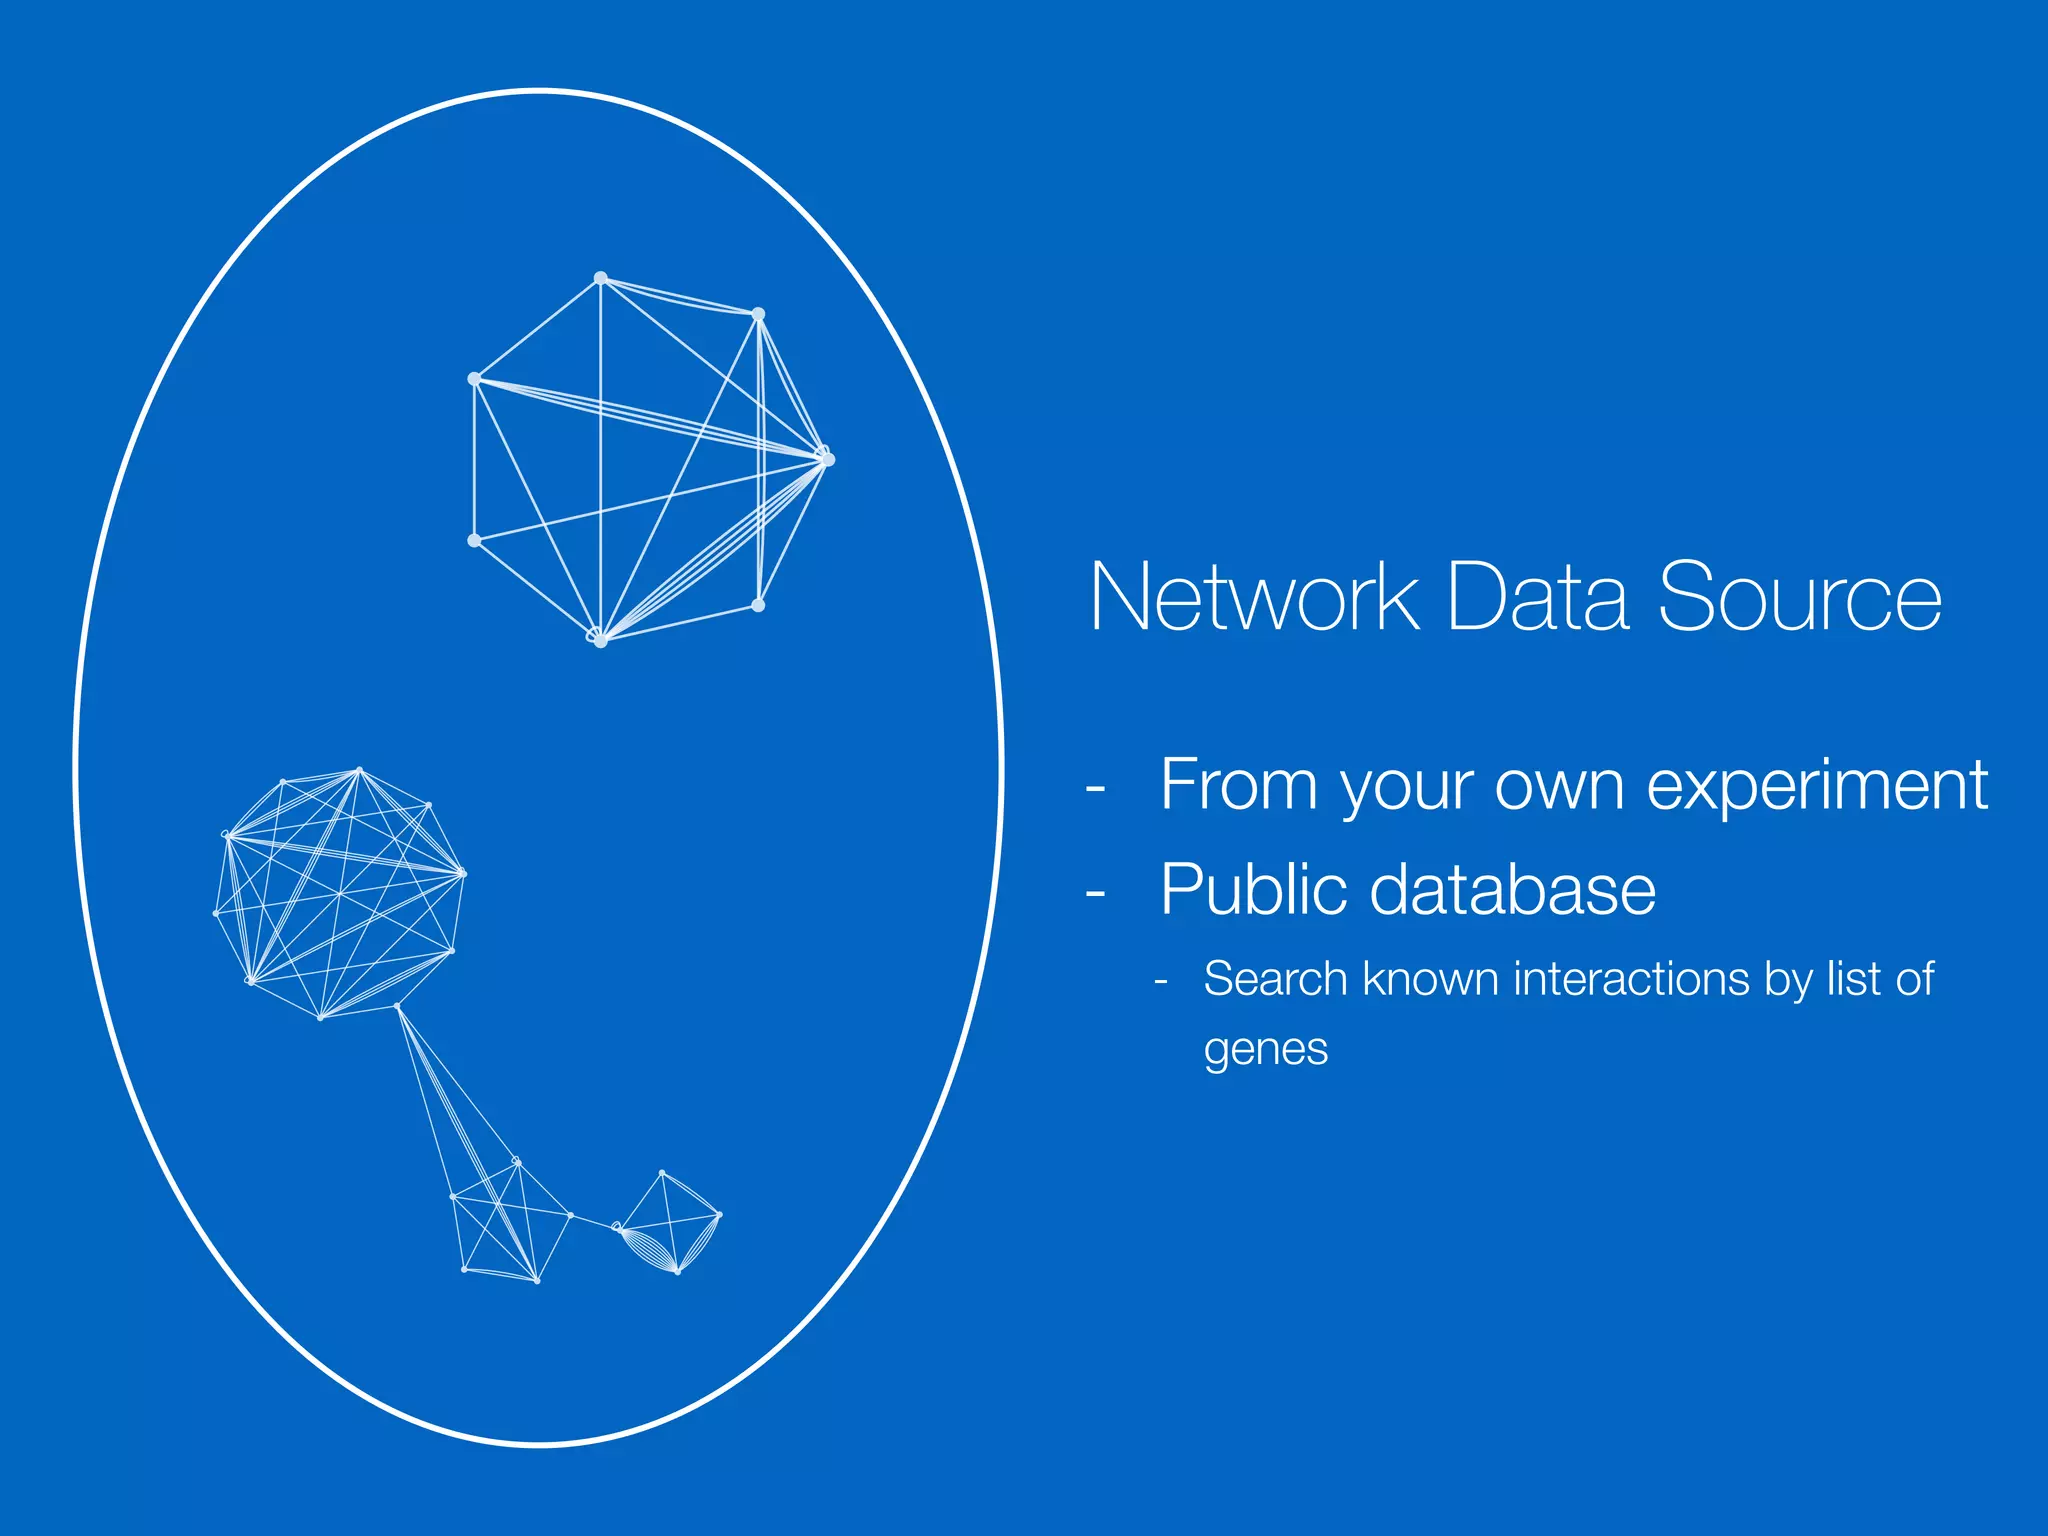
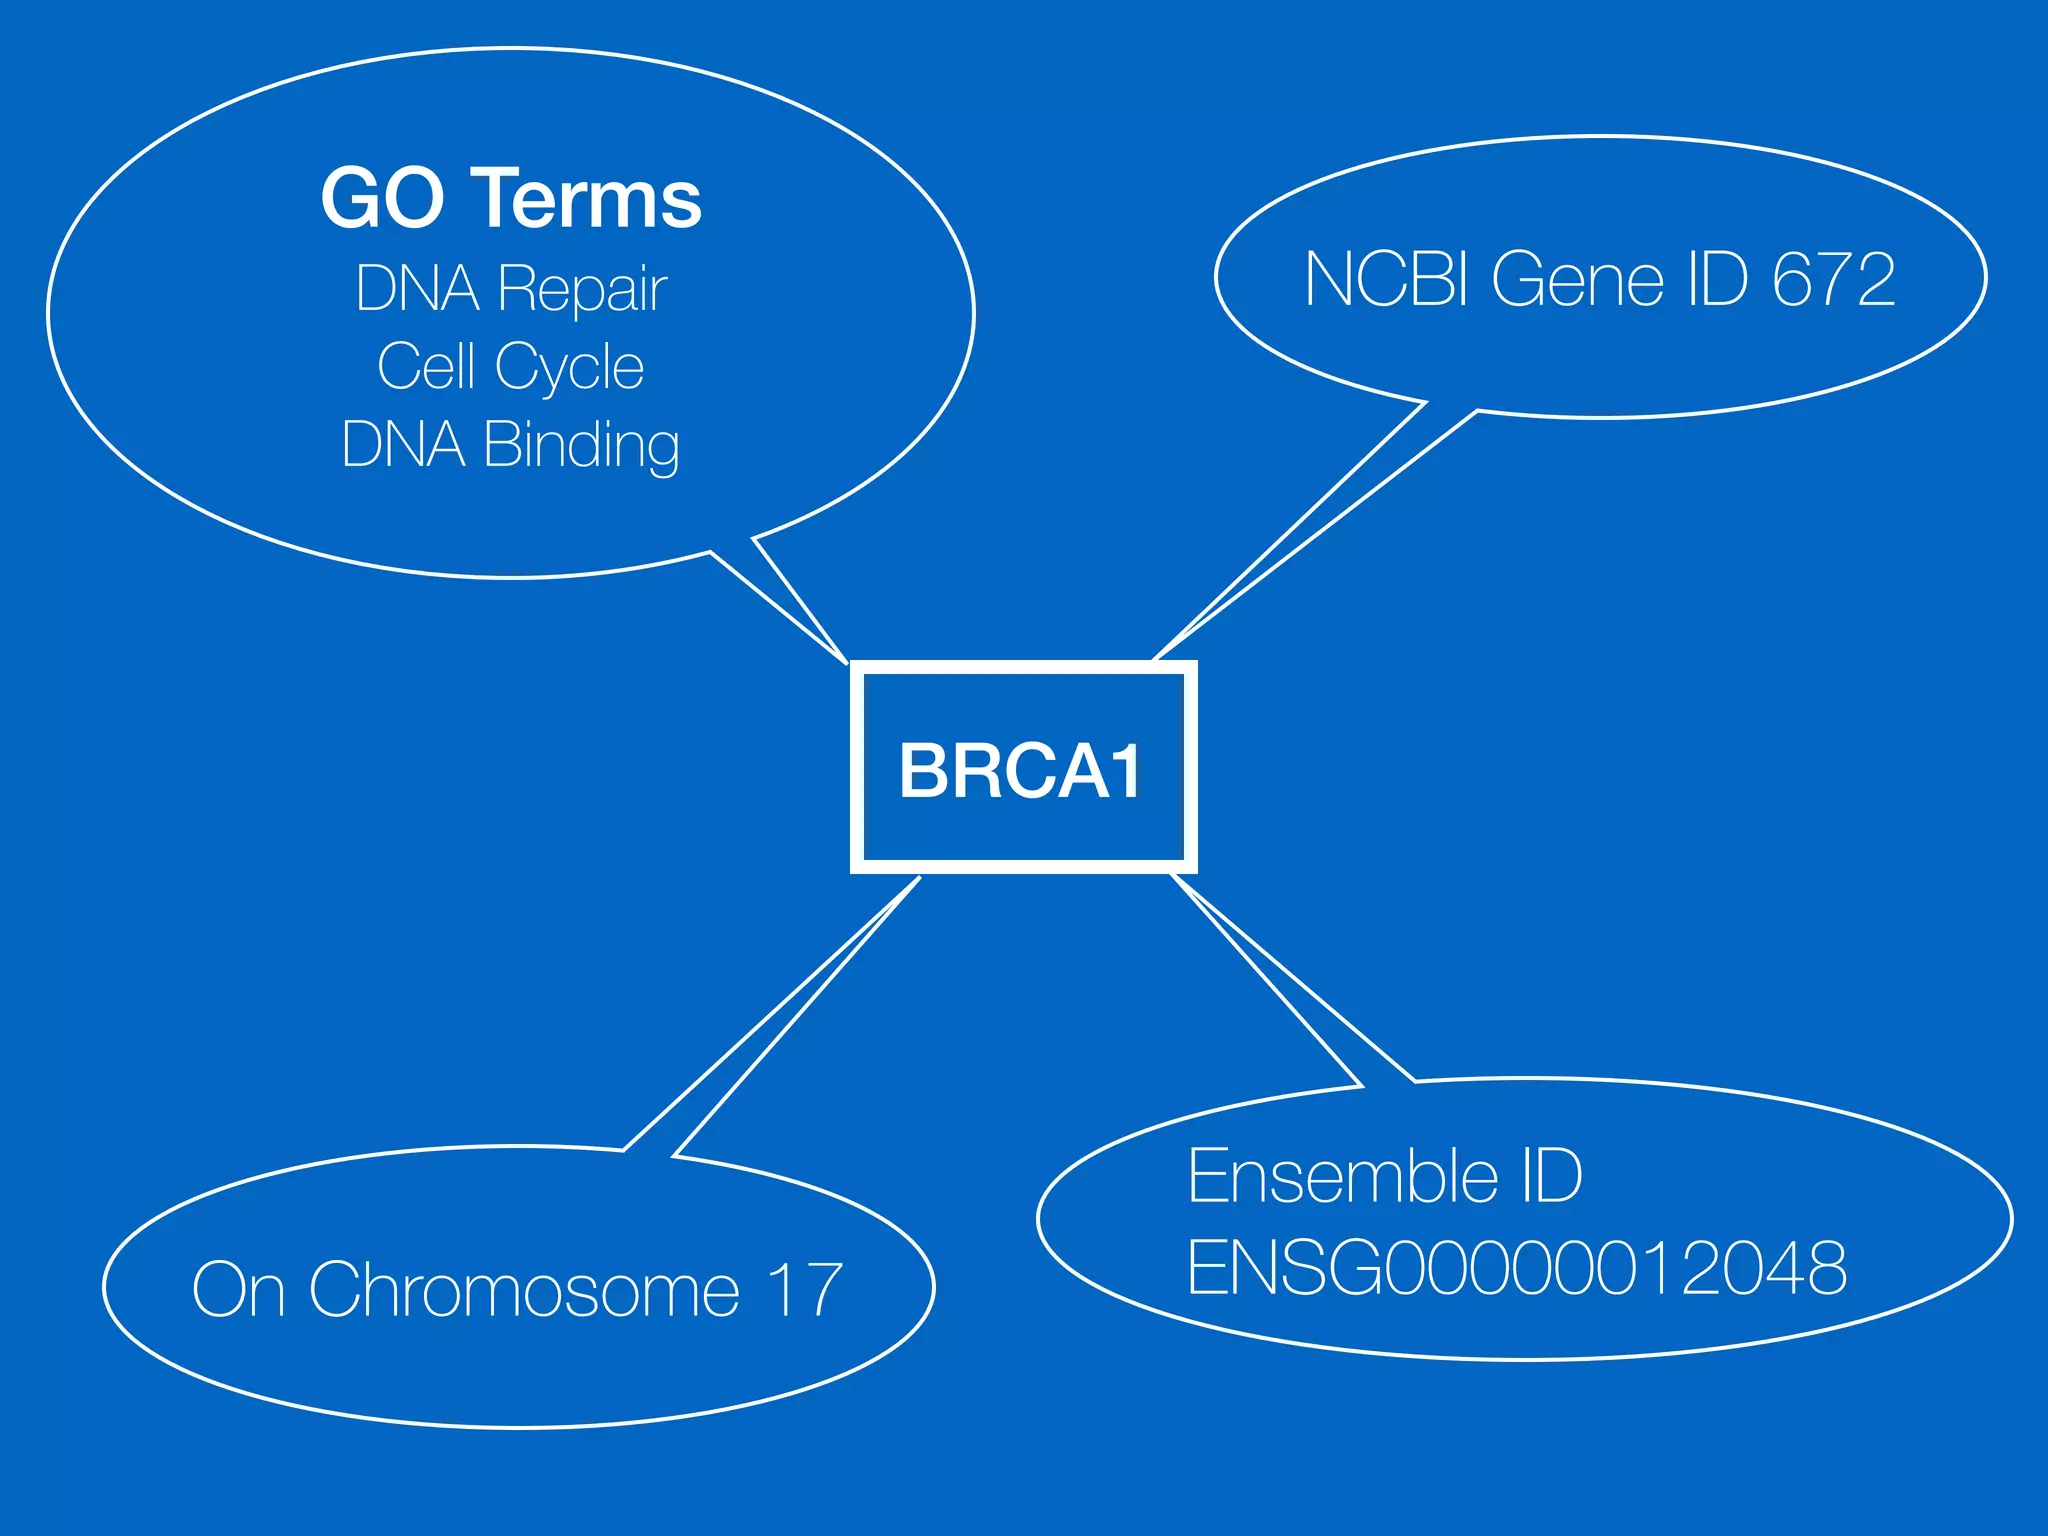
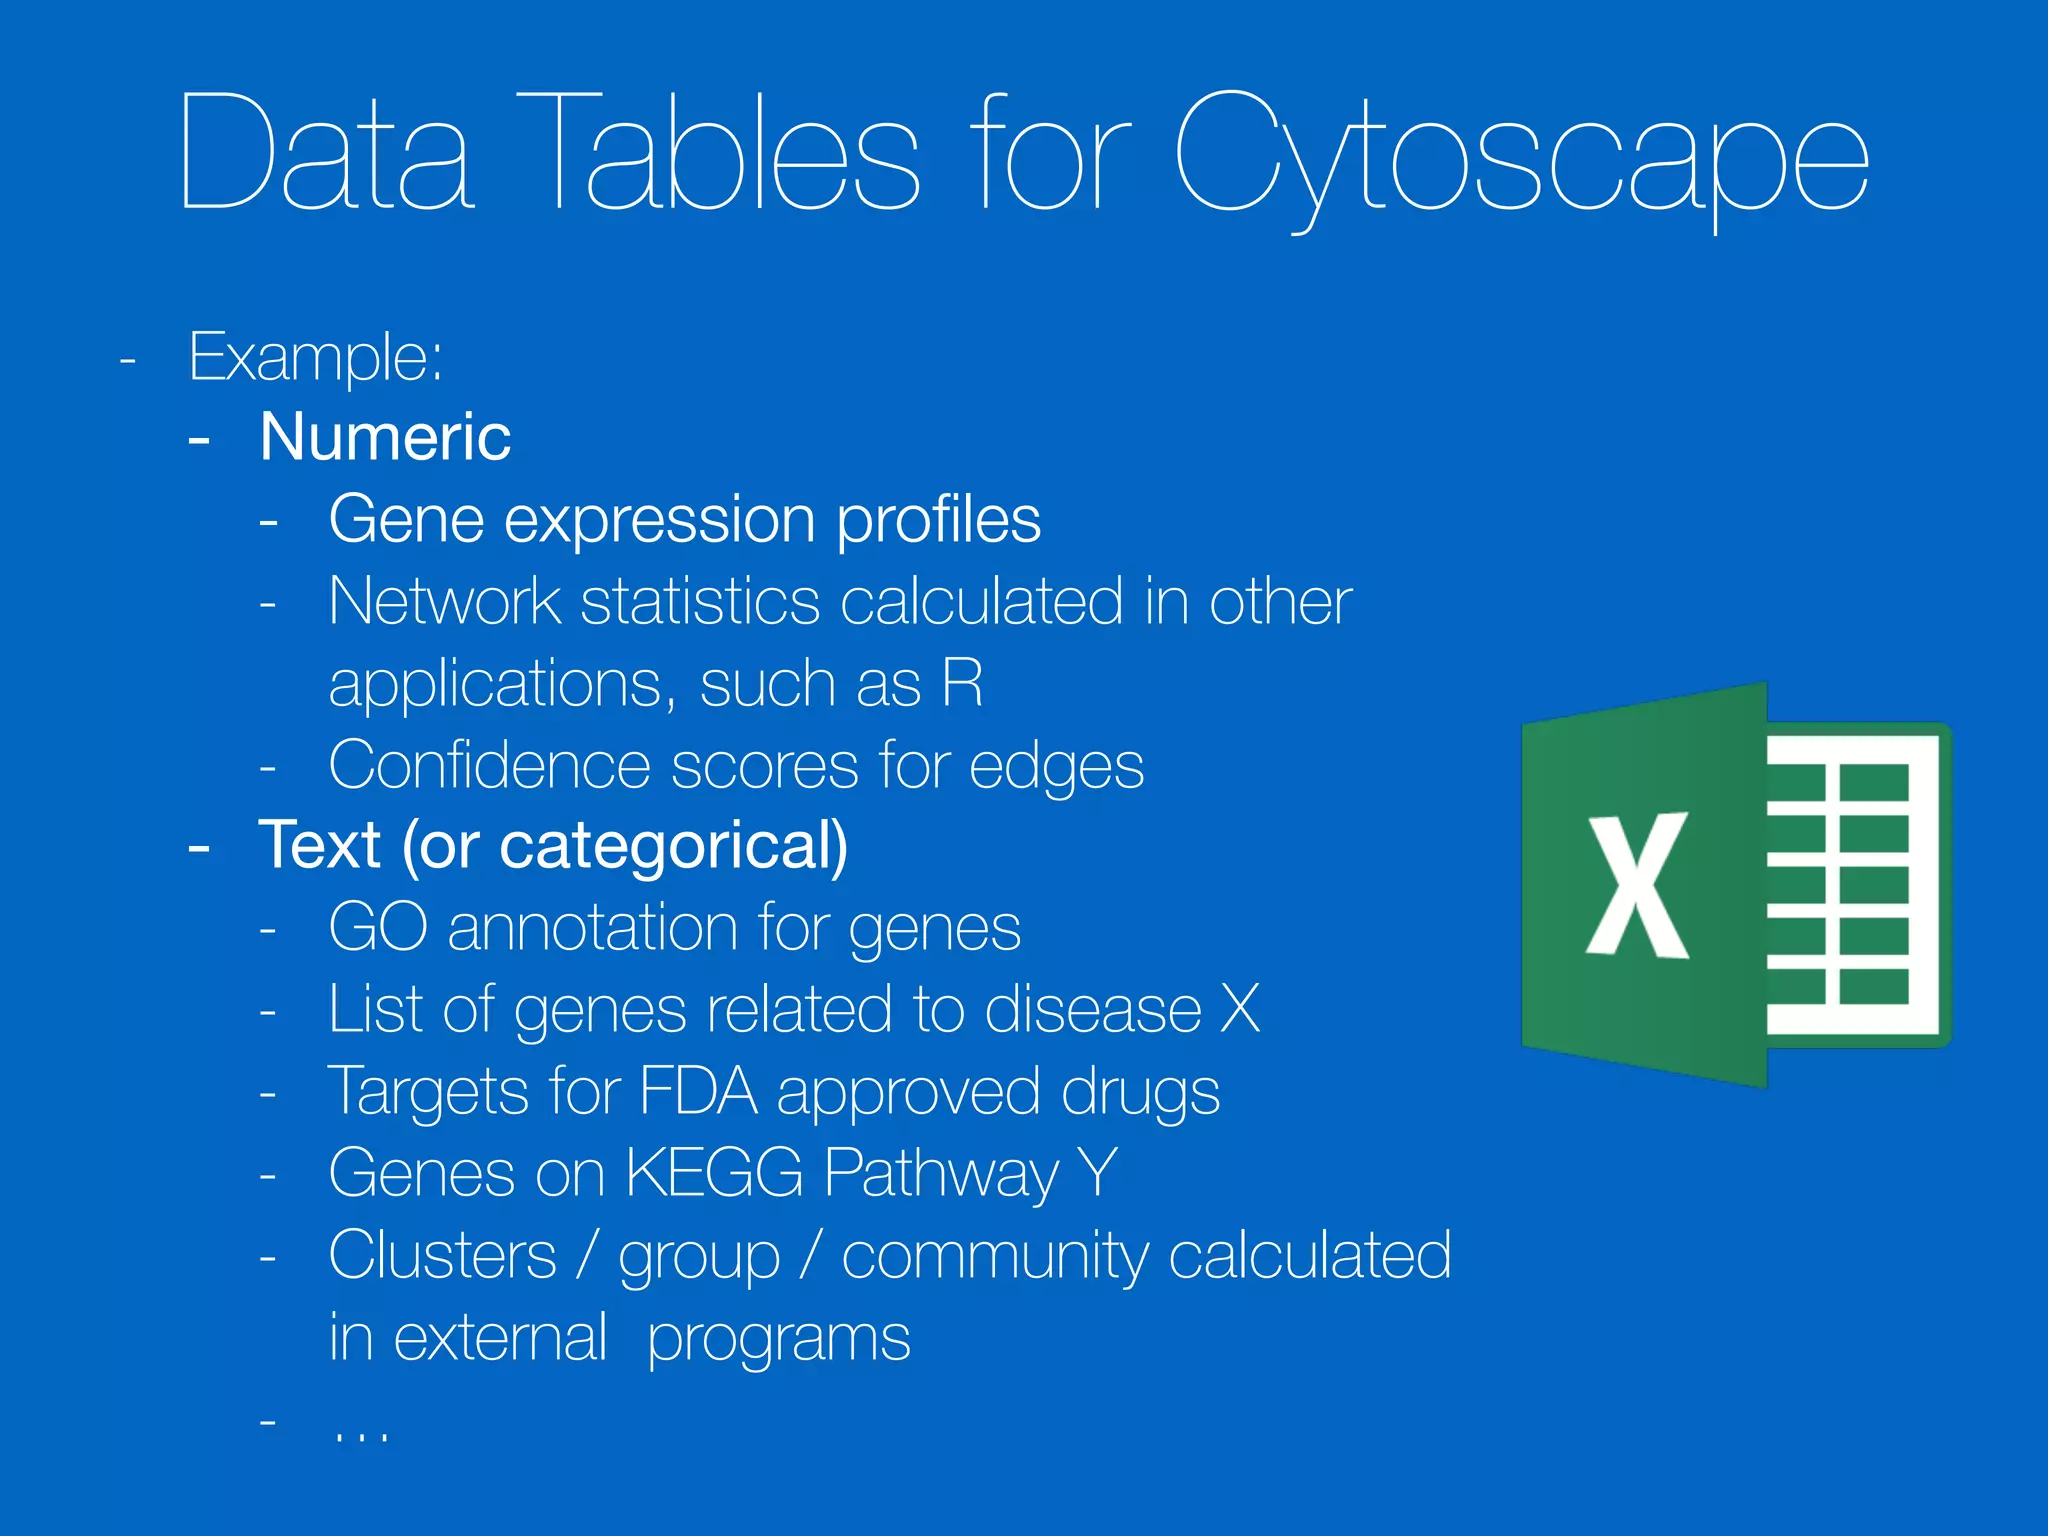
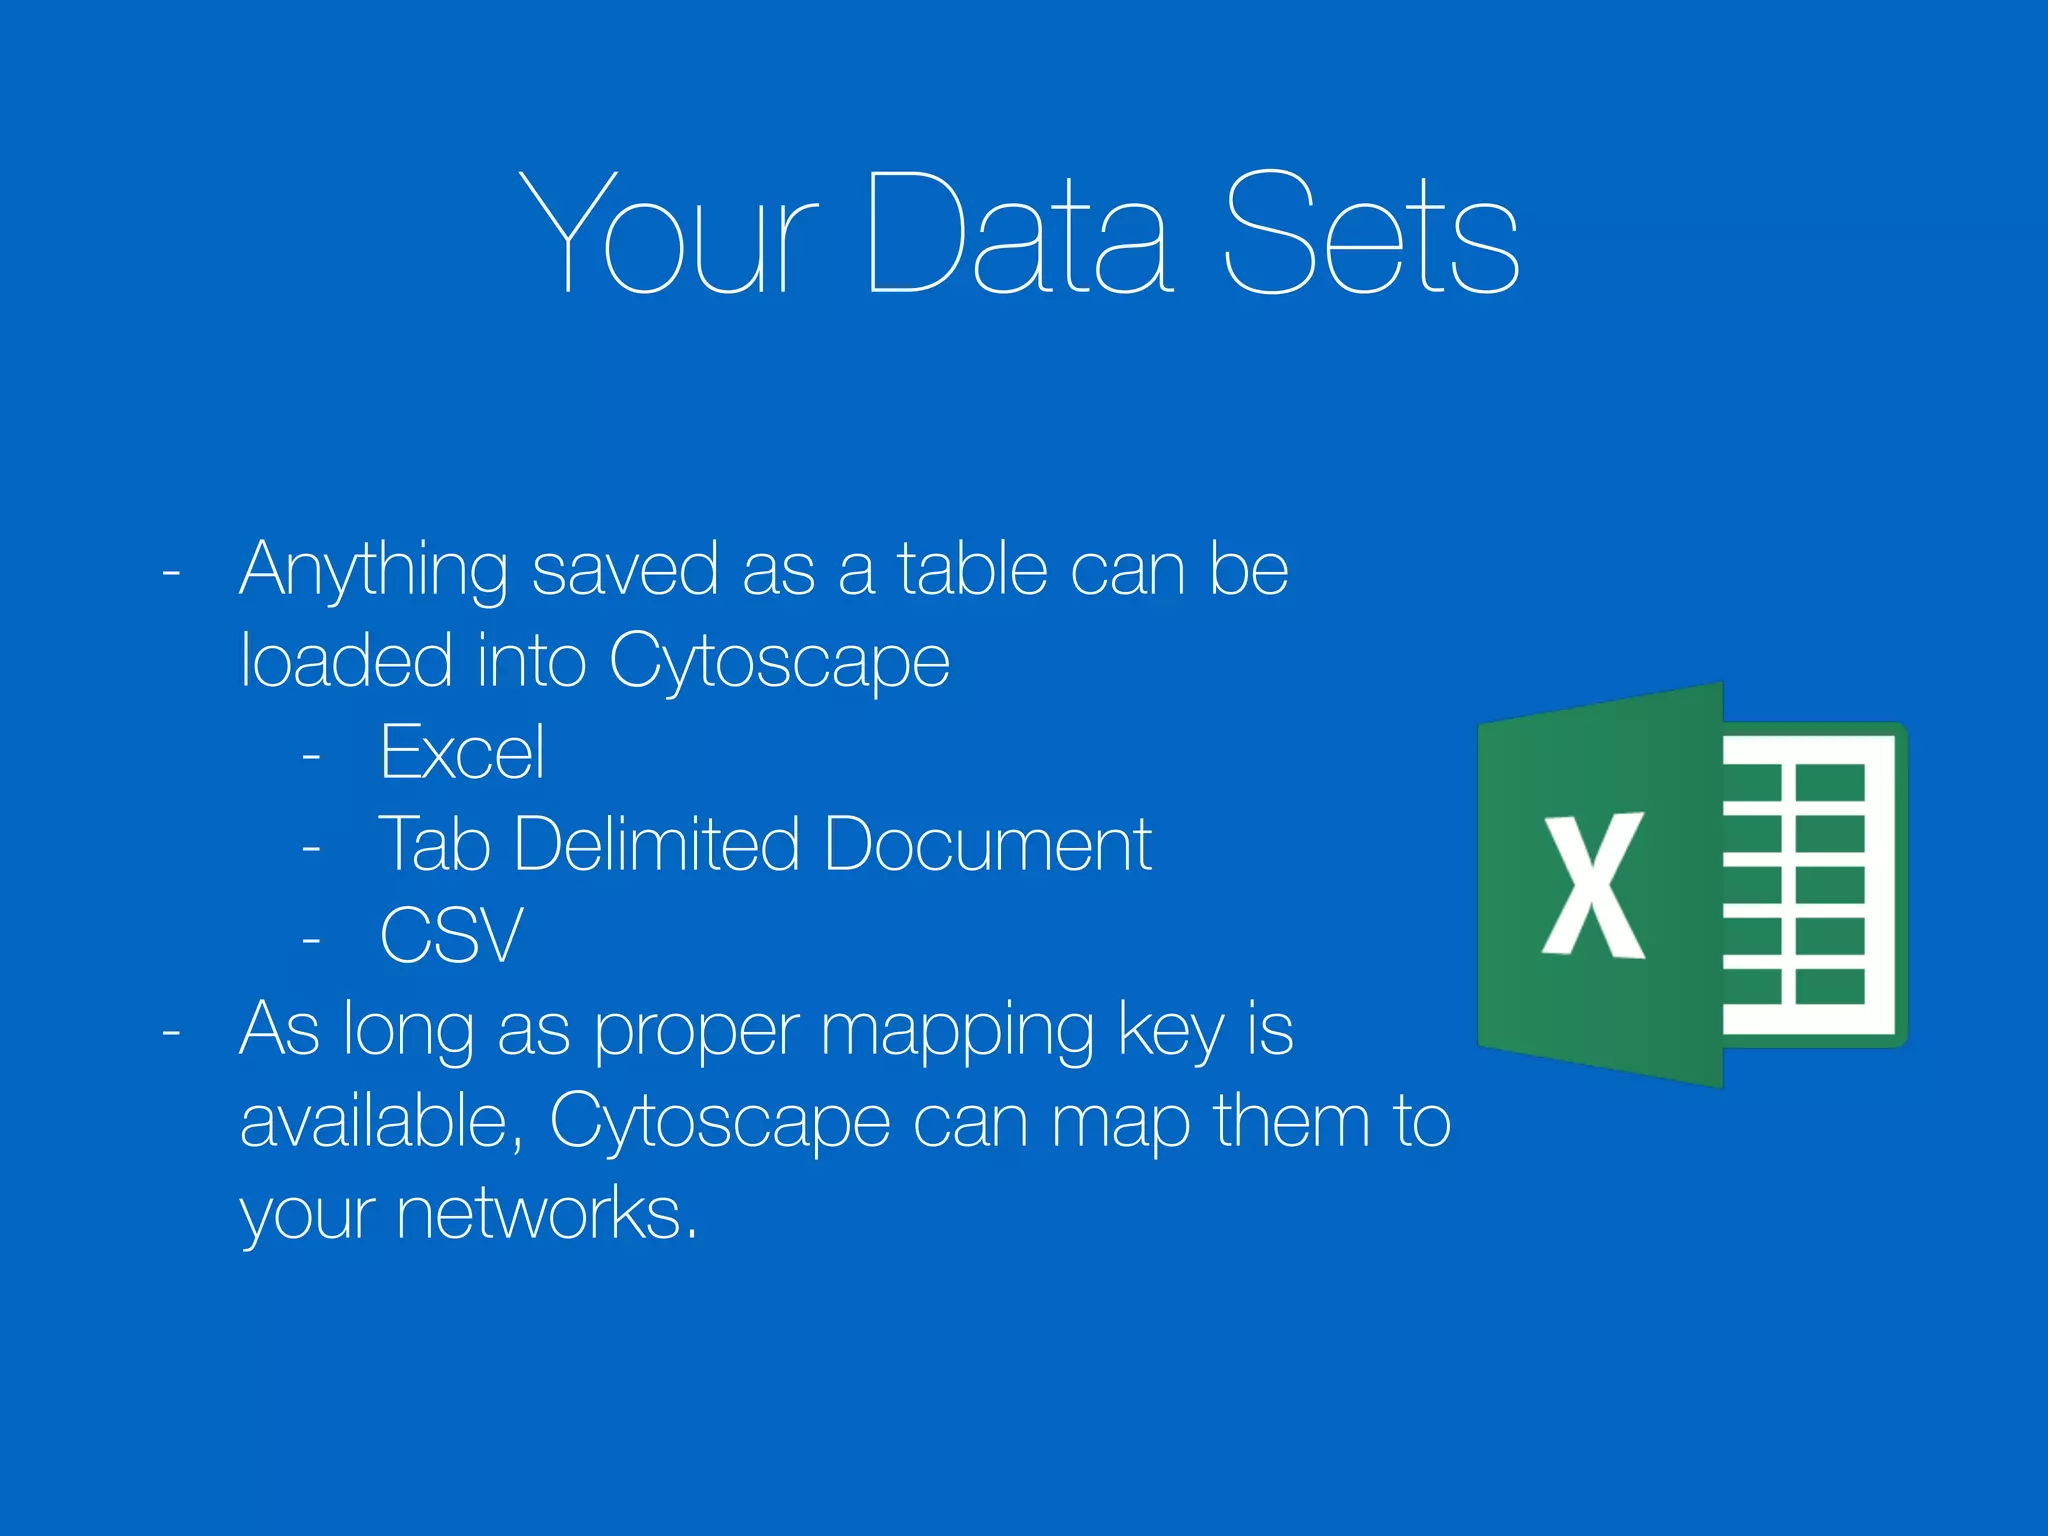
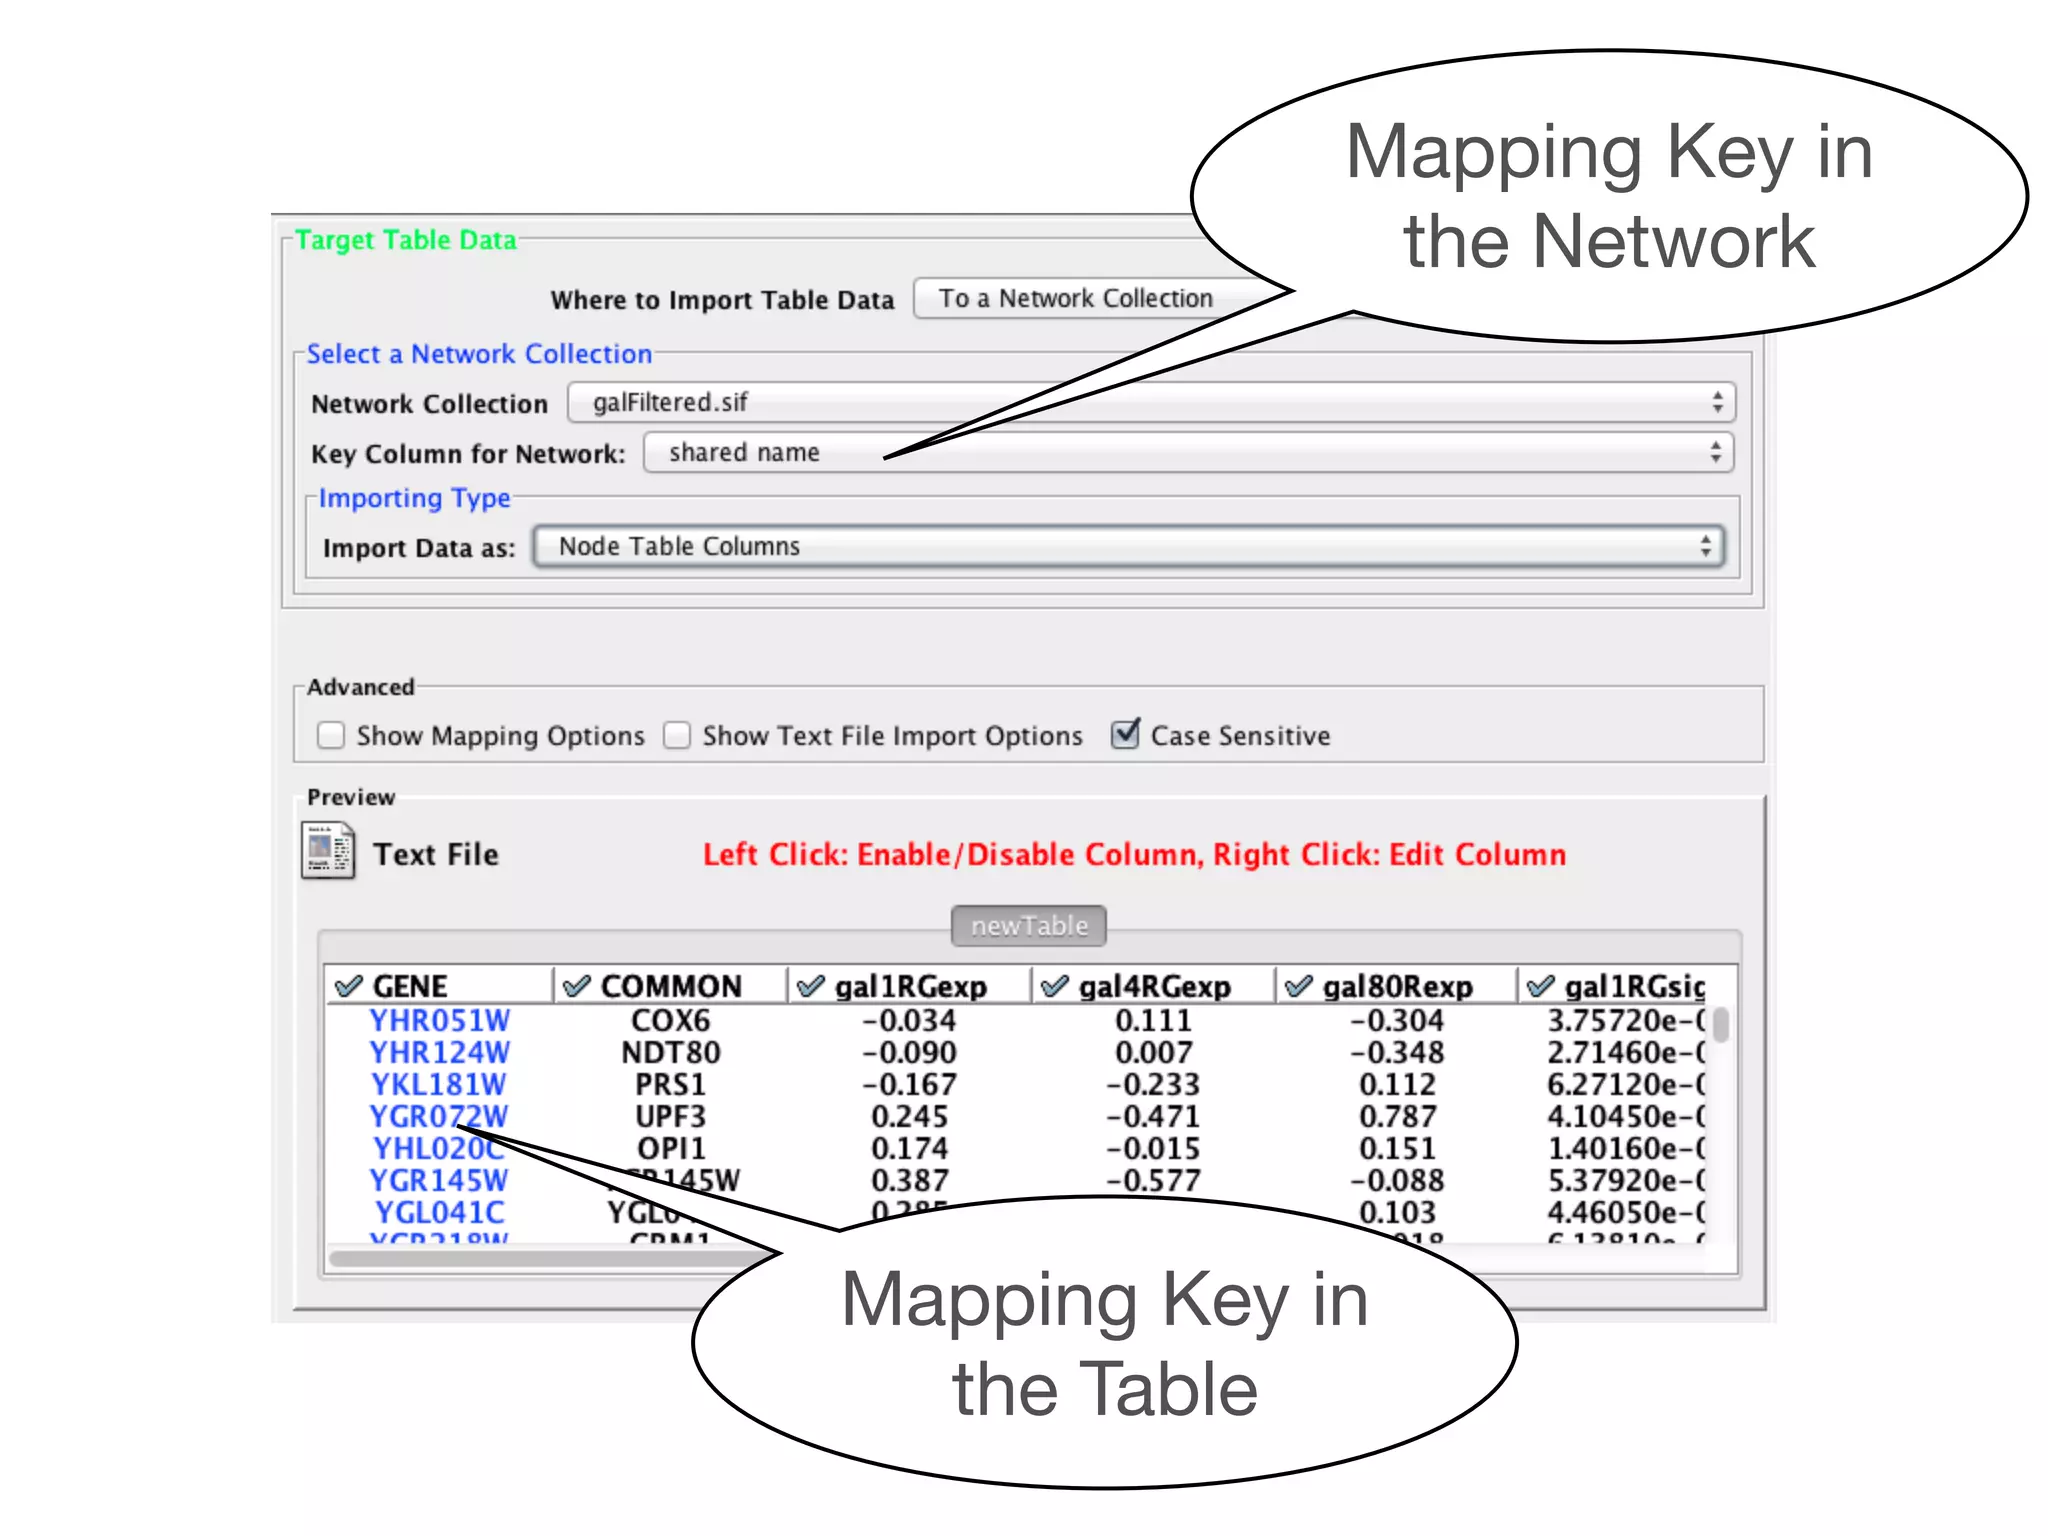
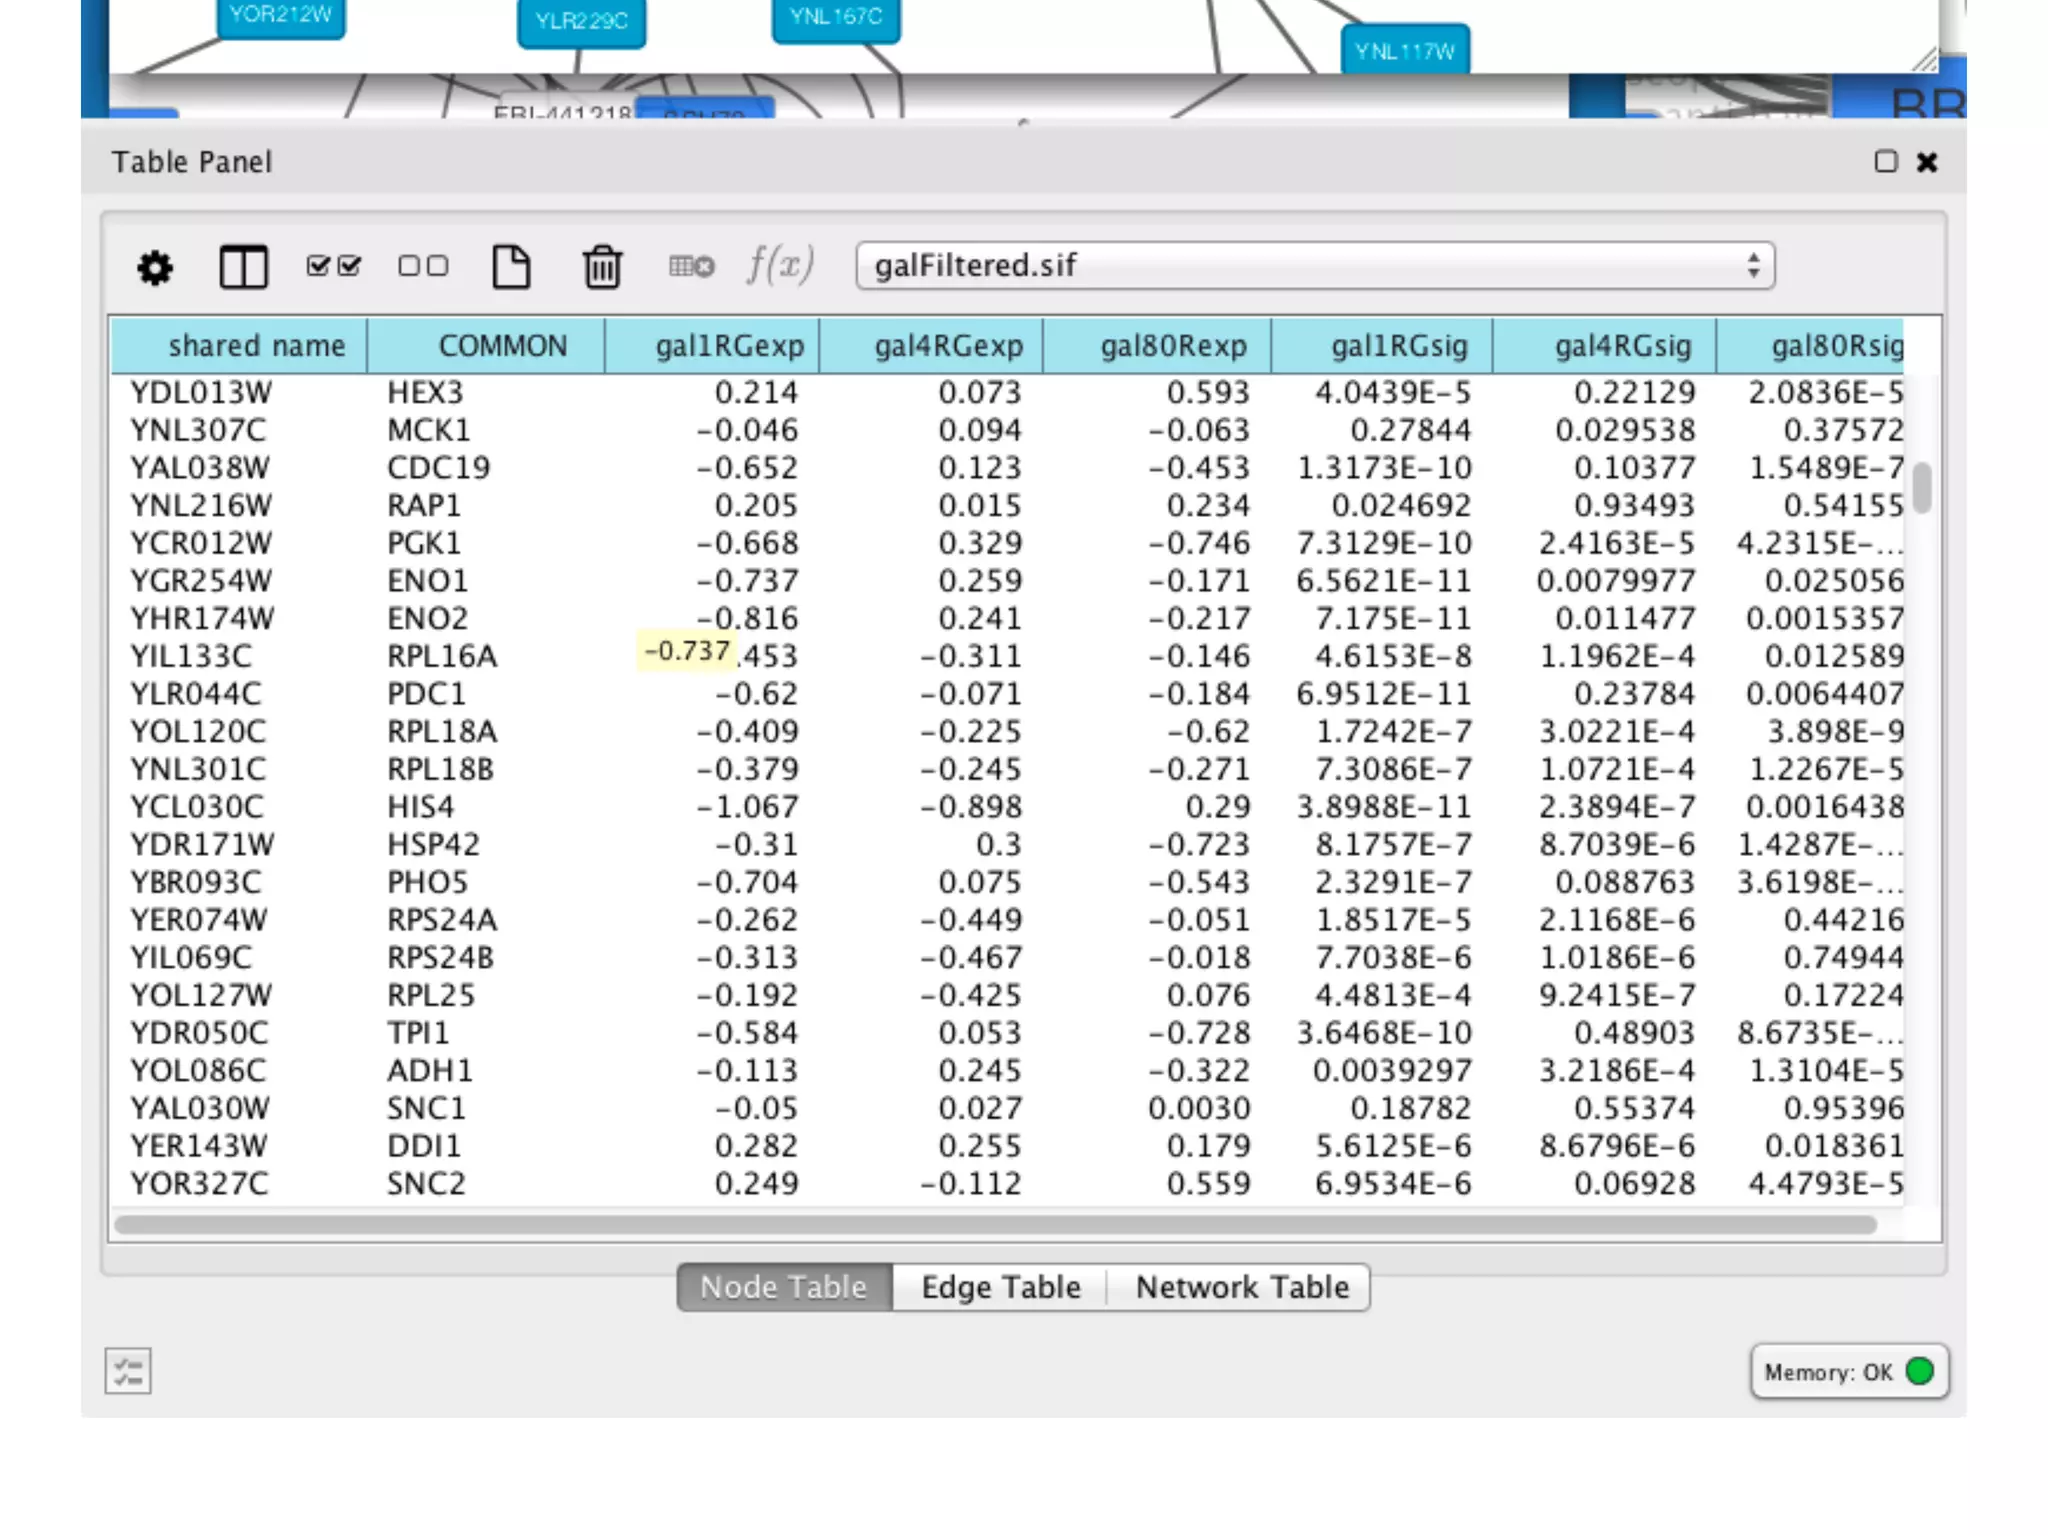
Details on network data formats and sources; emphasizes compatibility and various types of data inputs that Cytoscape supports.
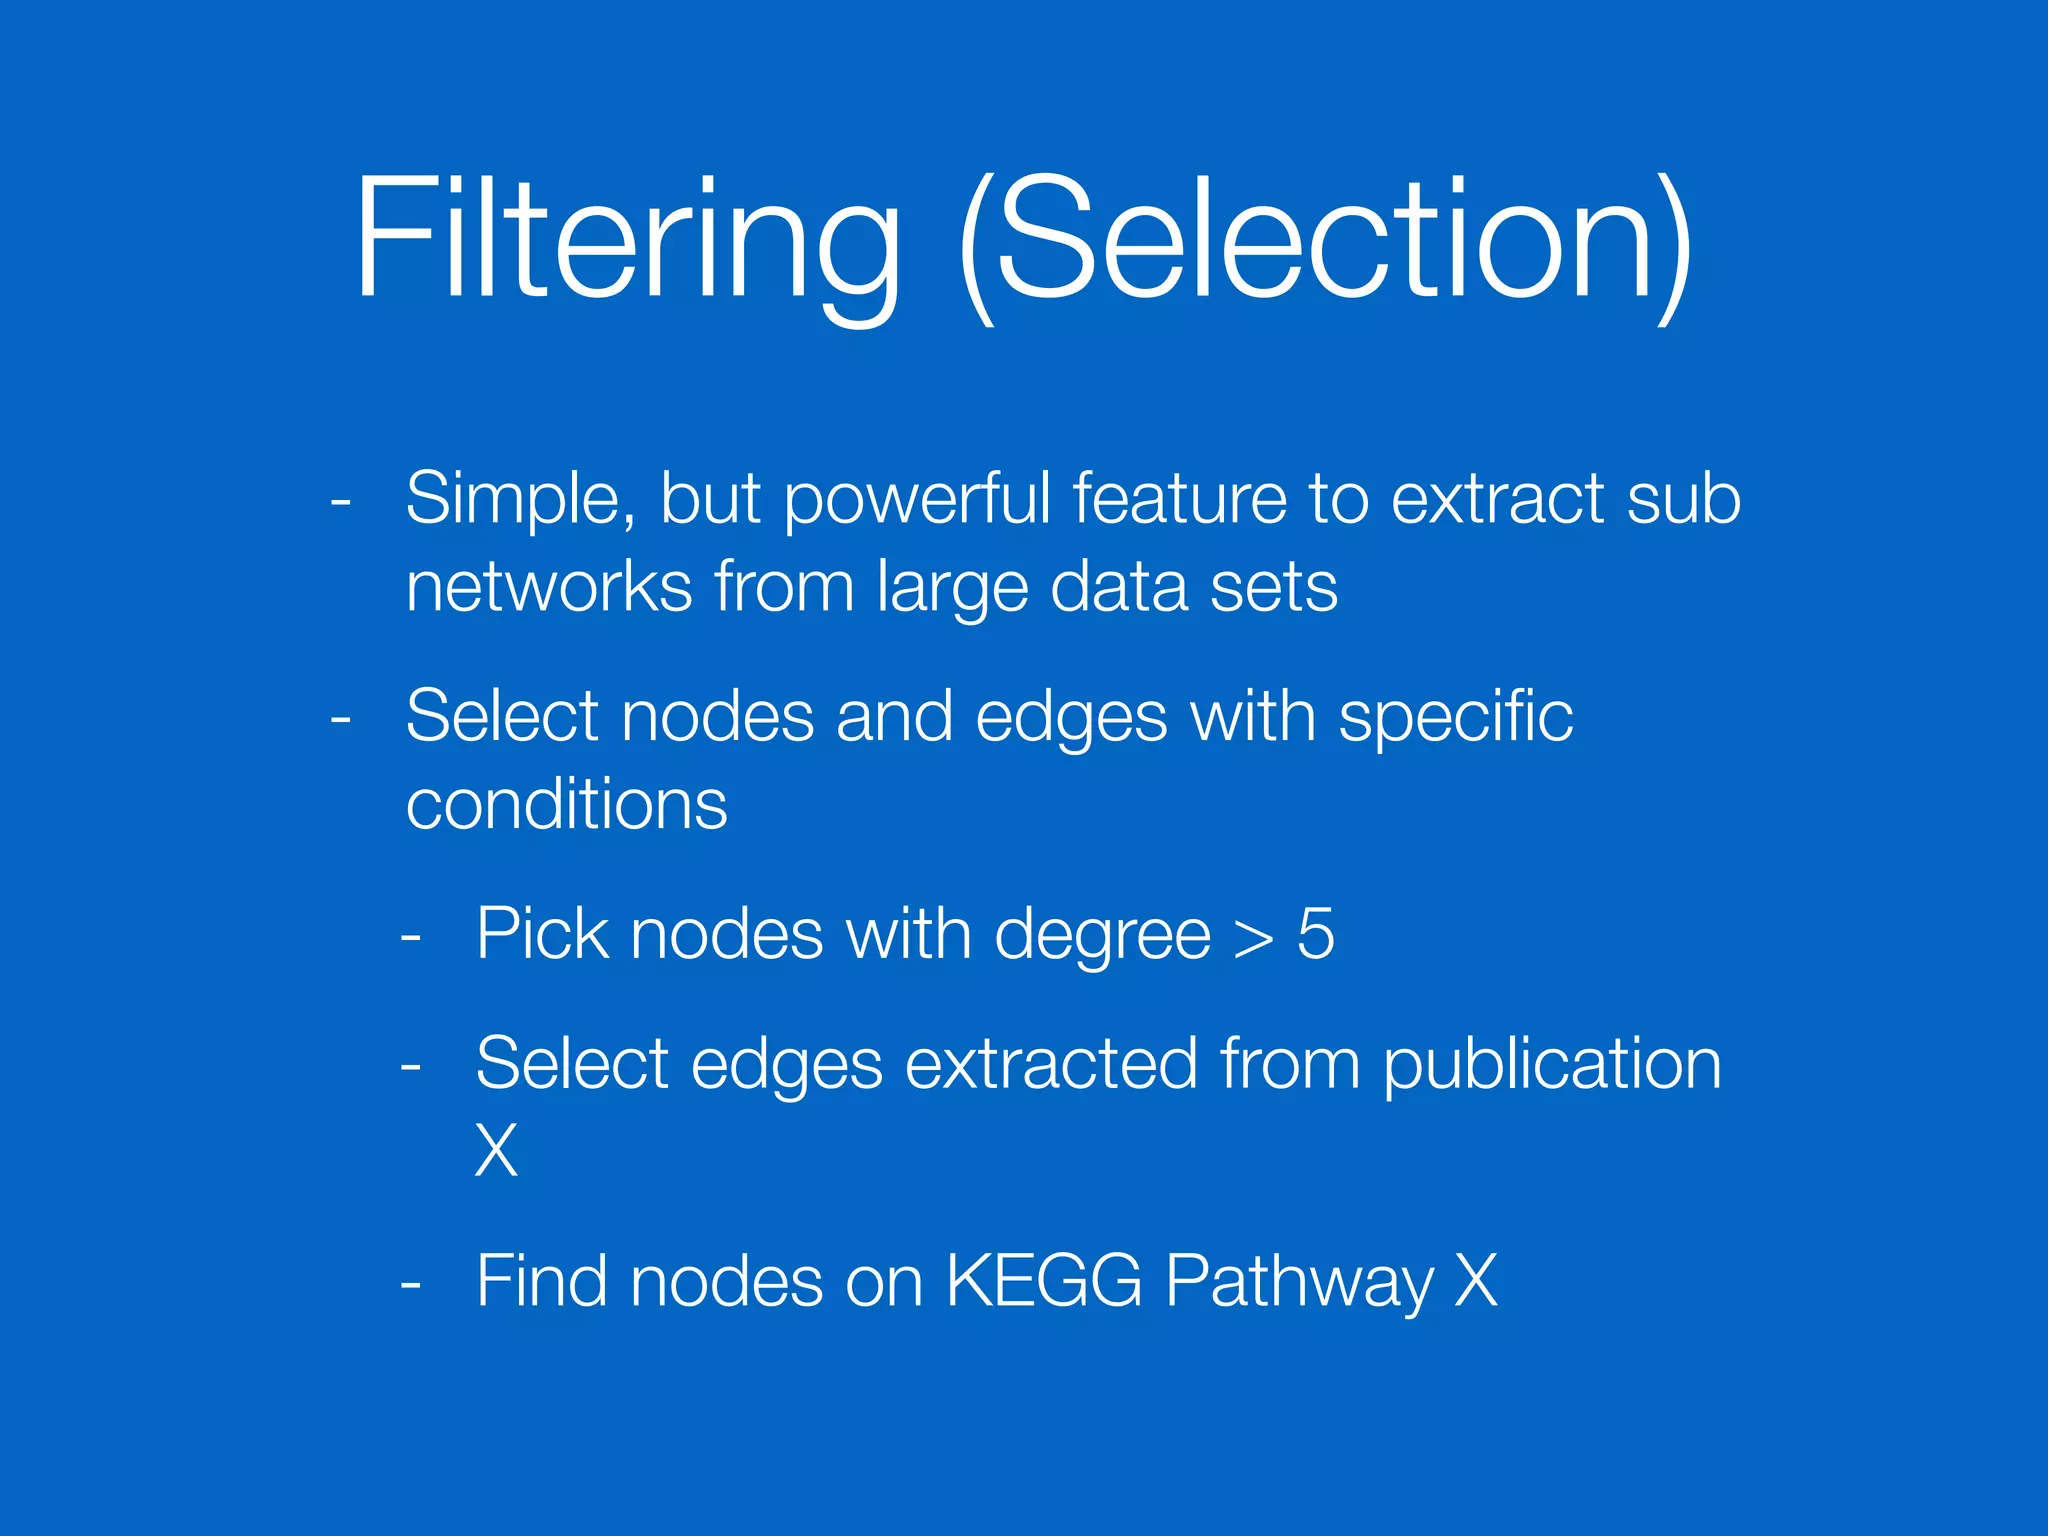
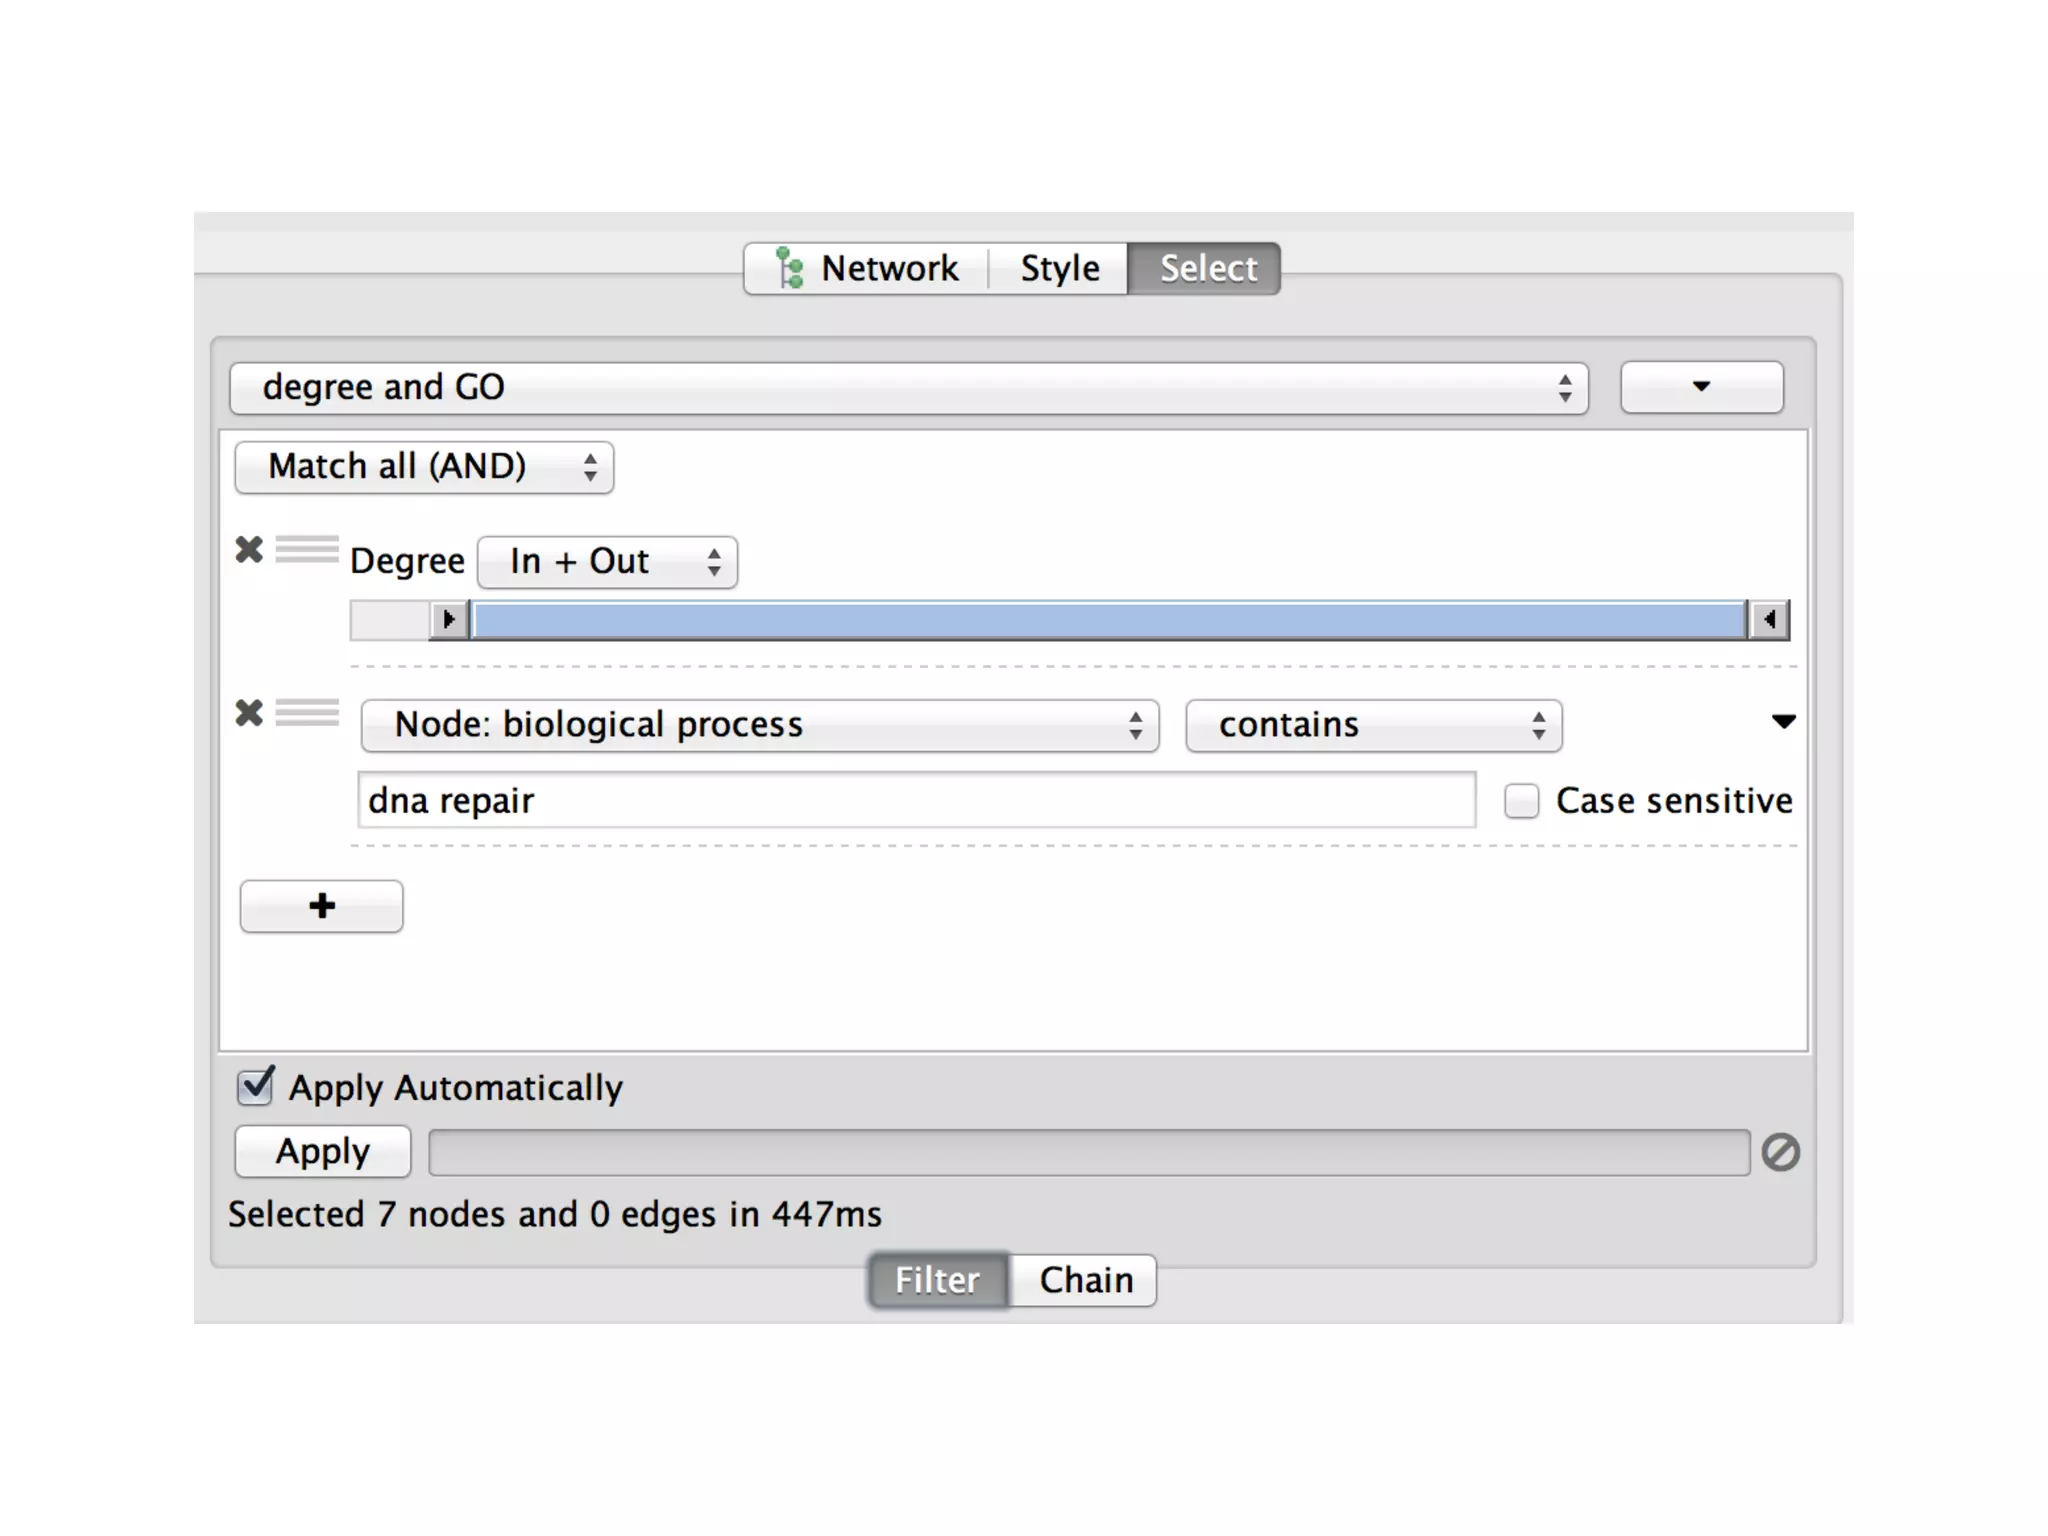
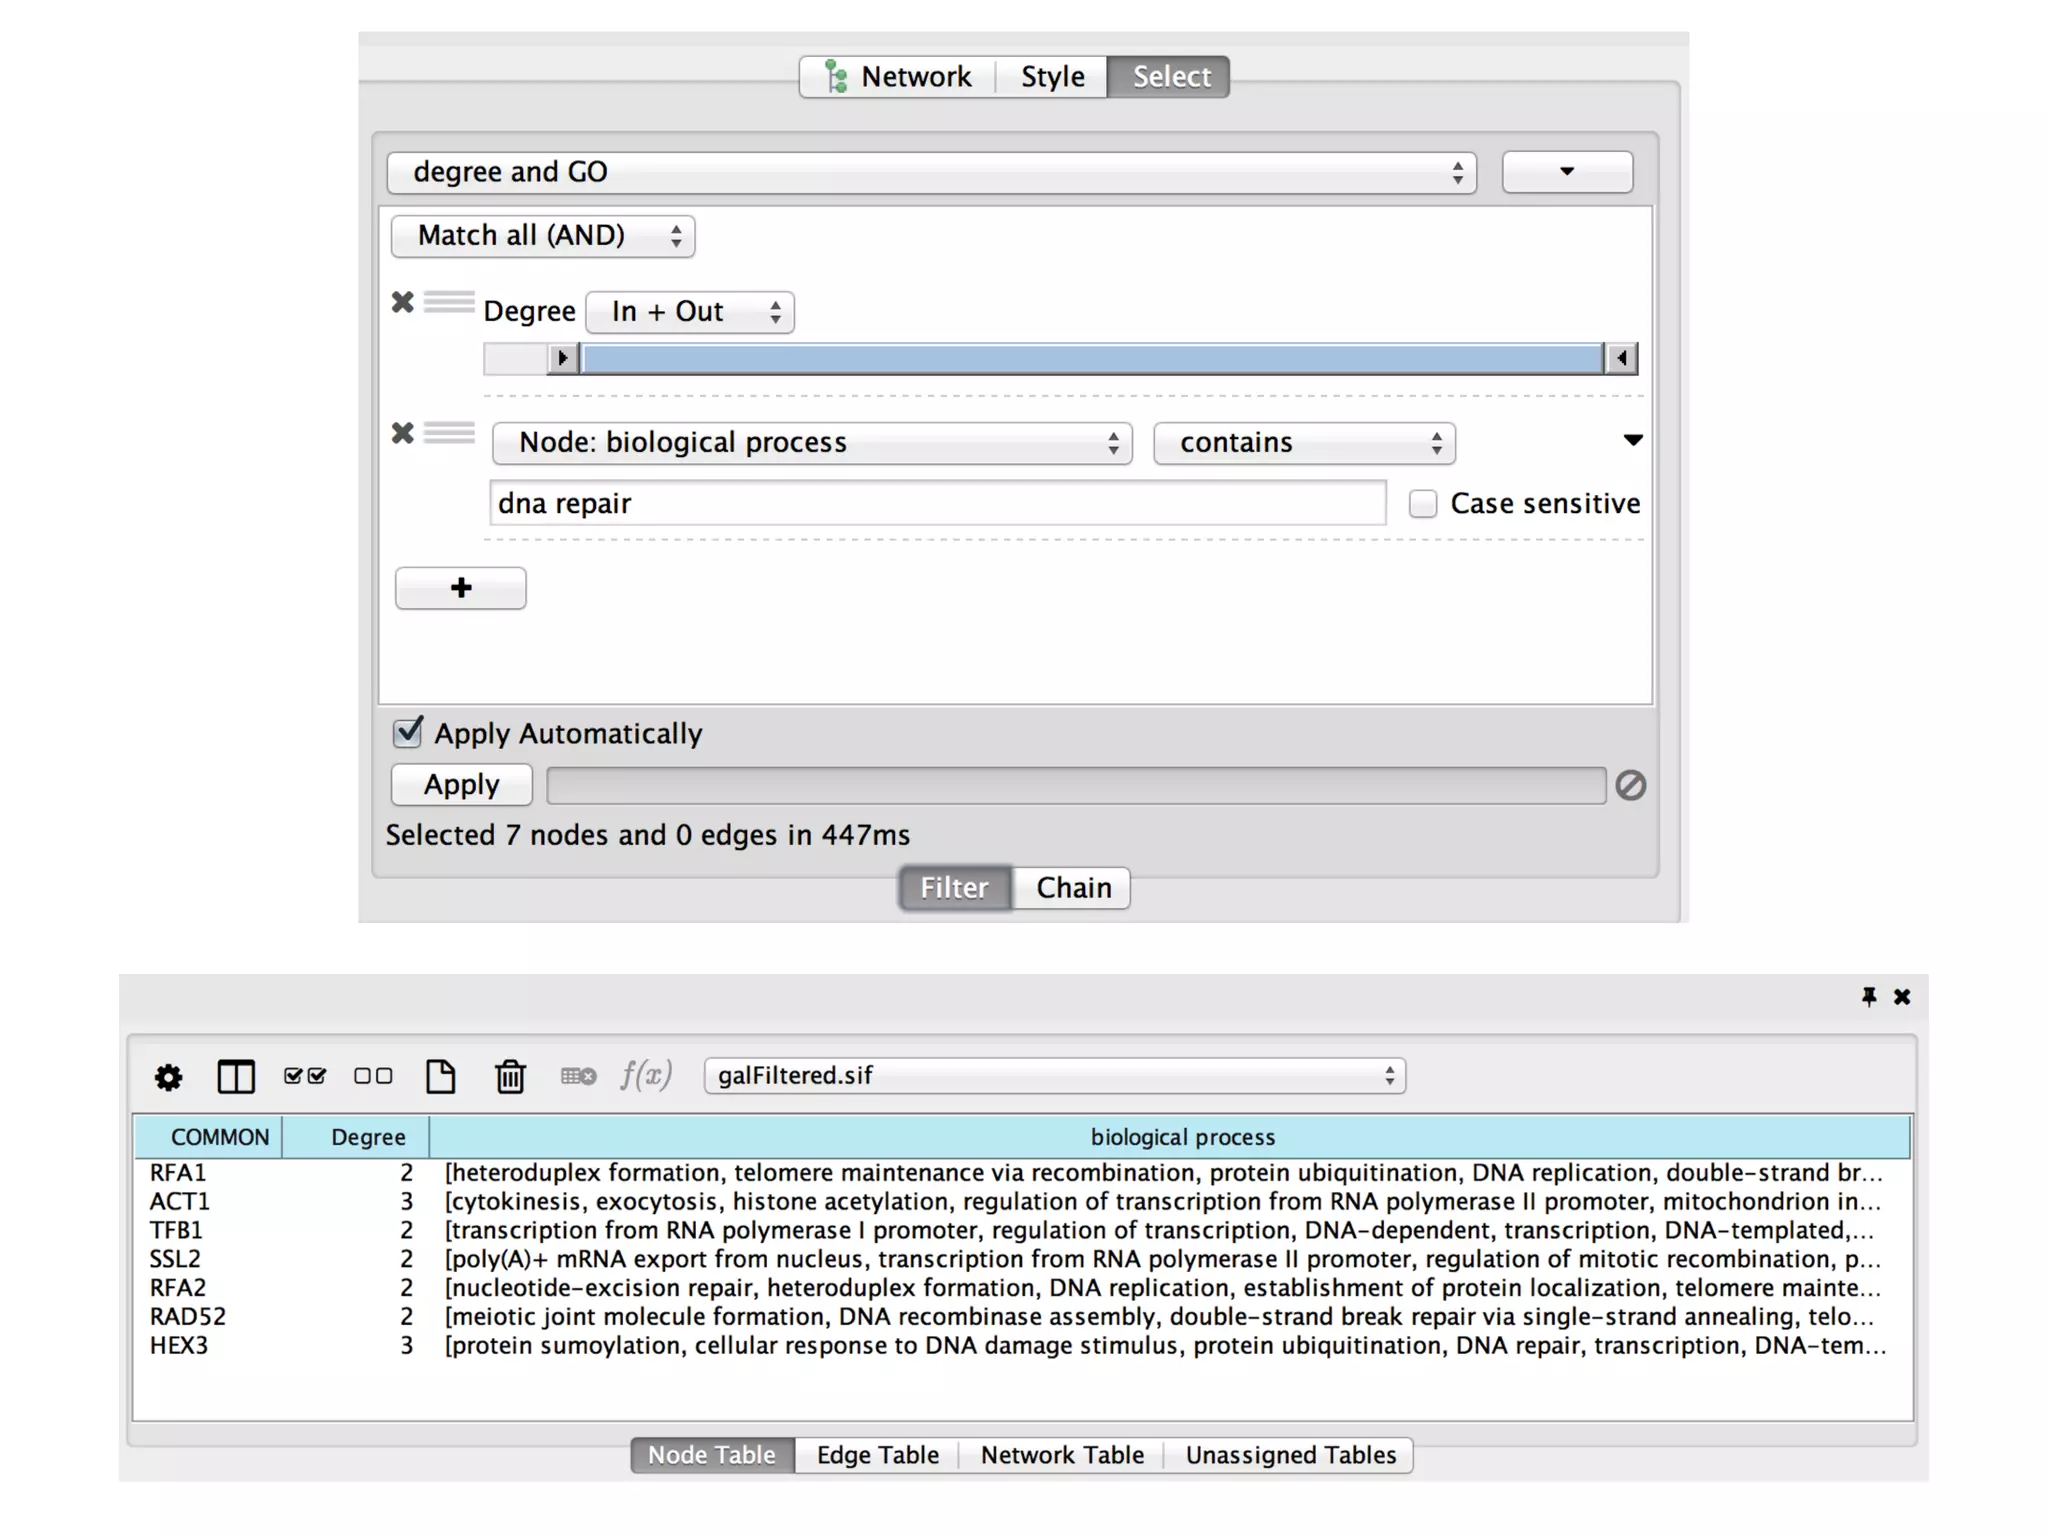
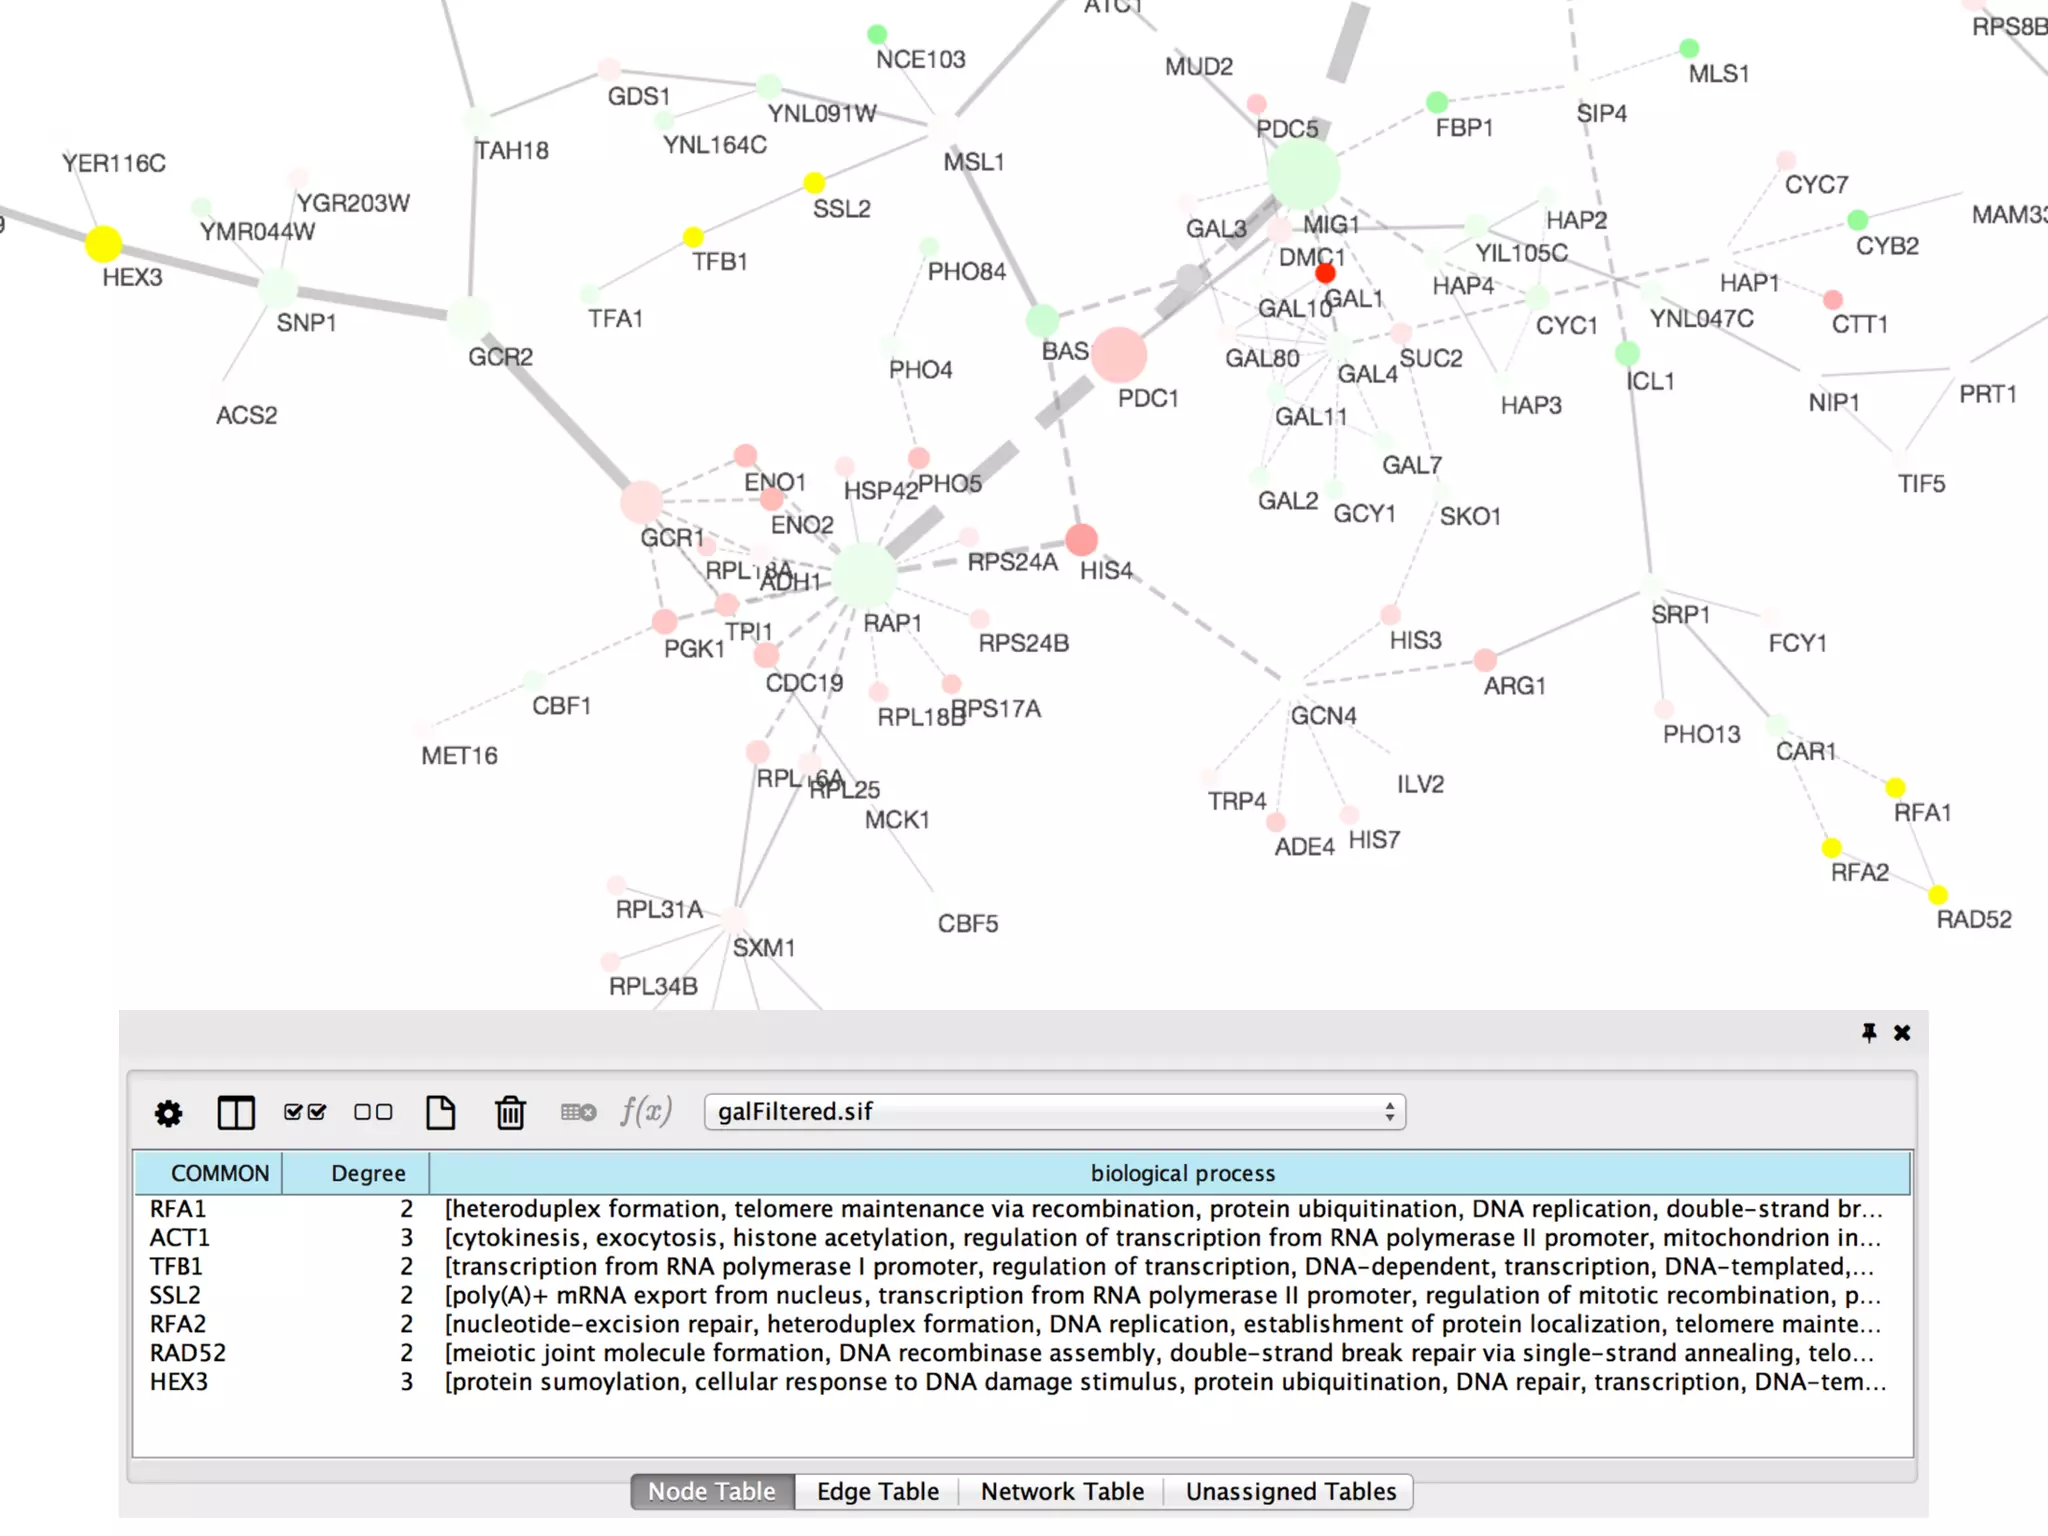
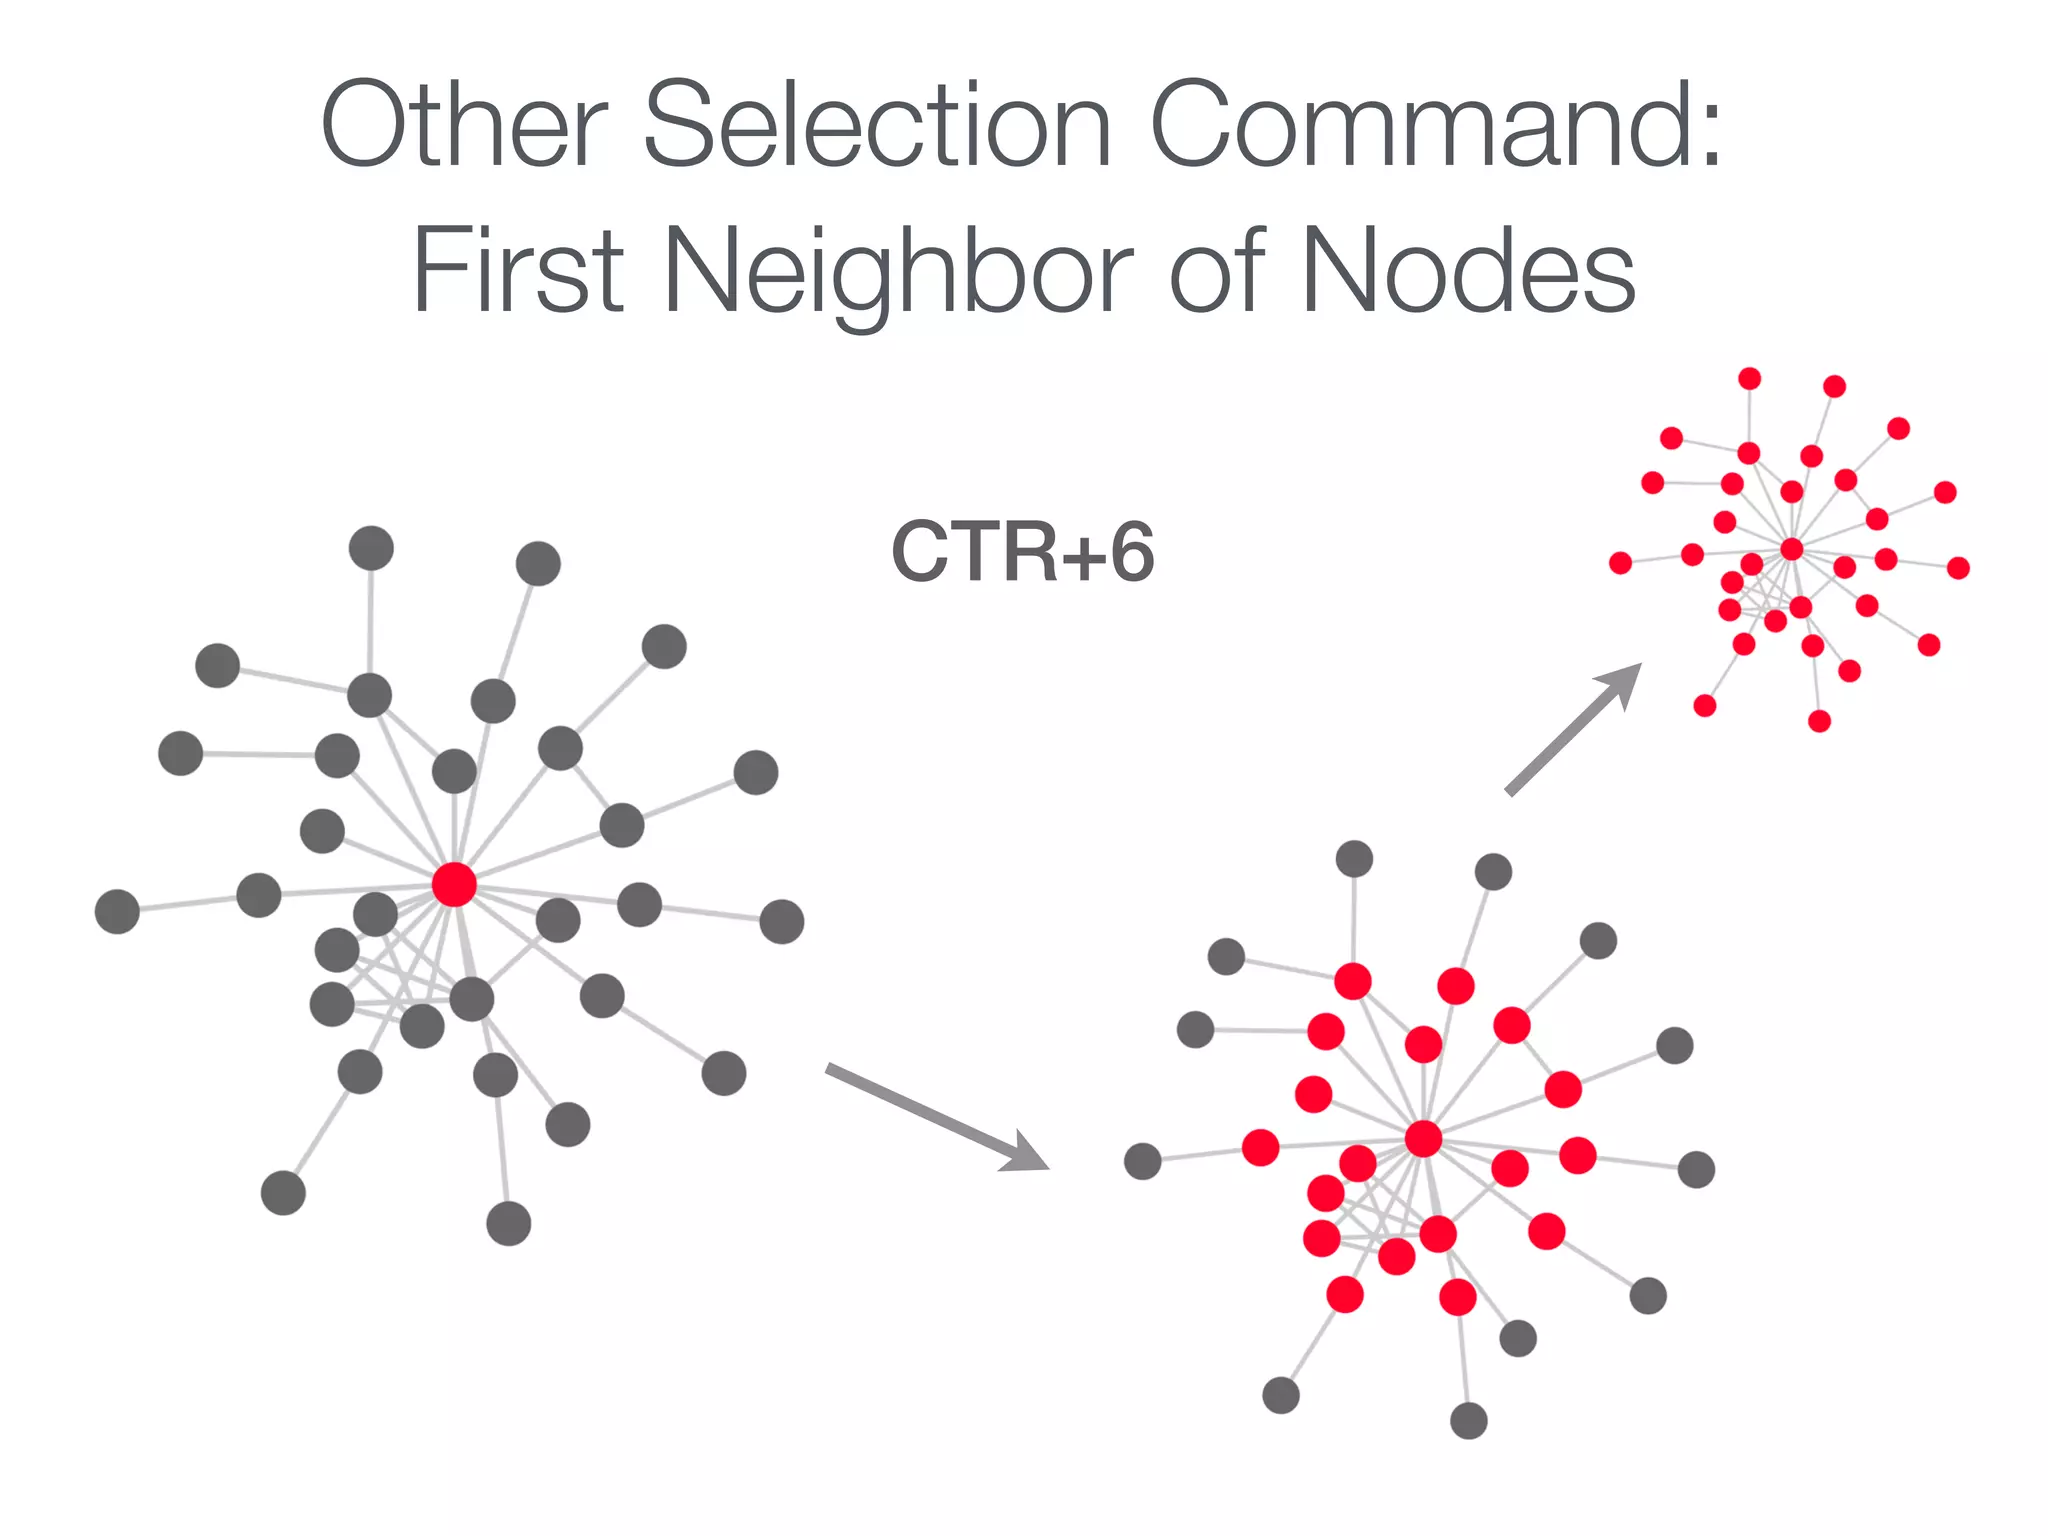
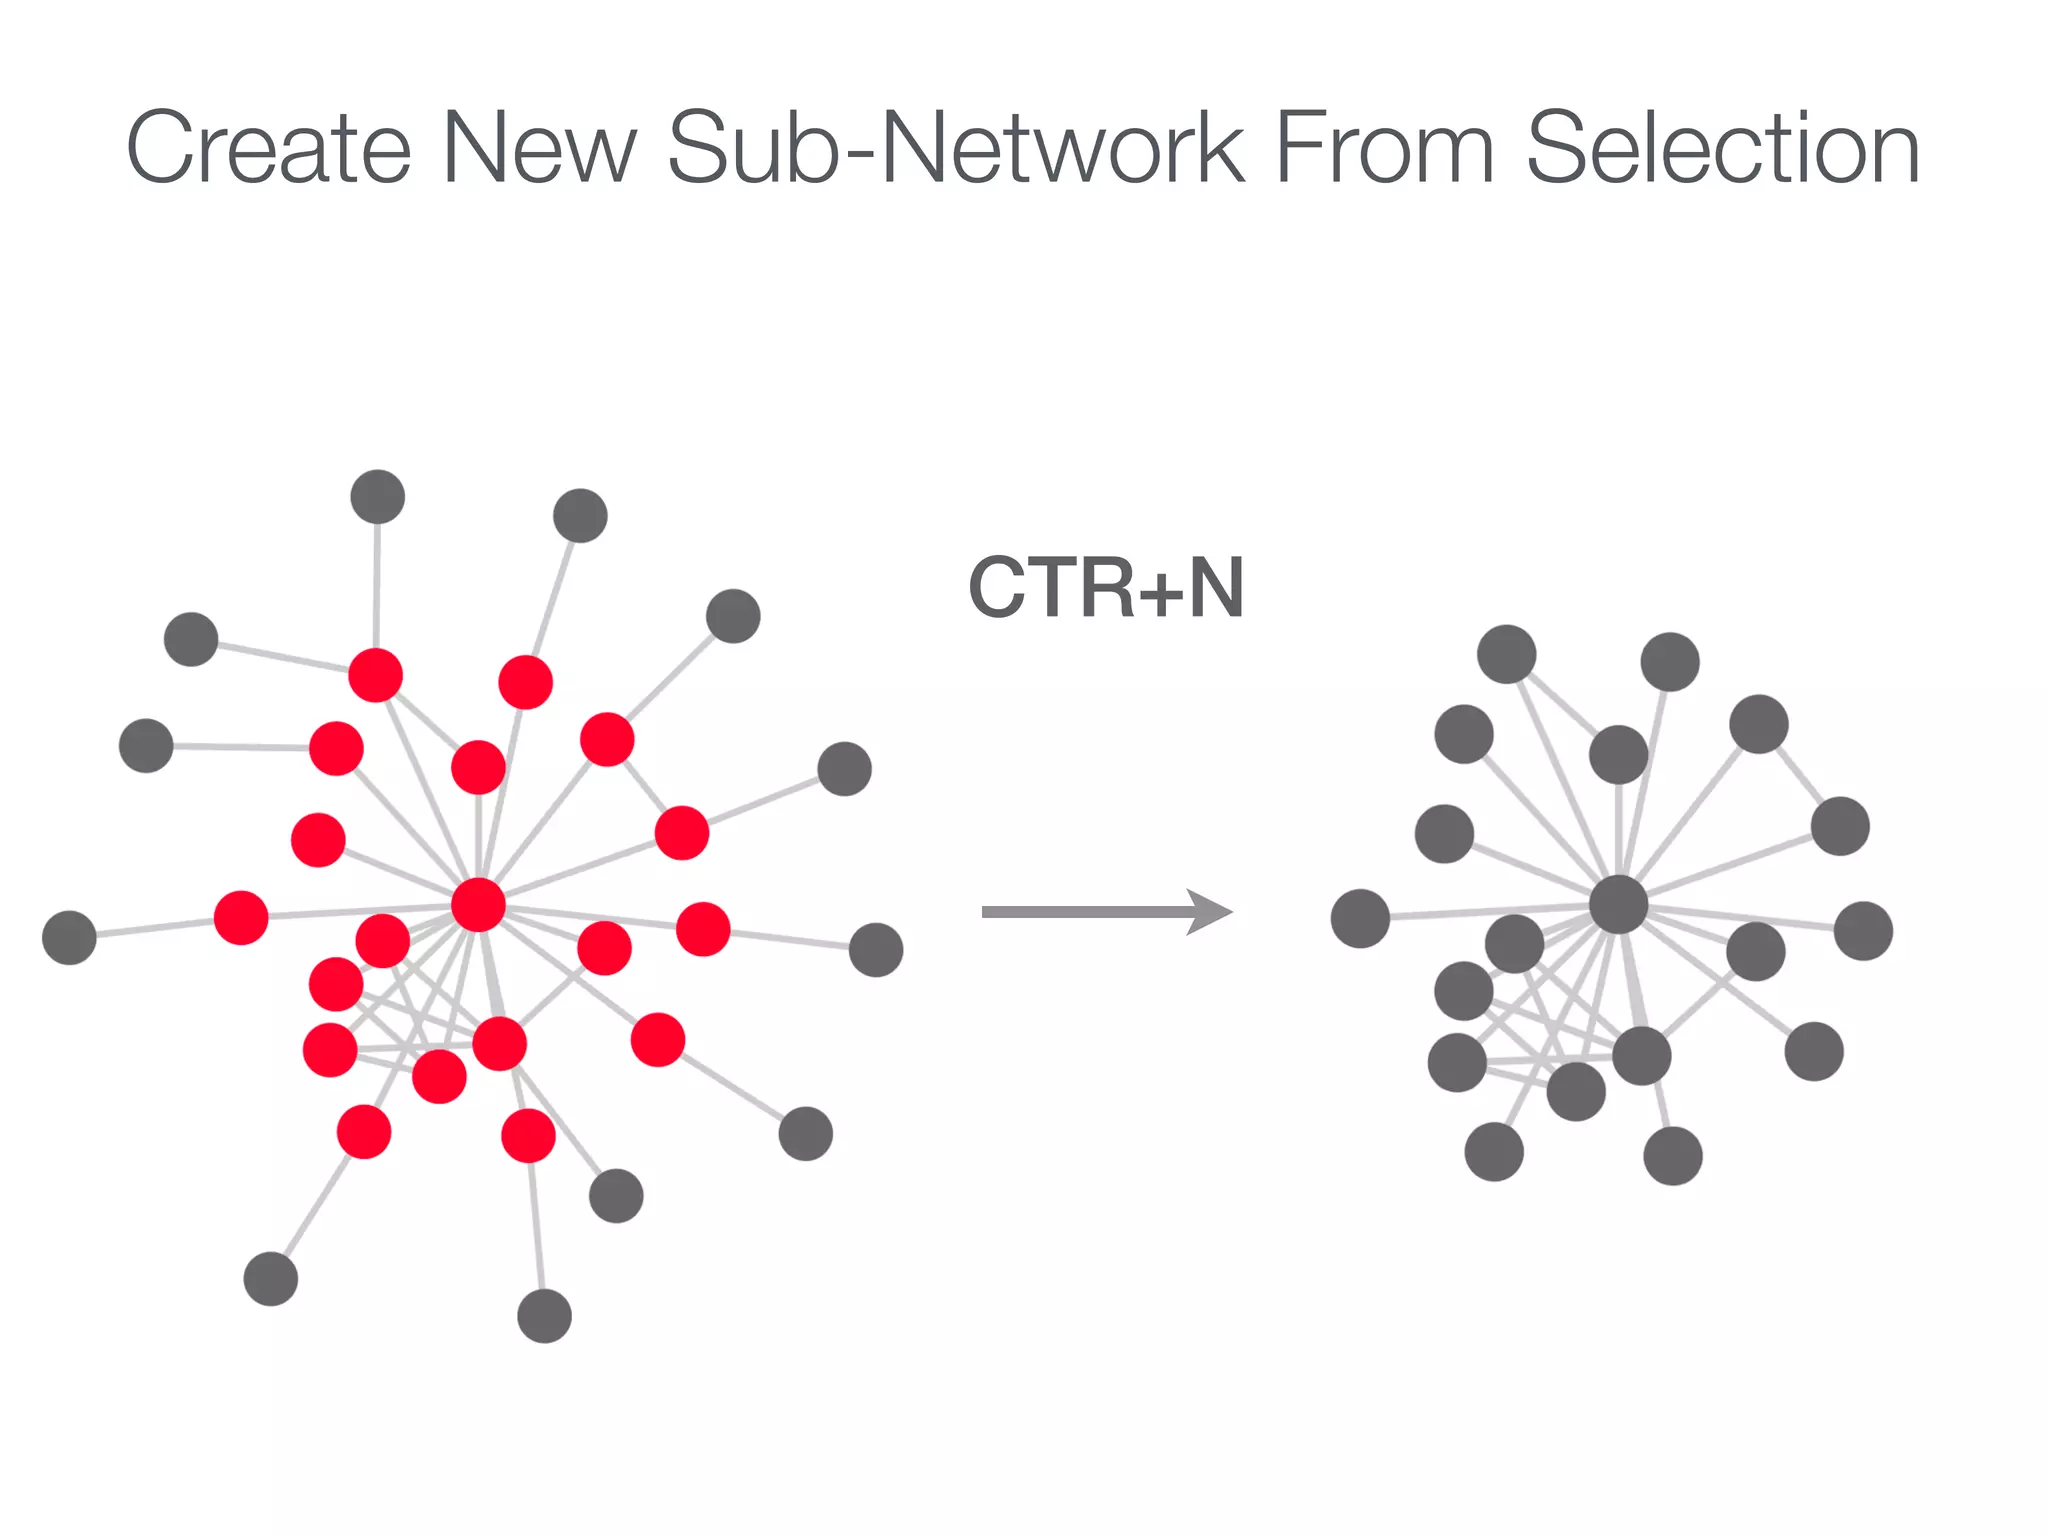
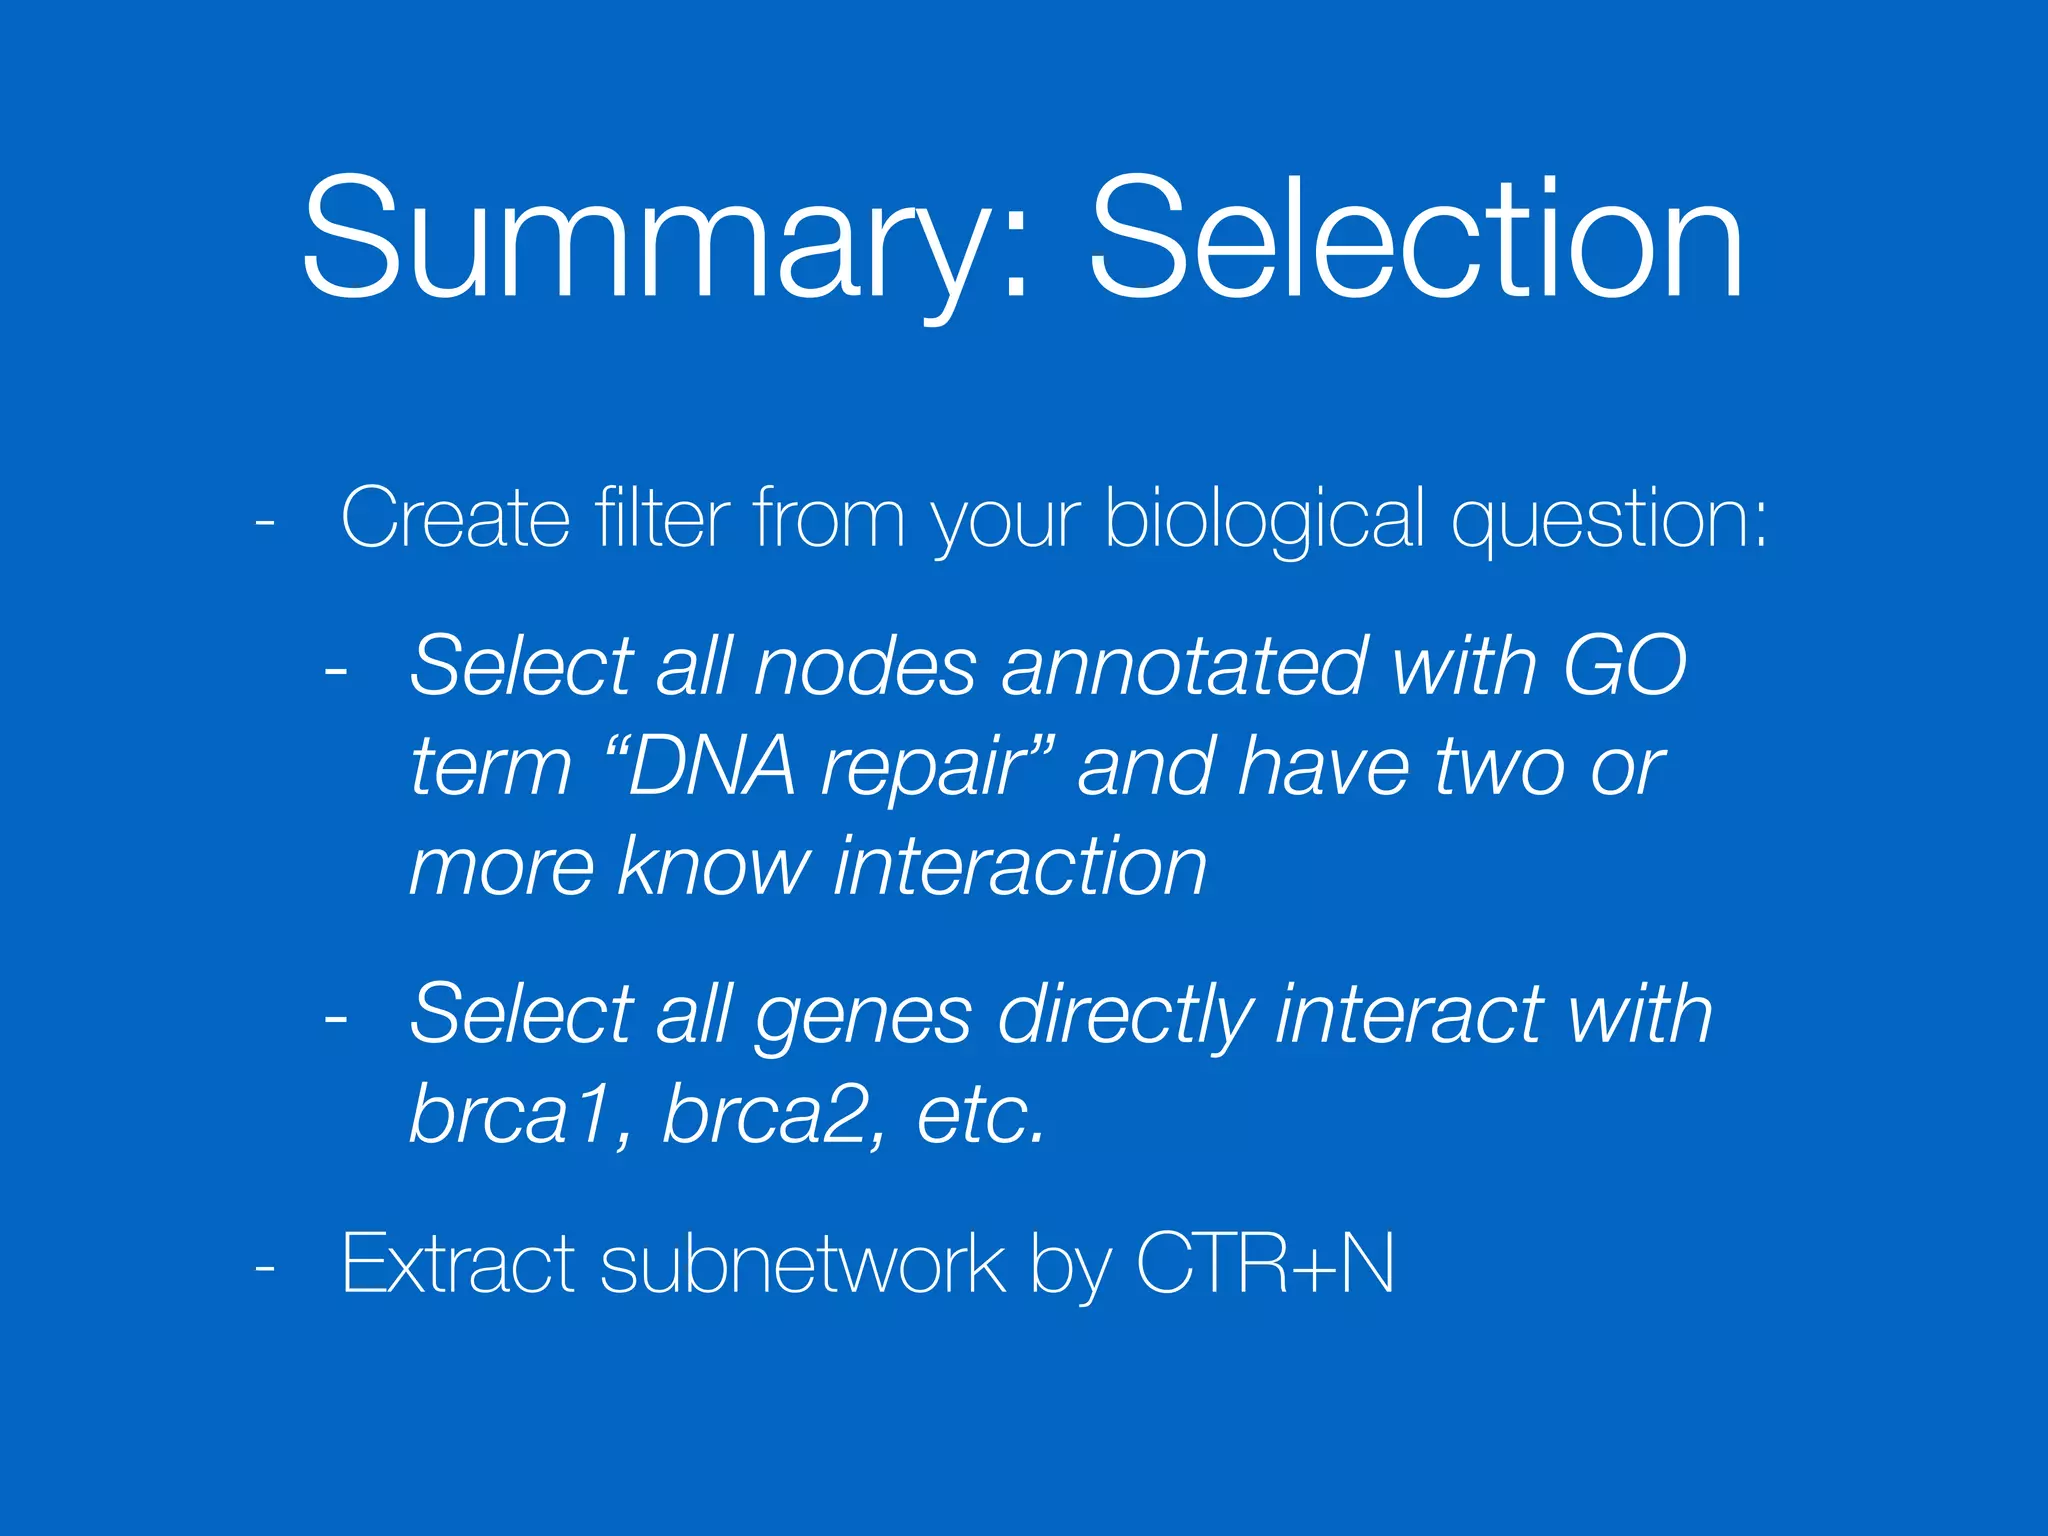
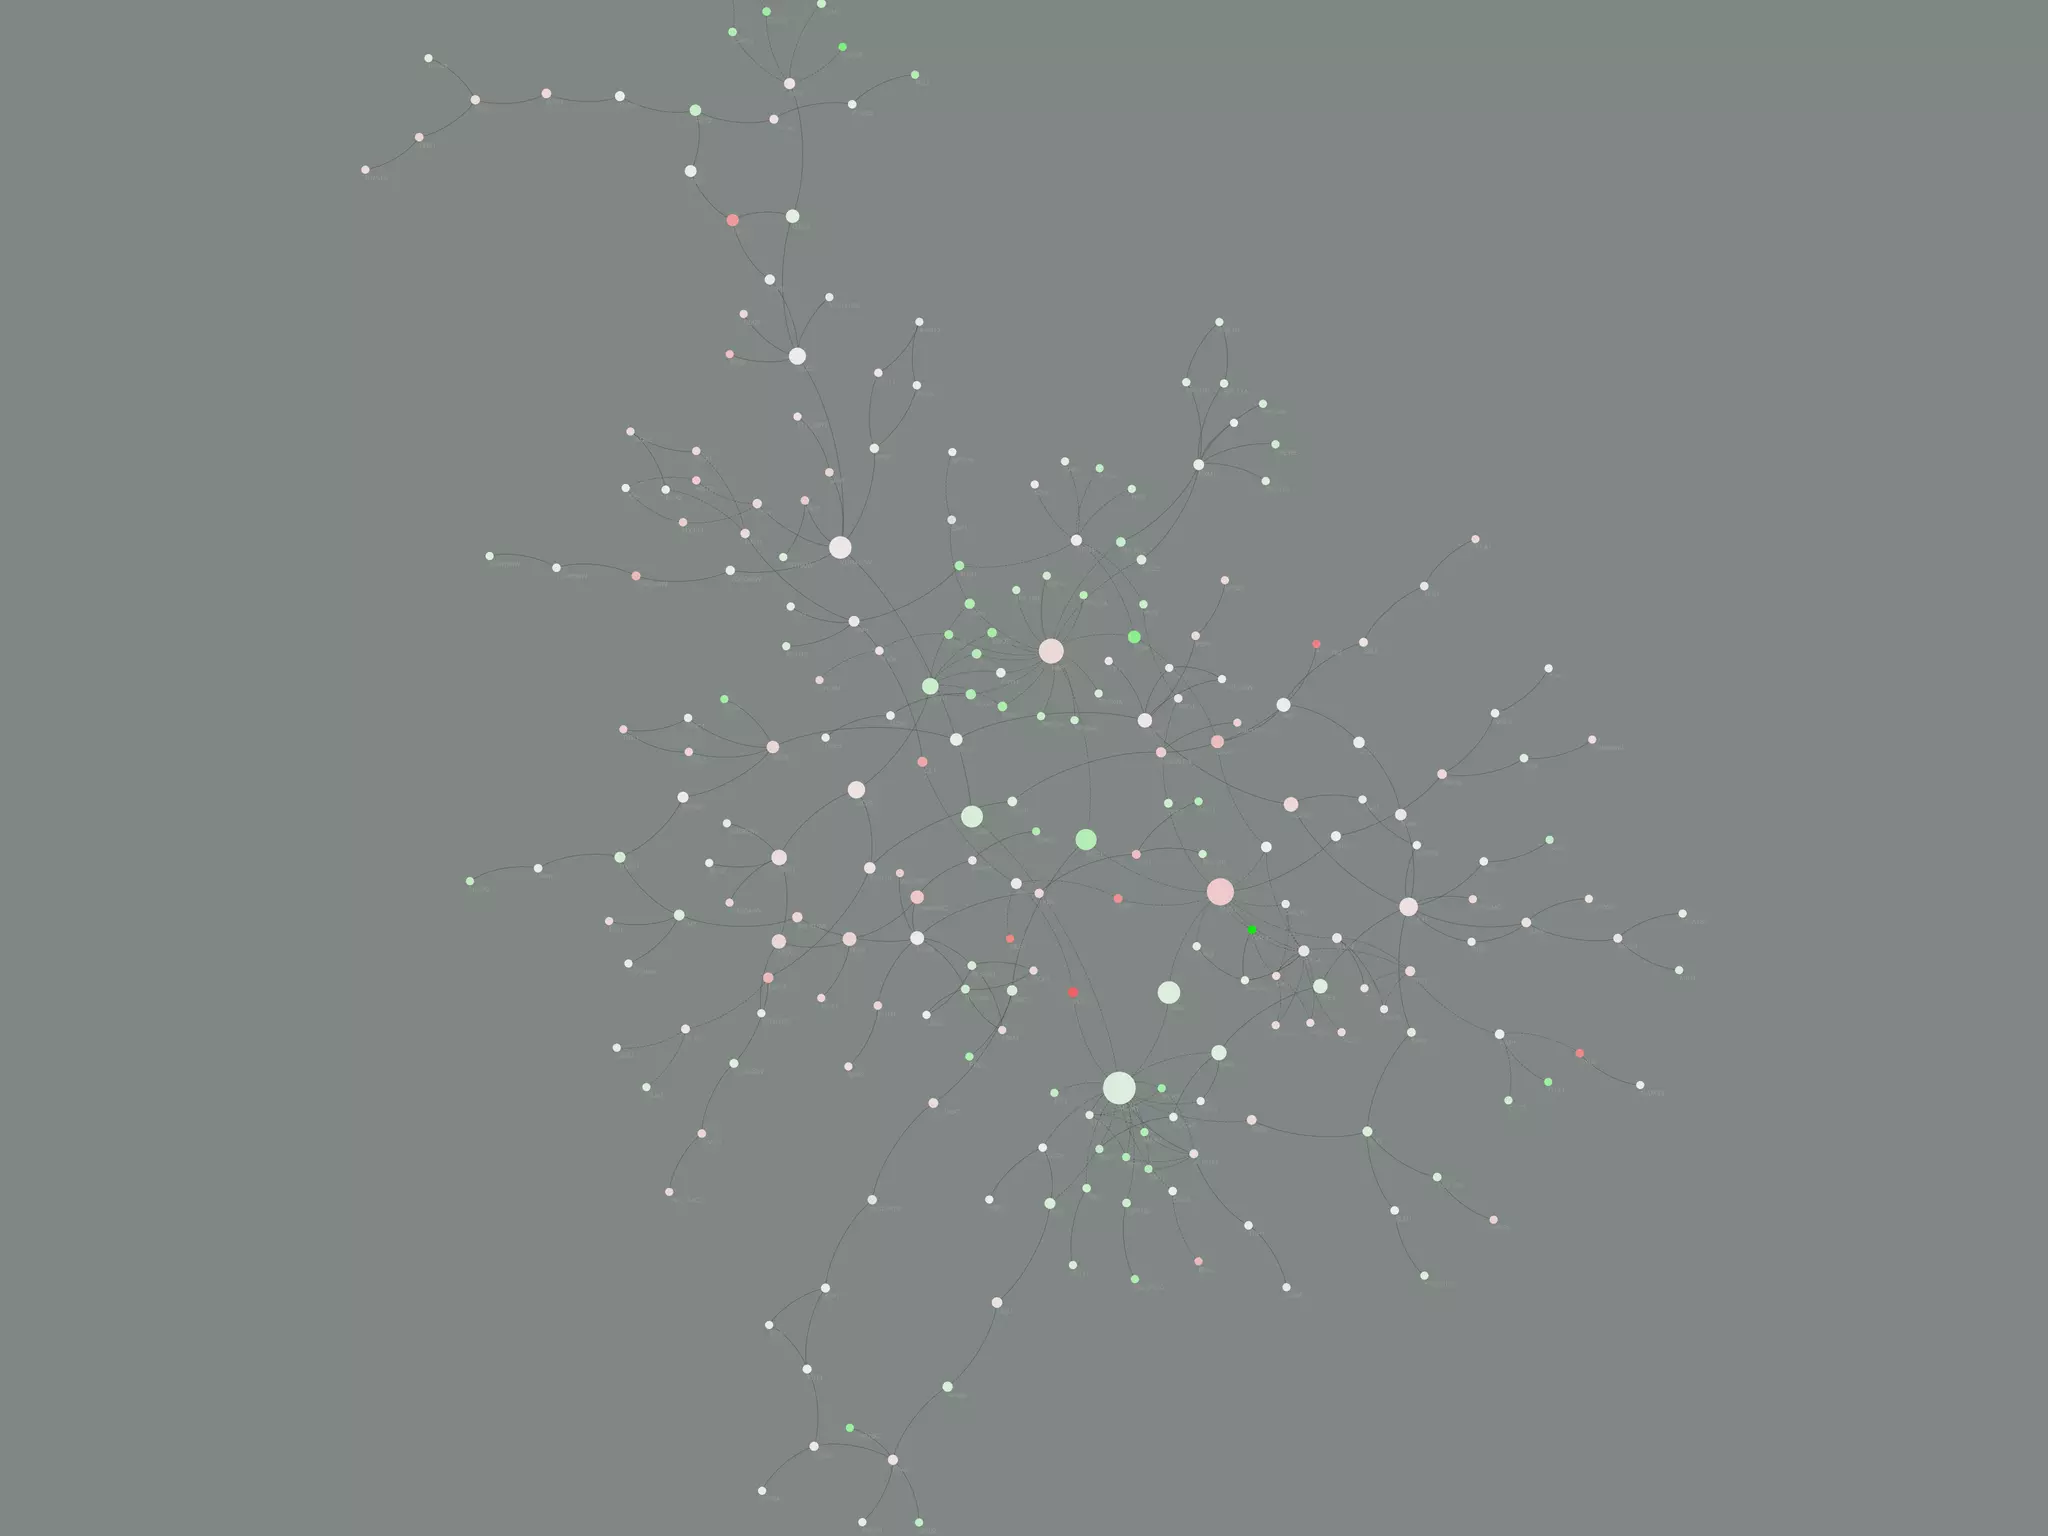
Discusses data selection, filtering techniques, and visualization strategies to enhance understanding of complex network data.
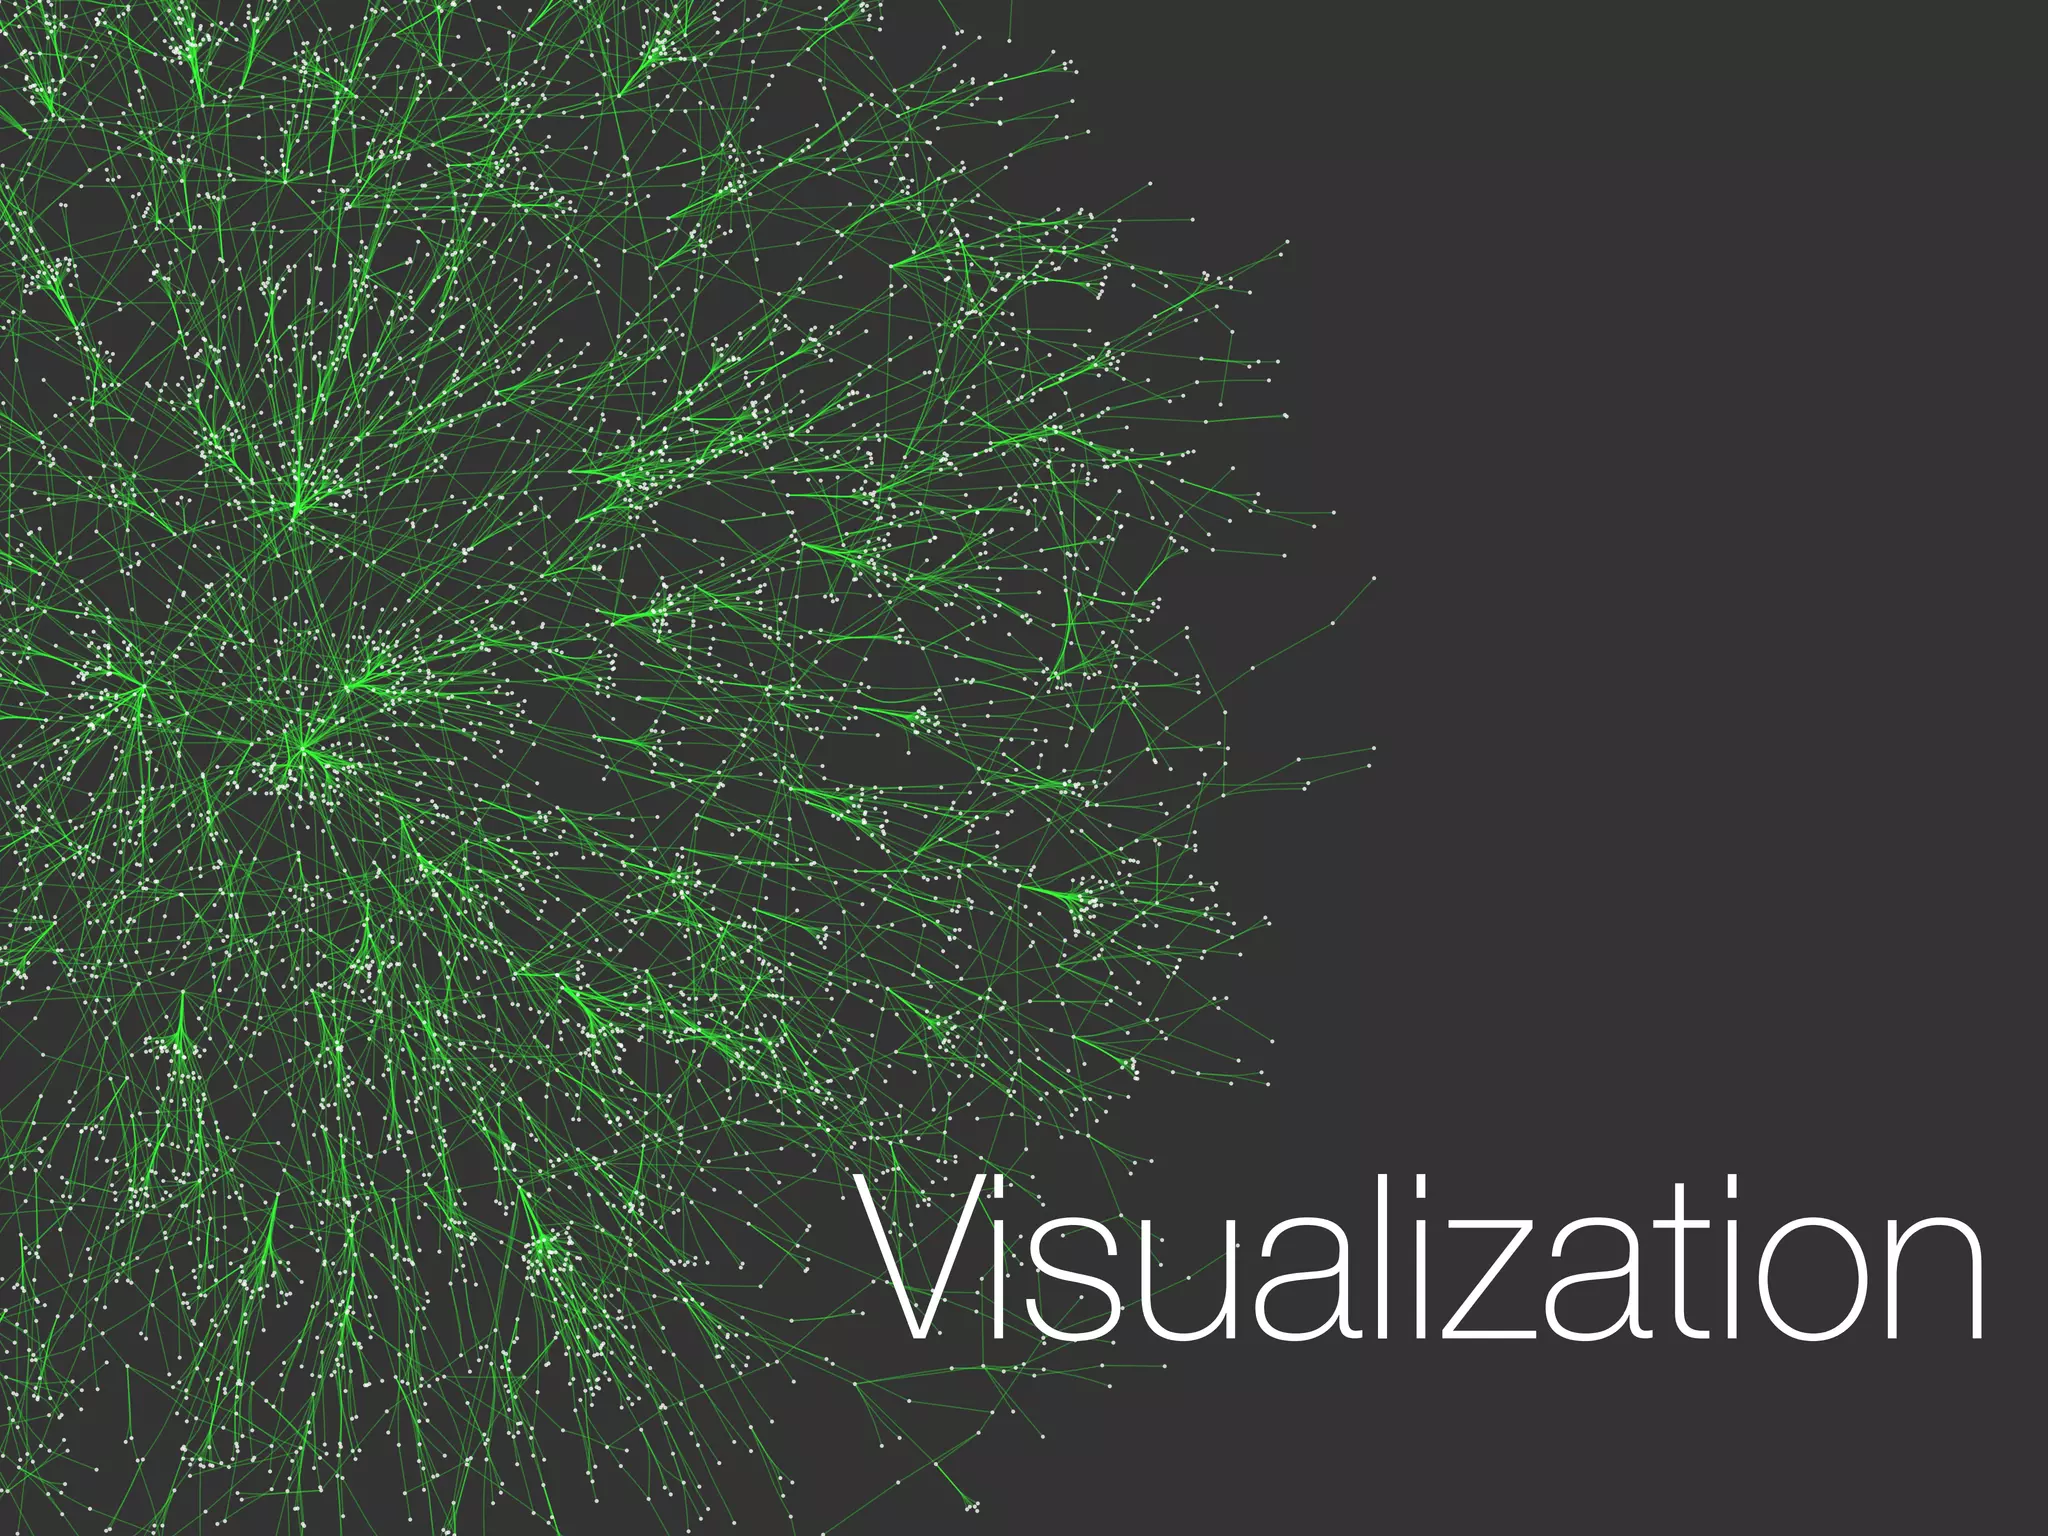
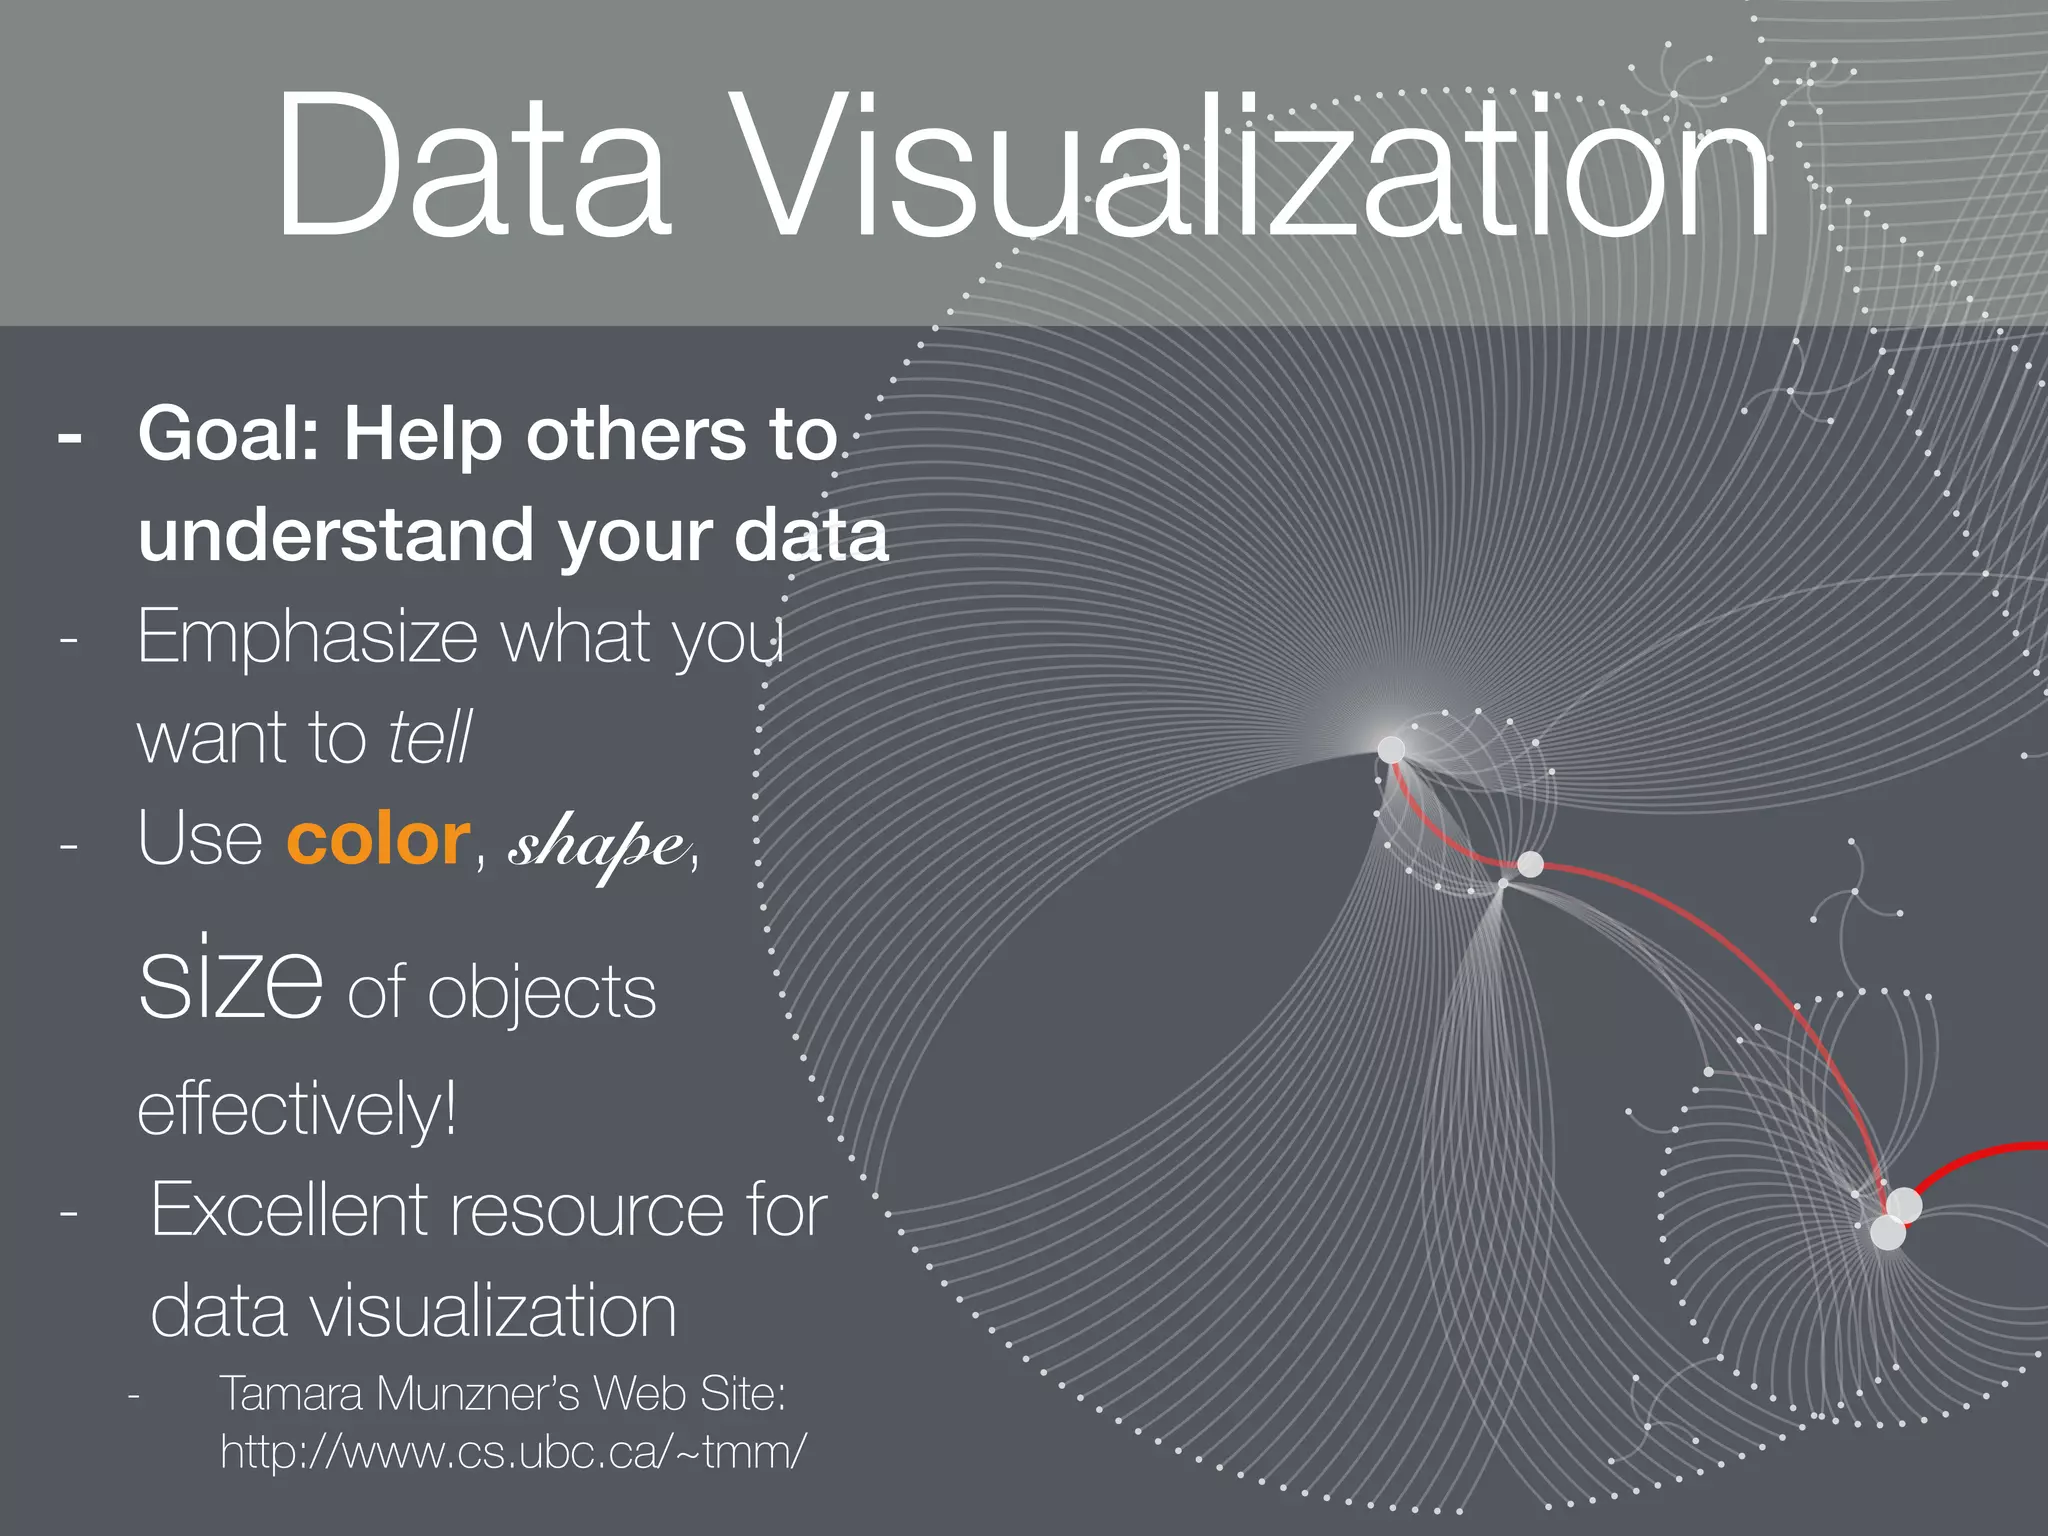
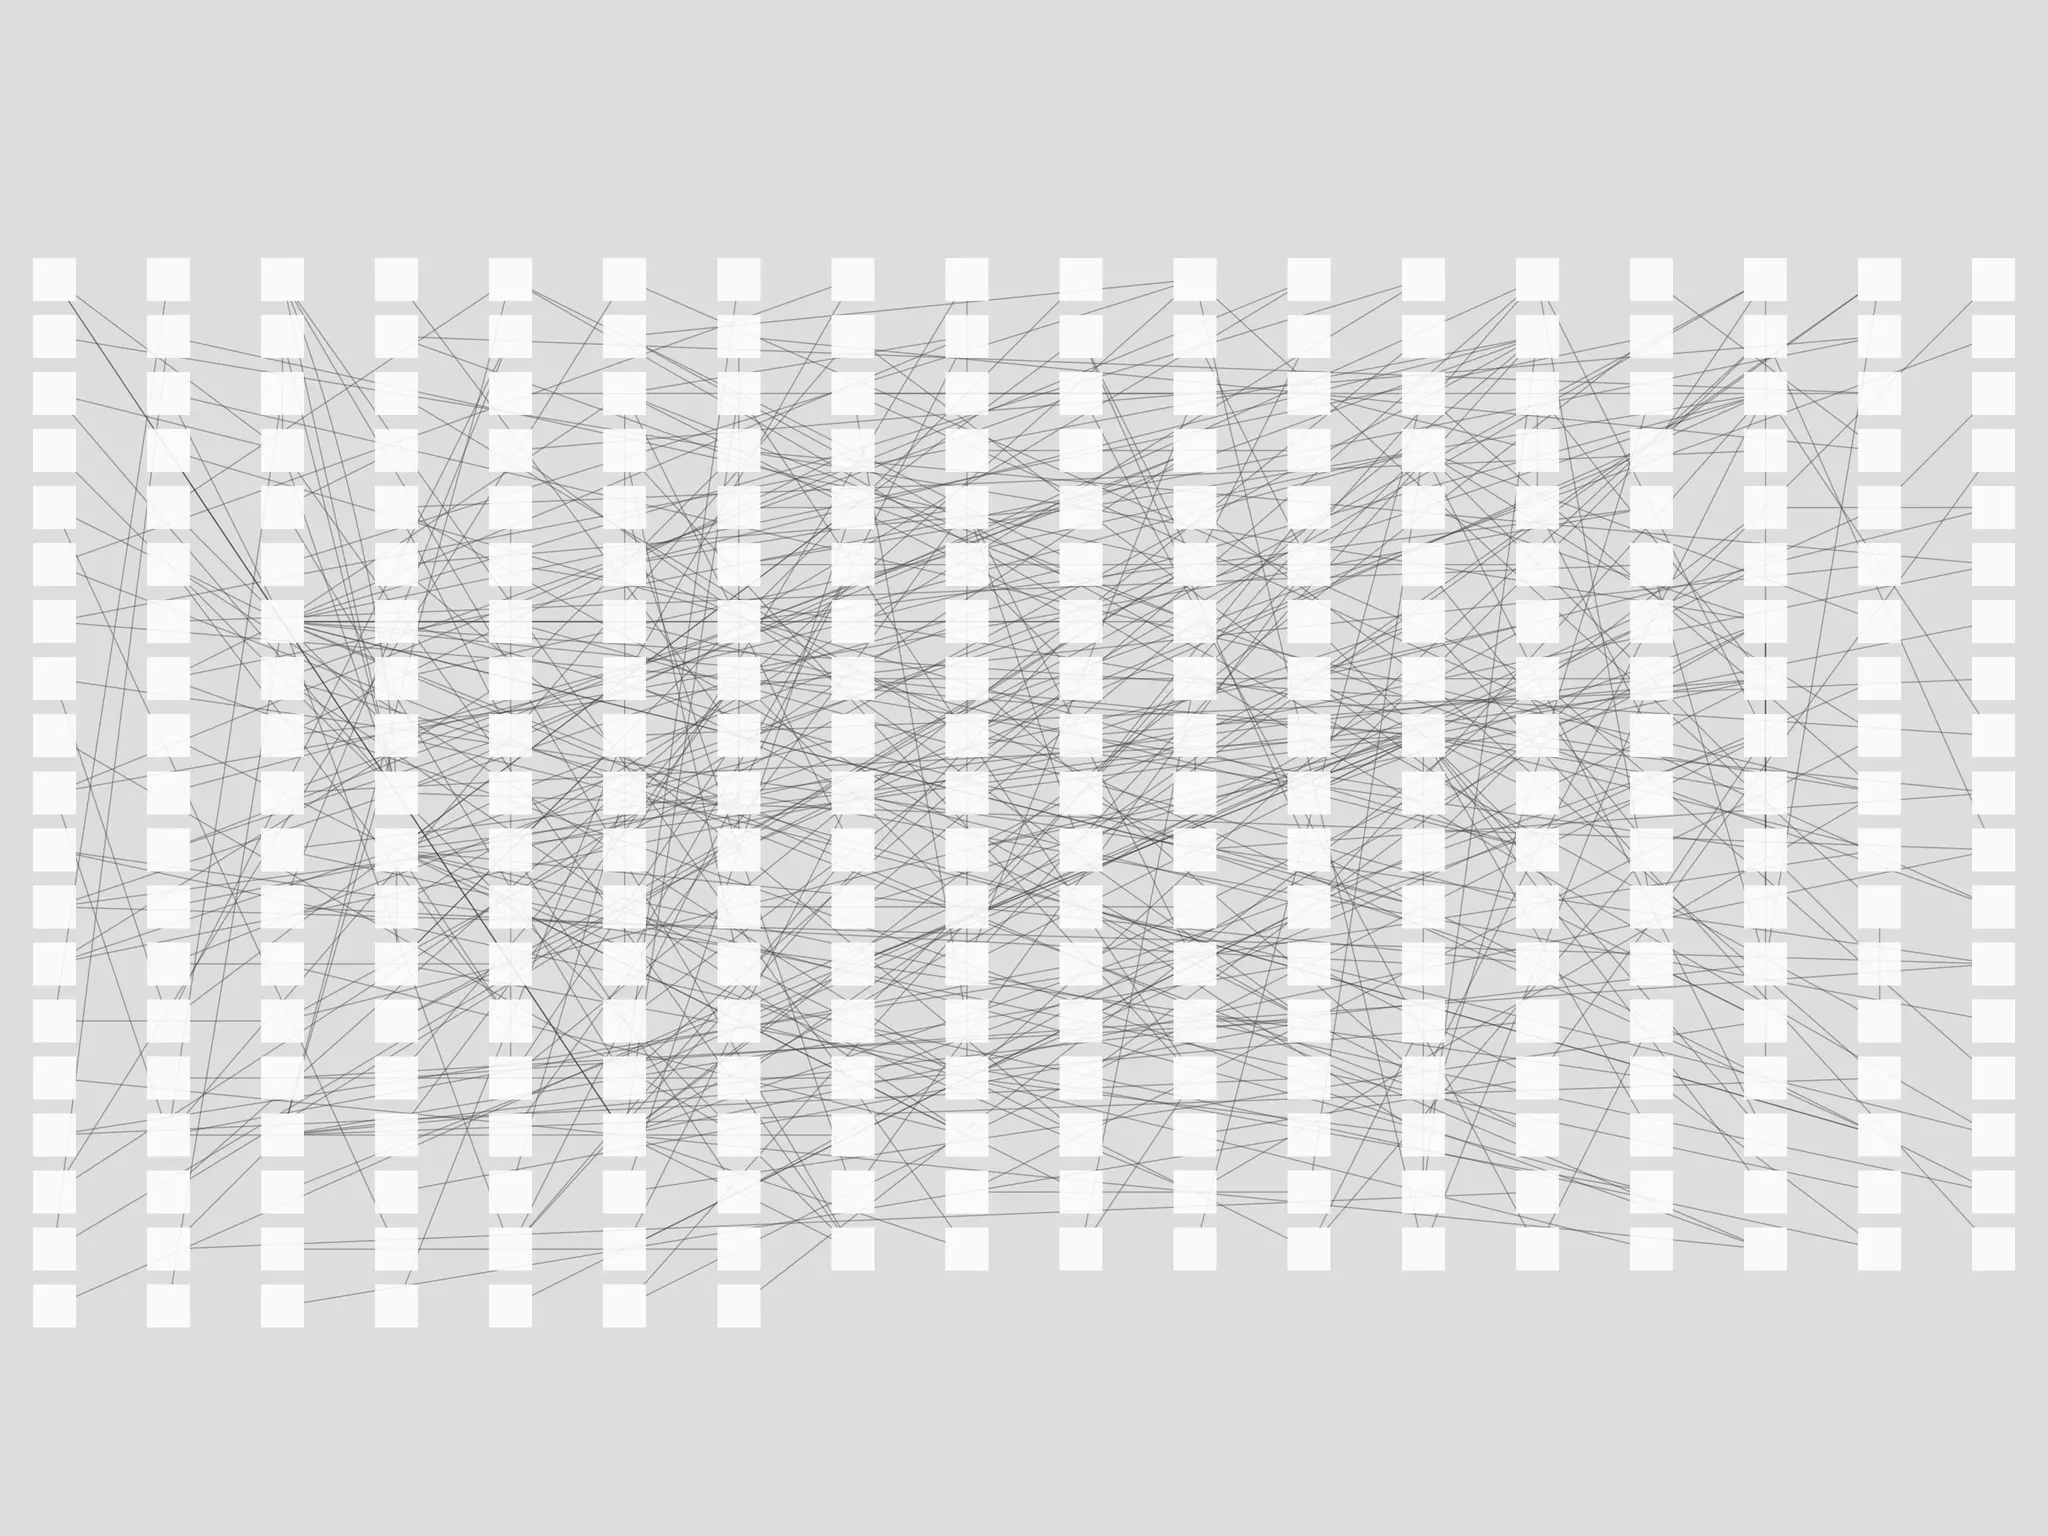
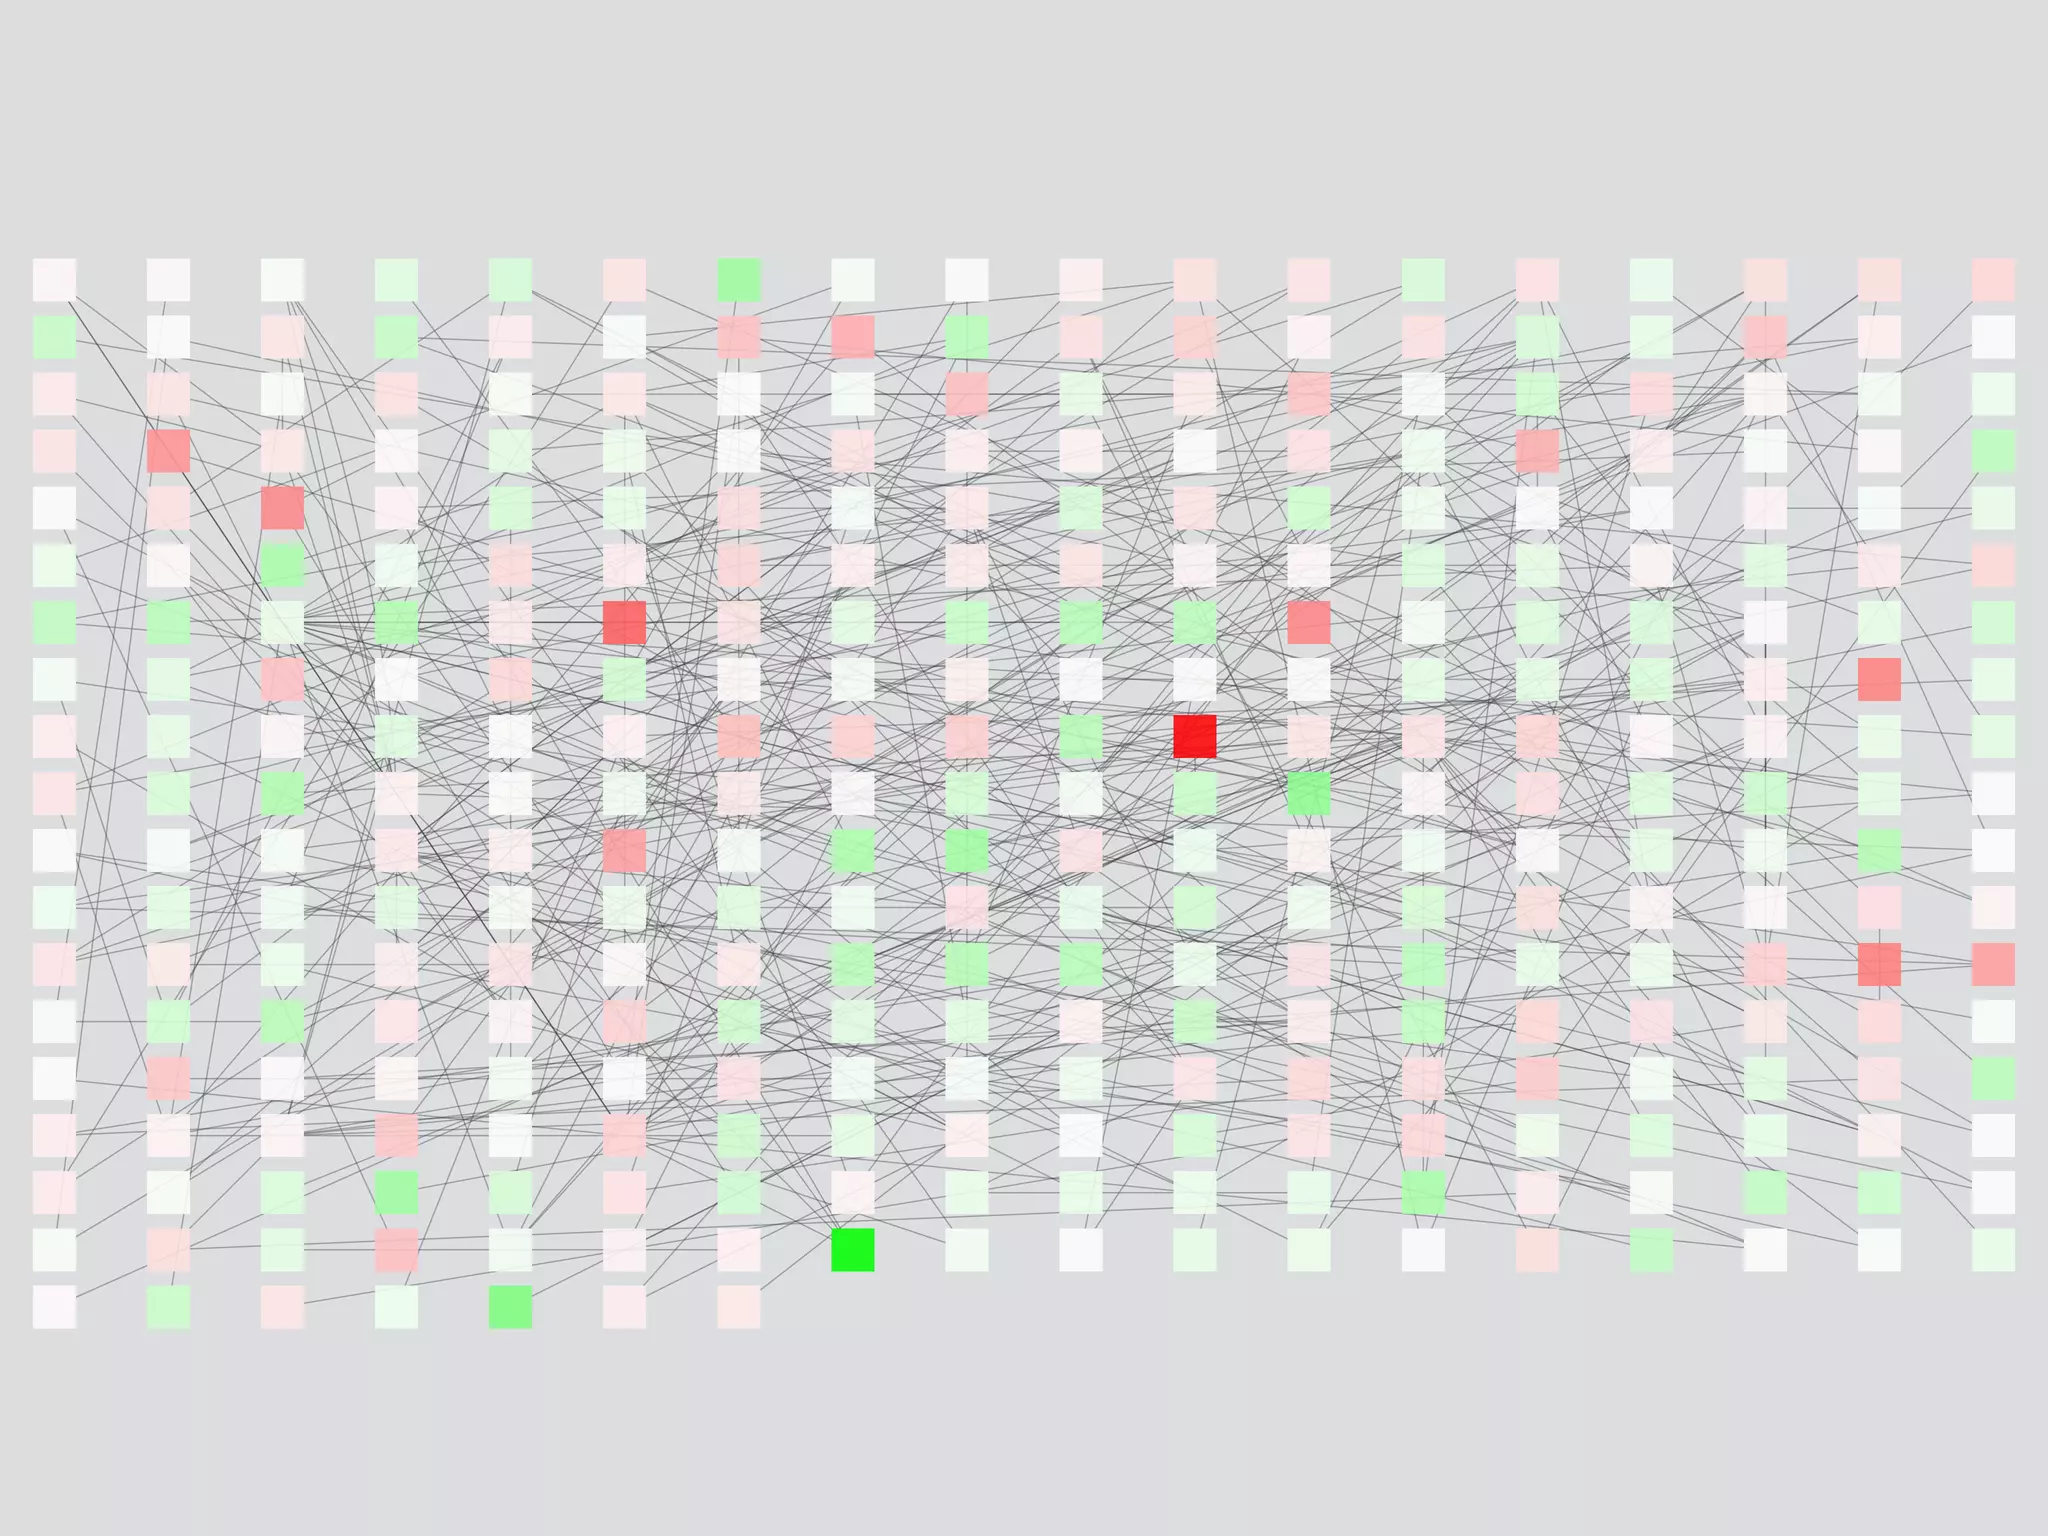
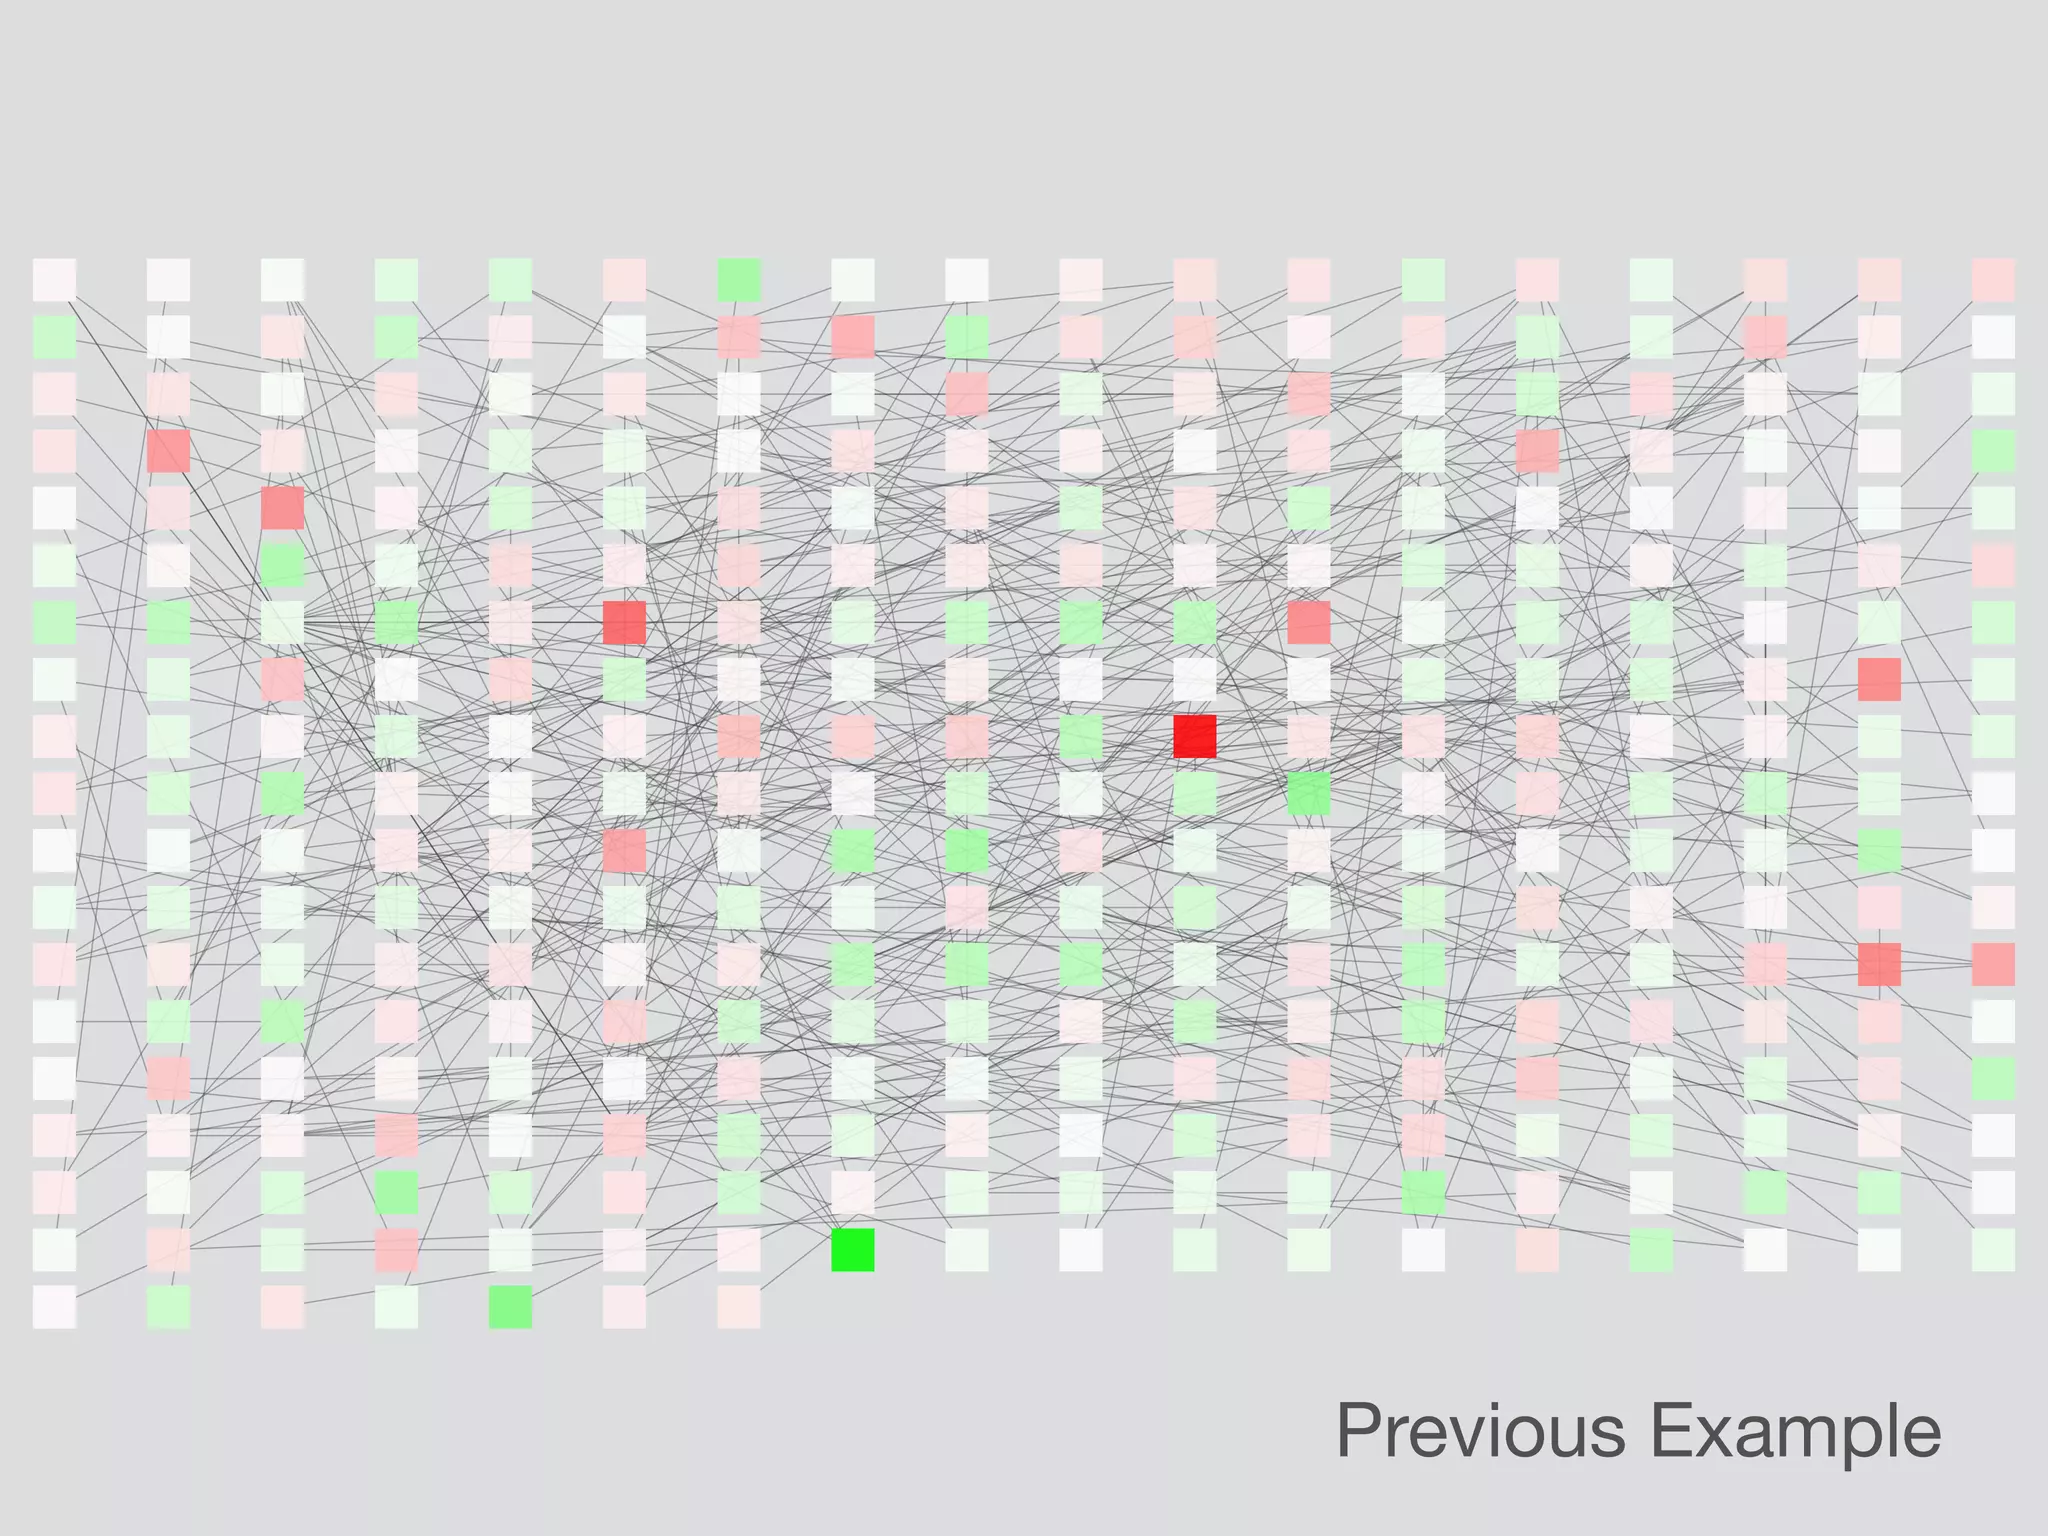
Focuses on effective data visualization principles using shapes, colors, and sizes to improve communication of network data.
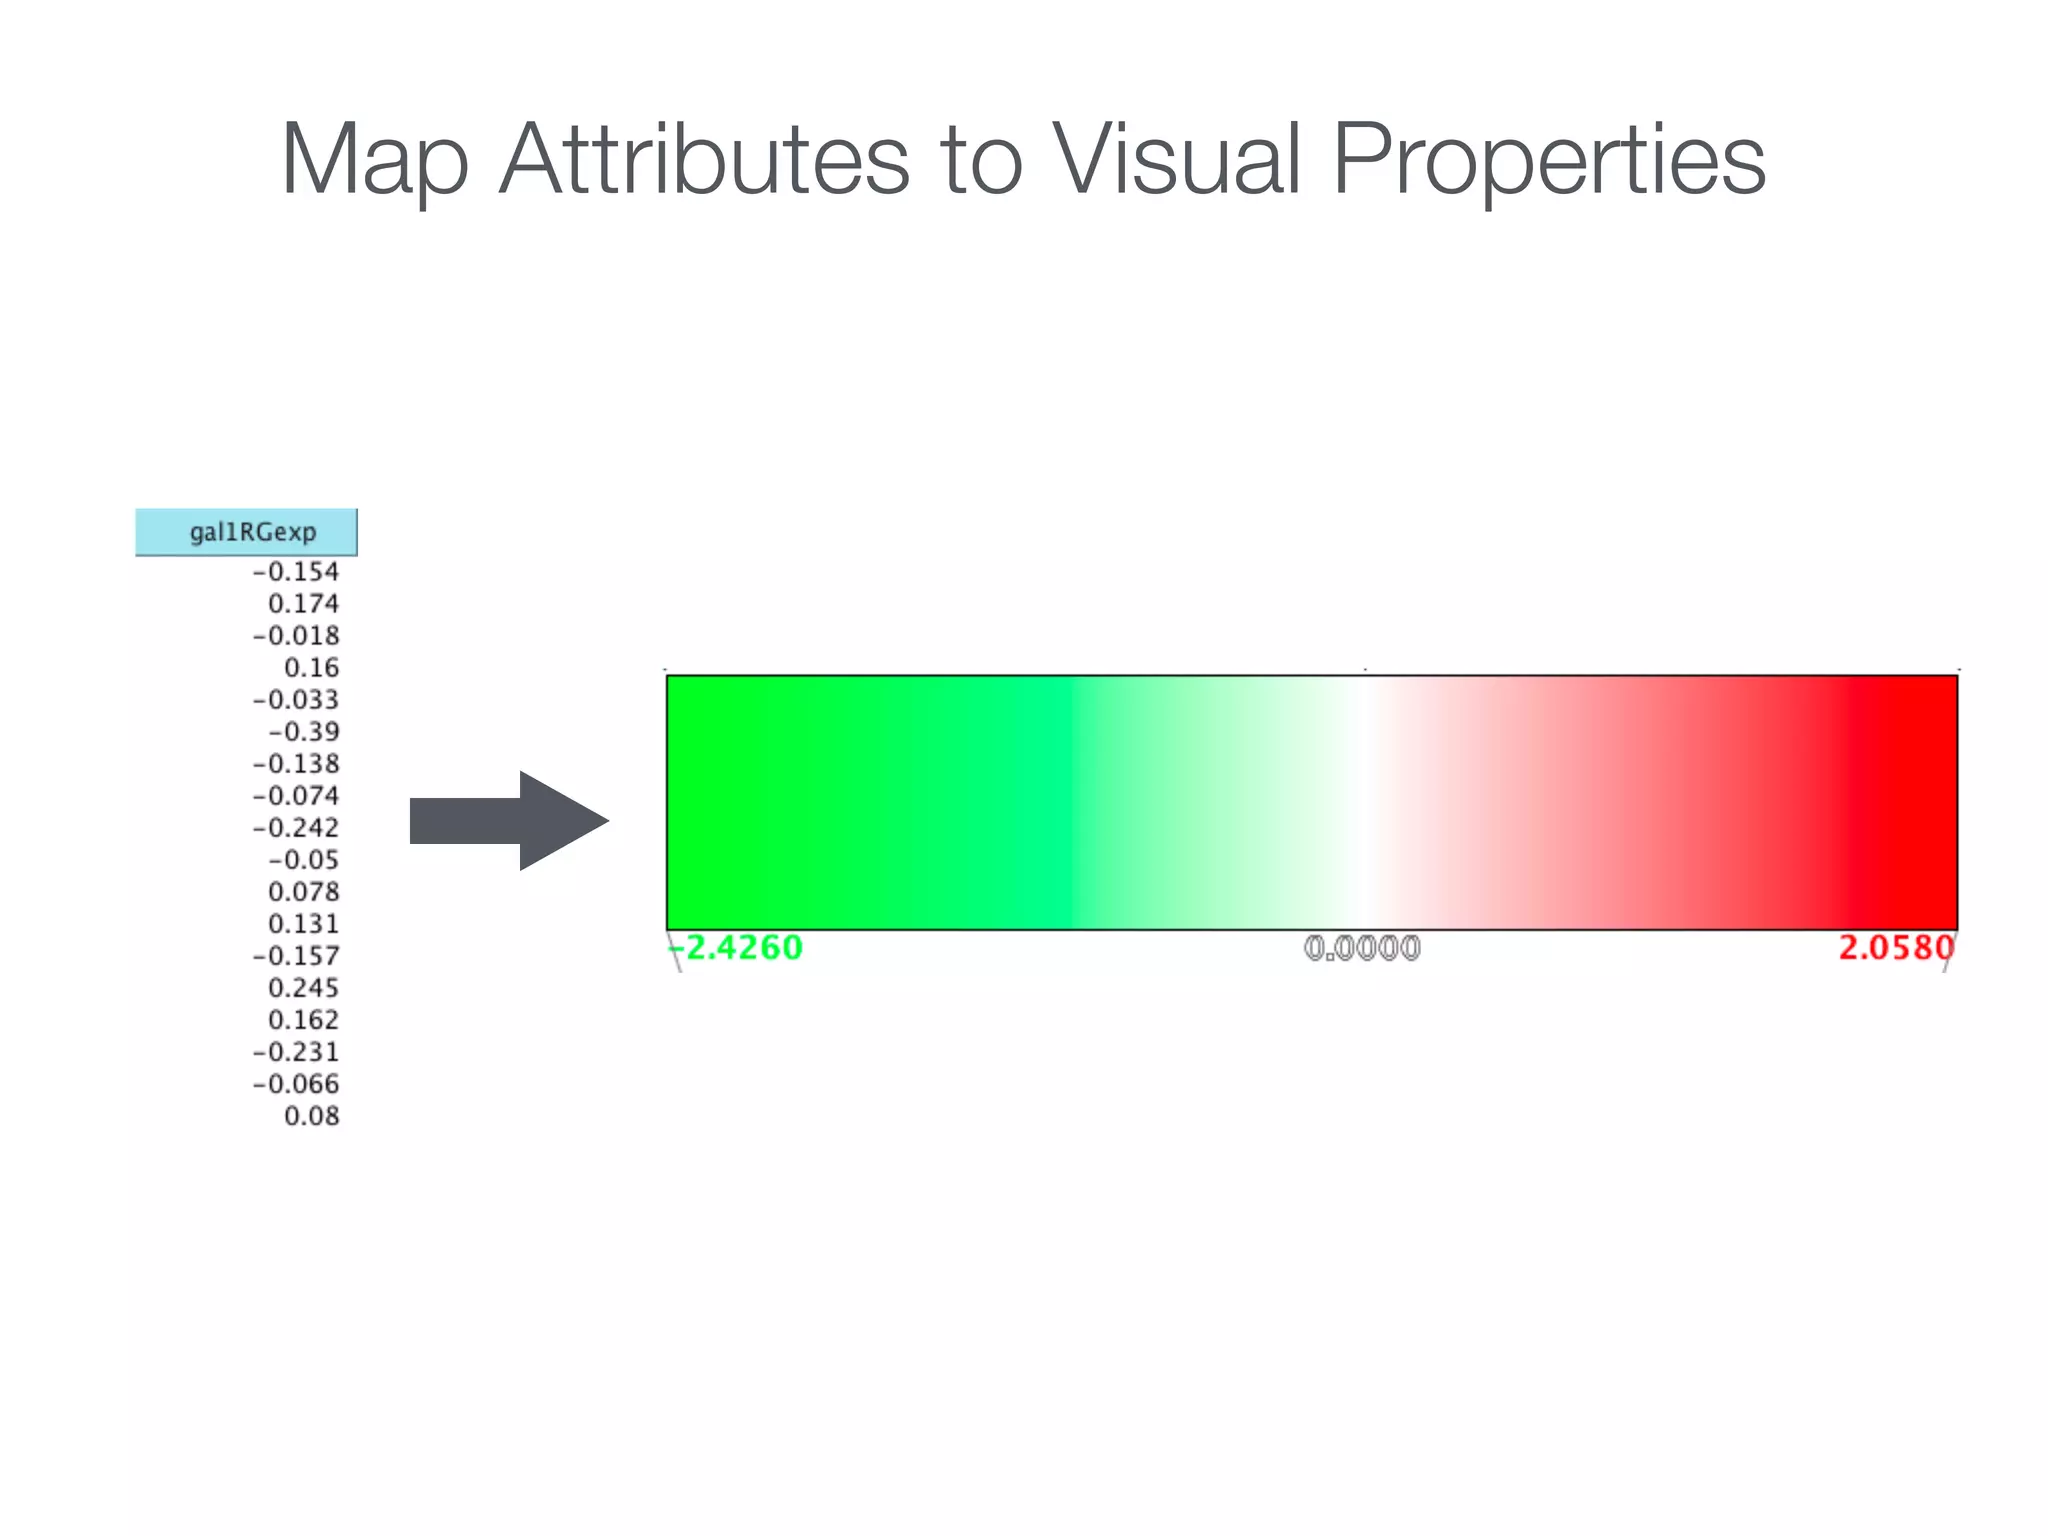
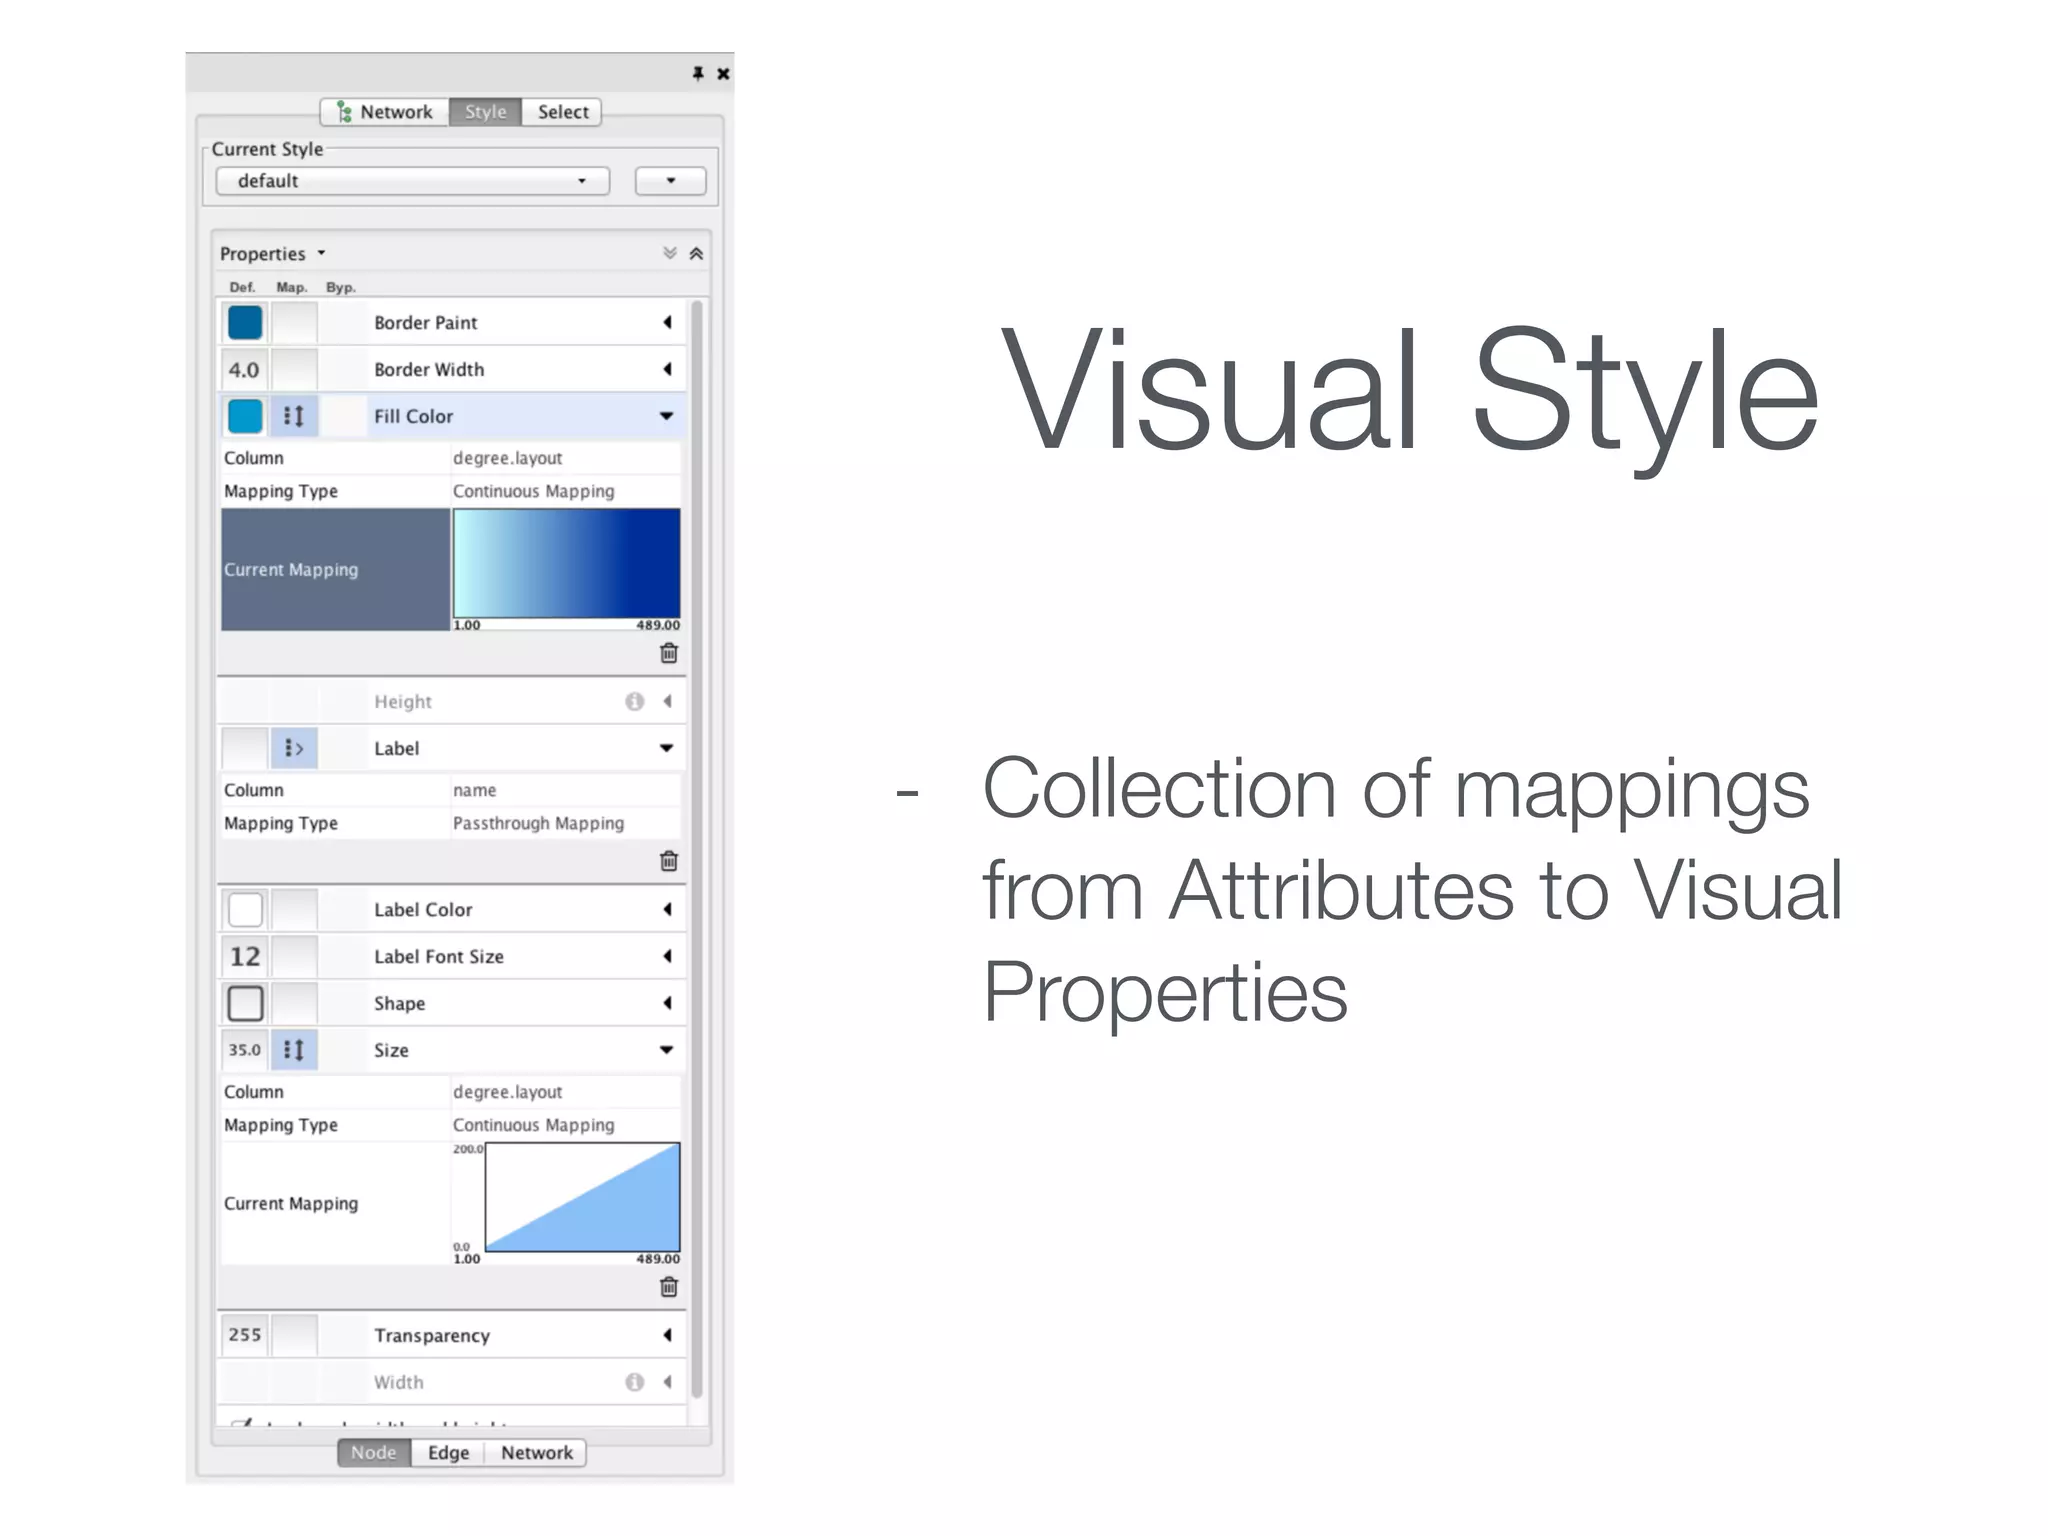
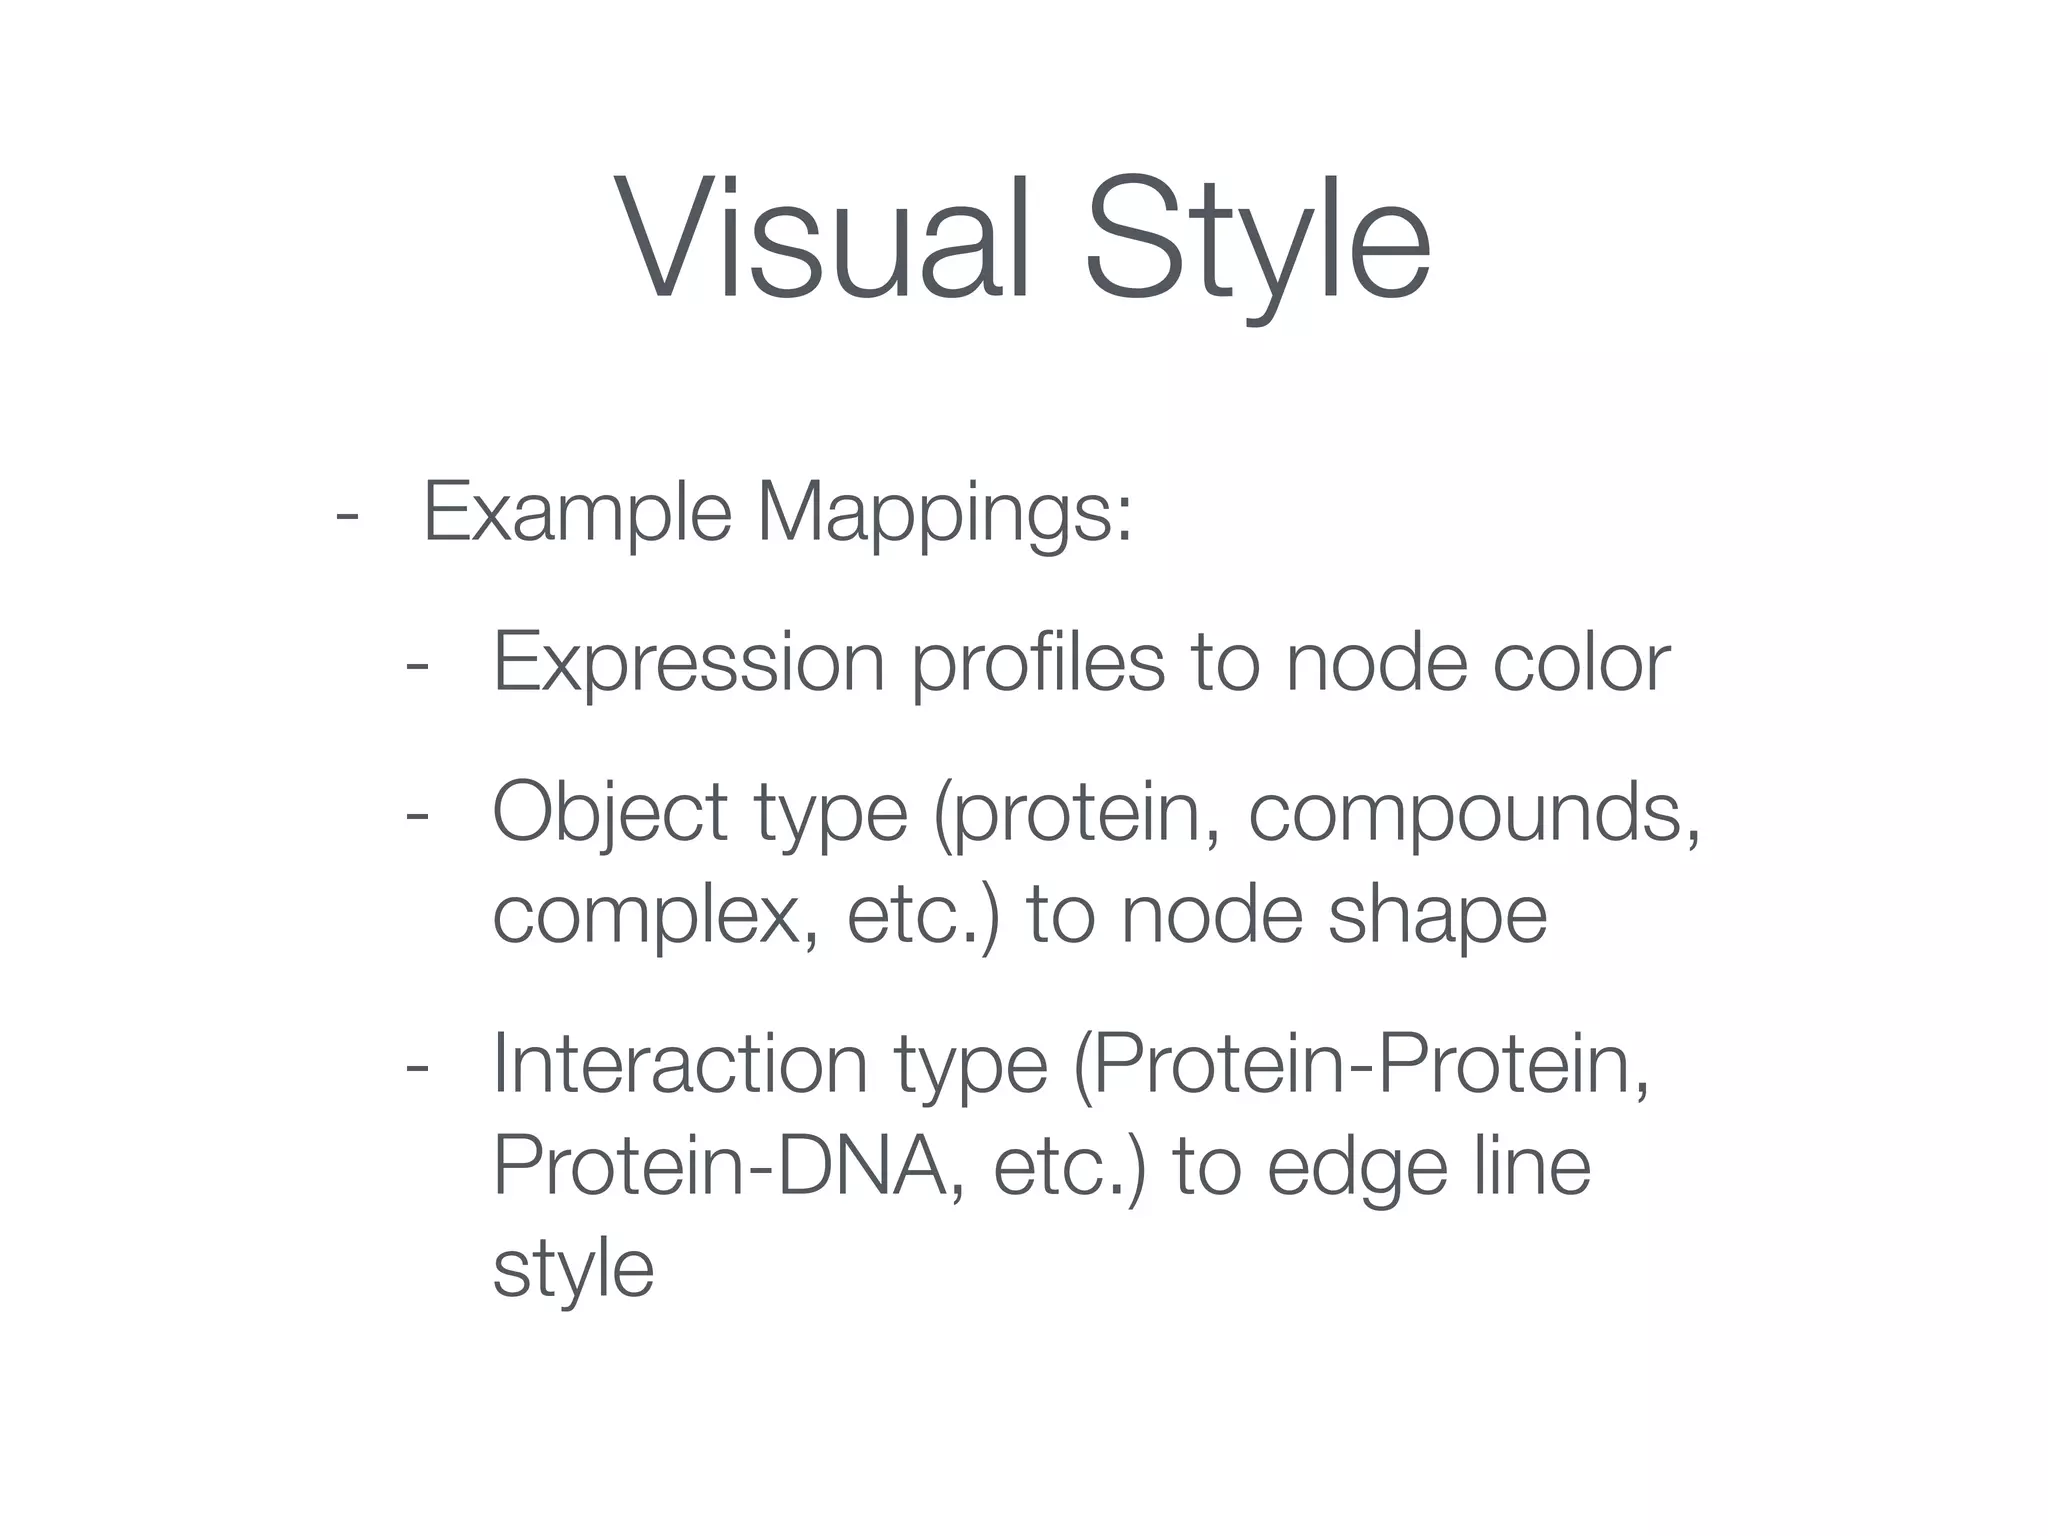
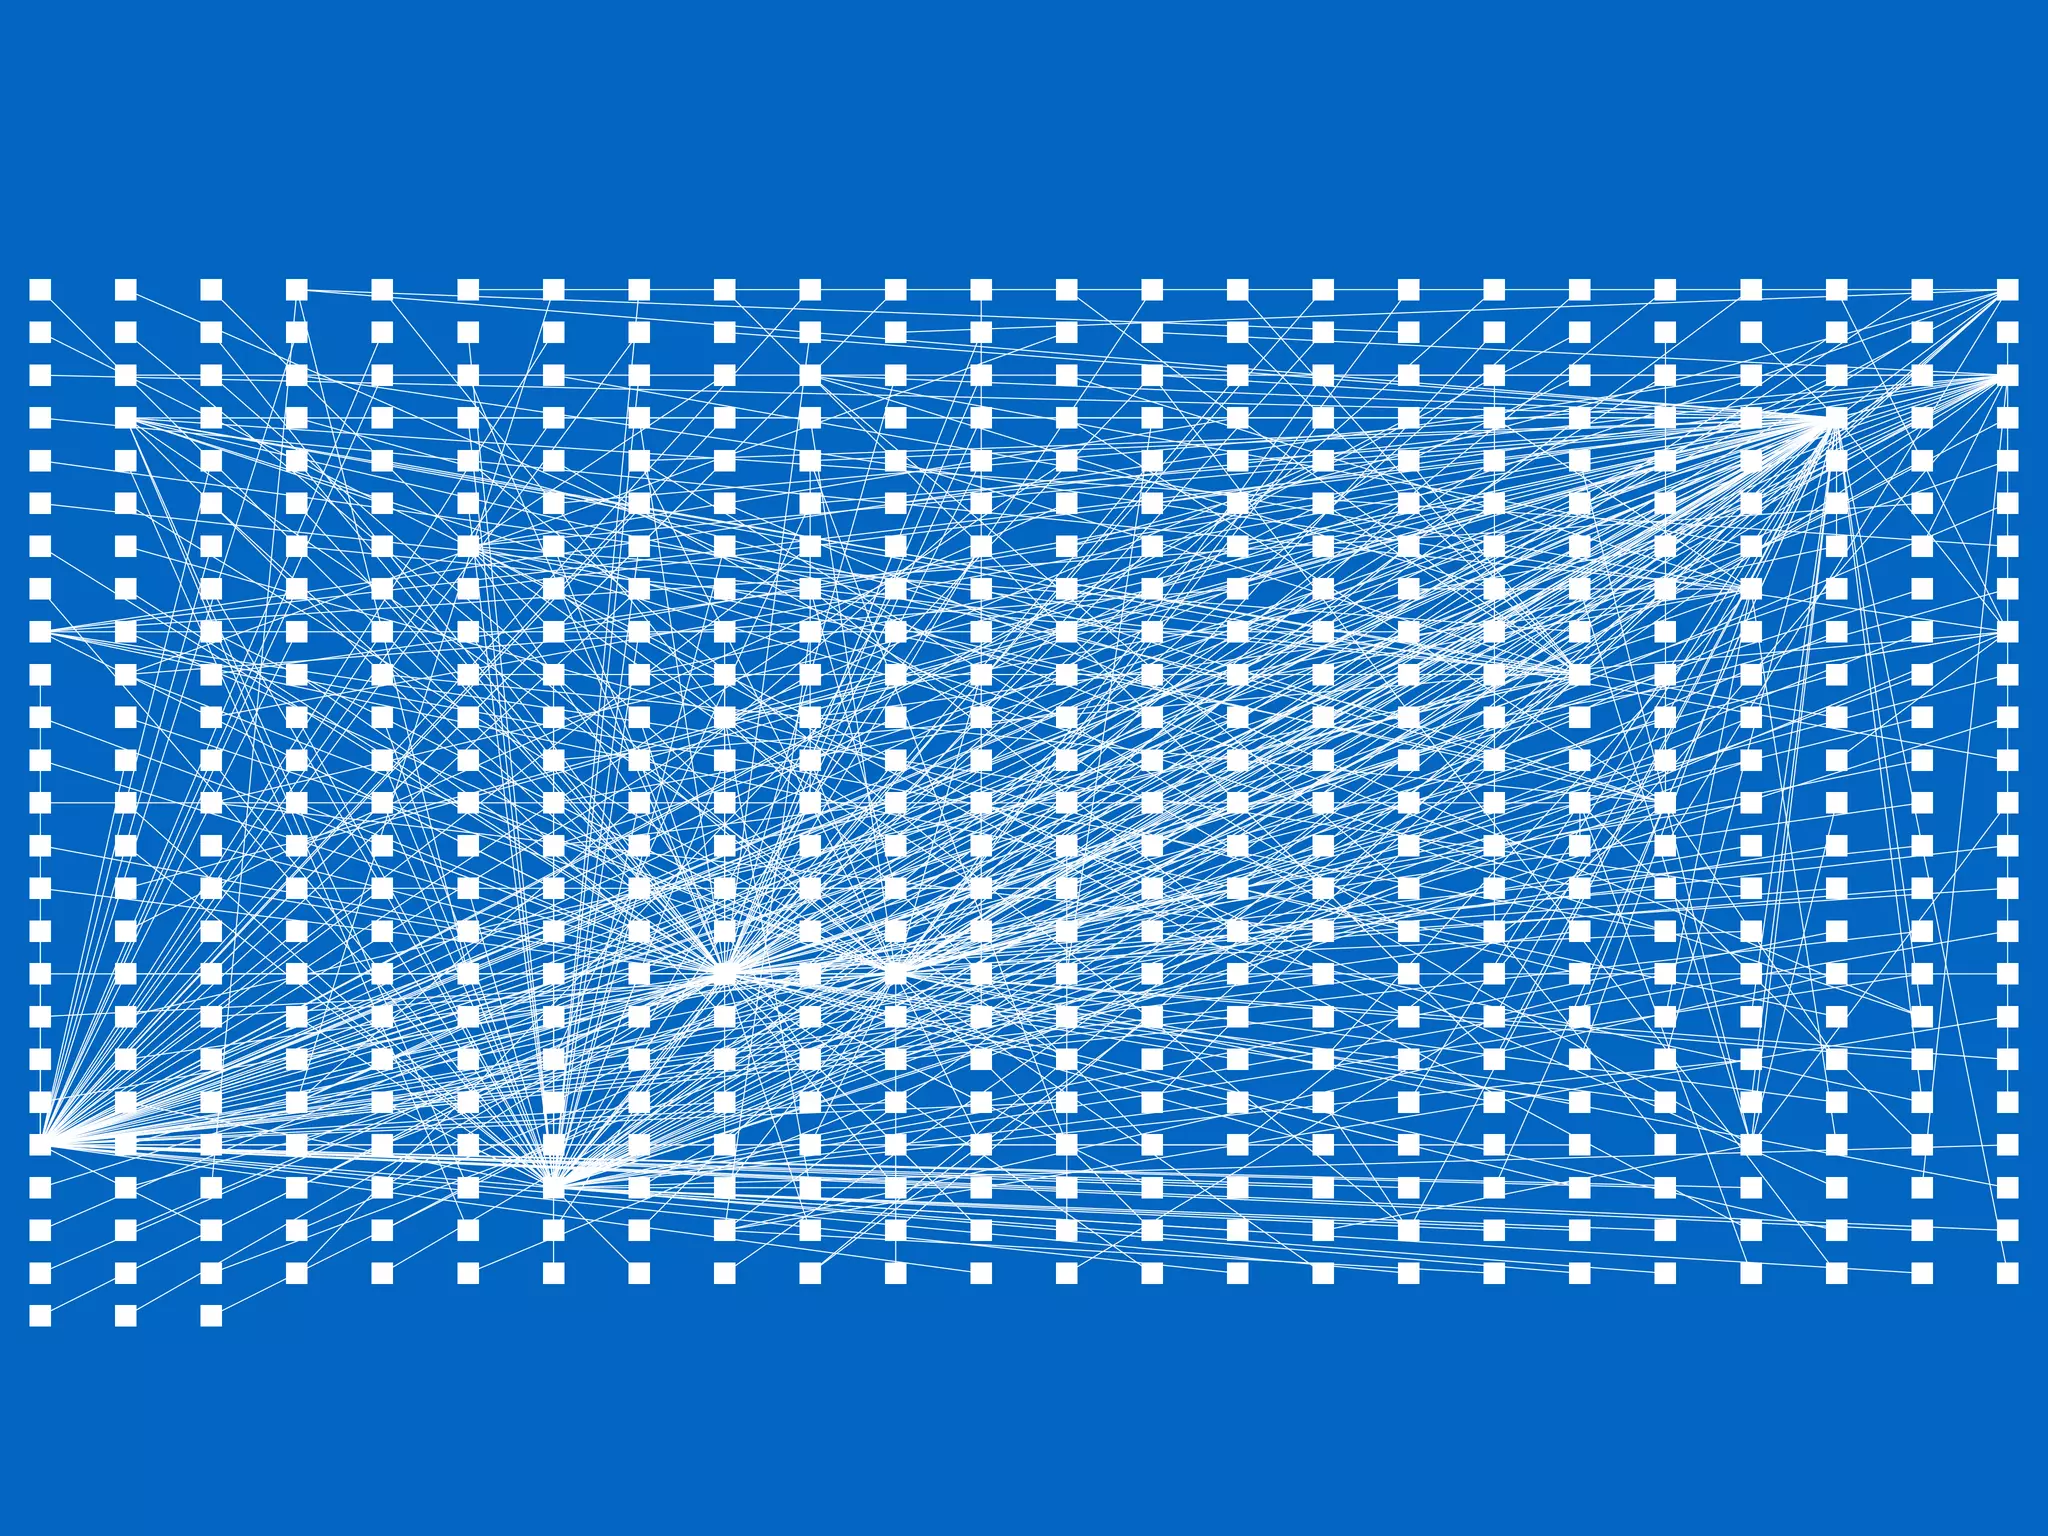
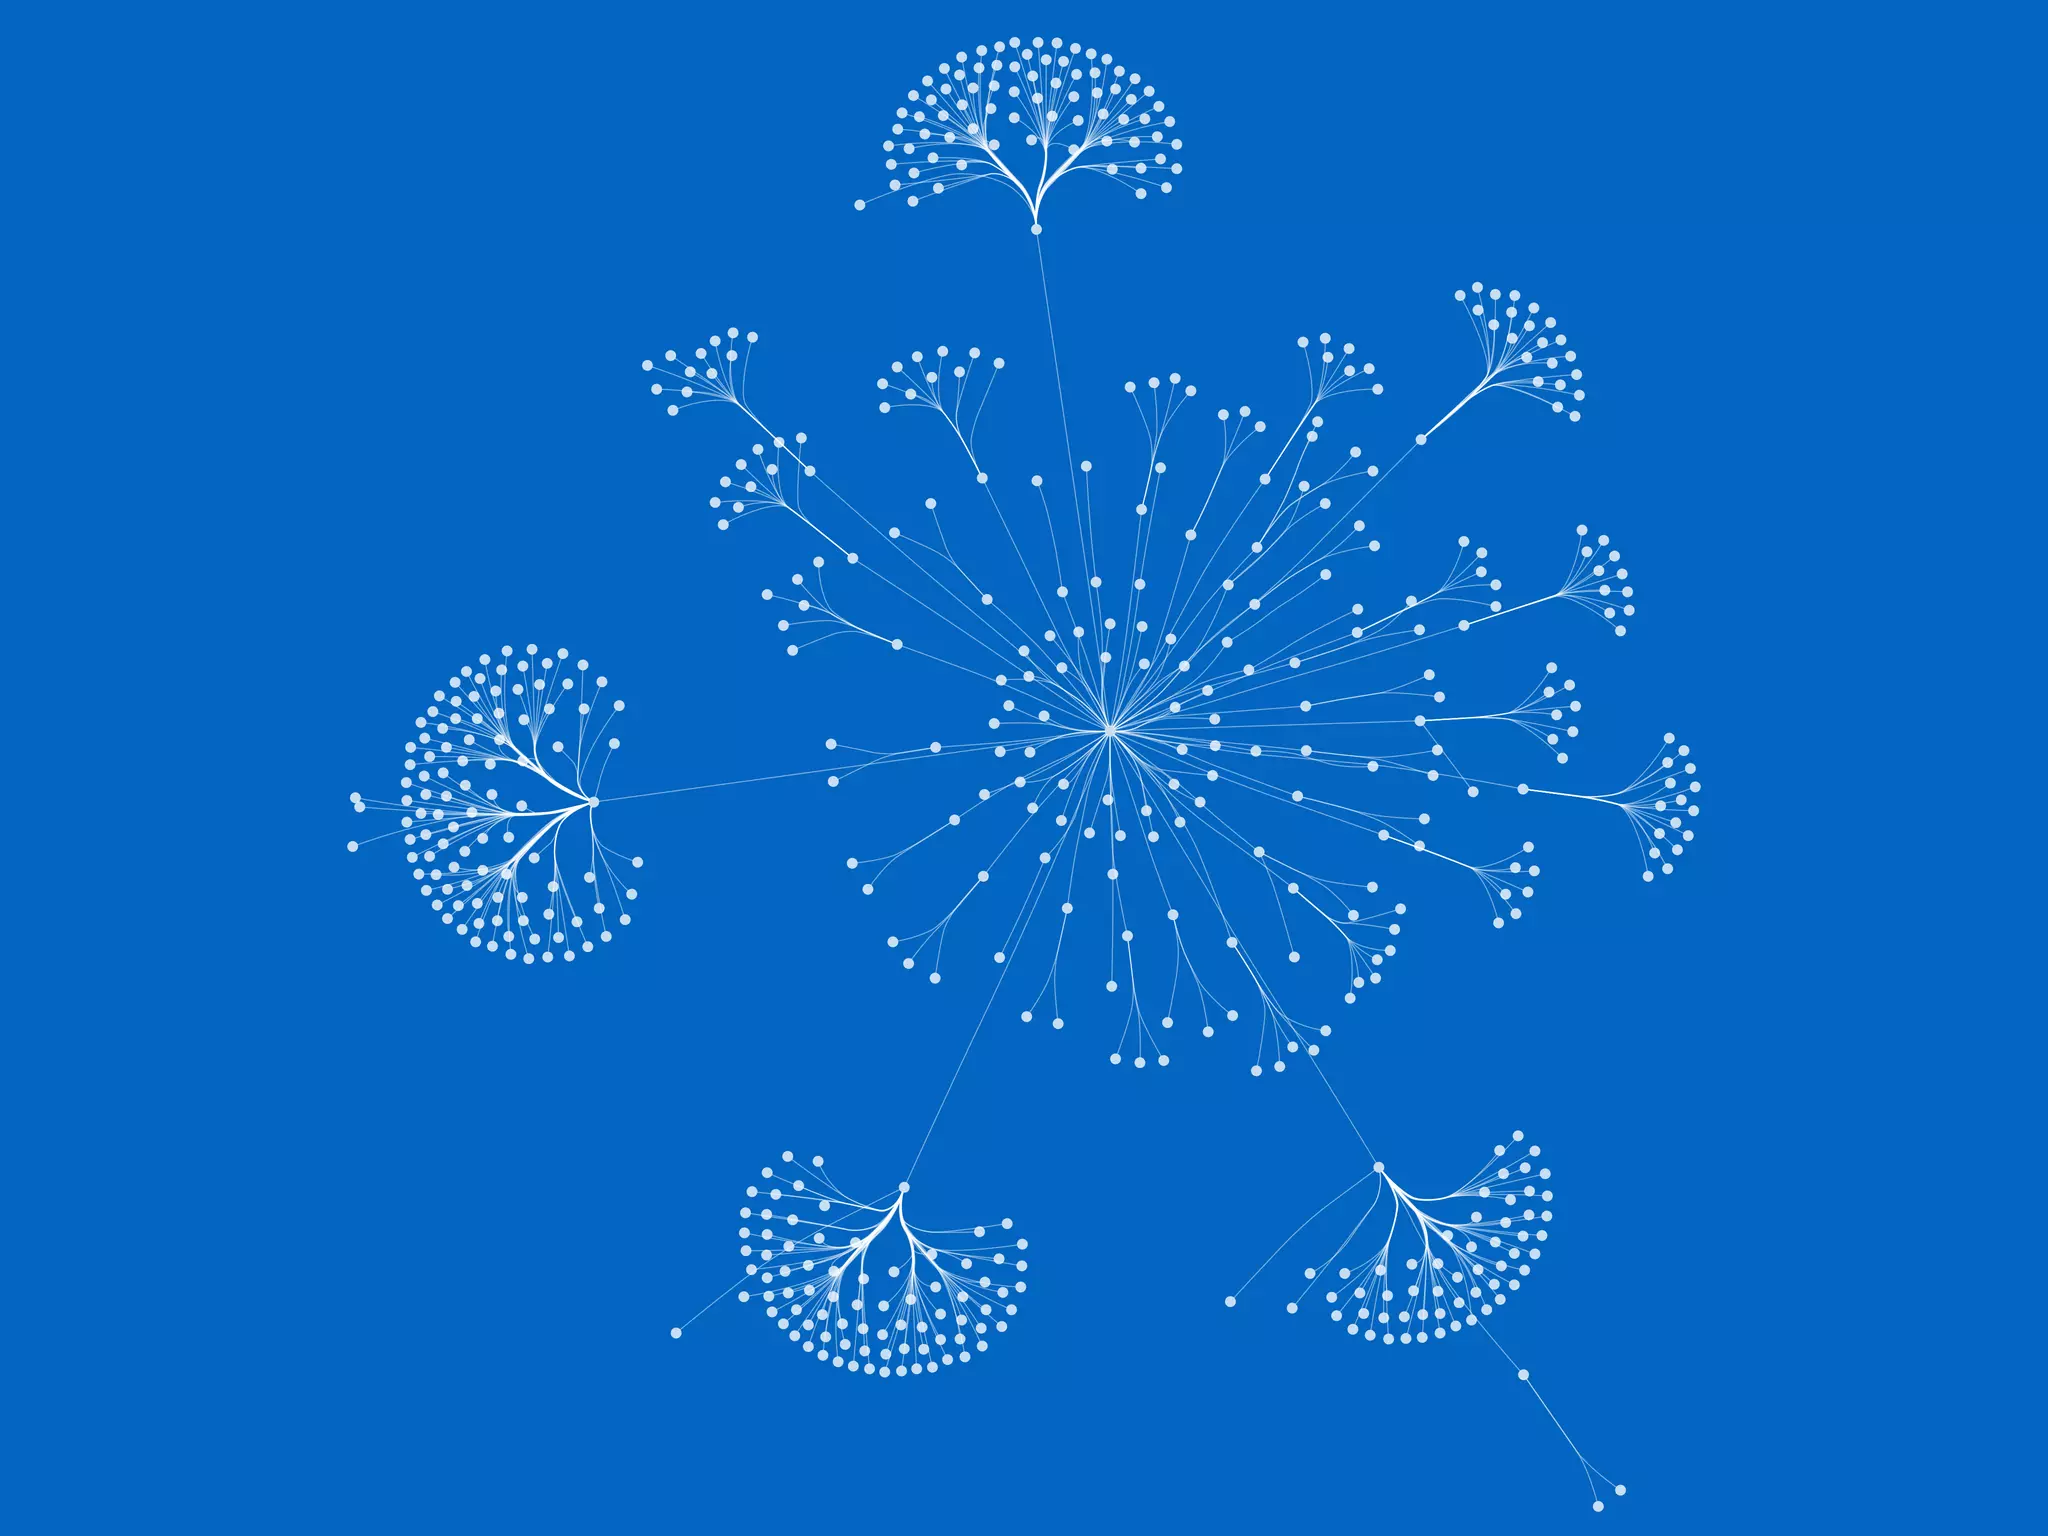
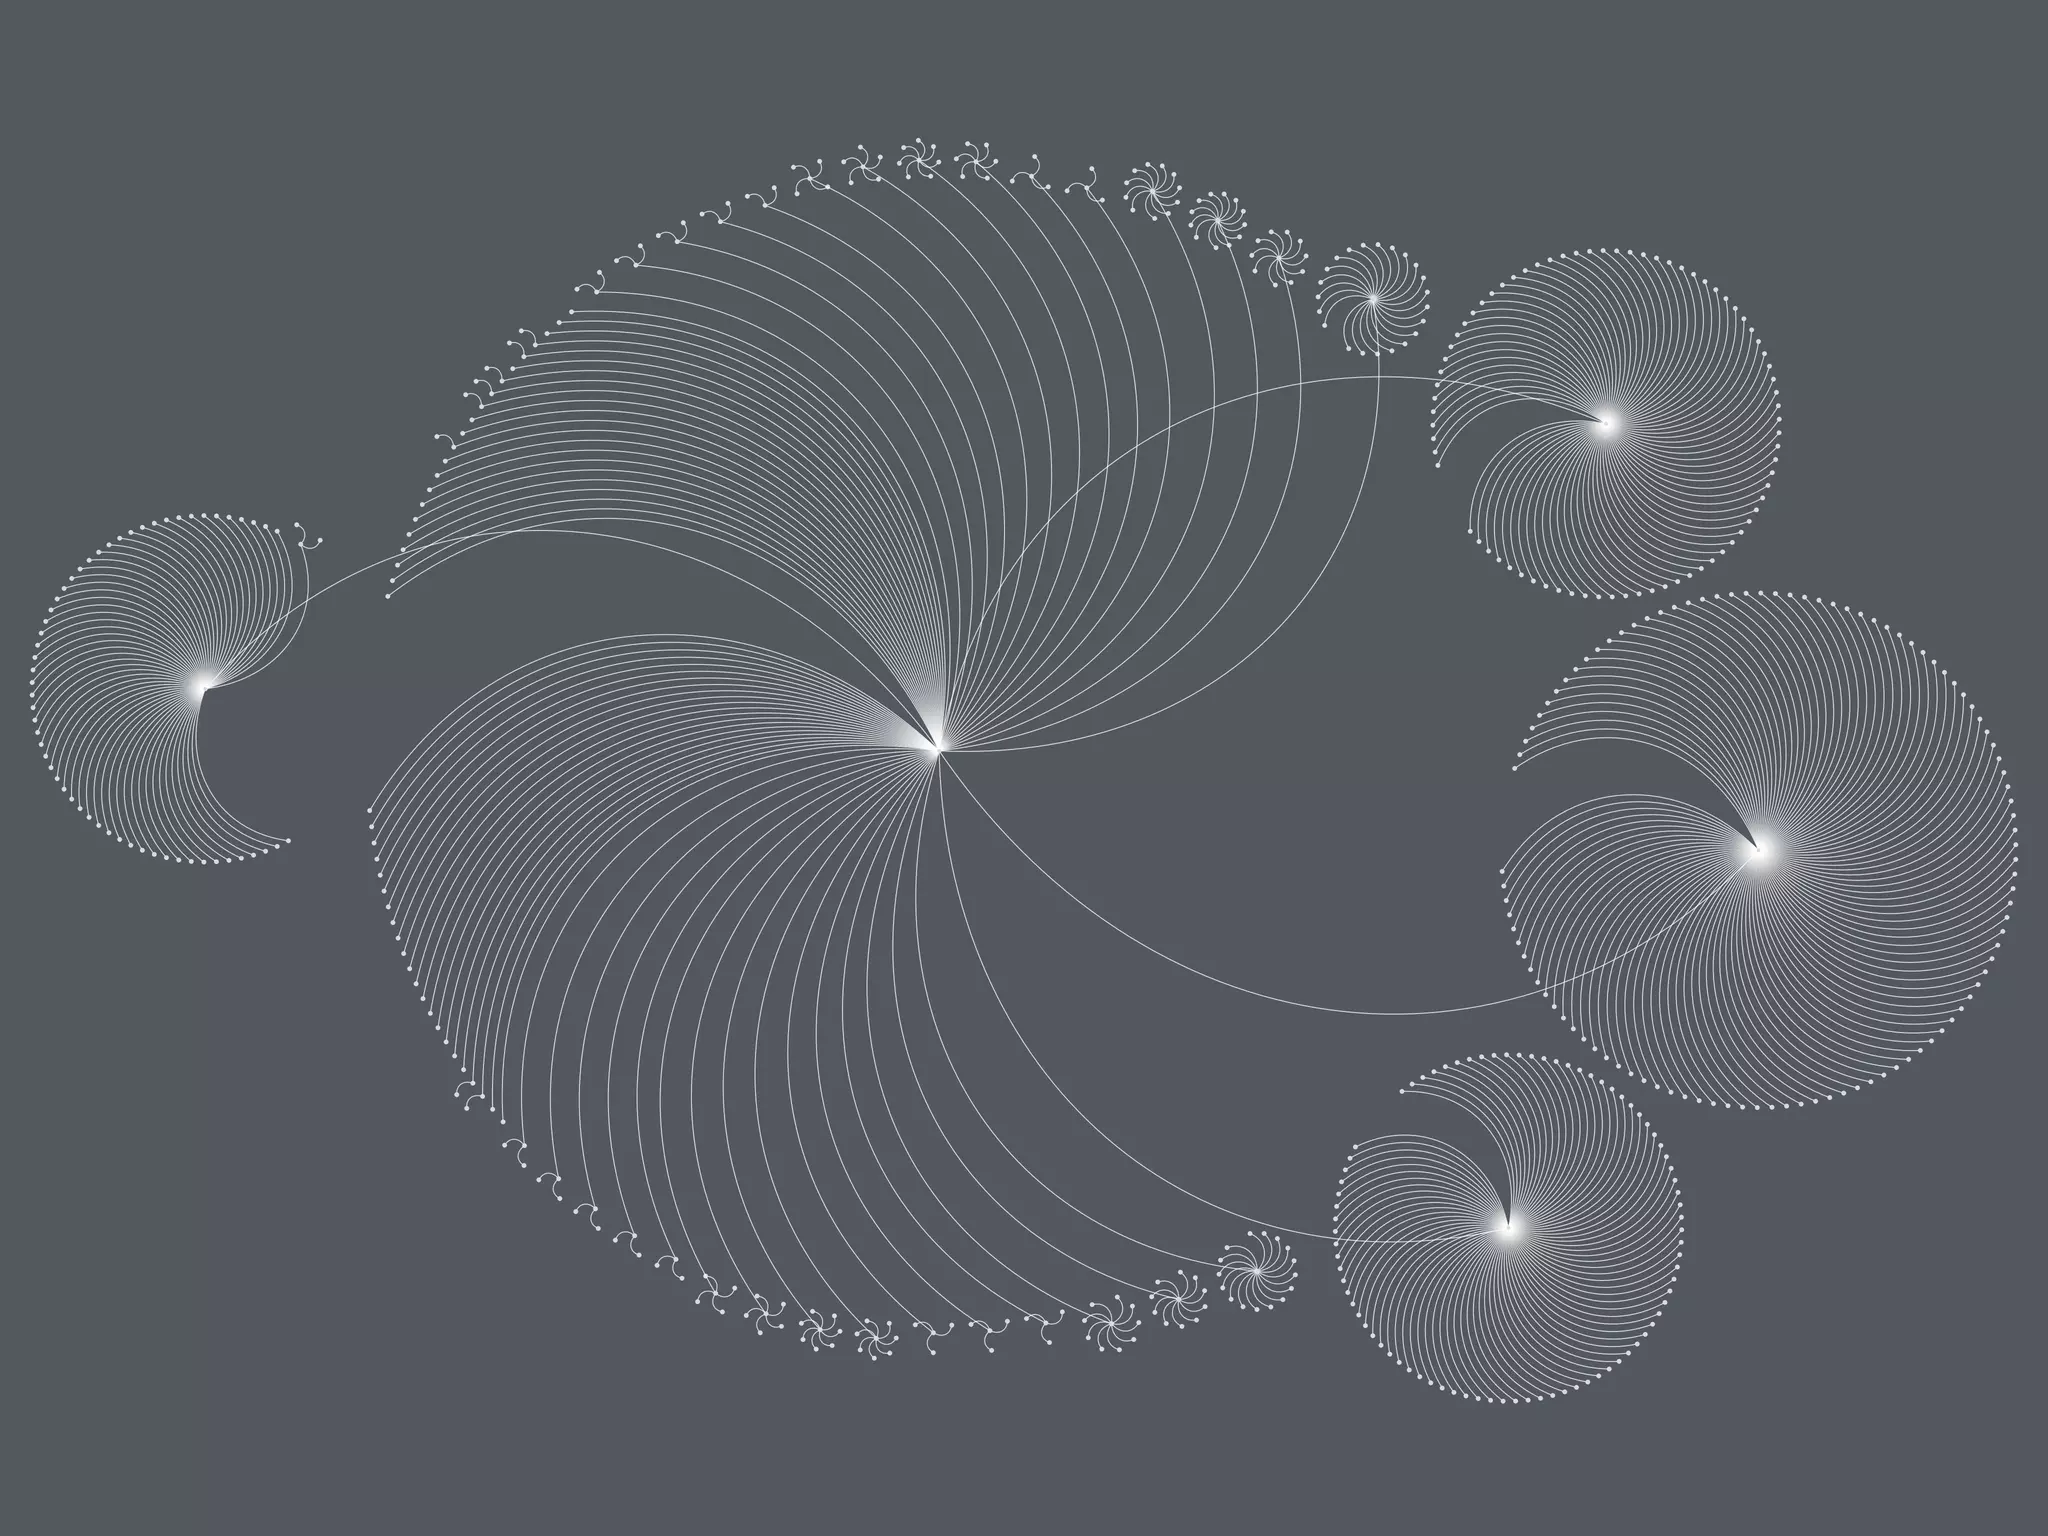
Explores the mapping of visual styles and layouts to represent network data effectively in Cytoscape.
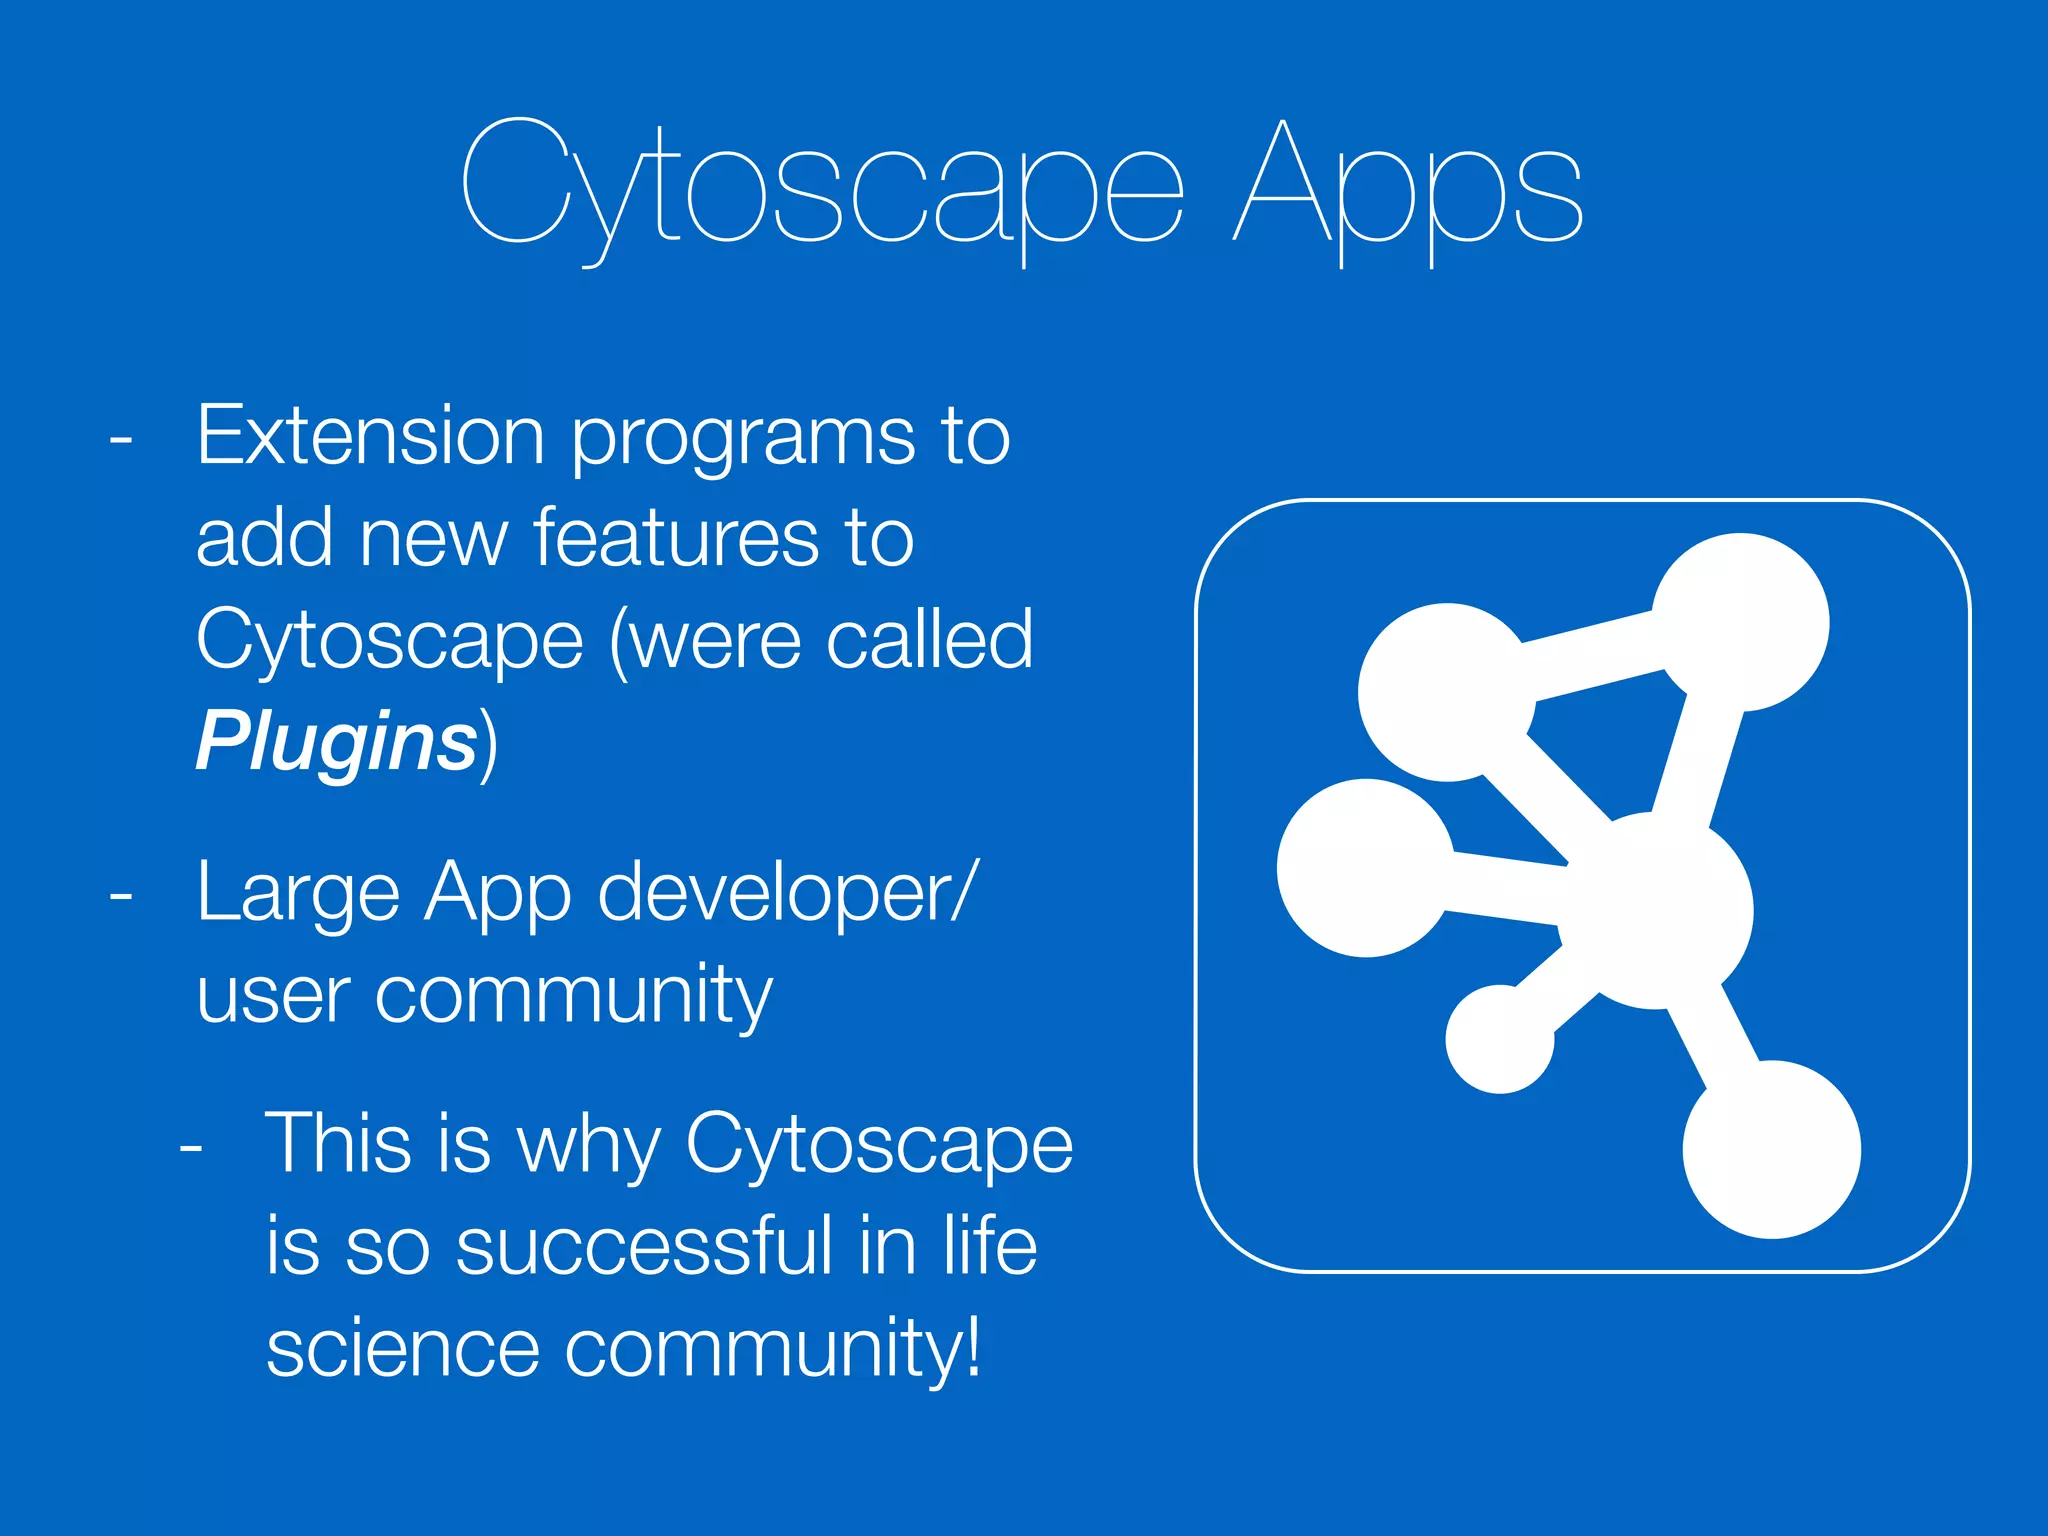
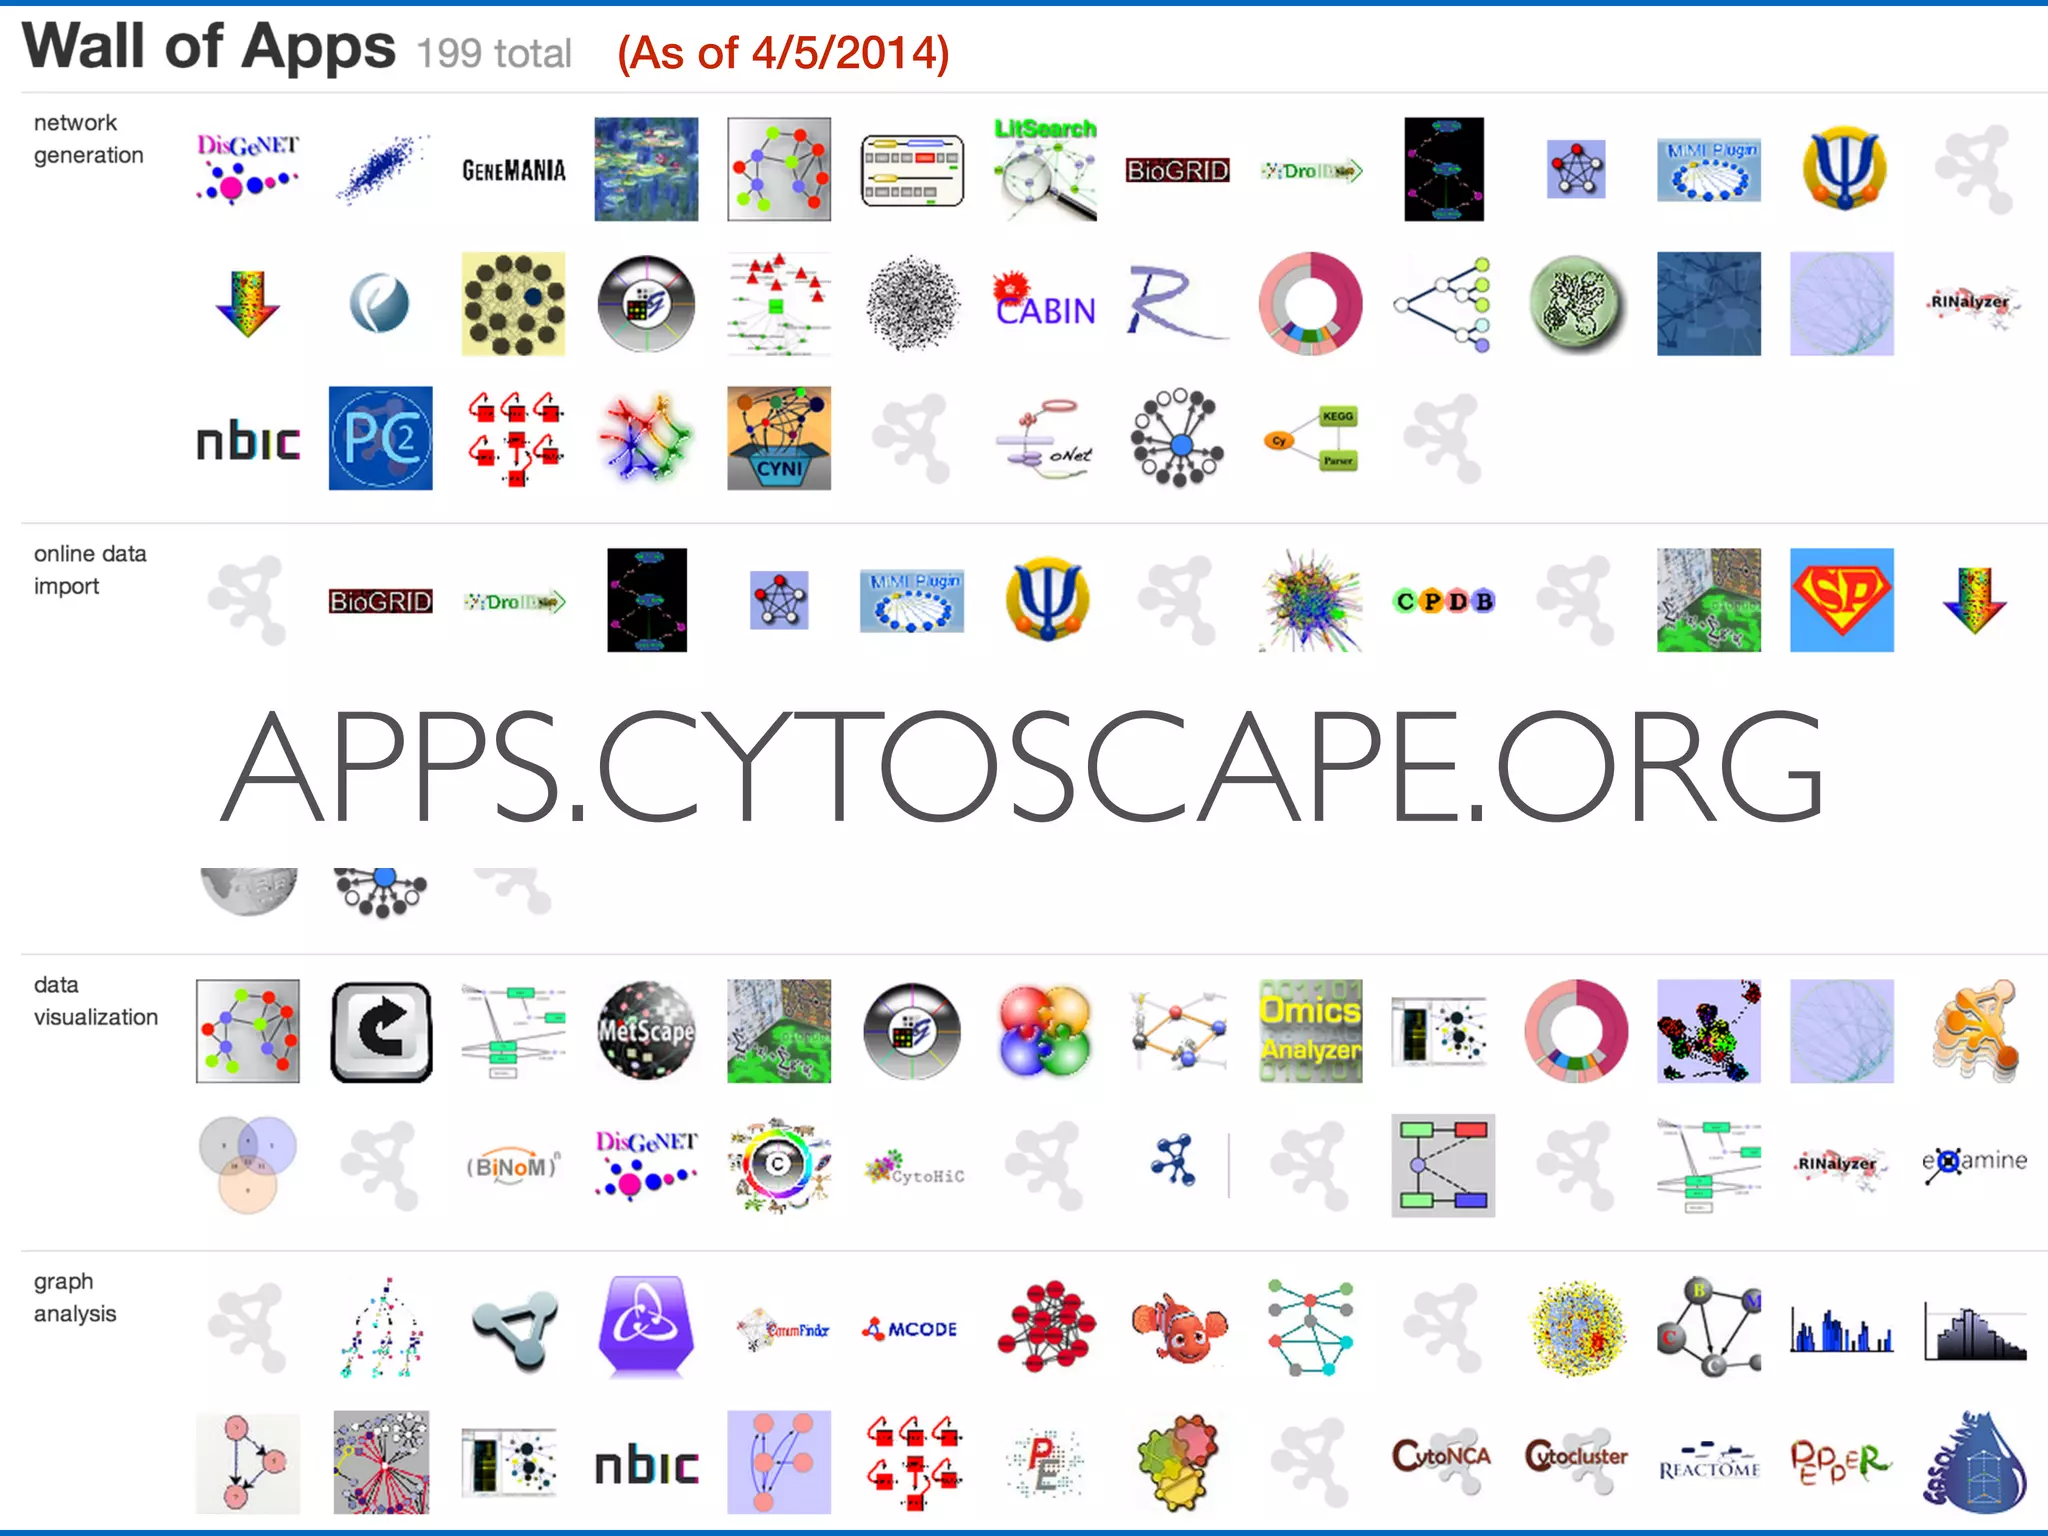
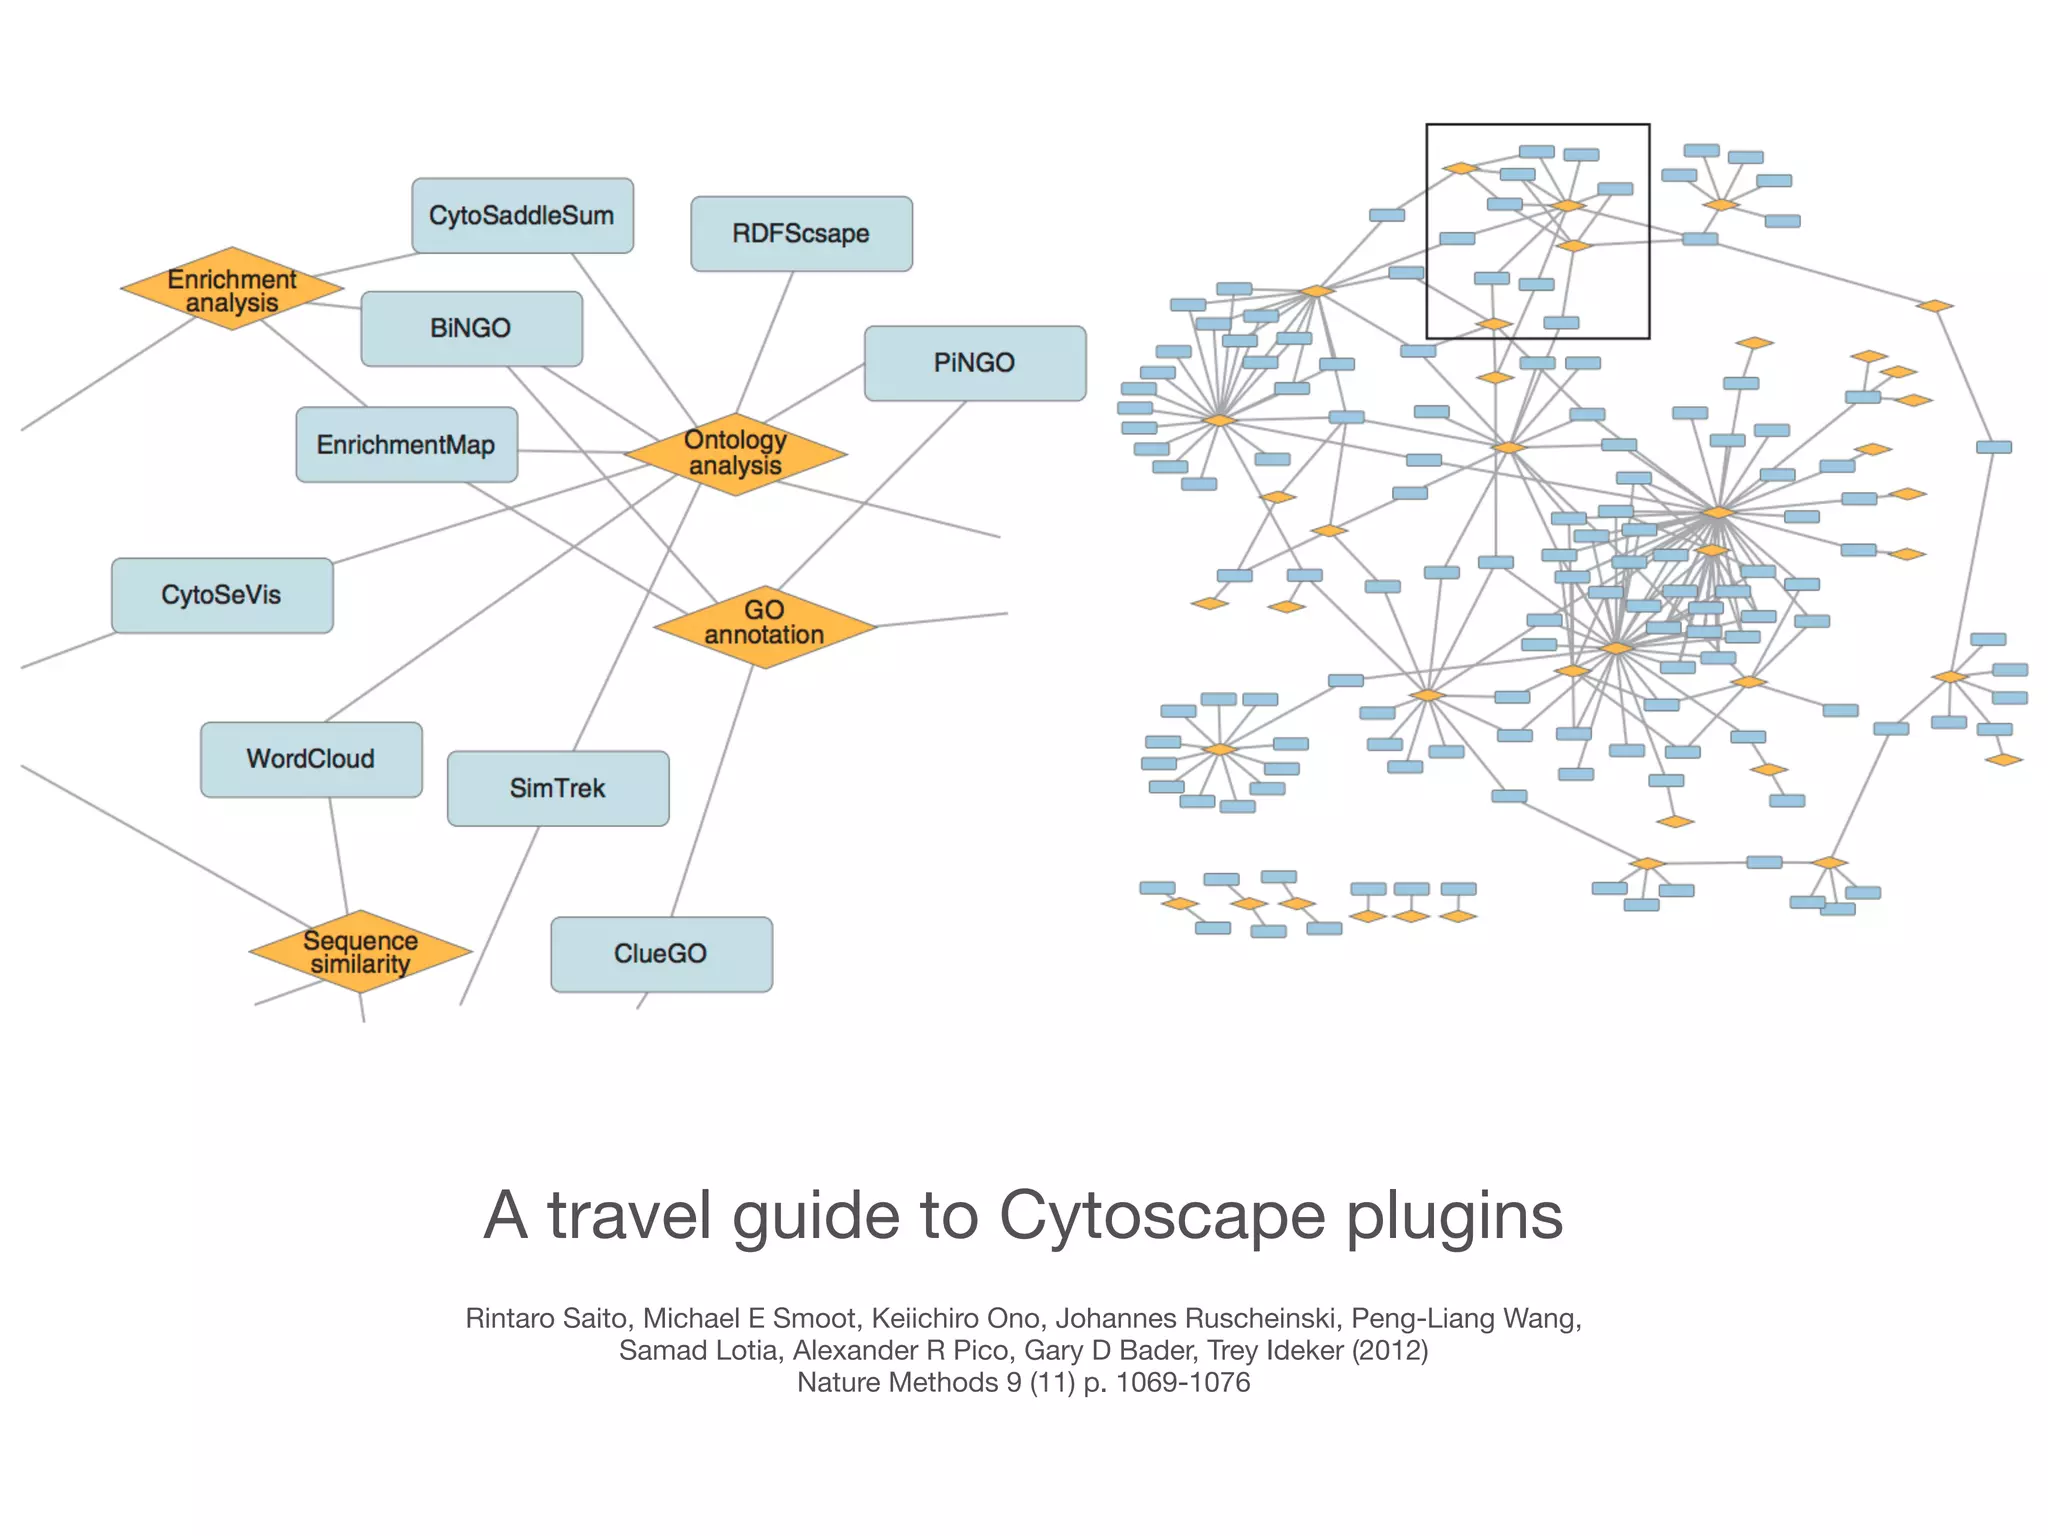
Introduces Cytoscape apps as extension programs that enhance functionalities and the importance of community involvement.
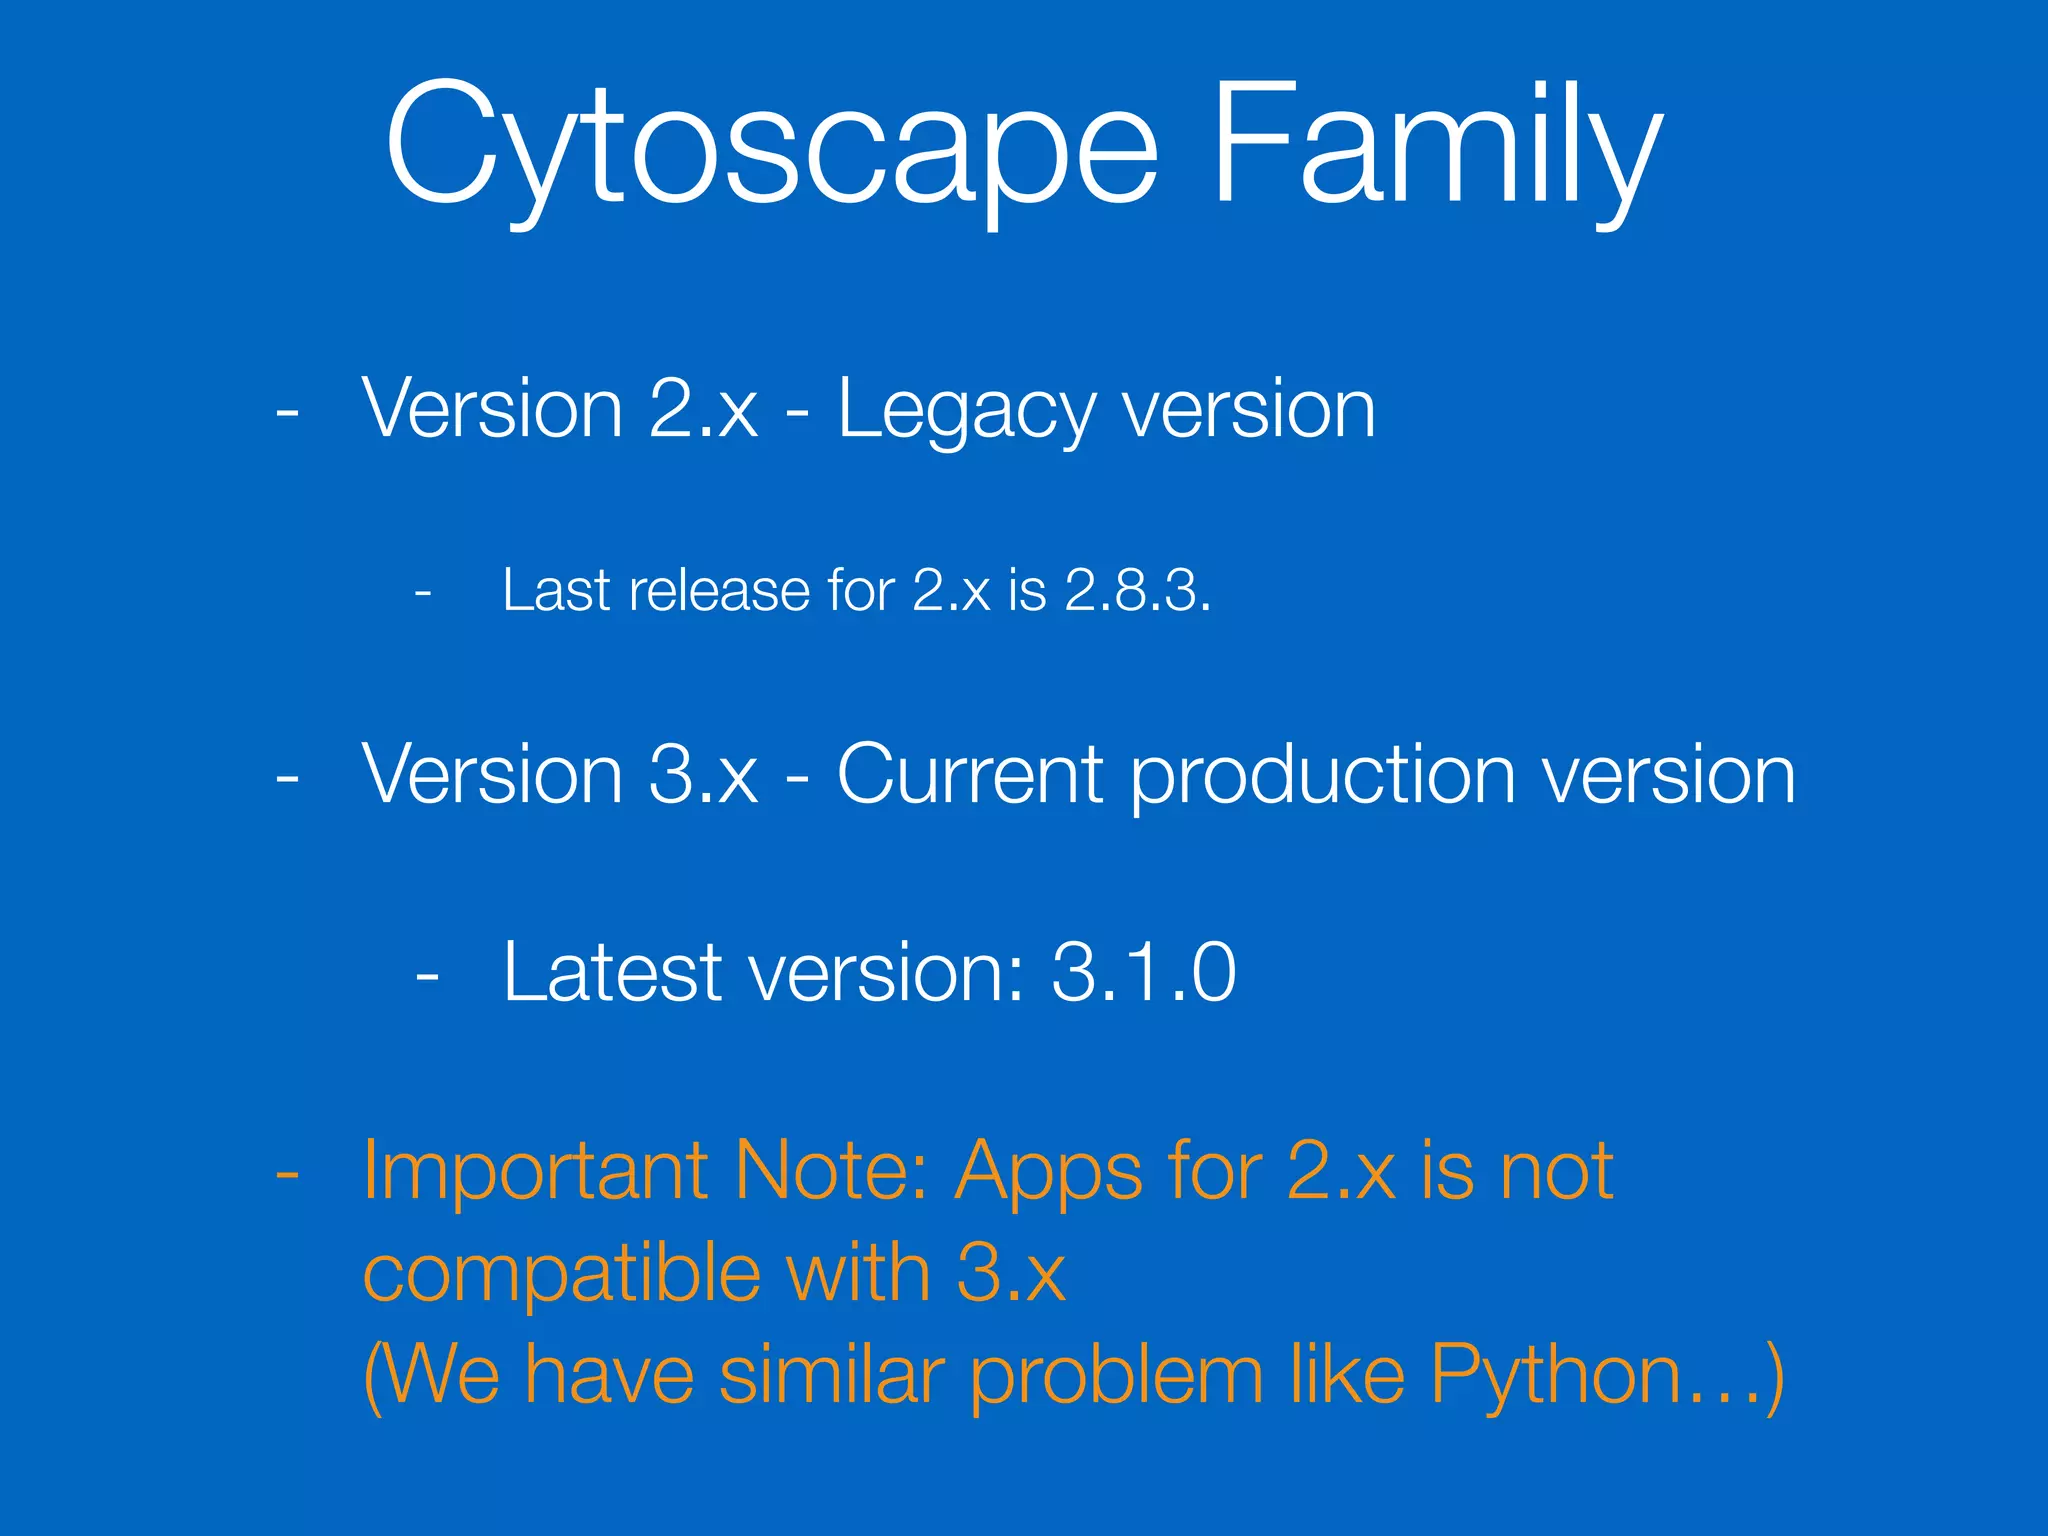
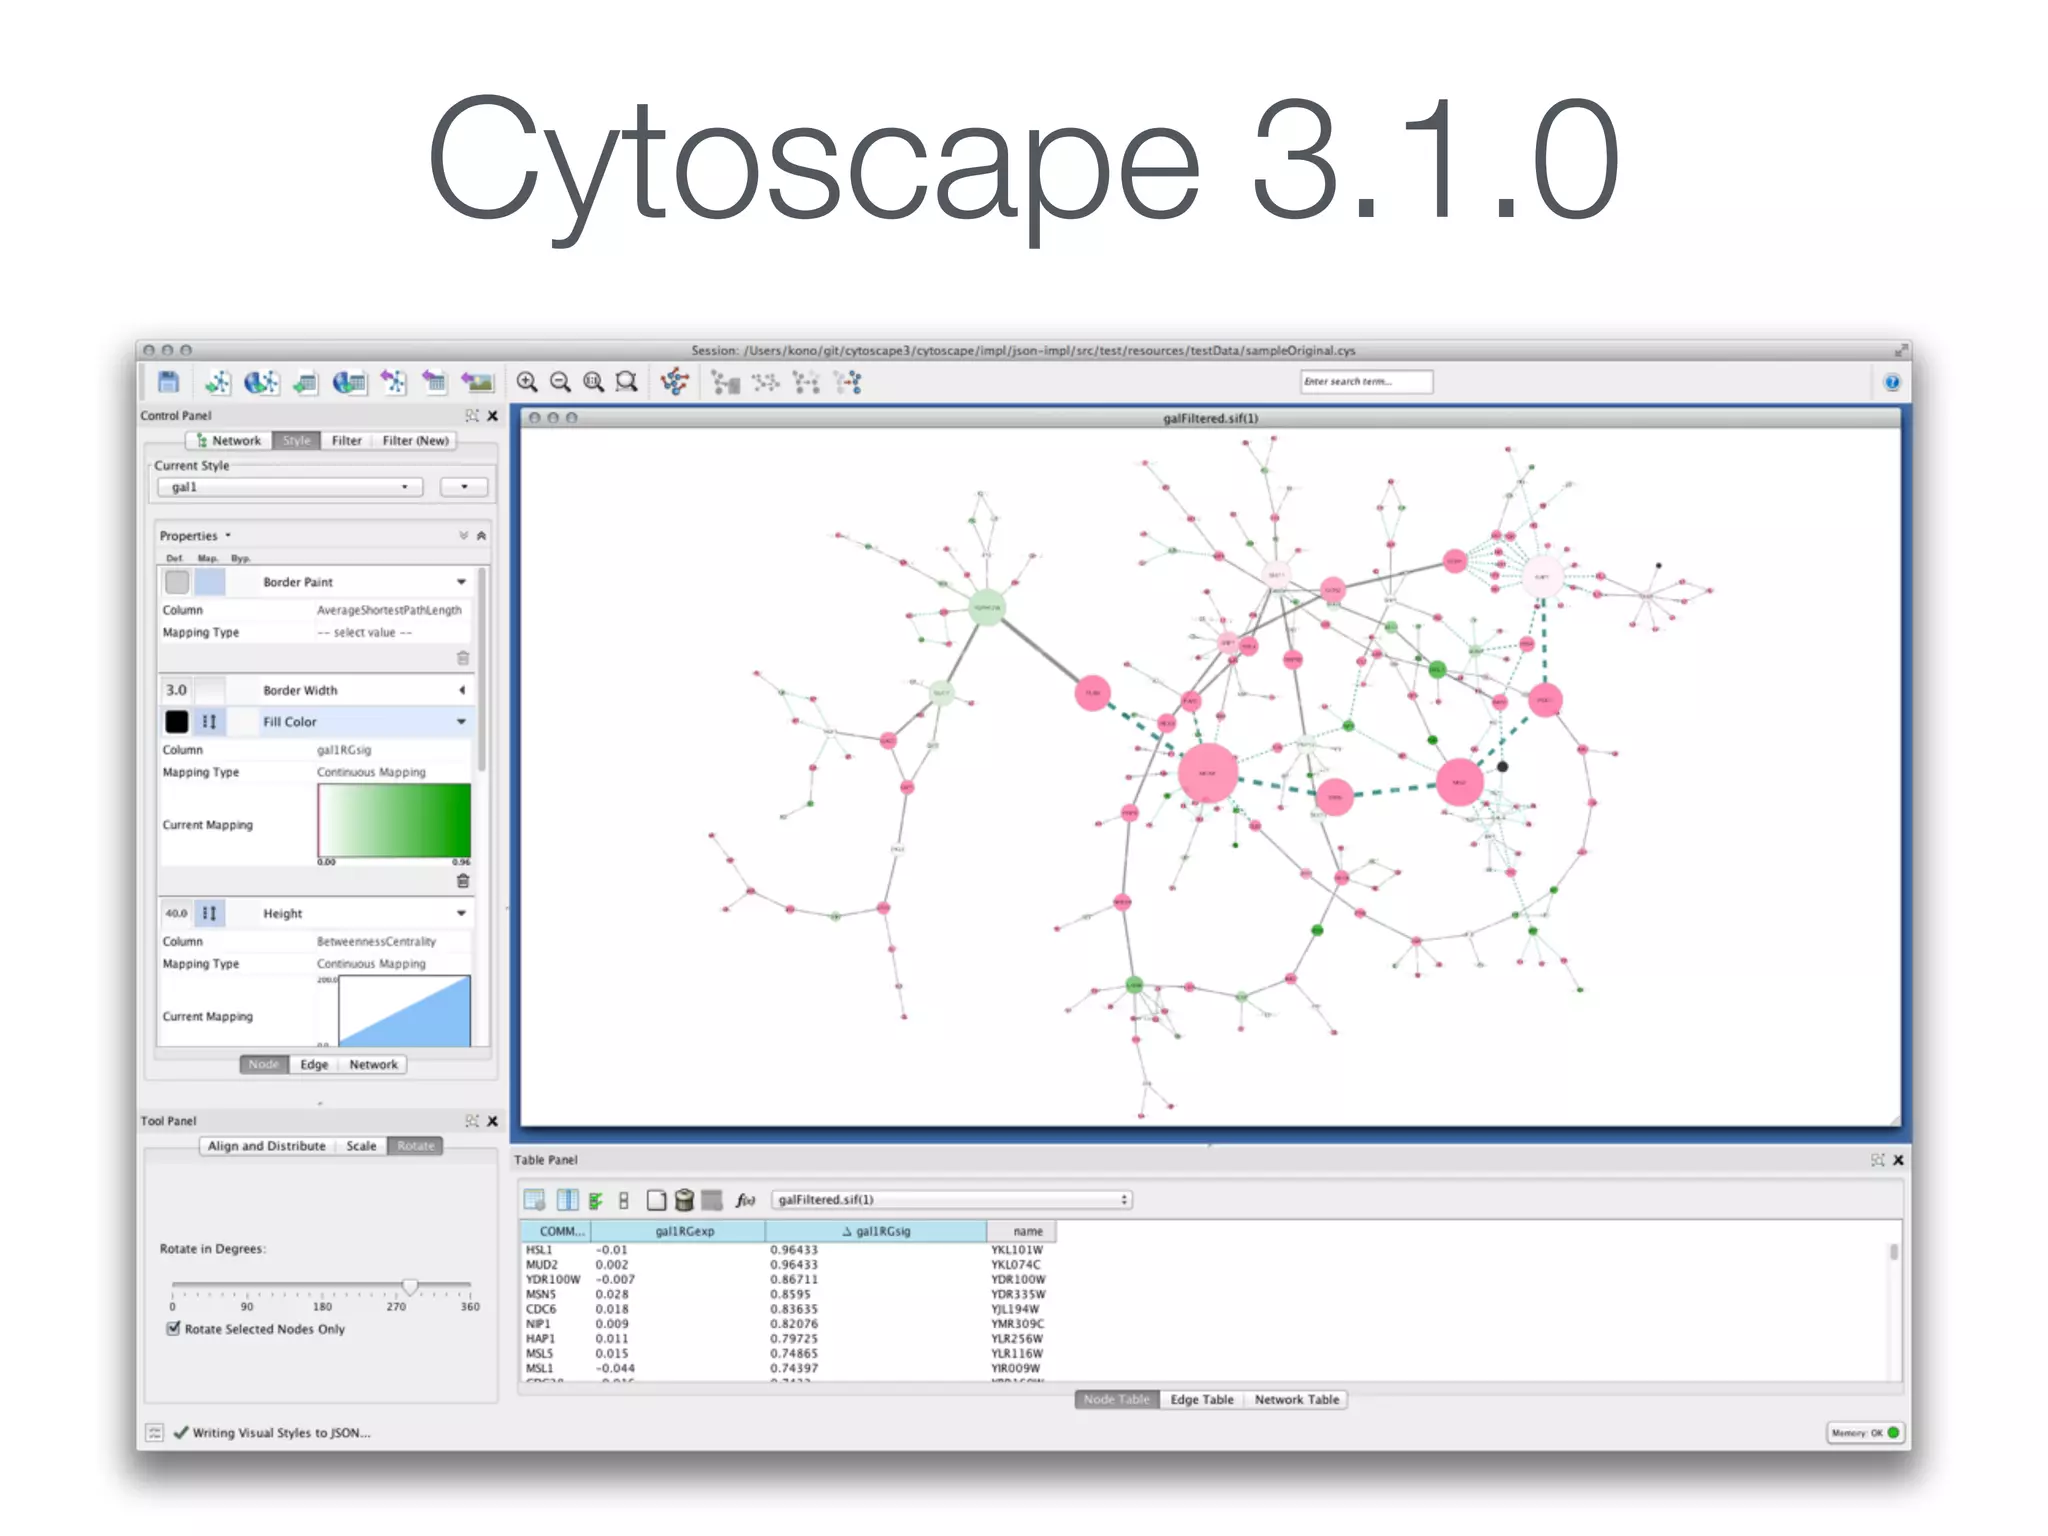
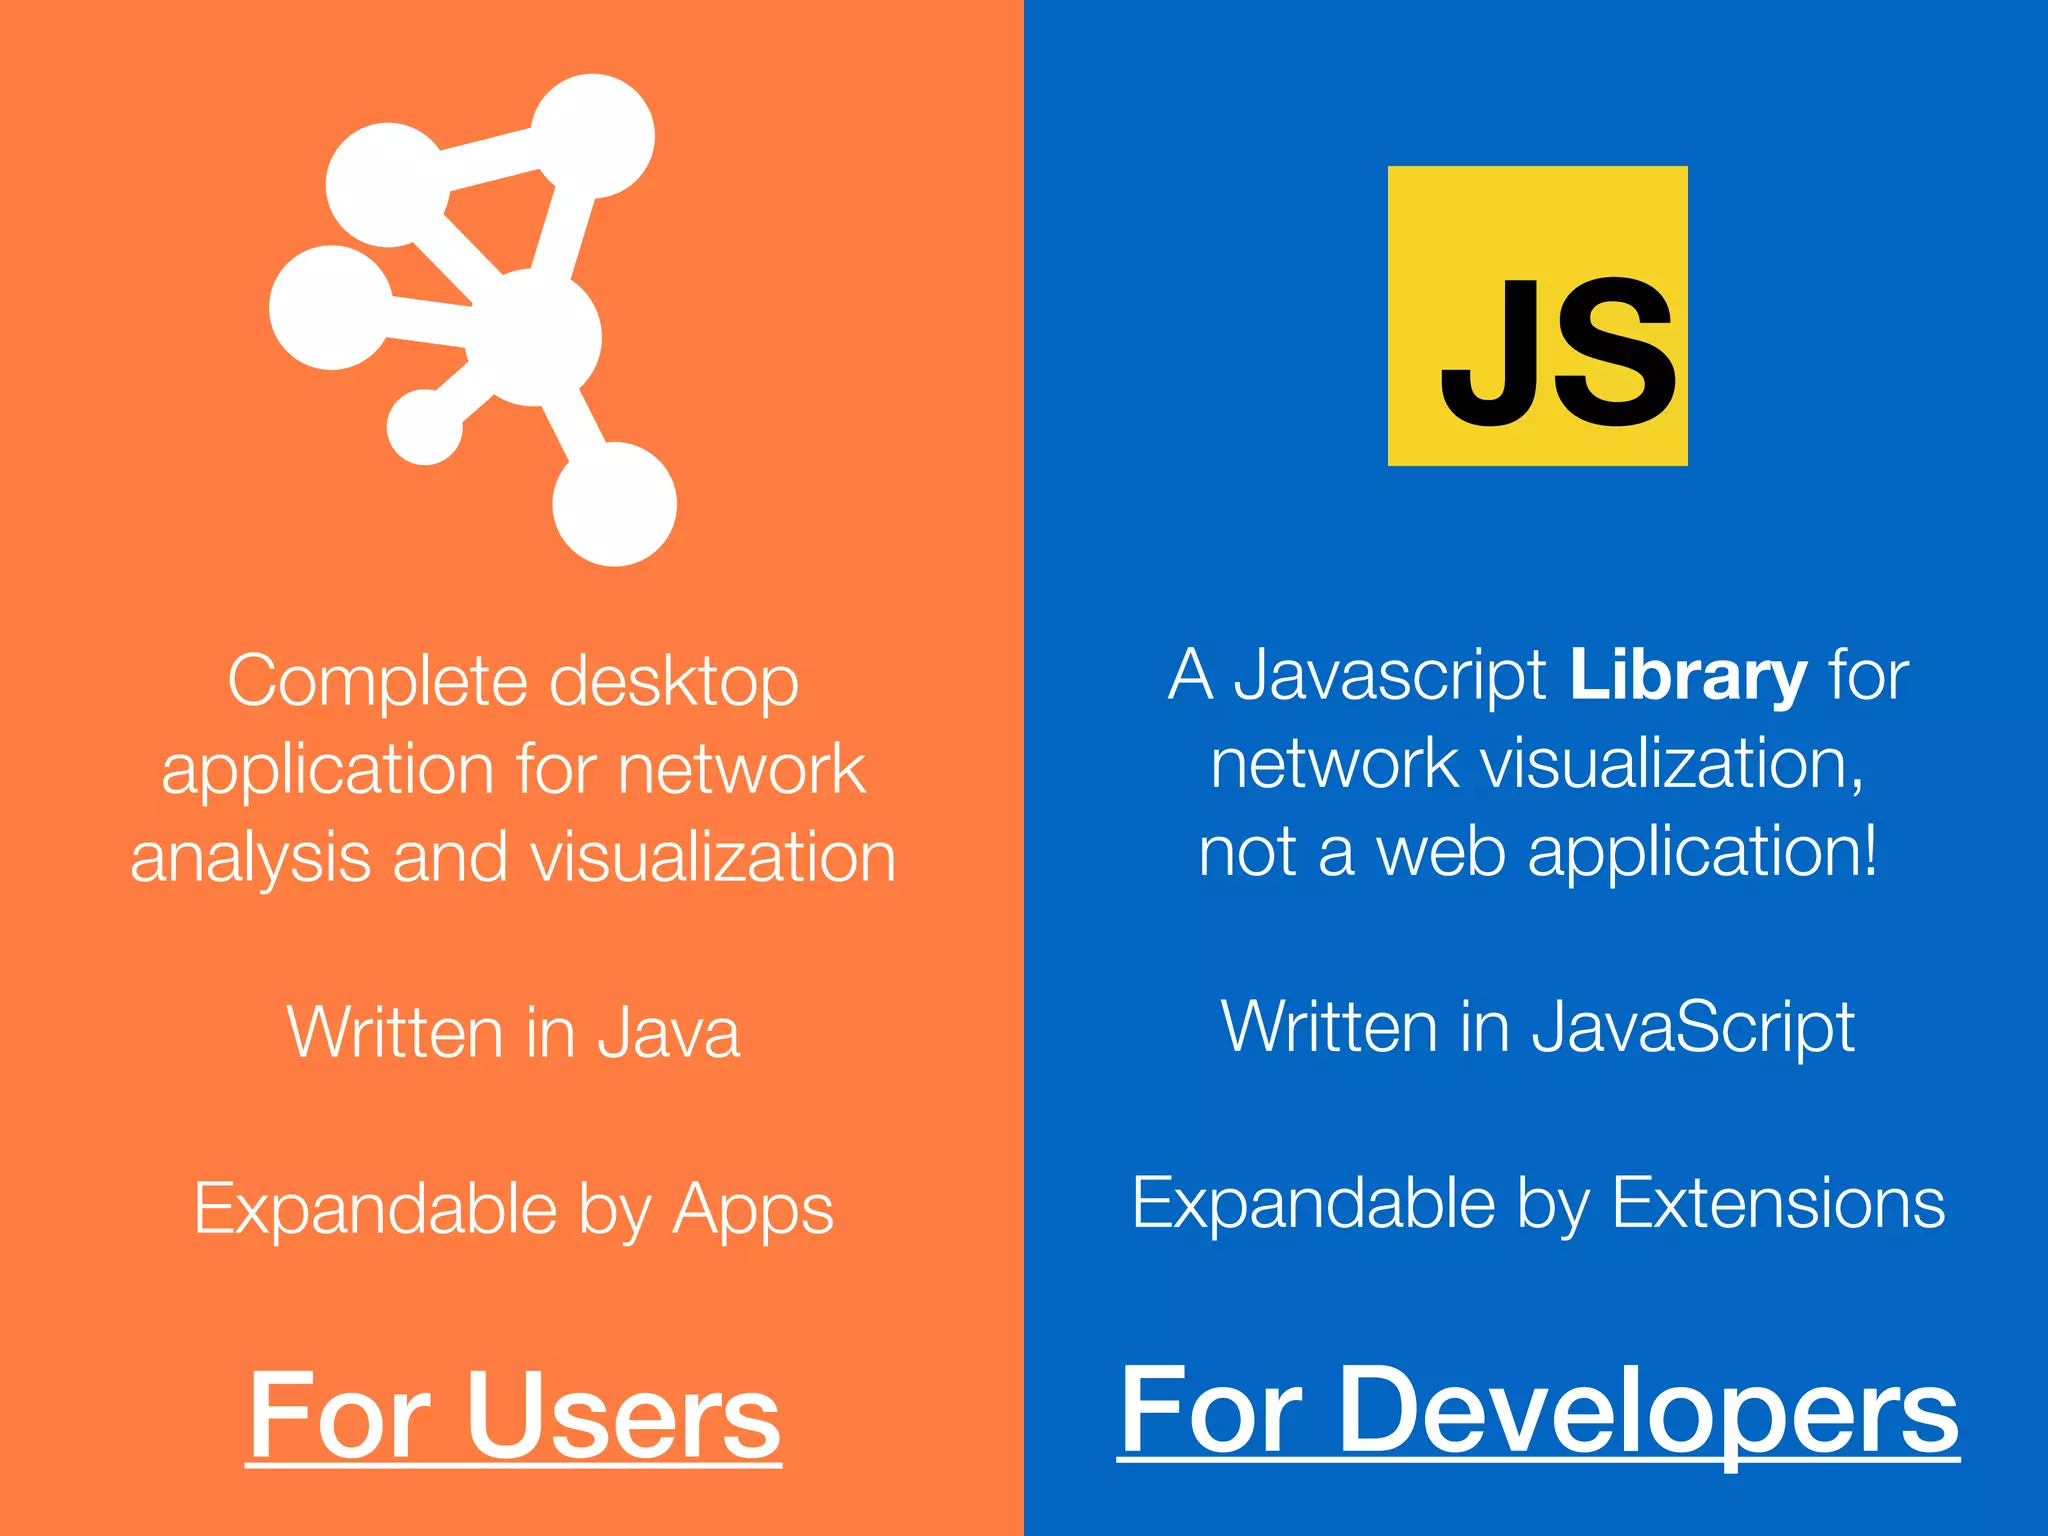
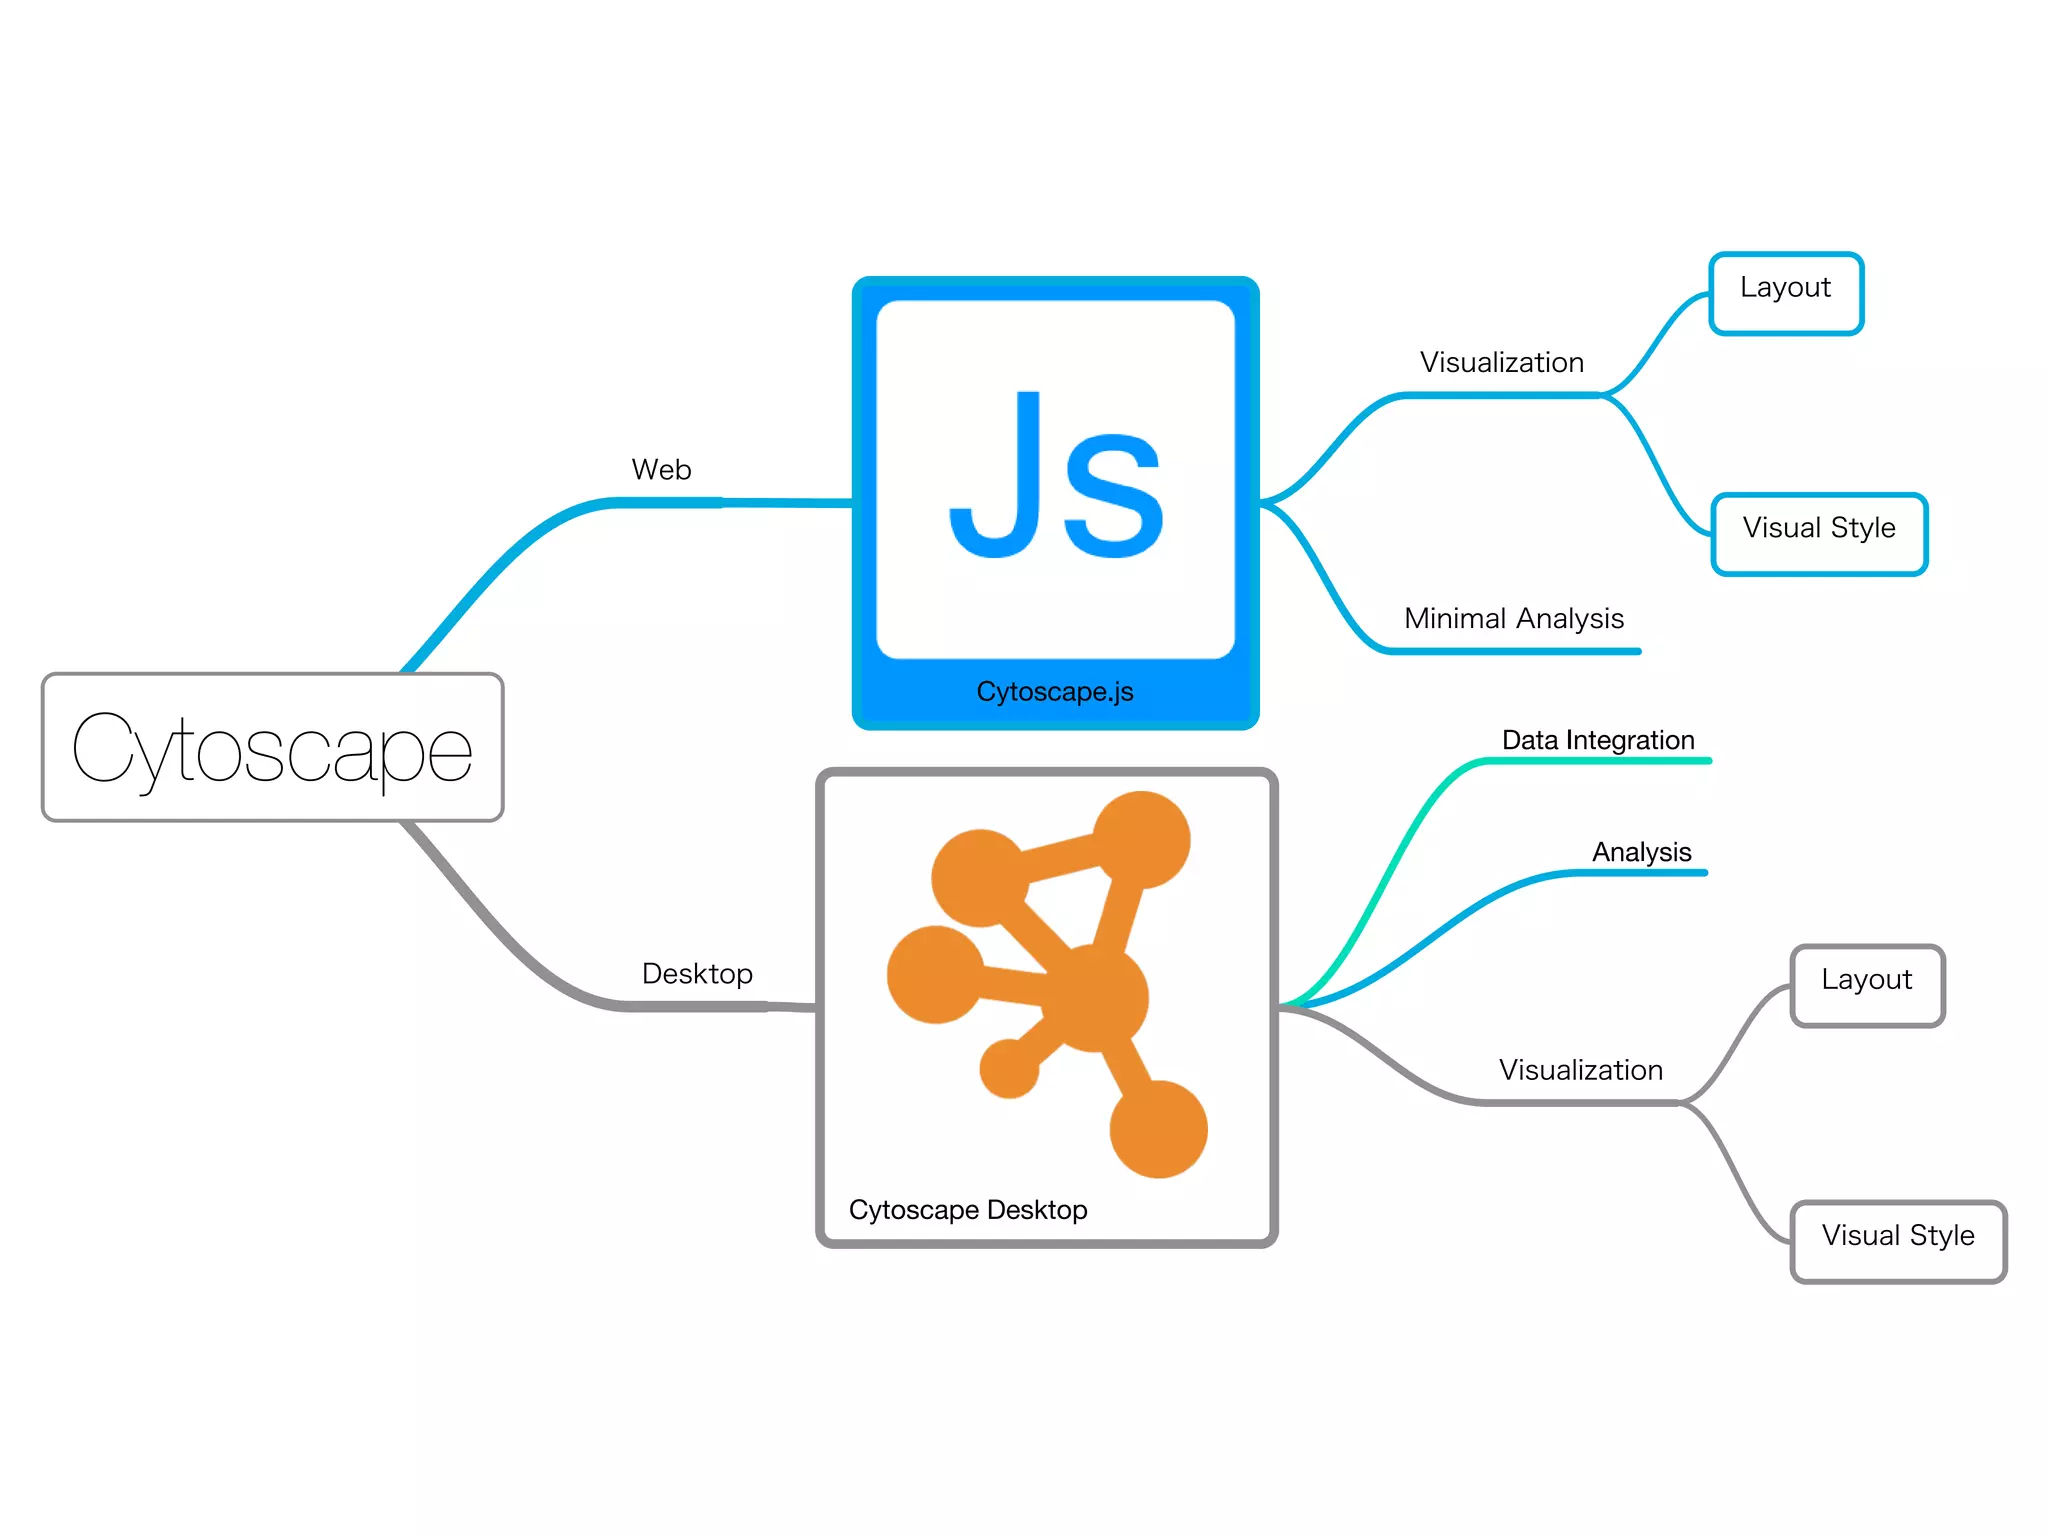
Discusses the Cytoscape family, highlighting differences between versions and compatibility issues with applications.
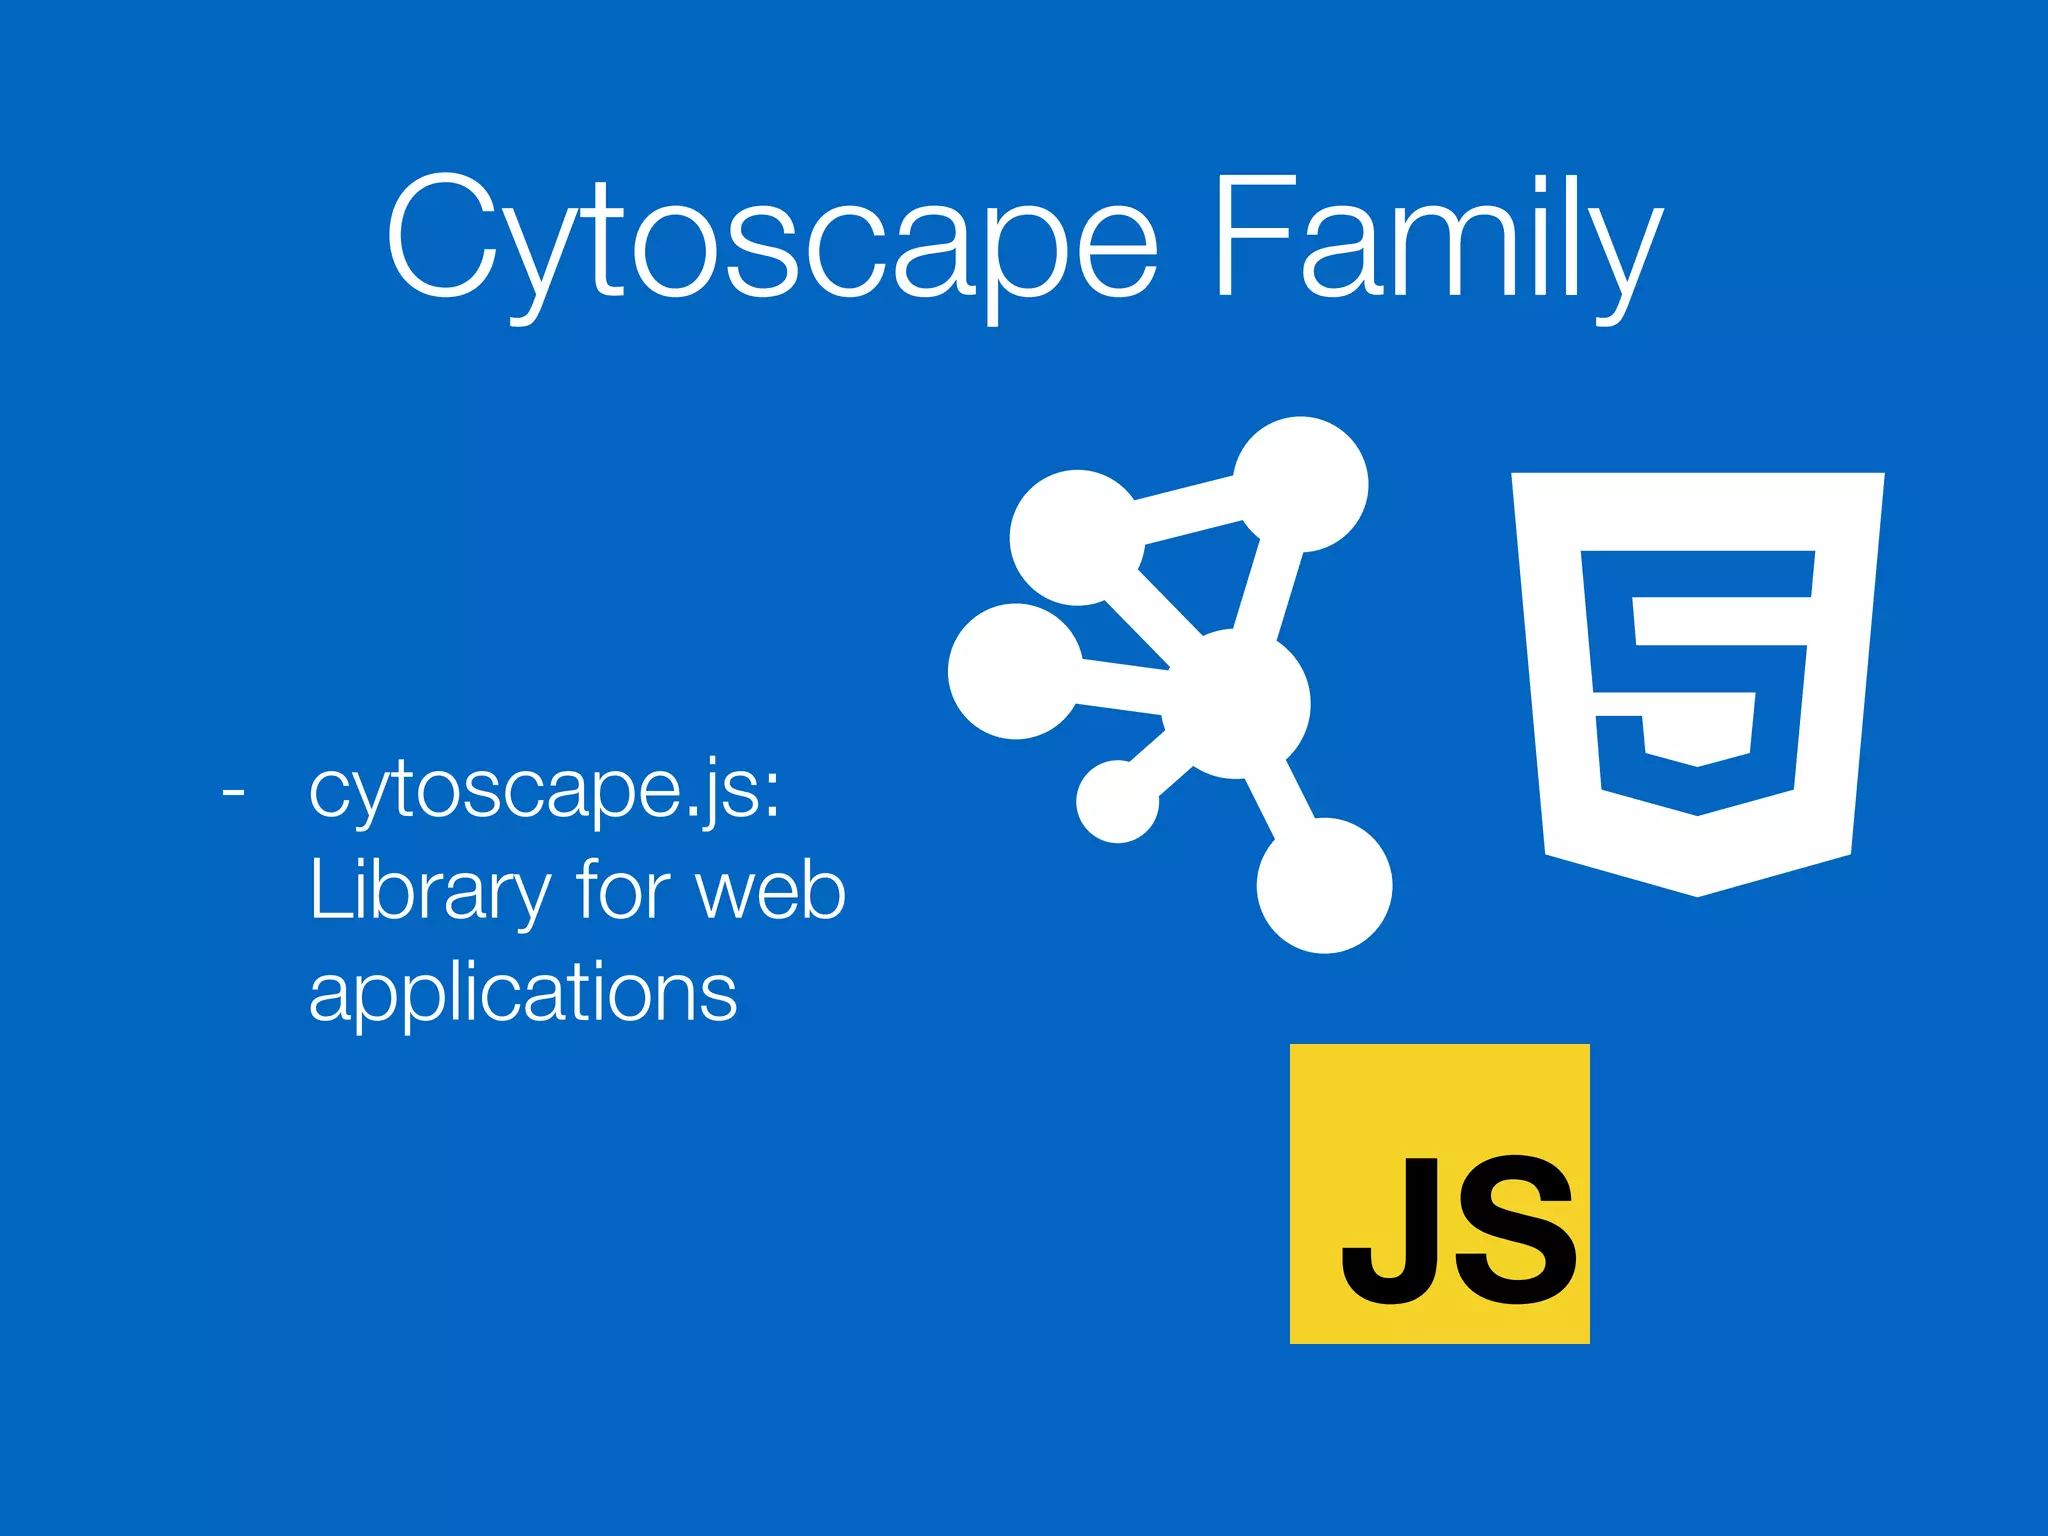
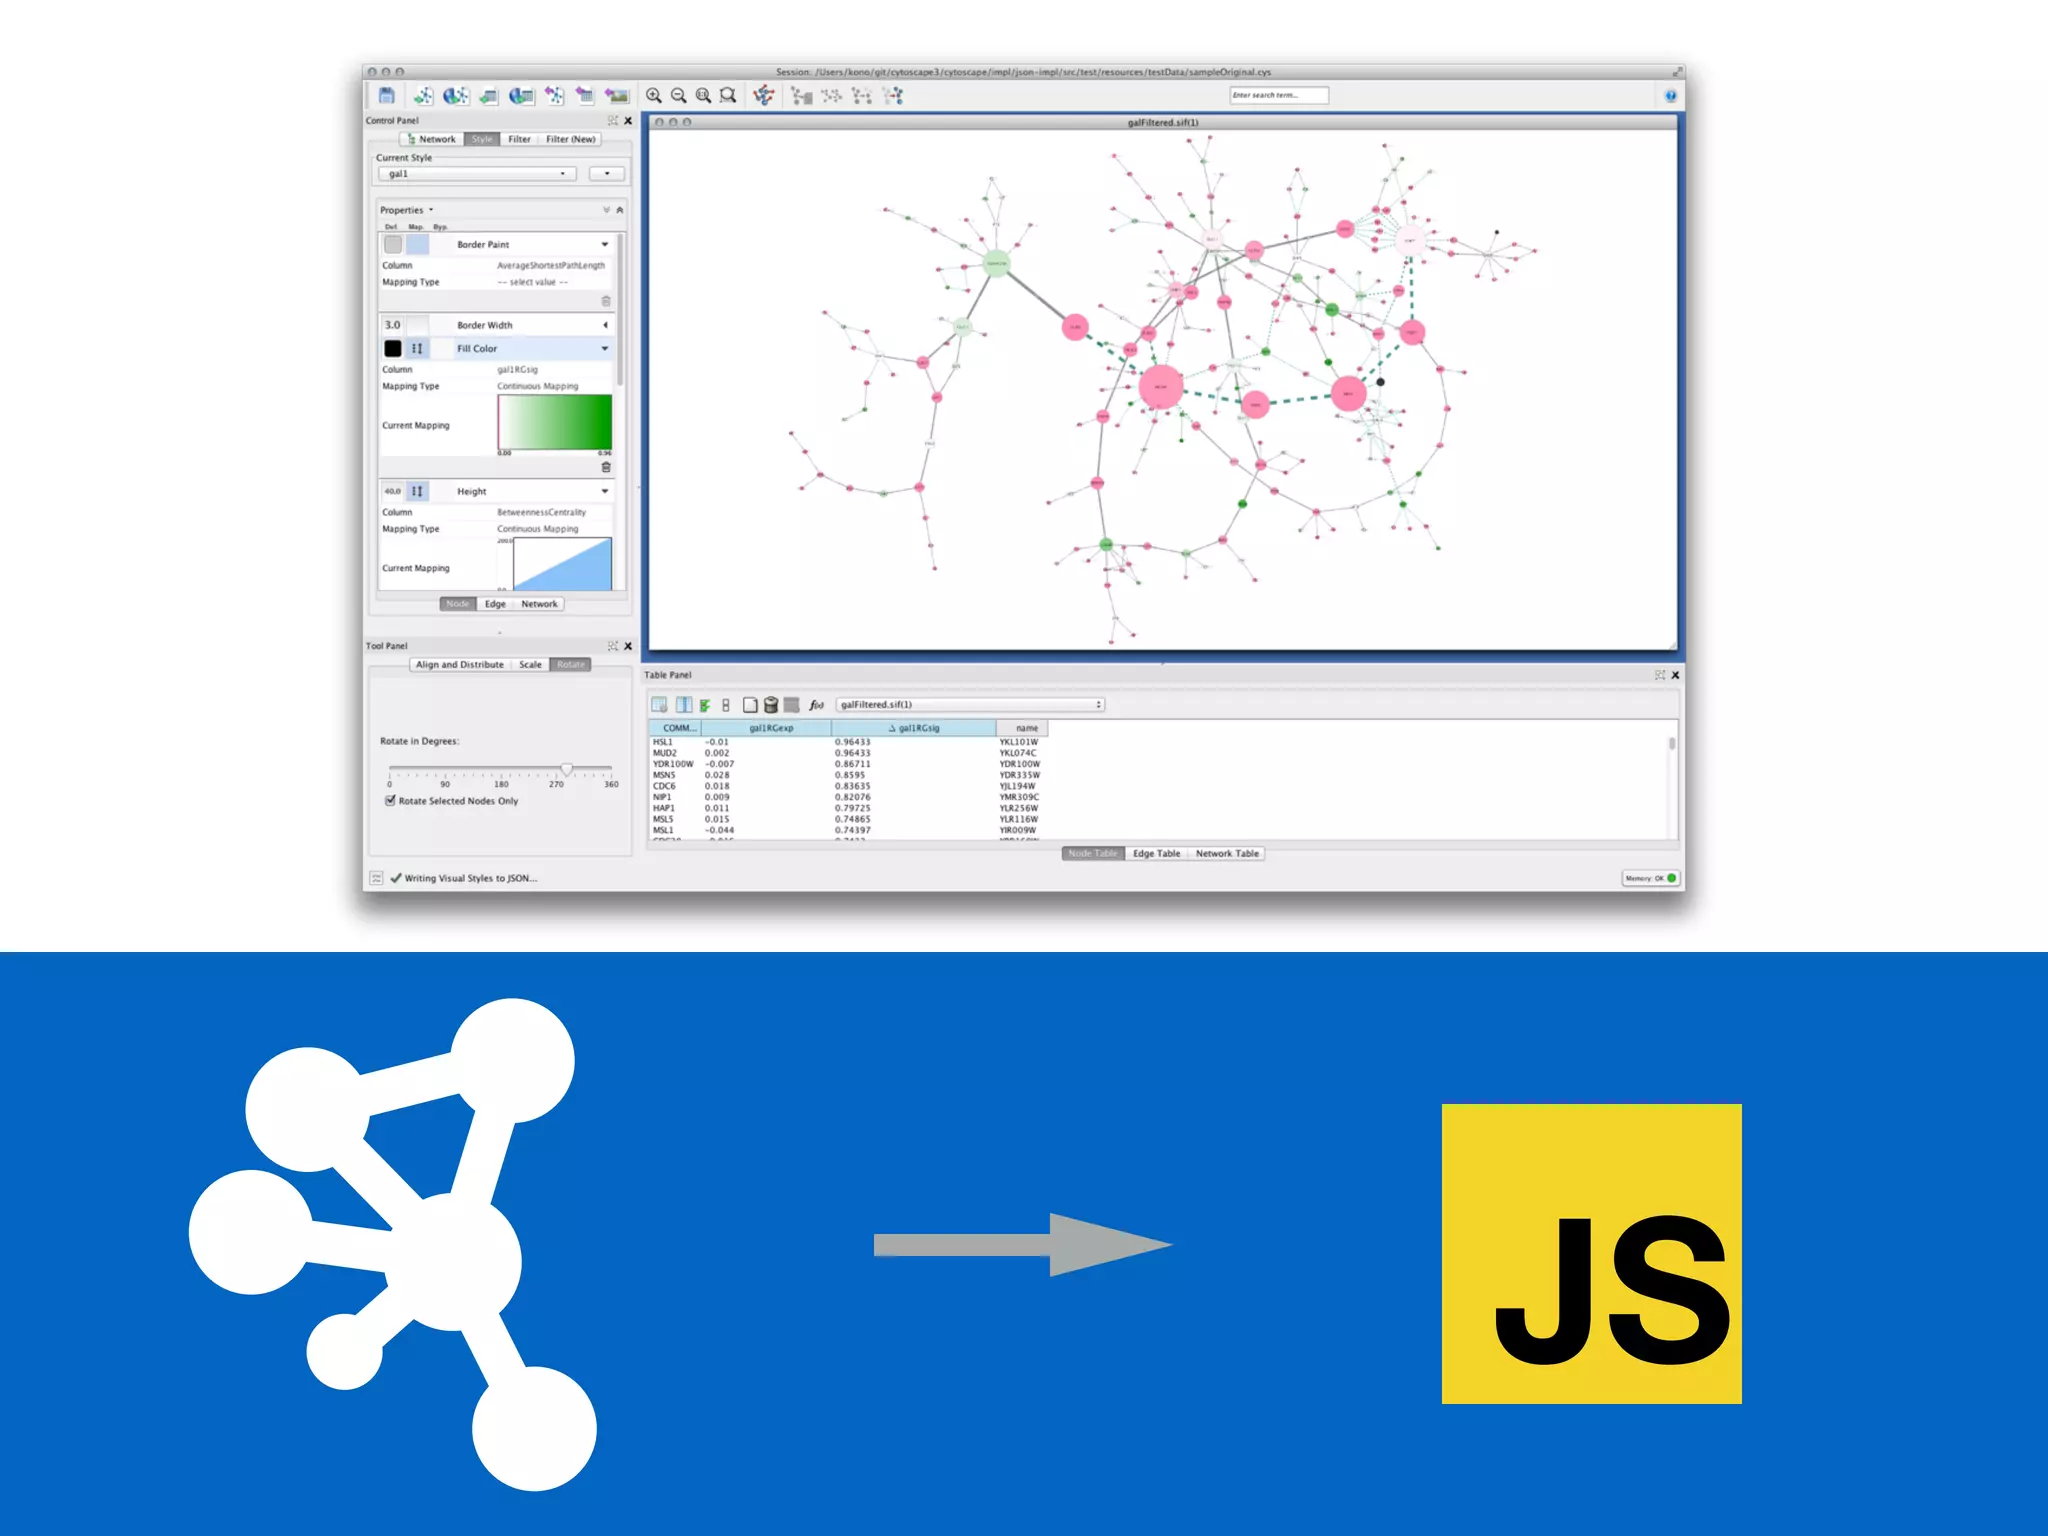
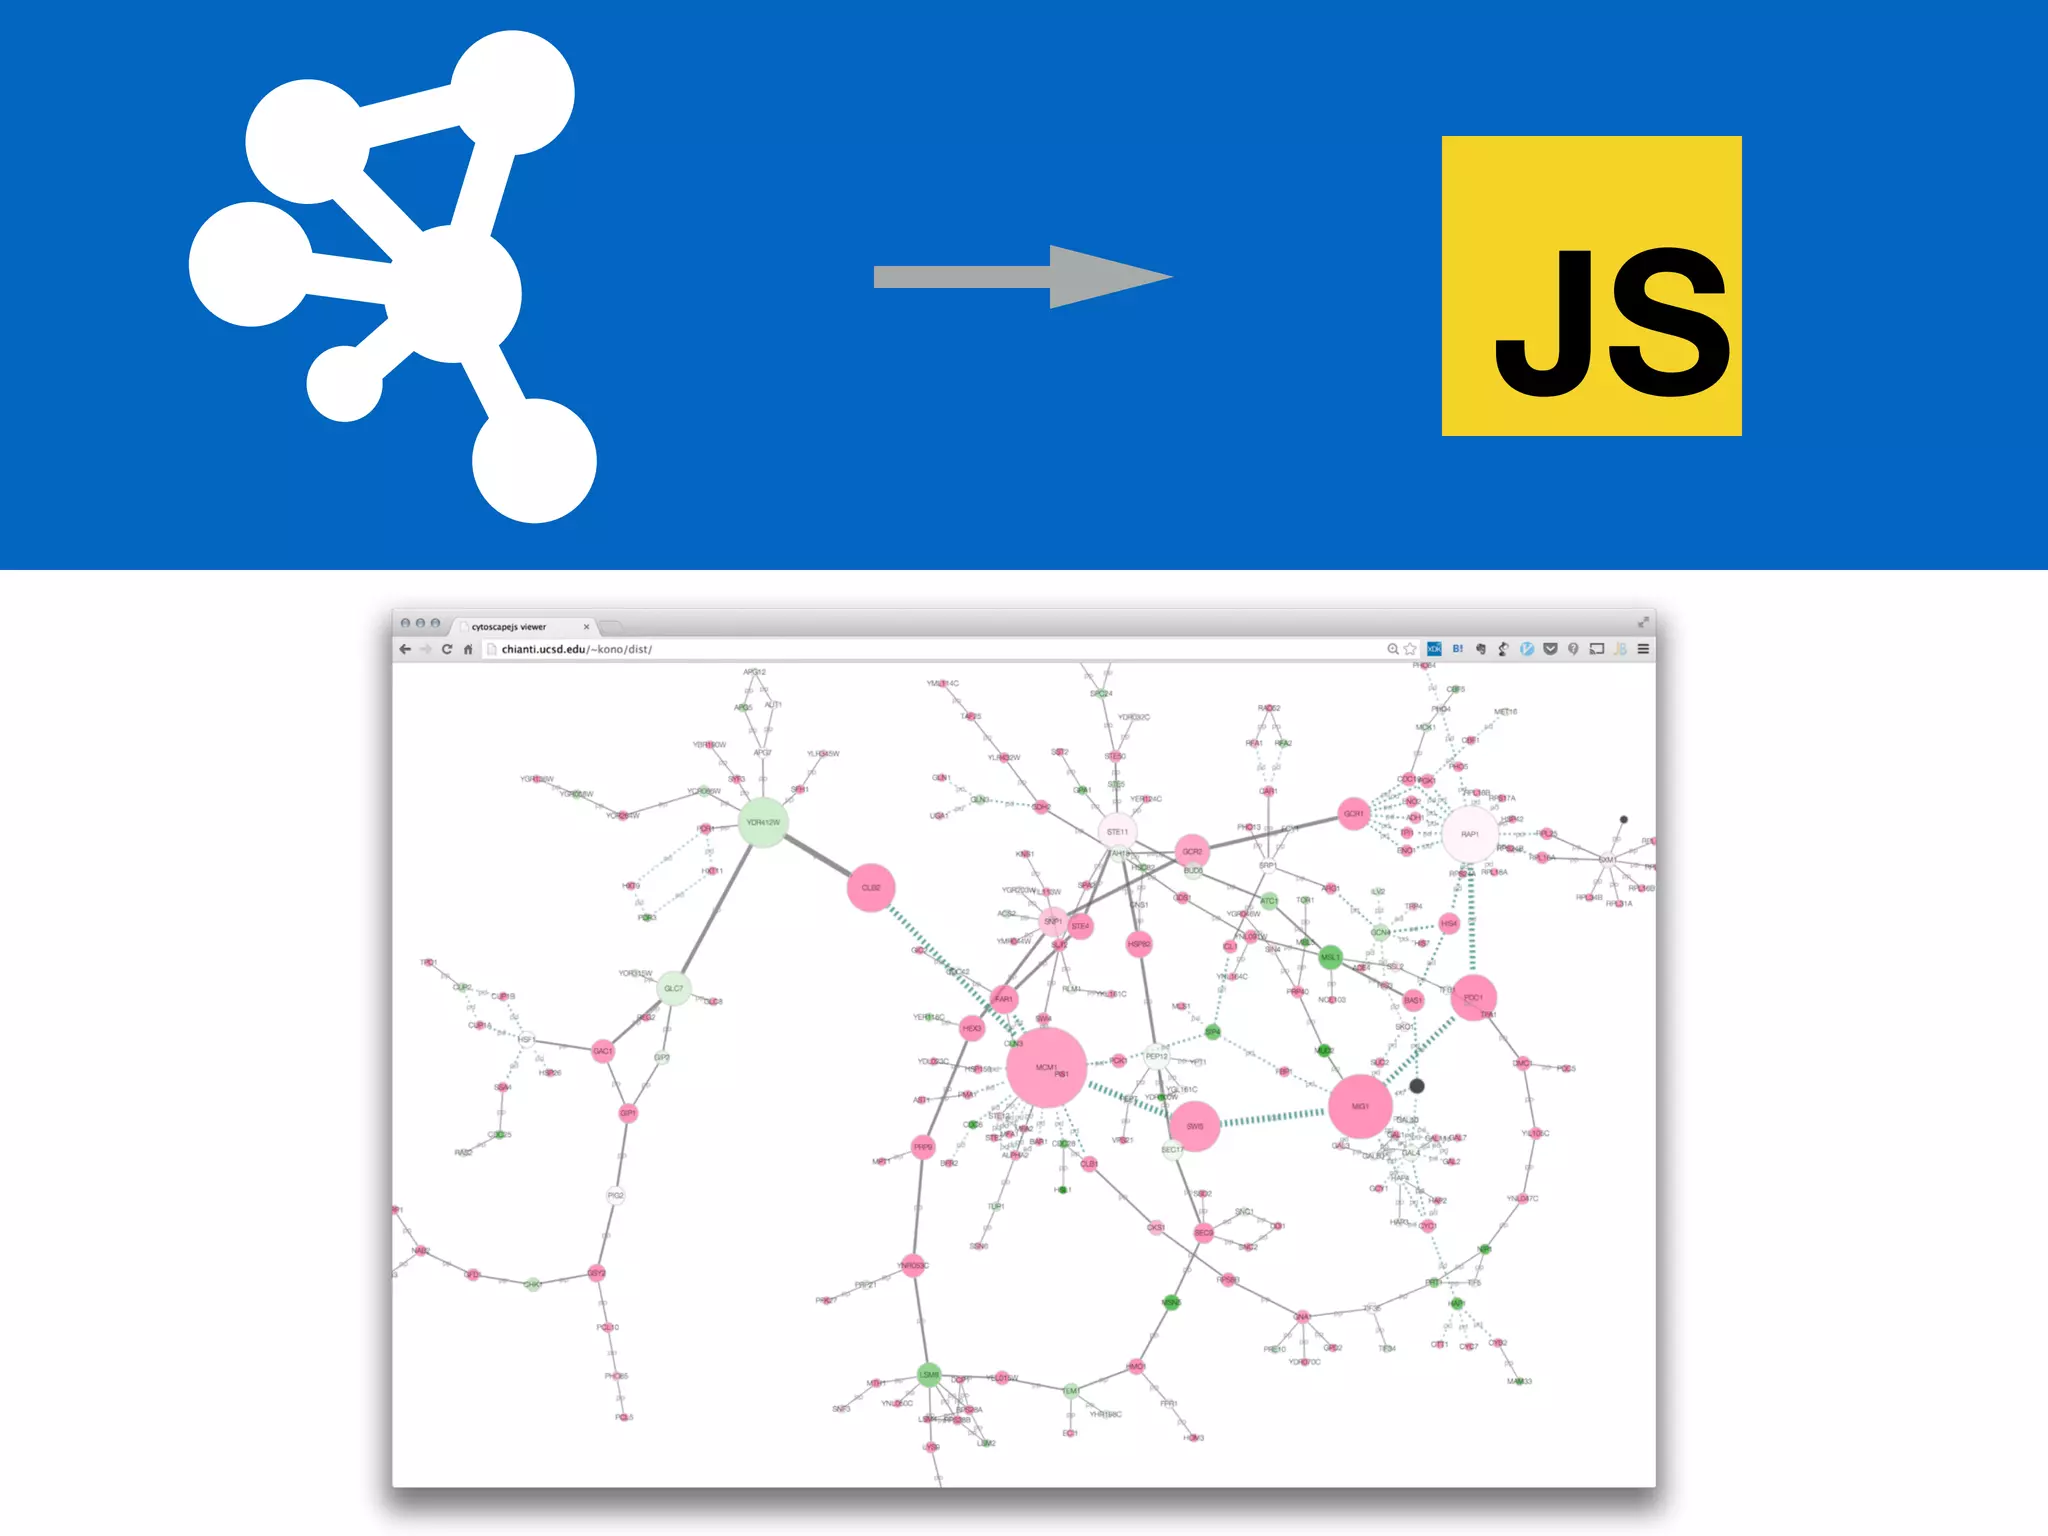
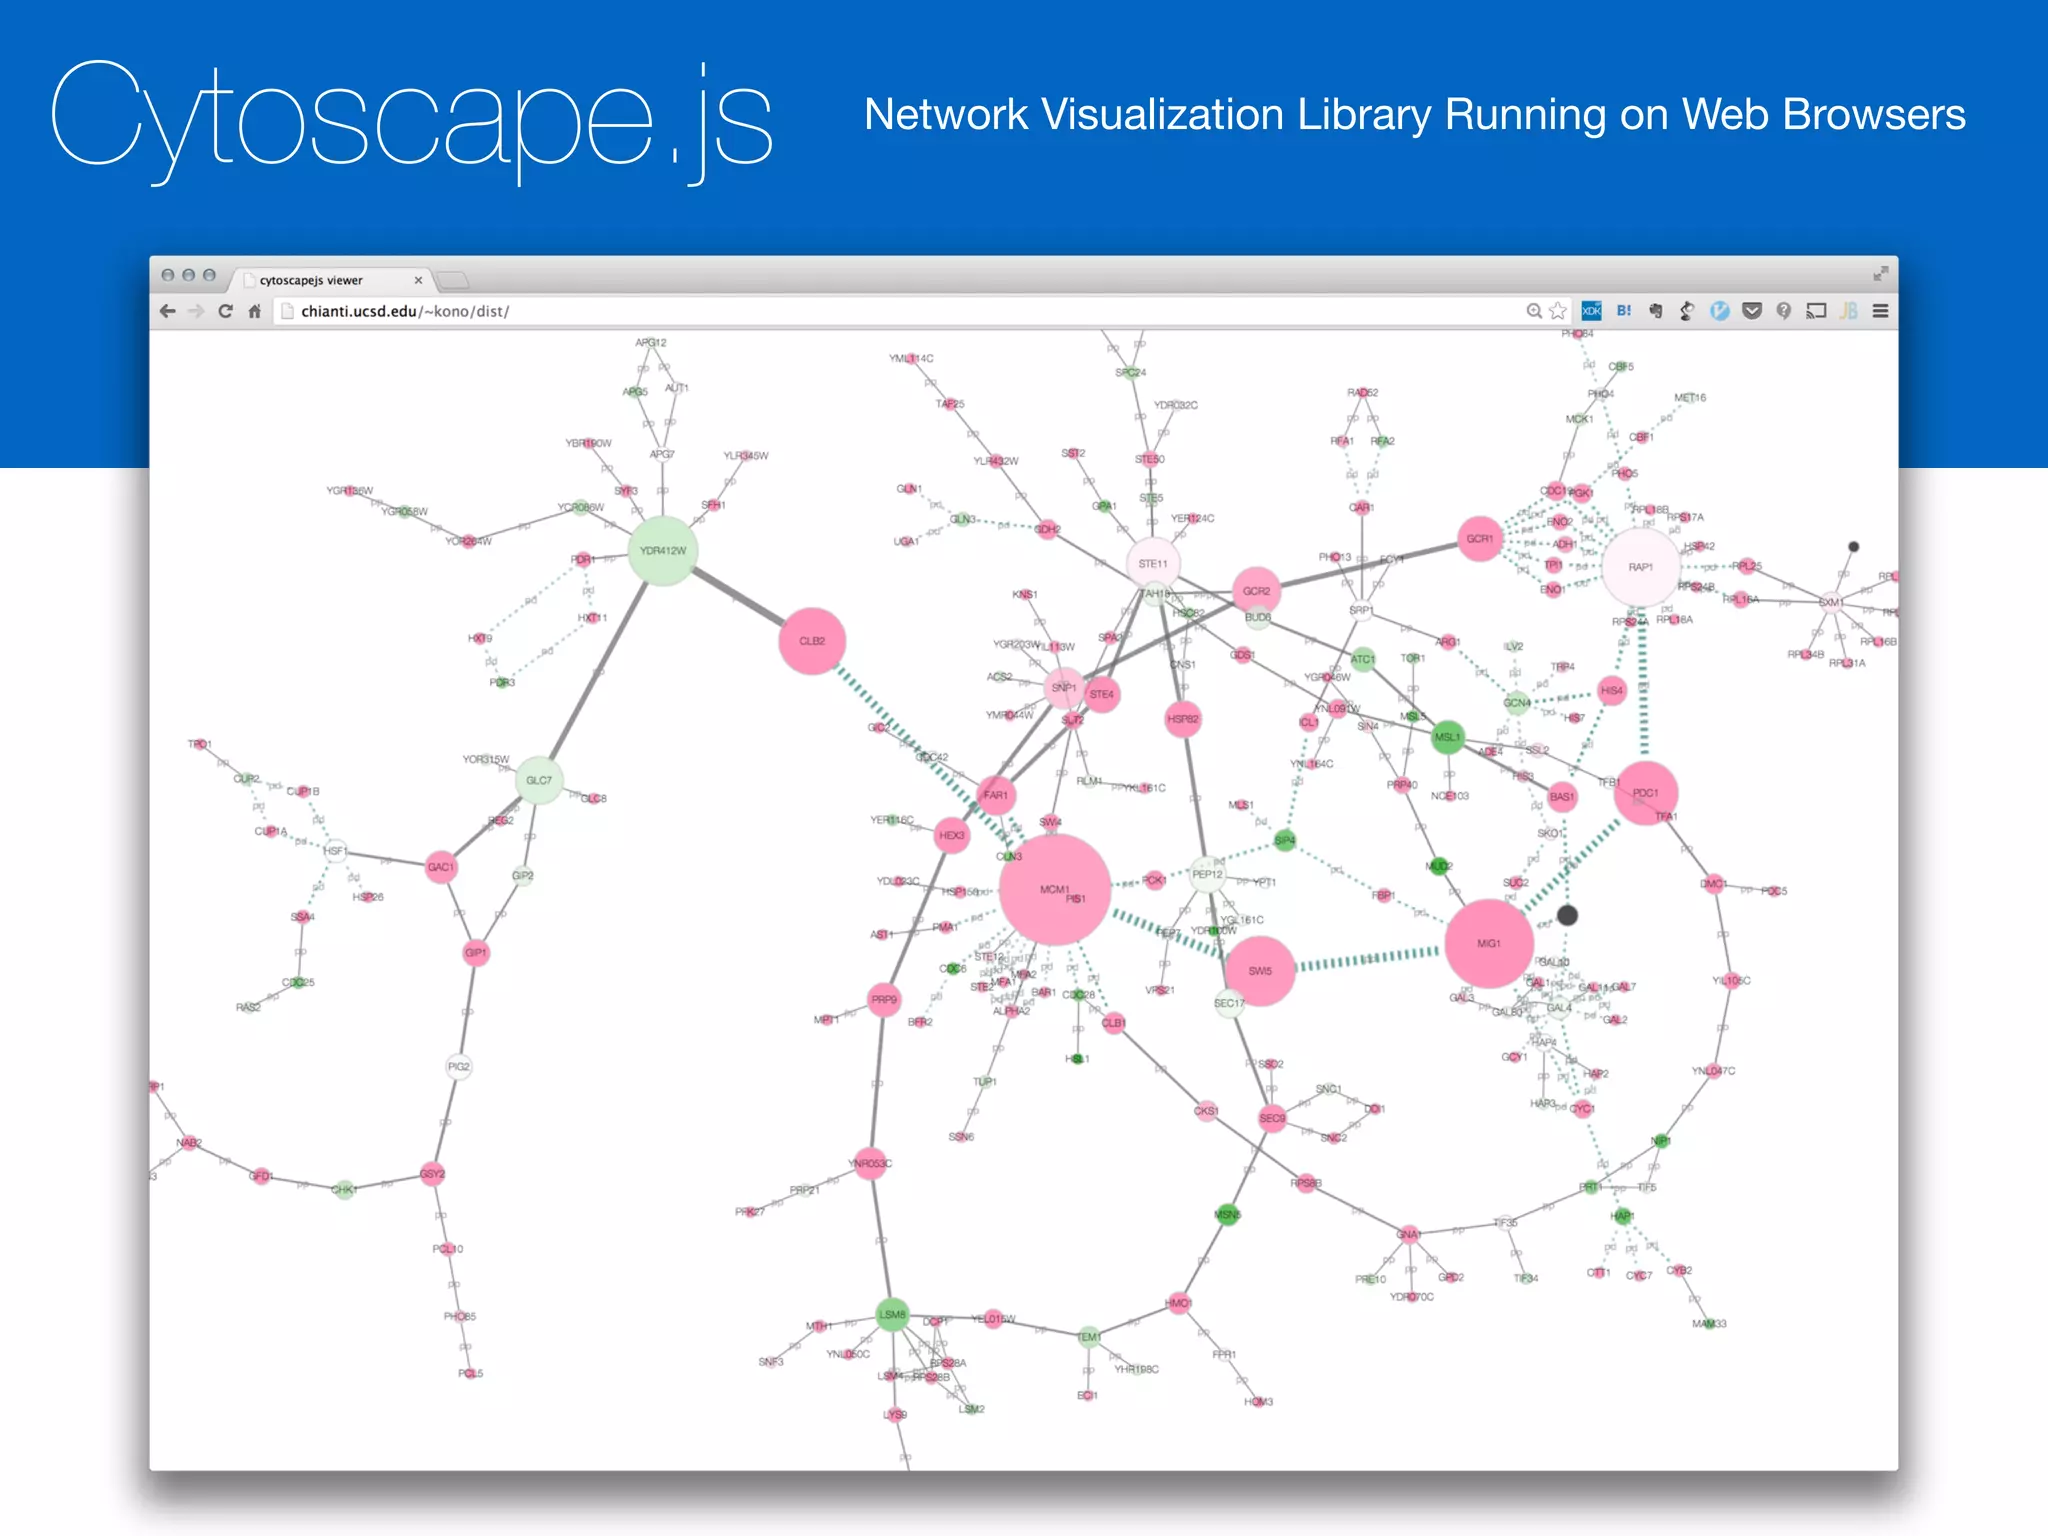
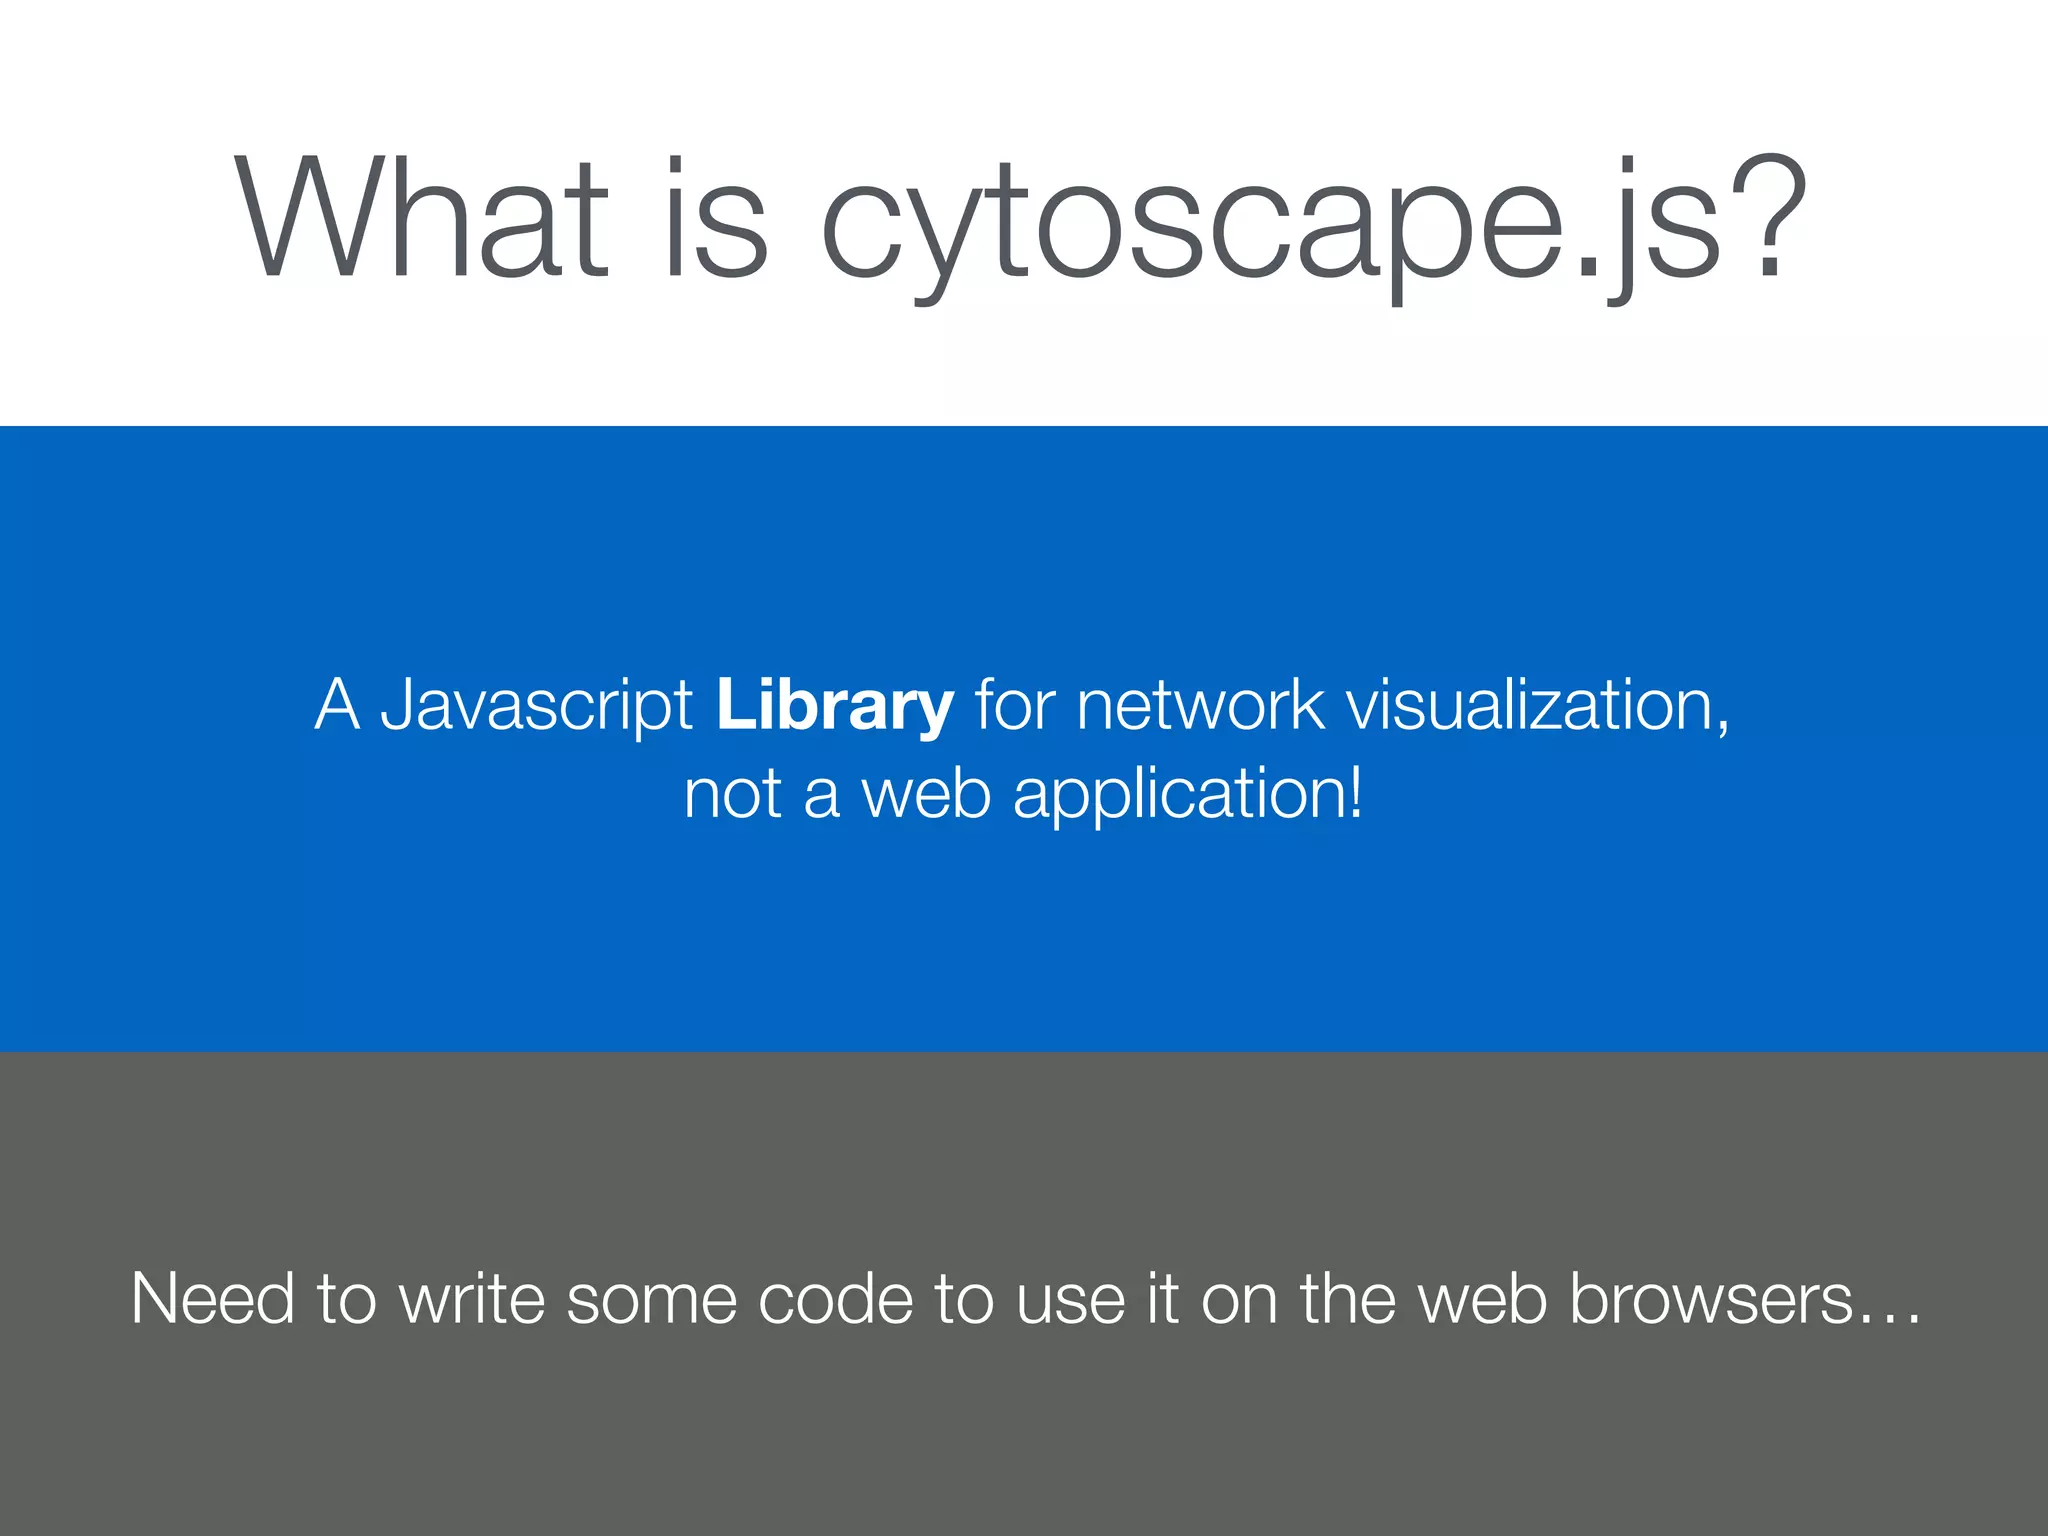
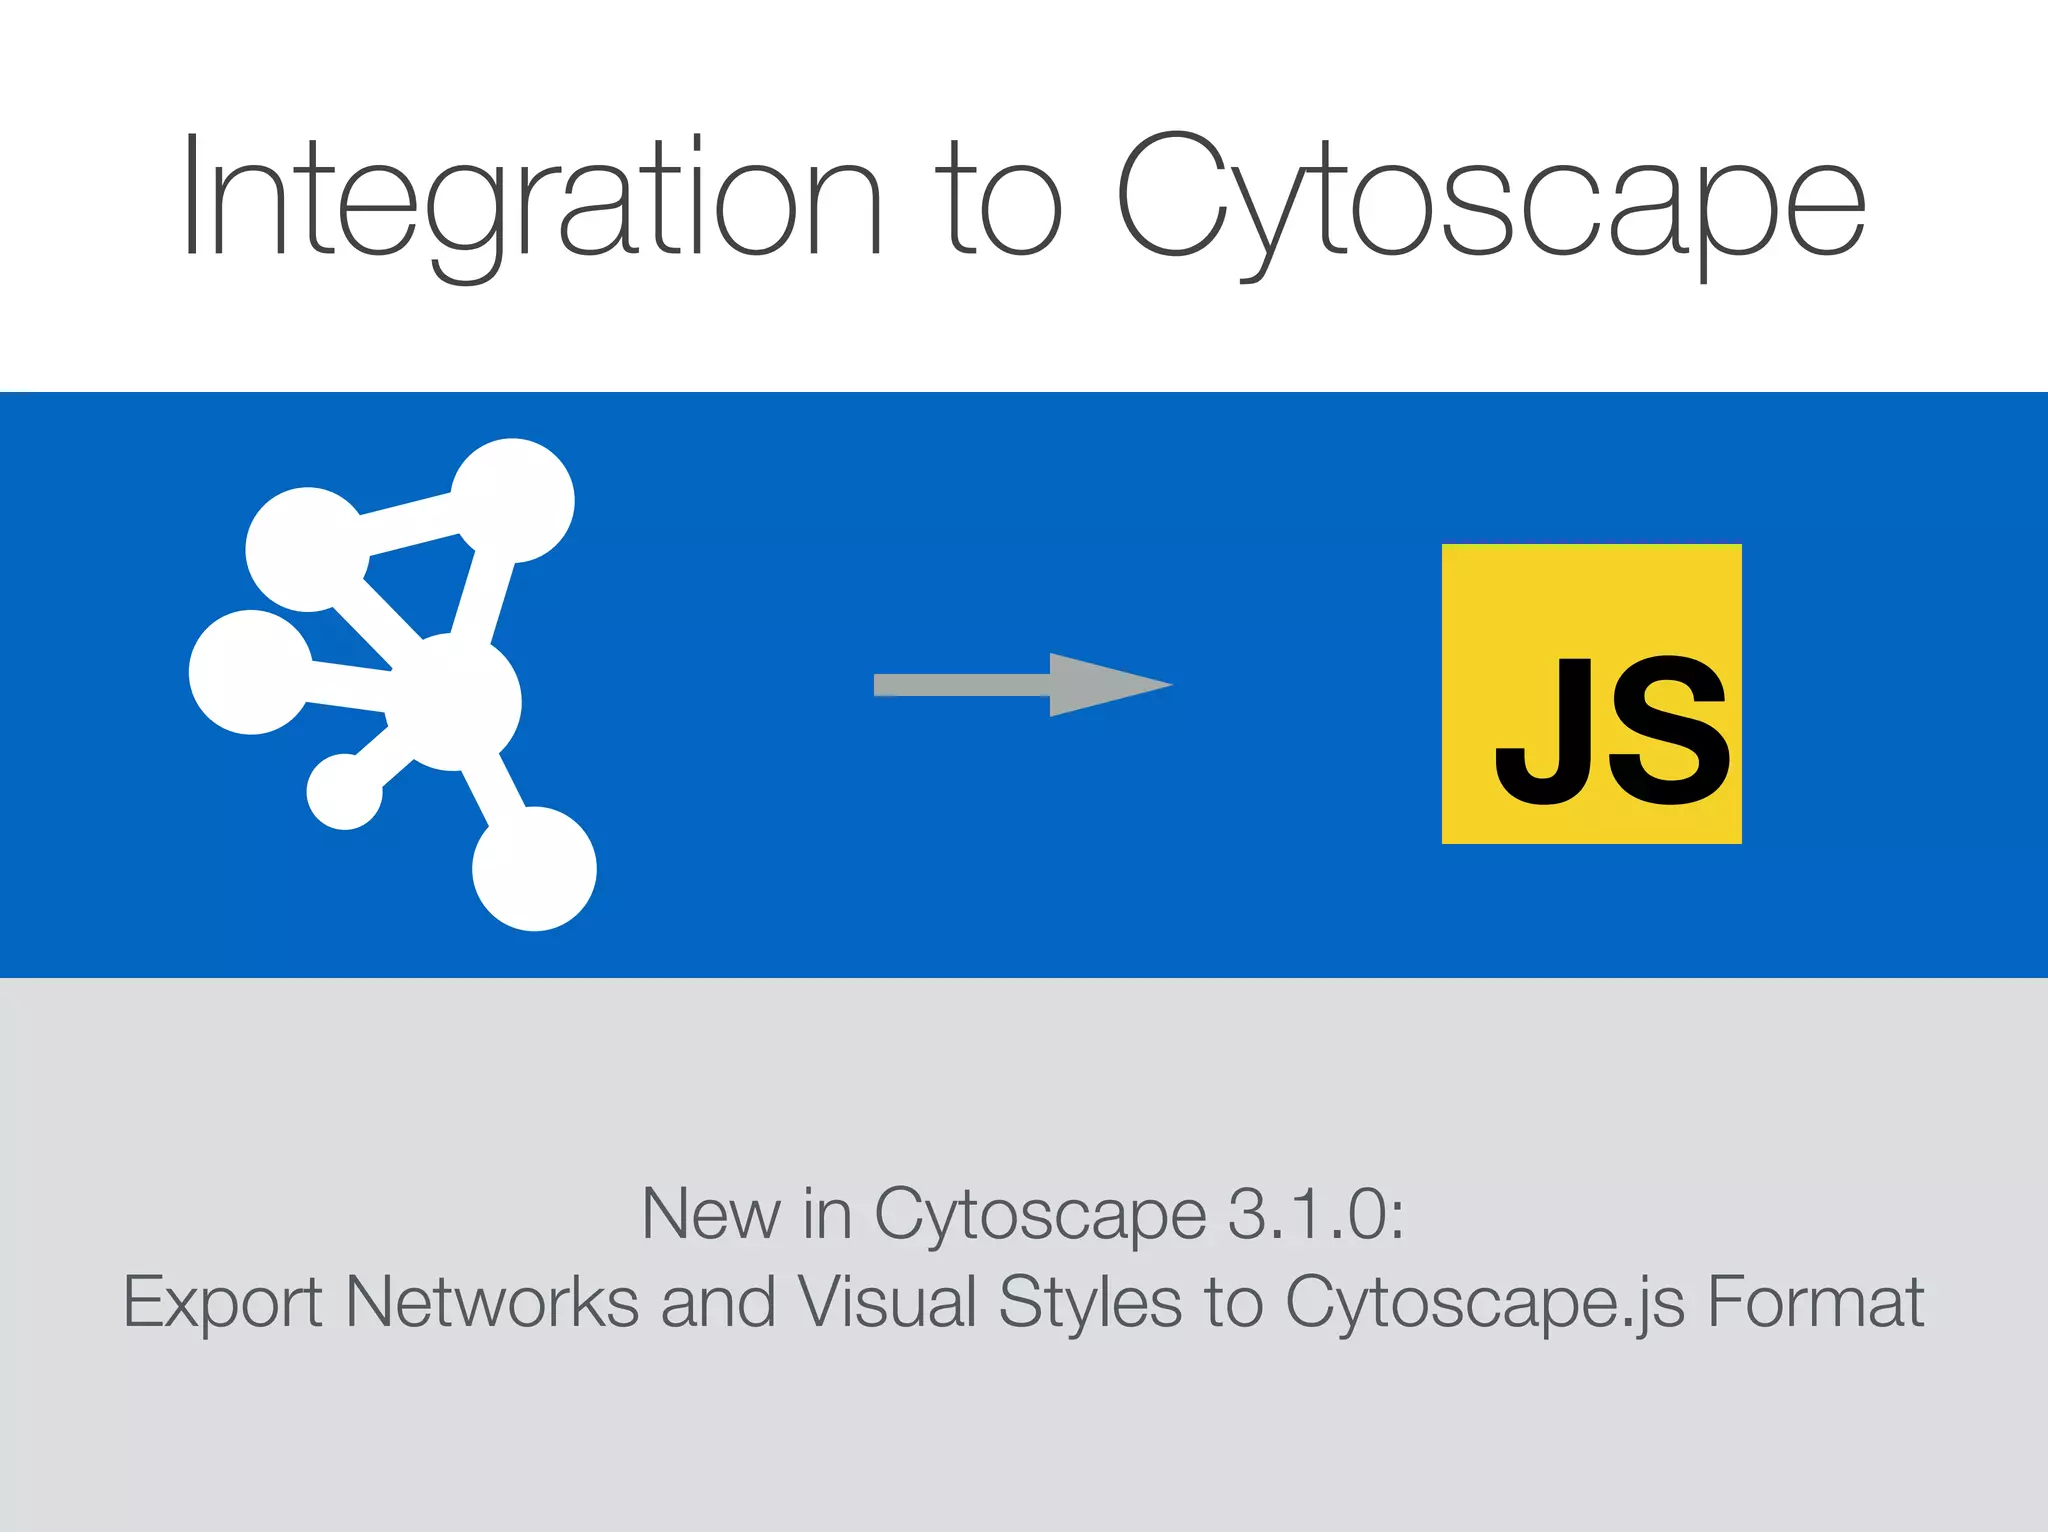
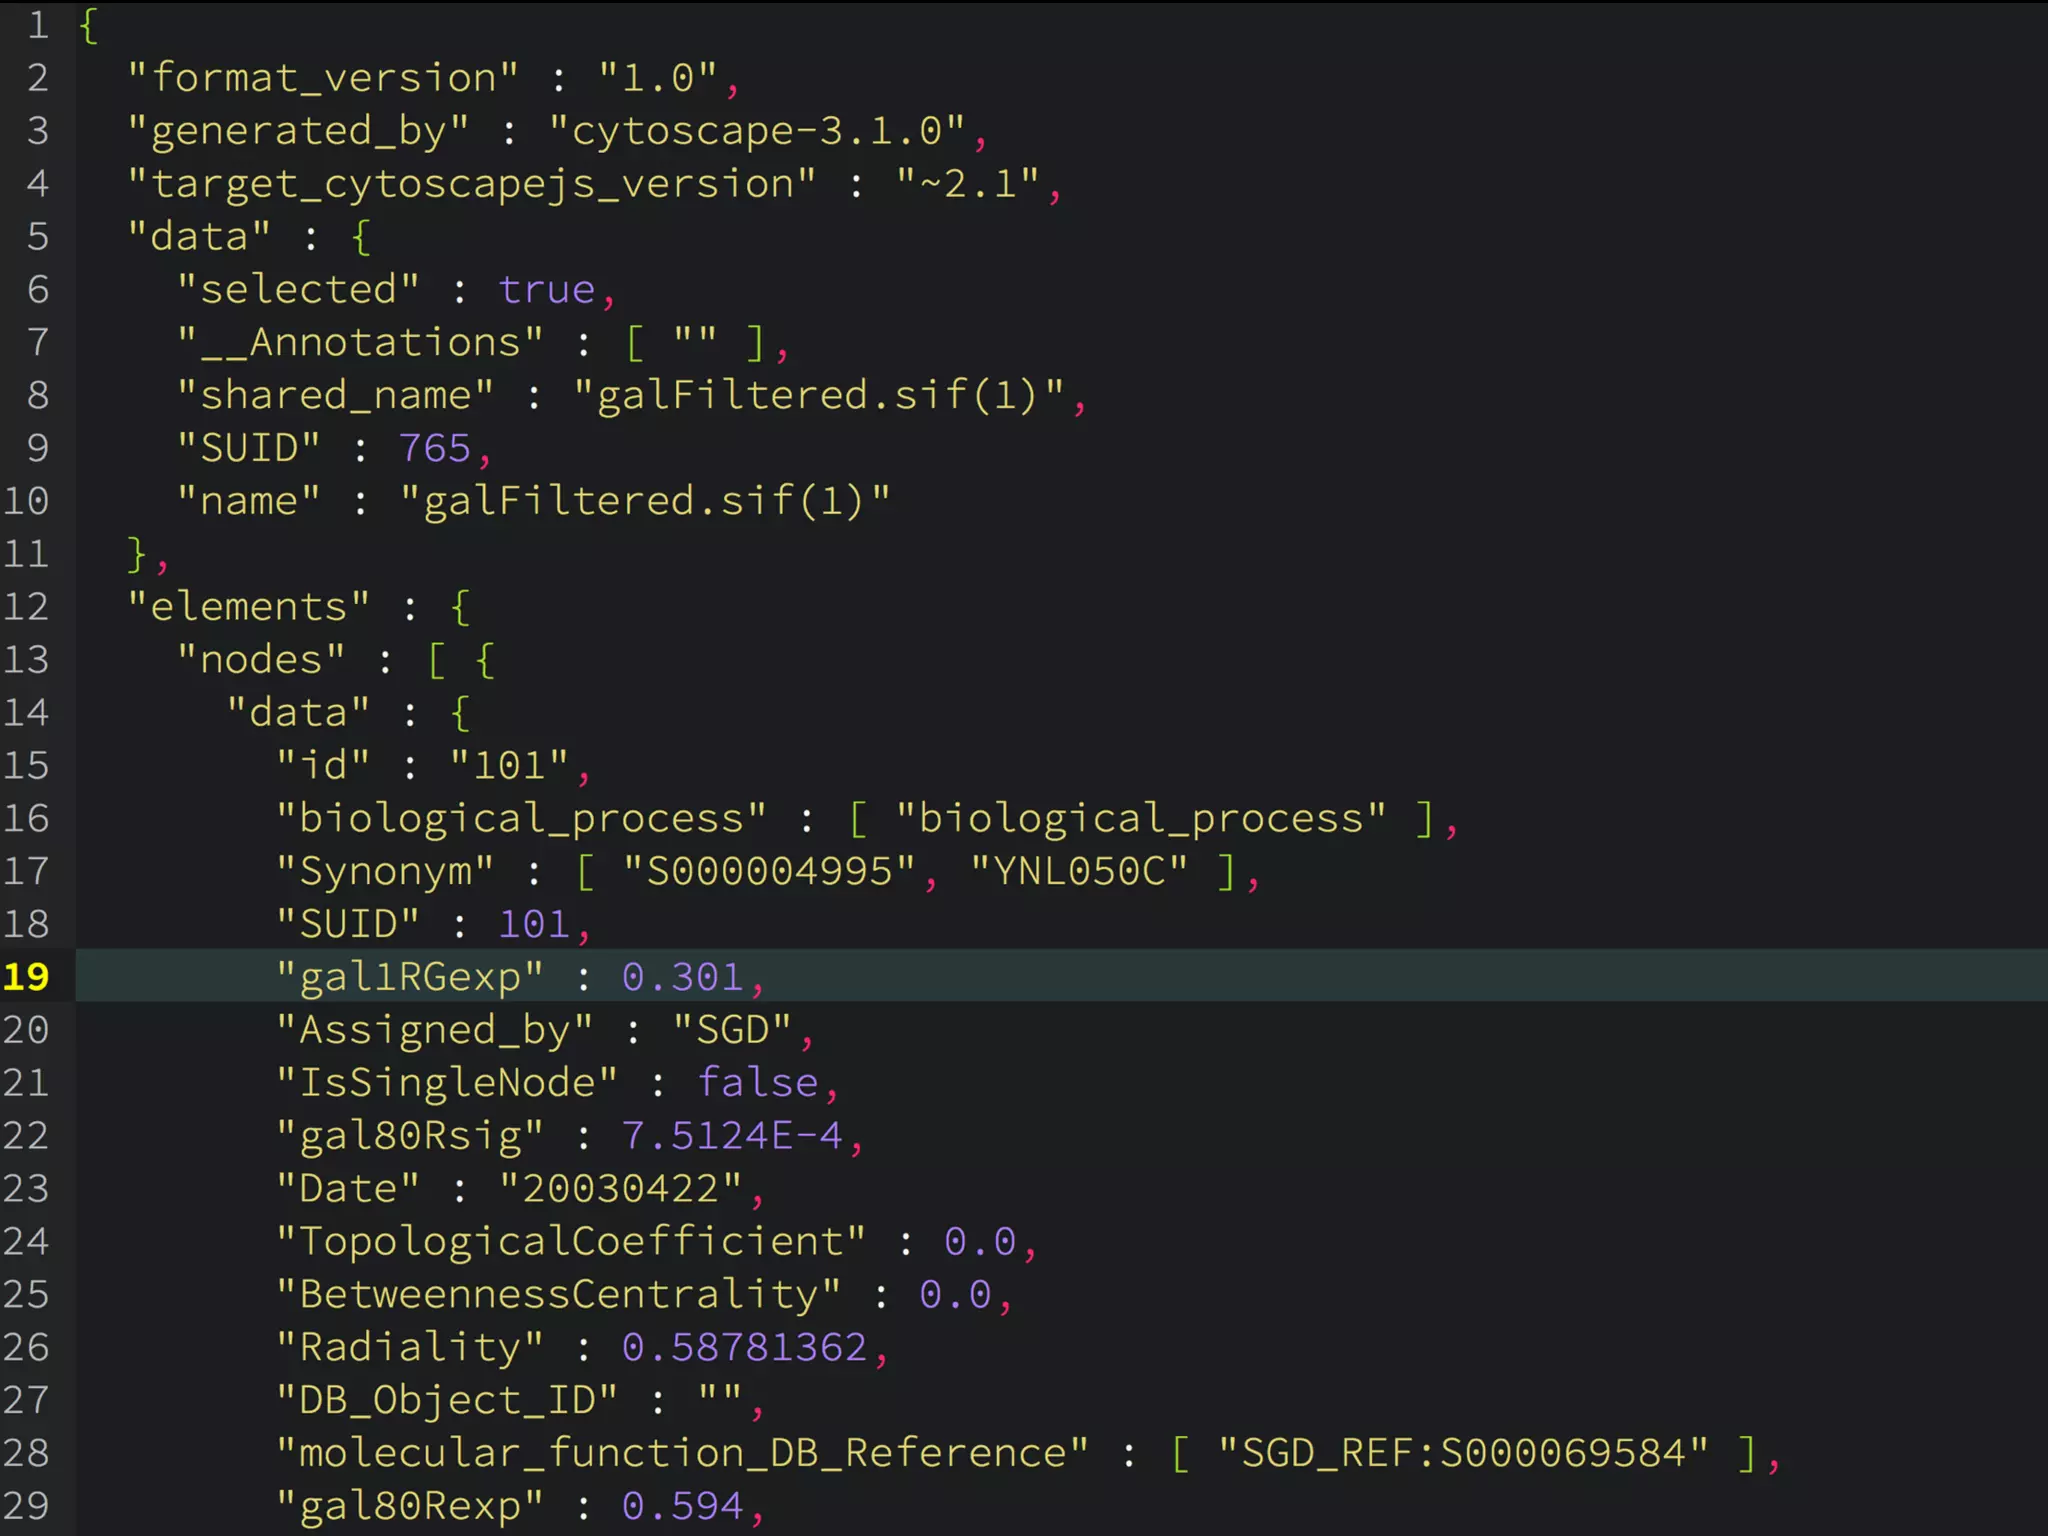
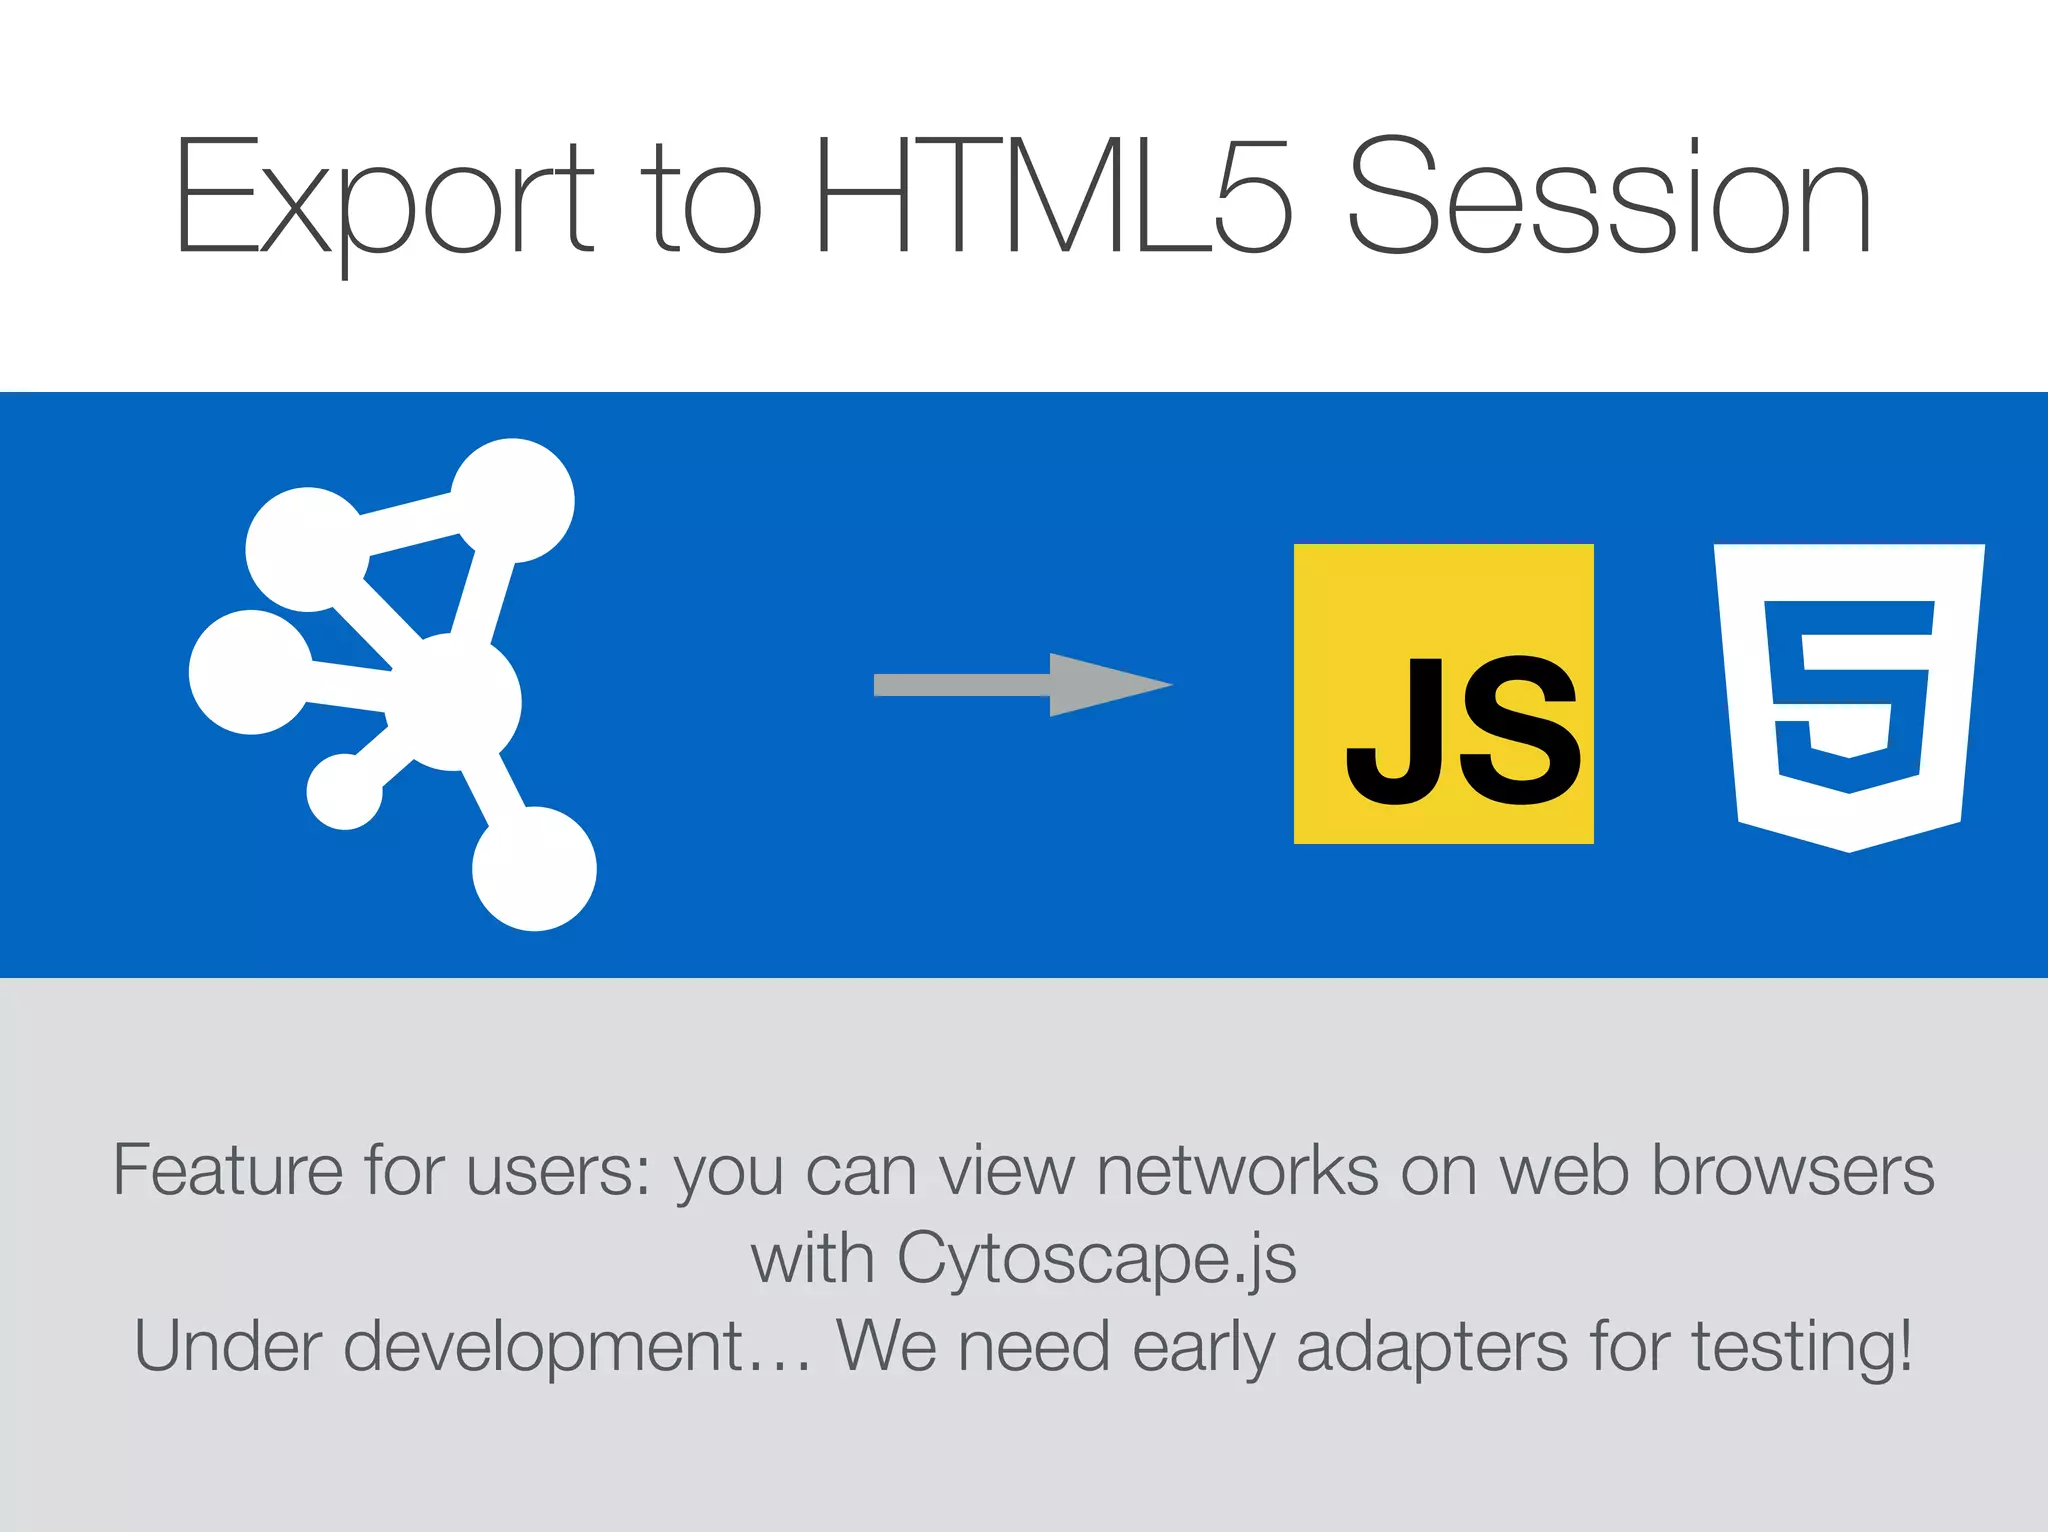
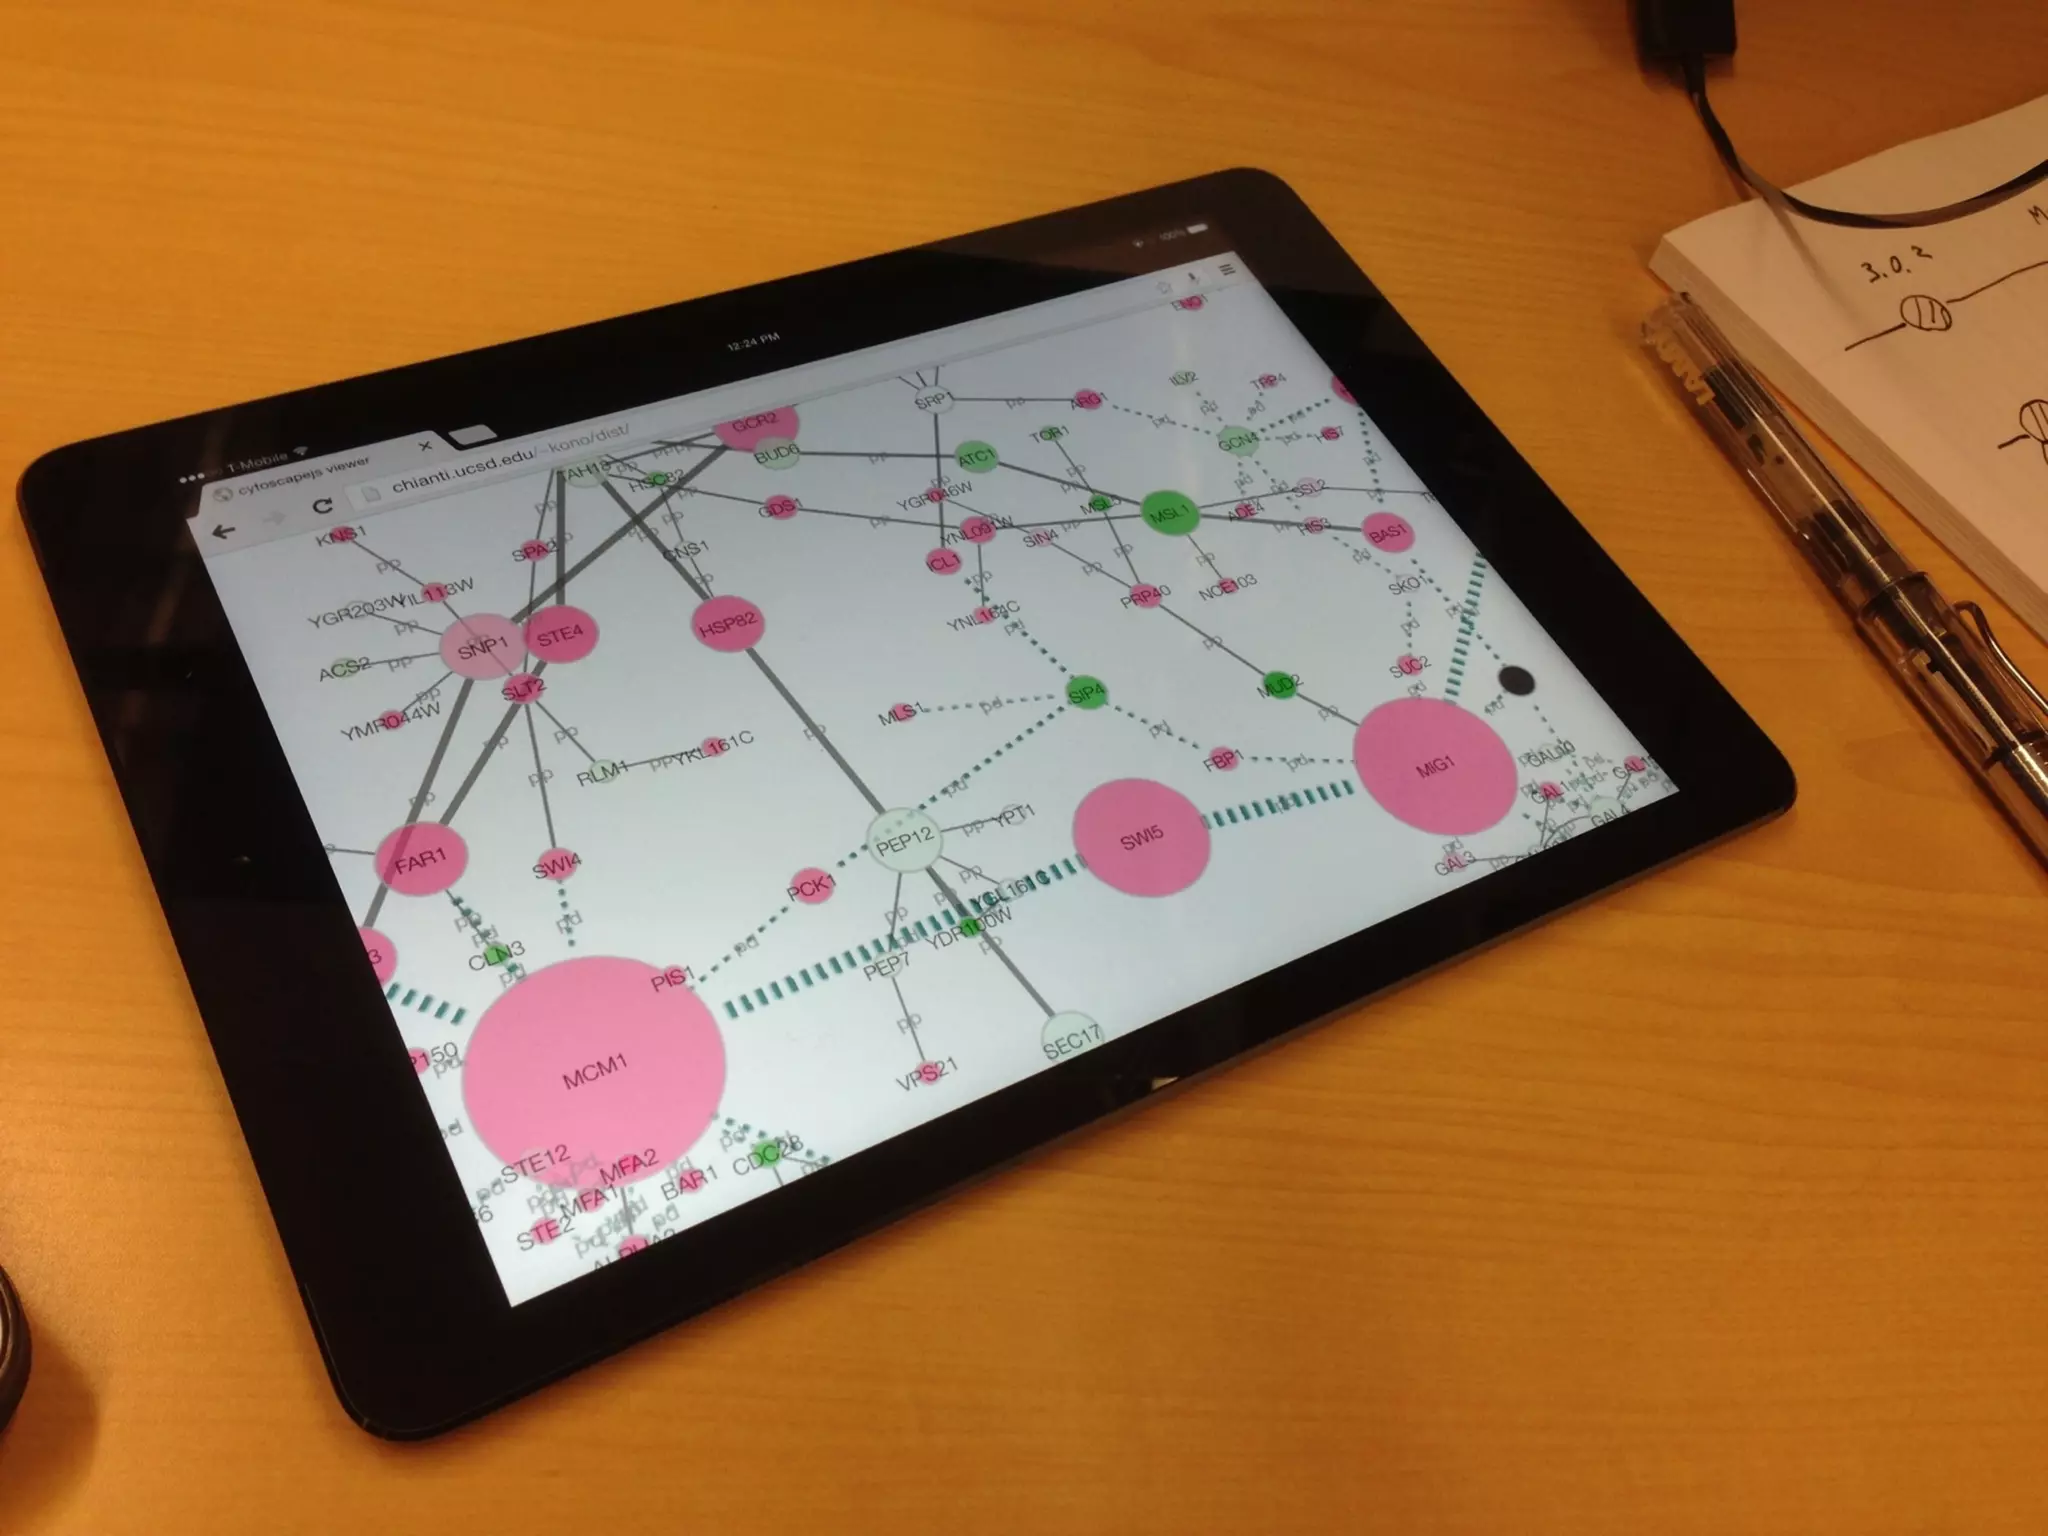
Describes Cytoscape.js as a network visualization library, emphasizing its coding requirements and new features for web integration.
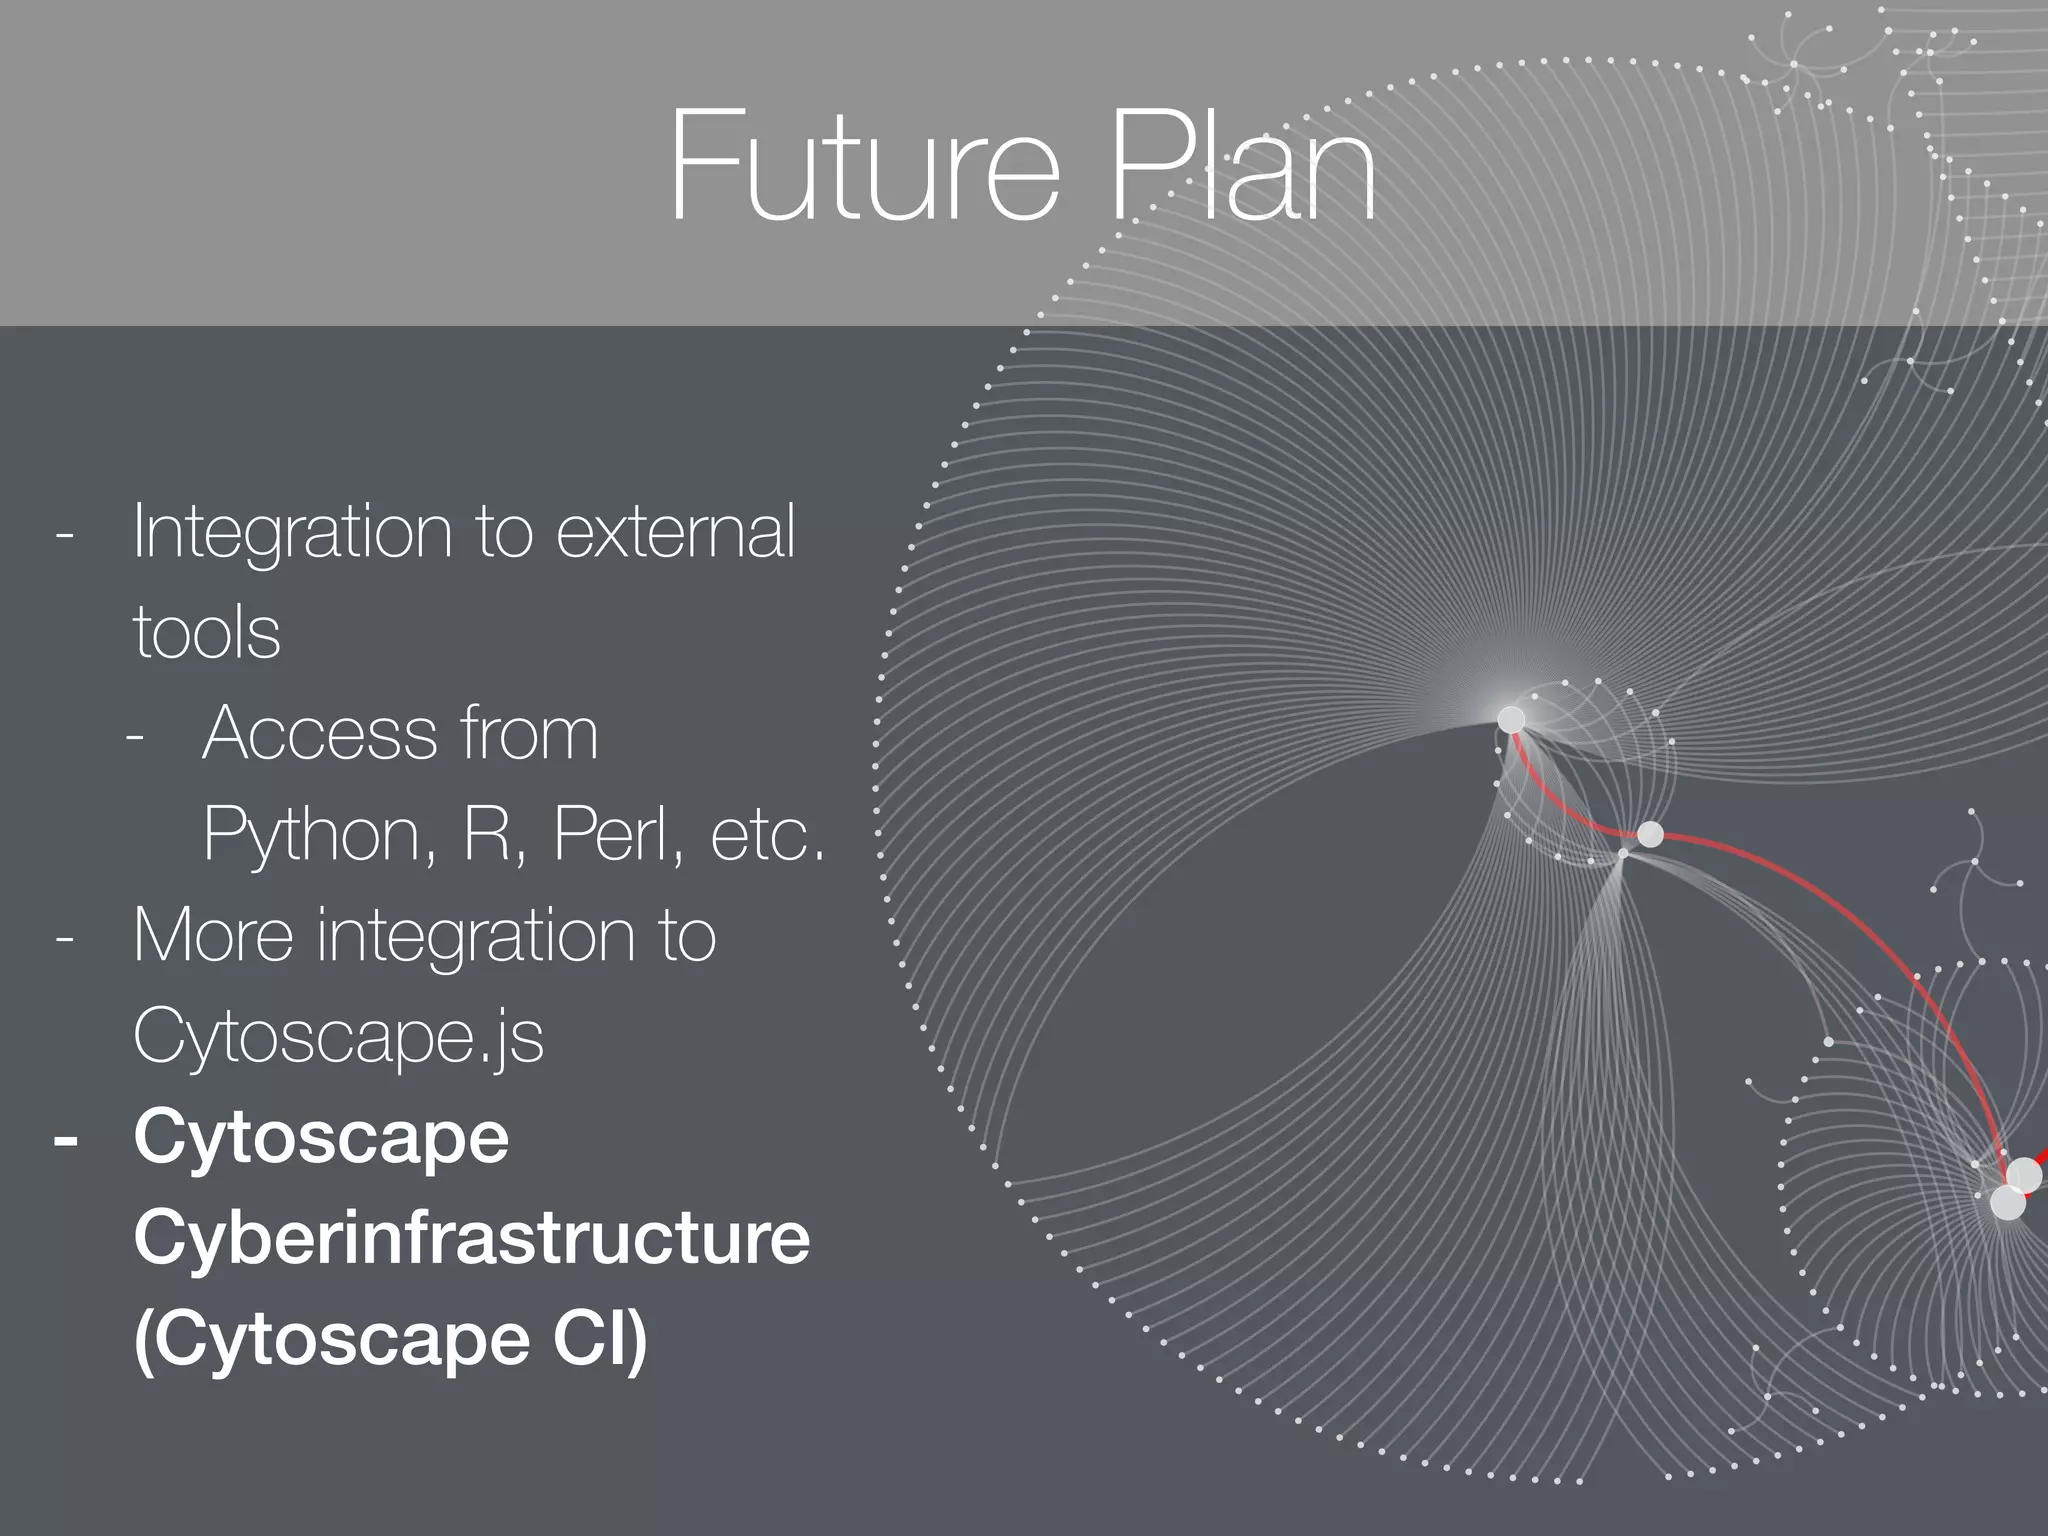
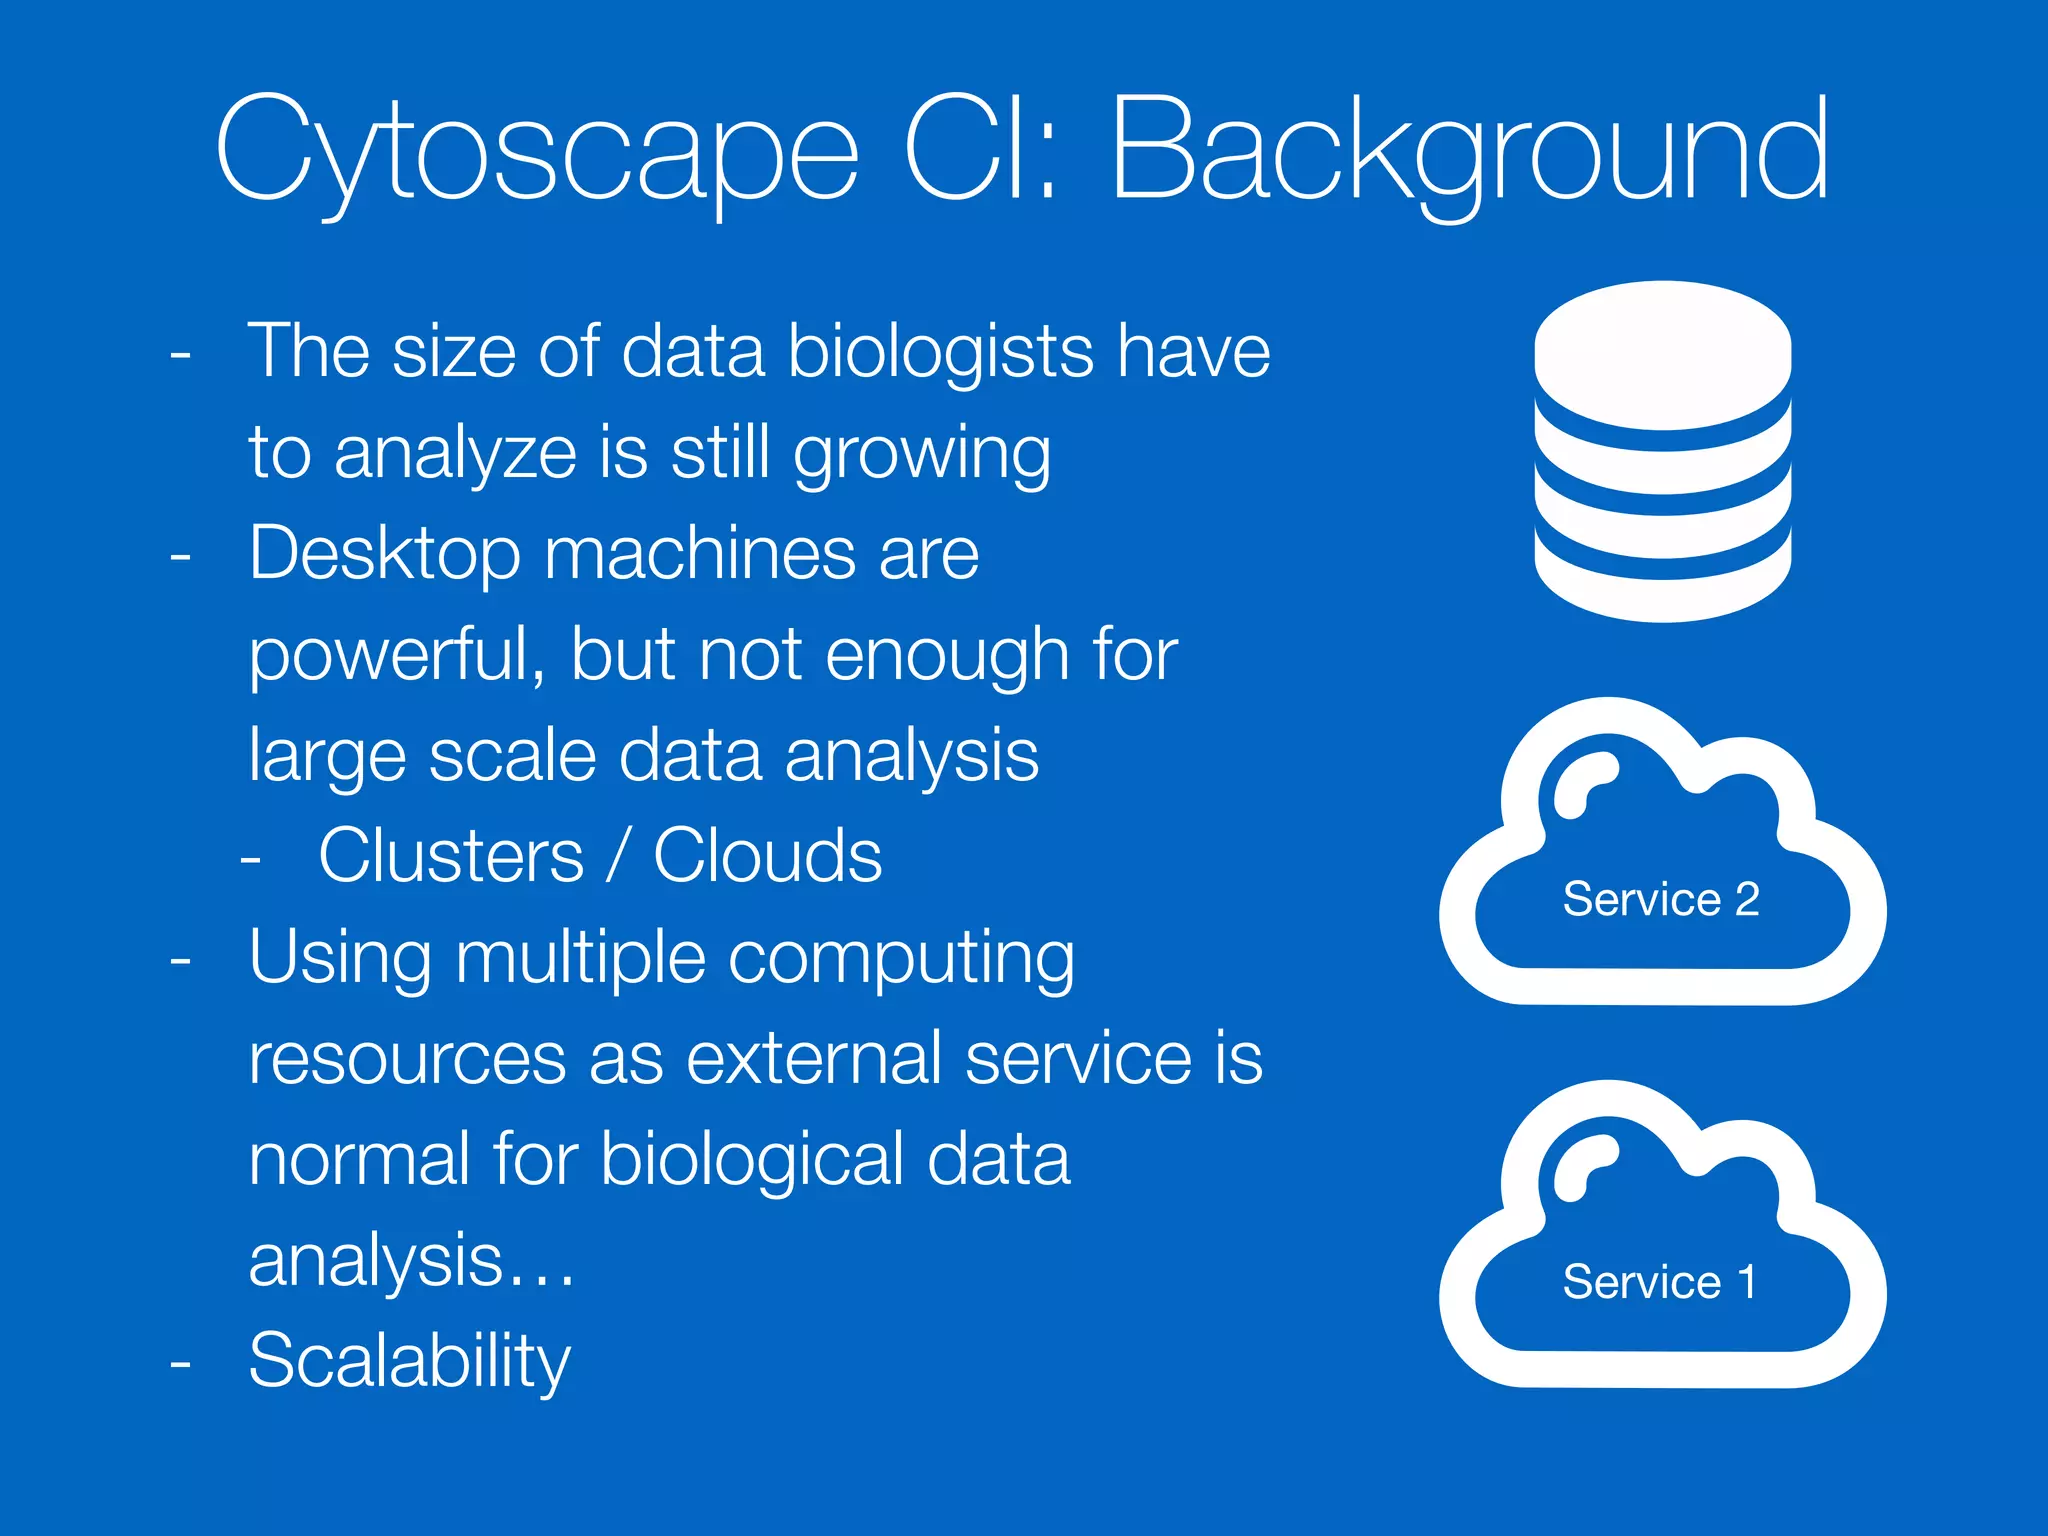
Outlines future plans including integration with external tools and addressing scalability issues for large data analysis.
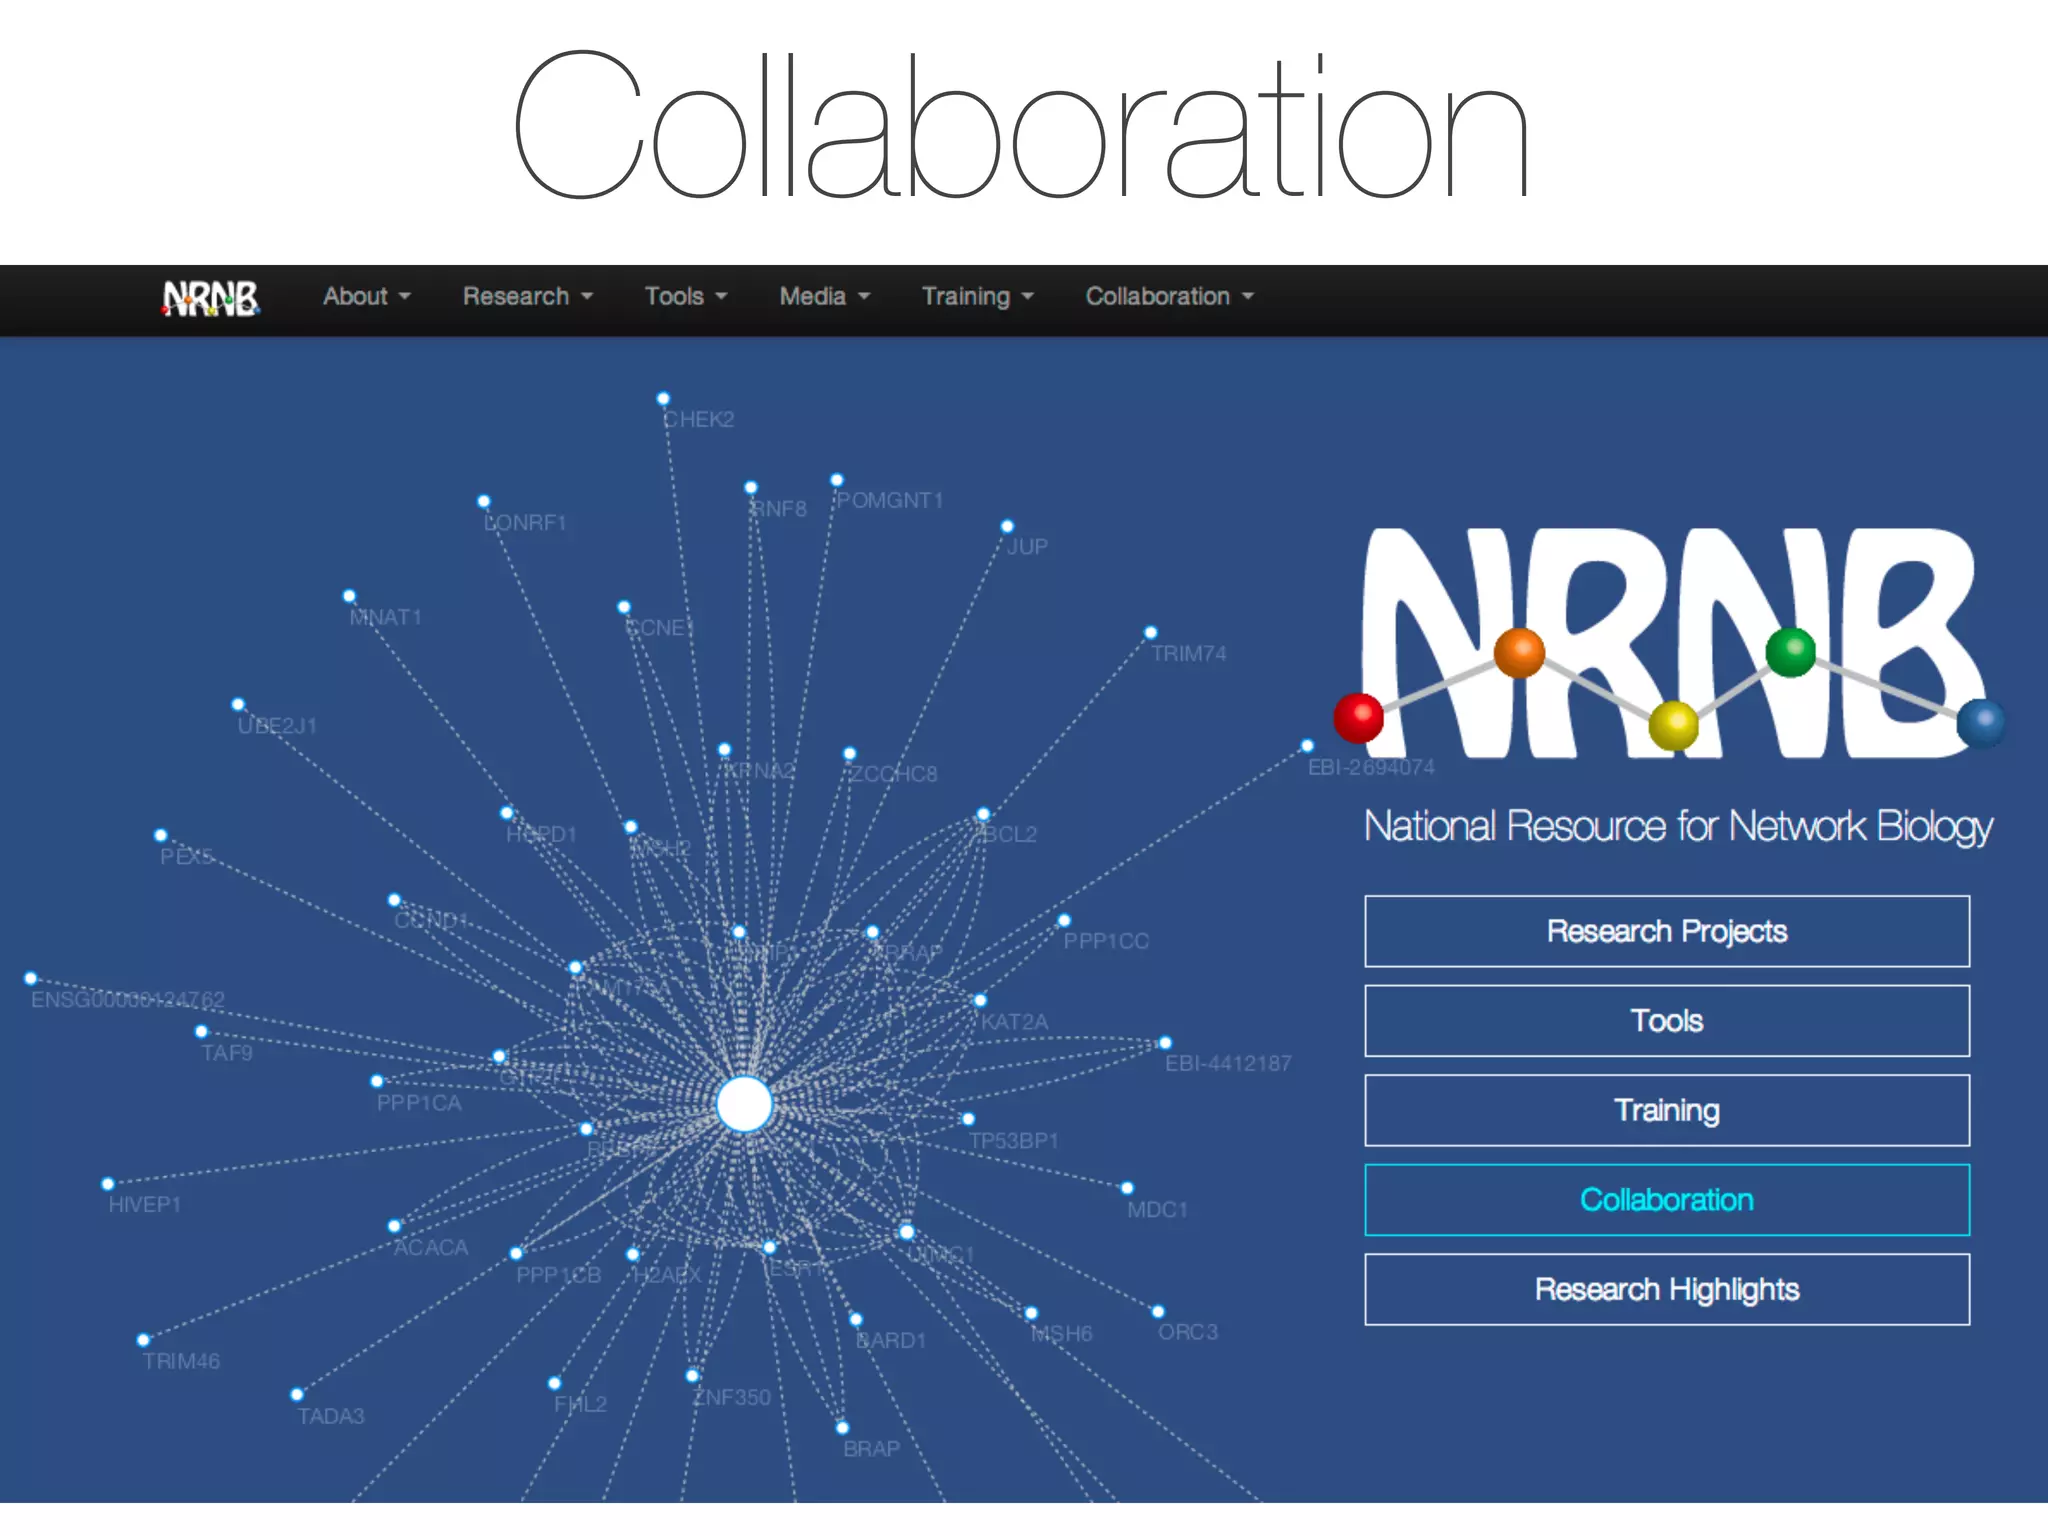
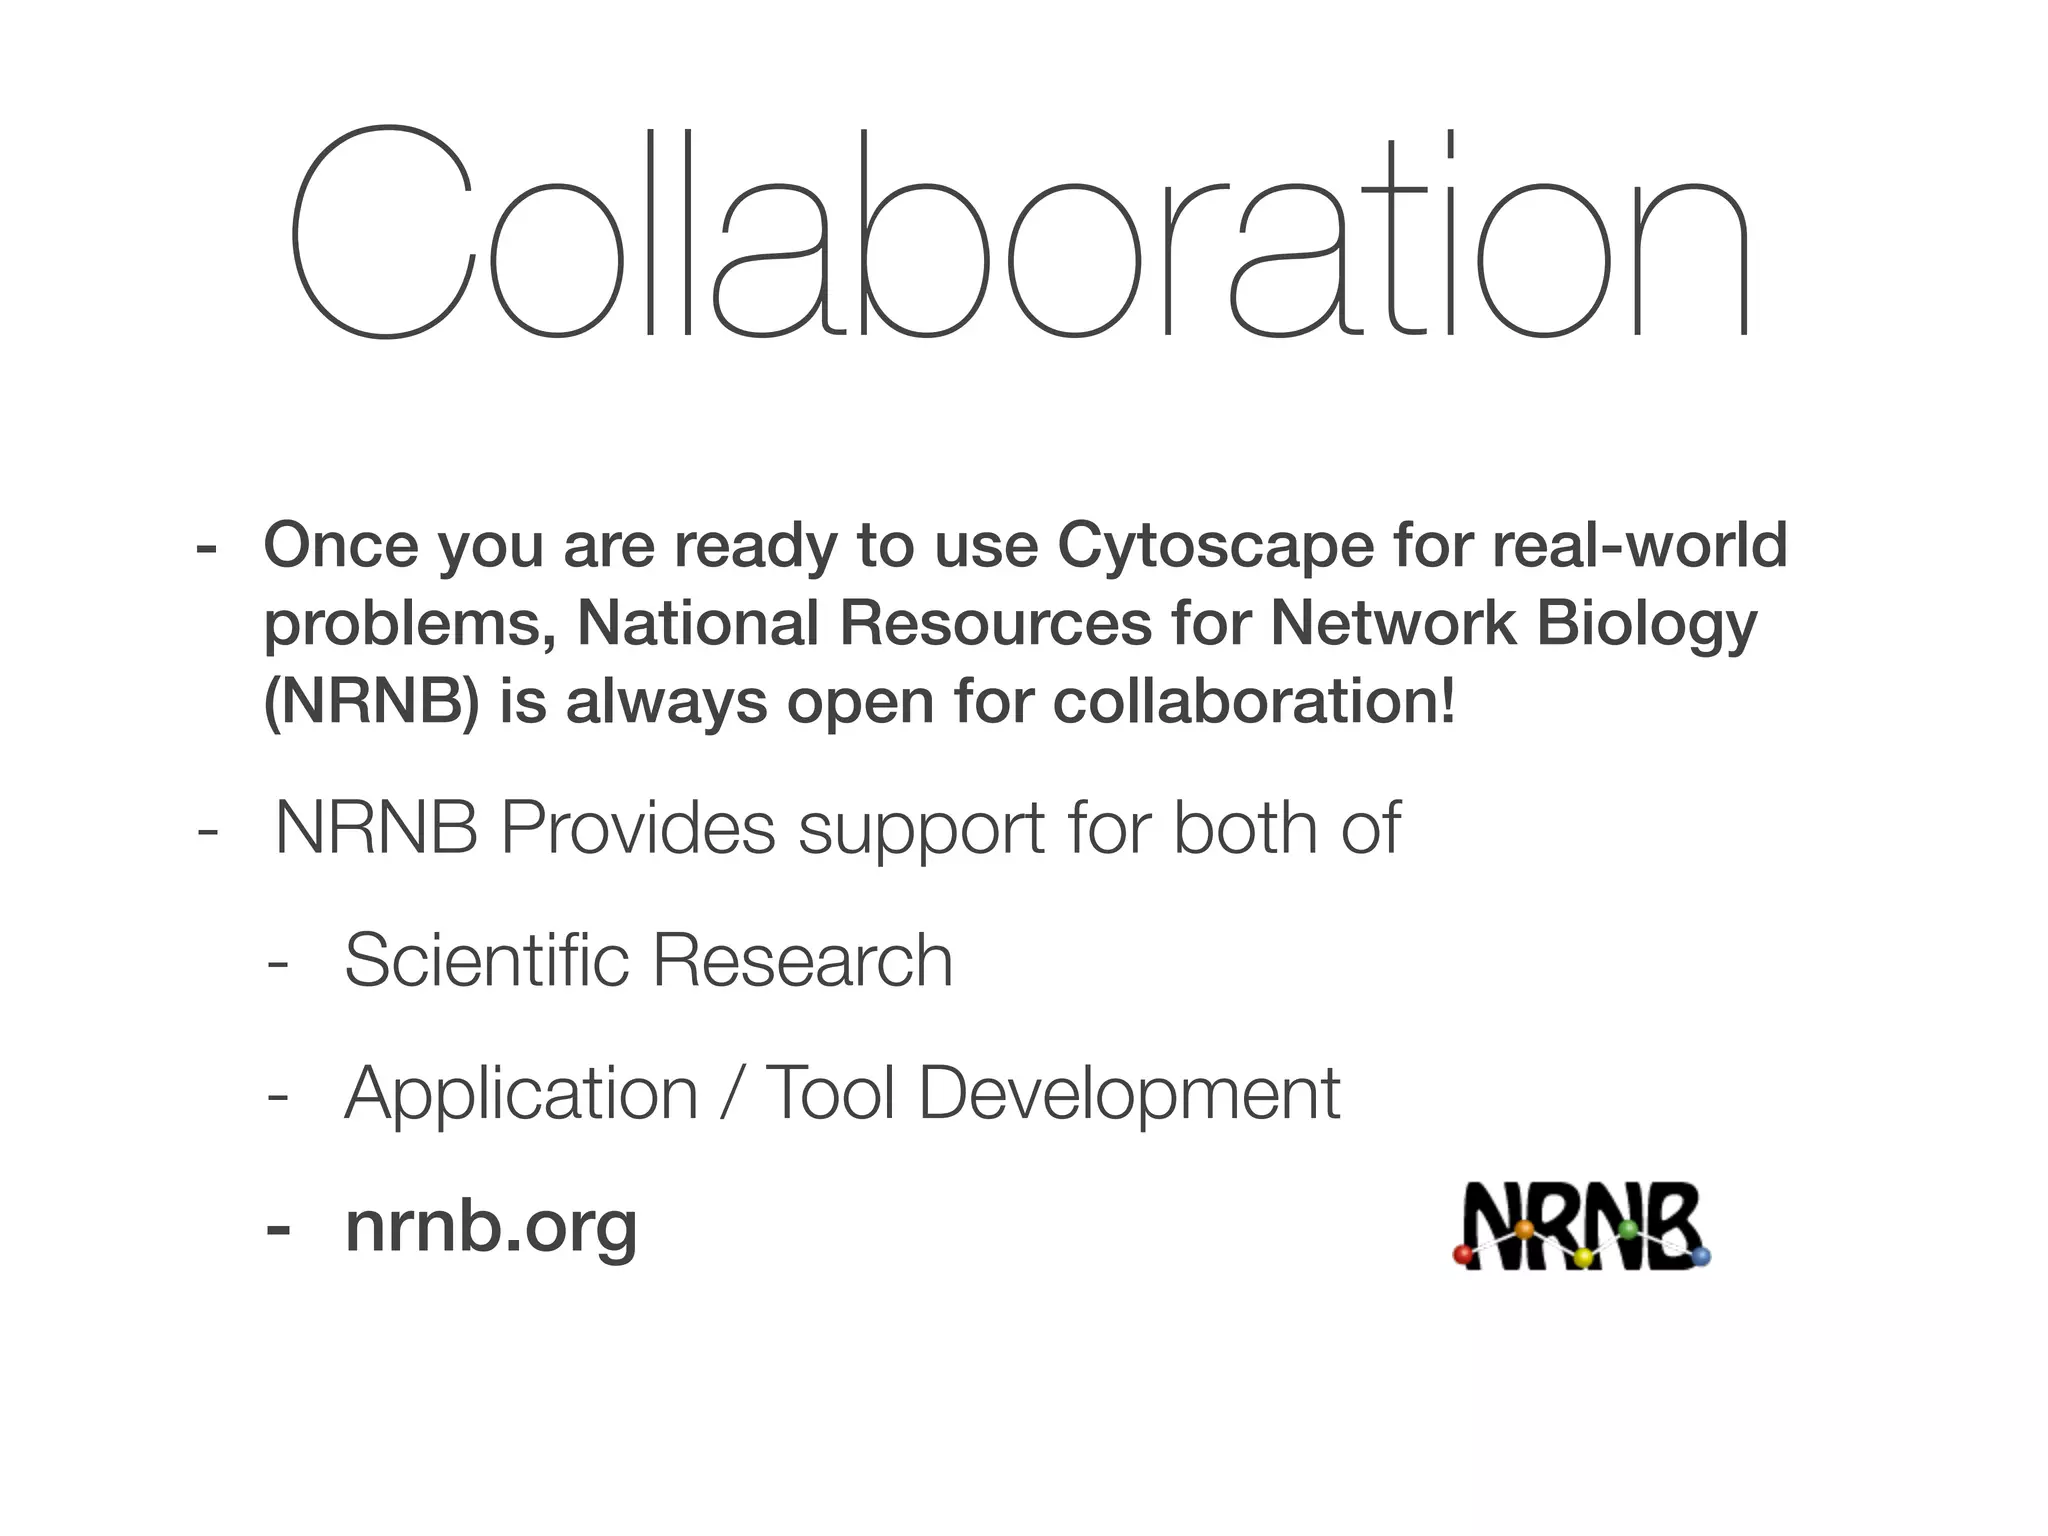
Promotes collaboration with the National Resources for Network Biology and resources available for Cytoscape users.
Concludes with questions, feedback gathering, and contact details for further inquiries about Cytoscape.
Workshop: Introduction to Cytoscape at UT-KBRIN Bioinformatics Summit 2014 (4/11/2014)
1.
Keiichiro Ono
UC, SanDiego
Trey Ideker Lab
Bioinformatics
Summit 2014
4/11/2014
Cytoscape
An Open Source Platform for
Biological Network Analysis and Visualization
2.
-
Thanks for Attending!
-Keiichiro Ono
- Cytoscape Core Developer since 2005
- Core module design & implementation
- Area of Interest: Data Integration & Visualization
- University of California, San Diego Trey Ideker Lab
An Open SourcePlatform for Biological Network Data
Integration, Analysis and Visualization
Cytoscape
7.
Cytoscape
- Open Source(LGPL)
- Free for both commercial and academic use
- Developed and maintained by universities,
companies, and research institutions
- De-facto standard software in biological network
research community
- Expandable by Apps
- This is why Cytoscape is a Platform, not a
simple desktop application
Nodes and Edgesin Biology
- Protein - Protein
- Protein - DNA
- Genetic (Epistasis)
- Synthetic lethality
- Biochemical
Reactions
- Compound - Enzyme - Compound
Cartoon representation of a complex between DNA and the protein p53
Node
Node
Edge
is NOT a...
-Cytoscape is a powerful tool, but cannot do
everything
- Simulator
- Fully-featured Pathway diagram editor
- Statistical network analysis tool suite
- Still, you can implement these as Apps though
NCBI Gene ID672
On Chromosome 17
GO Terms
DNA Repair
Cell Cycle
DNA Binding
Ensemble ID
ENSG00000012048
BRCA1
51.
Data Tables forCytoscape
- Example:
- Numeric
- Gene expression profiles
- Network statistics calculated in other
applications, such as R
- Confidence scores for edges
- Text (or categorical)
- GO annotation for genes
- List of genes related to disease X
- Targets for FDA approved drugs
- Genes on KEGG Pathway Y
- Clusters / group / community calculated
in external programs
- …
52.
Your Data Sets
-Anything saved as a table can be
loaded into Cytoscape
- Excel
- Tab Delimited Document
- CSV
- As long as proper mapping key is
available, Cytoscape can map them to
your networks.
Network Analysis
- Filtering
-Calculate network statistics by
Network Analyzer
- Degree distribution,centrality, etc.
- Advanced analysis by Apps
59.
Filtering (Selection)
- Simple,but powerful feature to extract sub
networks from large data sets
- Select nodes and edges with specific
conditions
- Pick nodes with degree > 5
- Select edges extracted from publication
X
- Find nodes on KEGG Pathway X
Summary: Selection
- Createfilter from your biological question:
- Select all nodes annotated with GO
term “DNA repair” and have two or
more know interaction
- Select all genes directly interact with
brca1, brca2, etc.
- Extract subnetwork by CTR+N
- Goal: Helpothers to
understand your data
- Emphasize what you
want to tell
- Use color, shape,
size of objects
effectively!
- Excellent resource for
data visualization
- Tamara Munzner’s Web Site:
http://www.cs.ubc.ca/~tmm/
Data Visualization
Visual Style
- ExampleMappings:
- Expression profiles to node color
- Object type (protein, compounds,
complex, etc.) to node shape
- Interaction type (Protein-Protein,
Protein-DNA, etc.) to edge line
style
Cytoscape Apps
- Extensionprograms to
add new features to
Cytoscape (were called
Plugins)
- Large App developer/
user community
- This is why Cytoscape
is so successful in life
science community!
Quick Overview ofApps
A travel guide to Cytoscape plugins
!
Rintaro Saito, Michael E Smoot, Keiichiro Ono, Johannes Ruscheinski, Peng-
Liang Wang, Samad Lotia, Alexander R Pico, Gary D Bader, Trey Ideker (2012)
Nature Methods 9 (11) p. 1069-1076
87.
A travel guideto
Cytoscape plugins
!
Rintaro Saito, Michael E Smoot, Keiichiro Ono, Johannes
Ruscheinski, Peng-Liang Wang, Samad Lotia, Alexander R Pico,
Gary D Bader, Trey Ideker (2012)
Nature Methods 9 (11) p. 1069-1076
88.
A travel guideto Cytoscape plugins
!
Rintaro Saito, Michael E Smoot, Keiichiro Ono, Johannes Ruscheinski, Peng-Liang Wang,
Samad Lotia, Alexander R Pico, Gary D Bader, Trey Ideker (2012)
Nature Methods 9 (11) p. 1069-1076
89.
Agenda
- What isCytoscape?
- Data Integration, Analysis, and
Visualization with Cytoscape
- Cytoscape Ecosystem
- Cytoscape Future Plan
Cytoscape Family
- Version2.x - Legacy version
- Last release for 2.x is 2.8.3.
- Version 3.x - Current production version
- Latest version: 3.1.0
- Important Note: Apps for 2.x is not
compatible with 3.x
(We have similar problem like Python…)
What is cytoscape.js?
AJavascript Library for network visualization,
not a web application!
Need to write some code to use it on the web browsers…
98.
Complete desktop
application fornetwork
analysis and visualization
!
Written in Java
!
Expandable by Apps
!
For Users
A Javascript Library for
network visualization,
not a web application!
!
Written in JavaScript
!
Expandable by Extensions
!
For Developers
JS
Export to HTML5Session
Feature for users: you can view networks on web browsers
with Cytoscape.js
Under development… We need early adapters for testing!
JS
Future Plan
- Integrationto external
tools
- Access from
Python, R, Perl, etc.
- More integration to
Cytoscape.js
- Cytoscape
Cyberinfrastructure
(Cytoscape CI)
106.
Cytoscape CI: Background
-The size of data biologists have
to analyze is still growing
- Desktop machines are
powerful, but not enough for
large scale data analysis
- Clusters / Clouds
- Using multiple computing
resources as external service is
normal for biological data
analysis…
- Scalability
Service 1
Service 2
Collaboration
- Once youare ready to use Cytoscape for real-world
problems, National Resources for Network Biology
(NRNB) is always open for collaboration!
- NRNB Provides support for both of
- Scientific Research
- Application / Tool Development
- nrnb.org
113.
-
- Two GoogleGroups
- cytoscape-
discuss@googlegroups.com
- cytoscape-
helpdesk@googlegroups.com
- ANY question is OK!
Getting Help