Download as PDF, PPTX
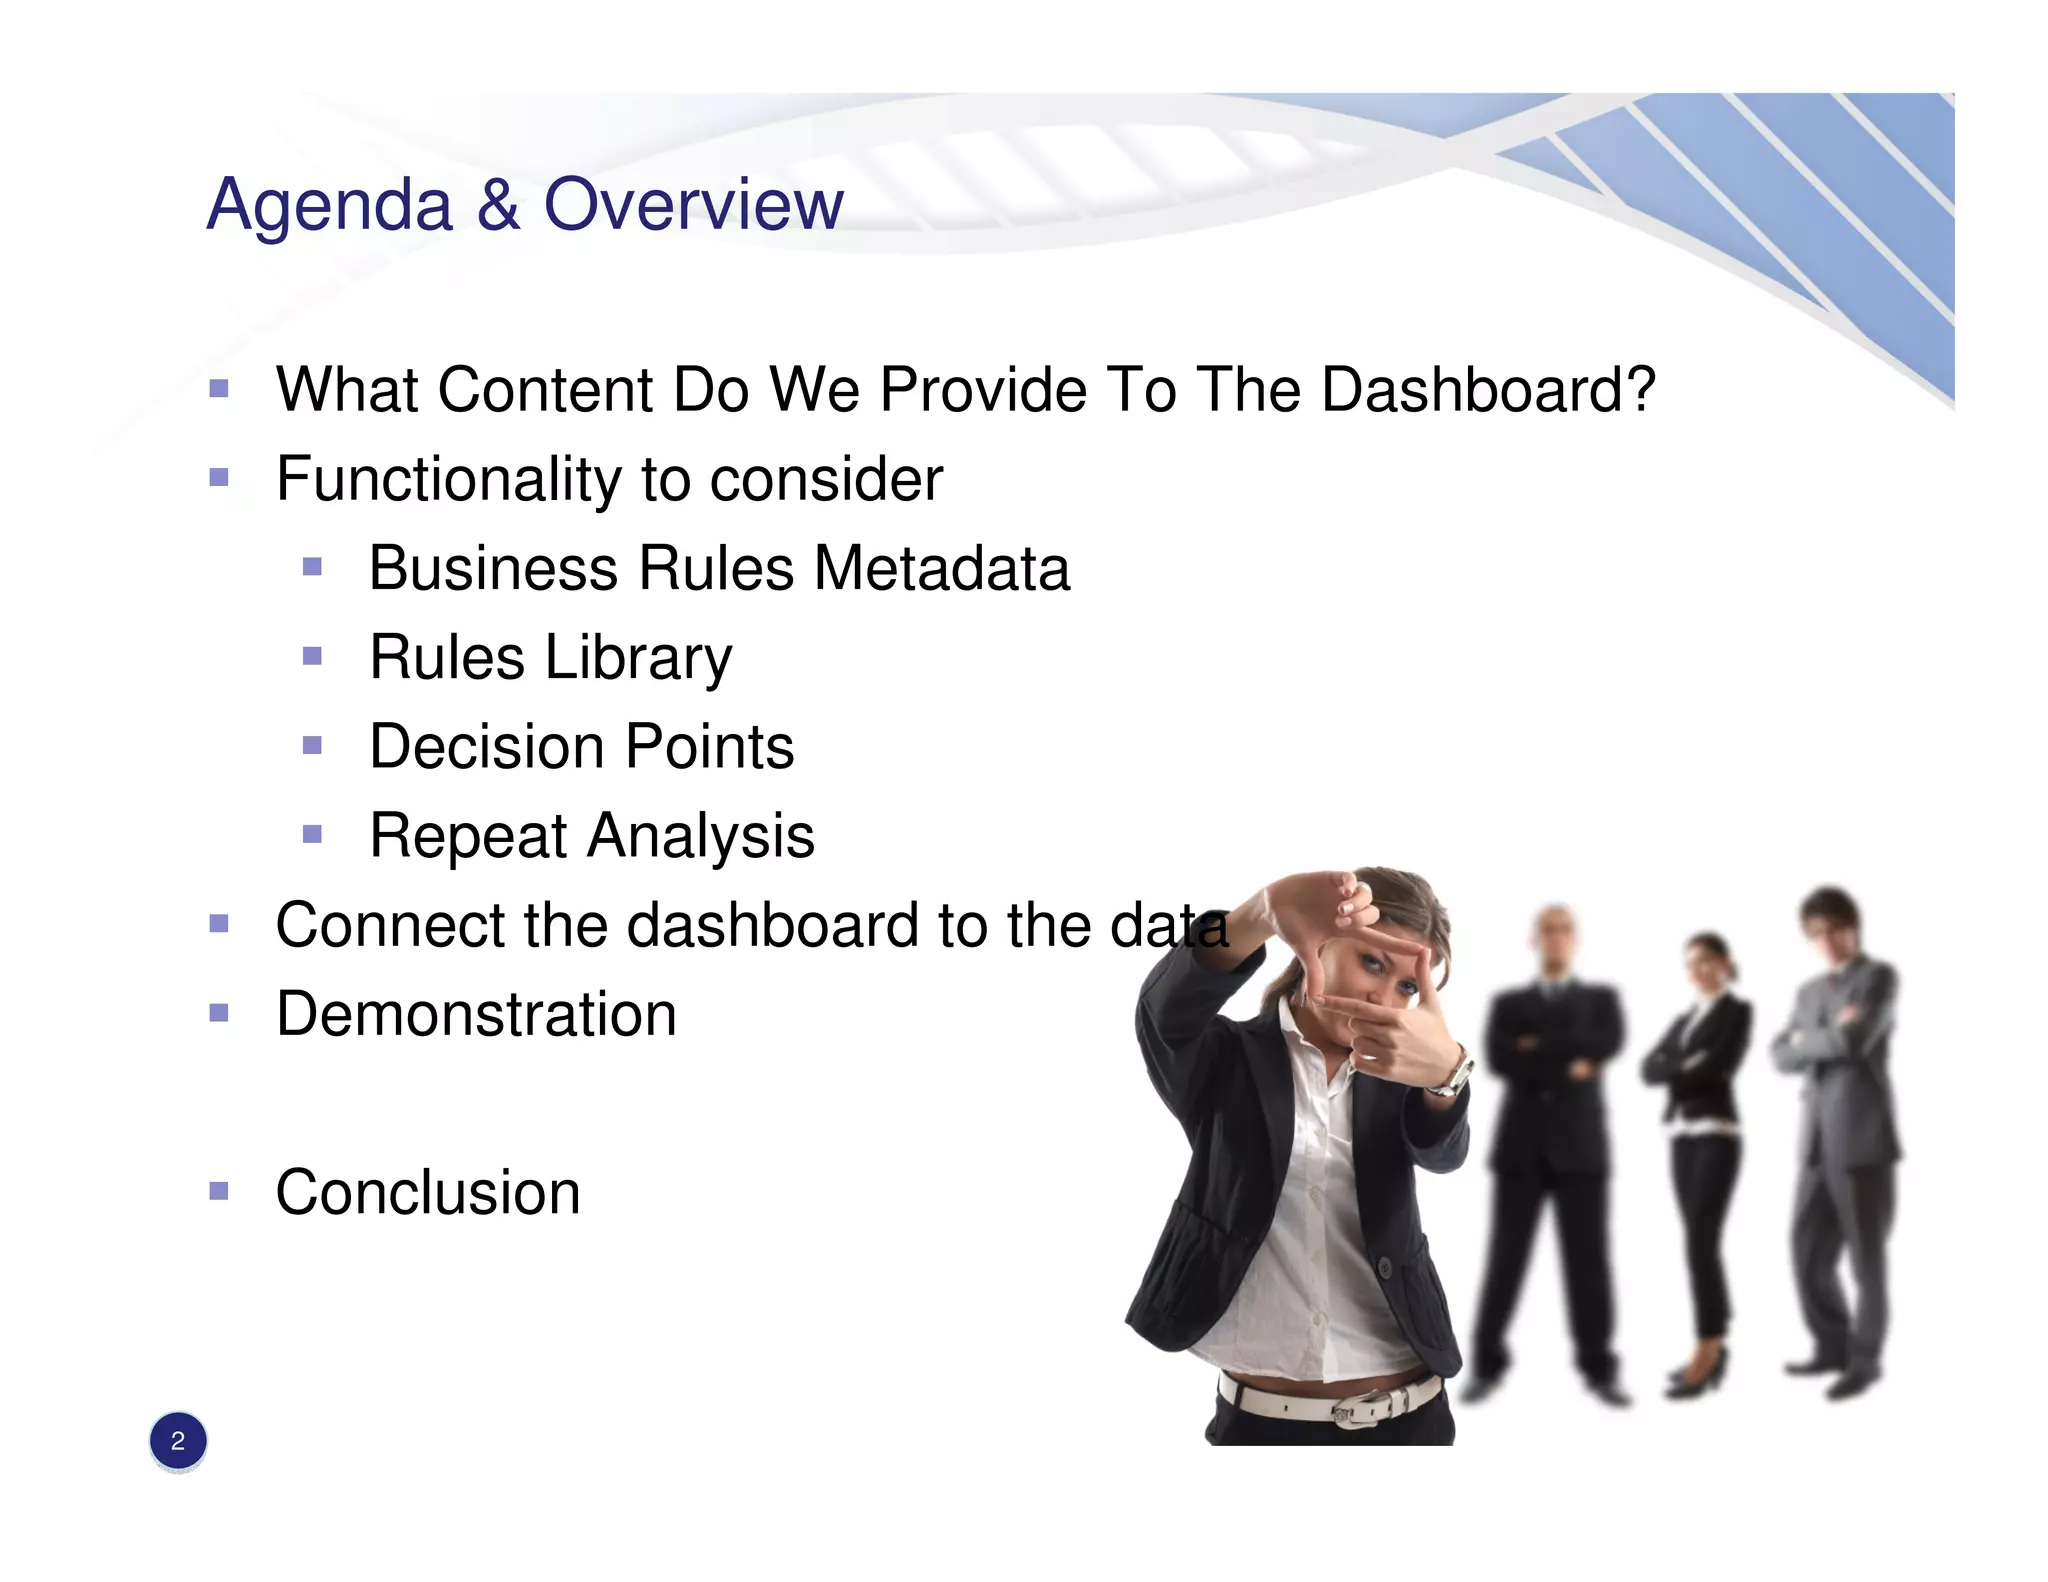
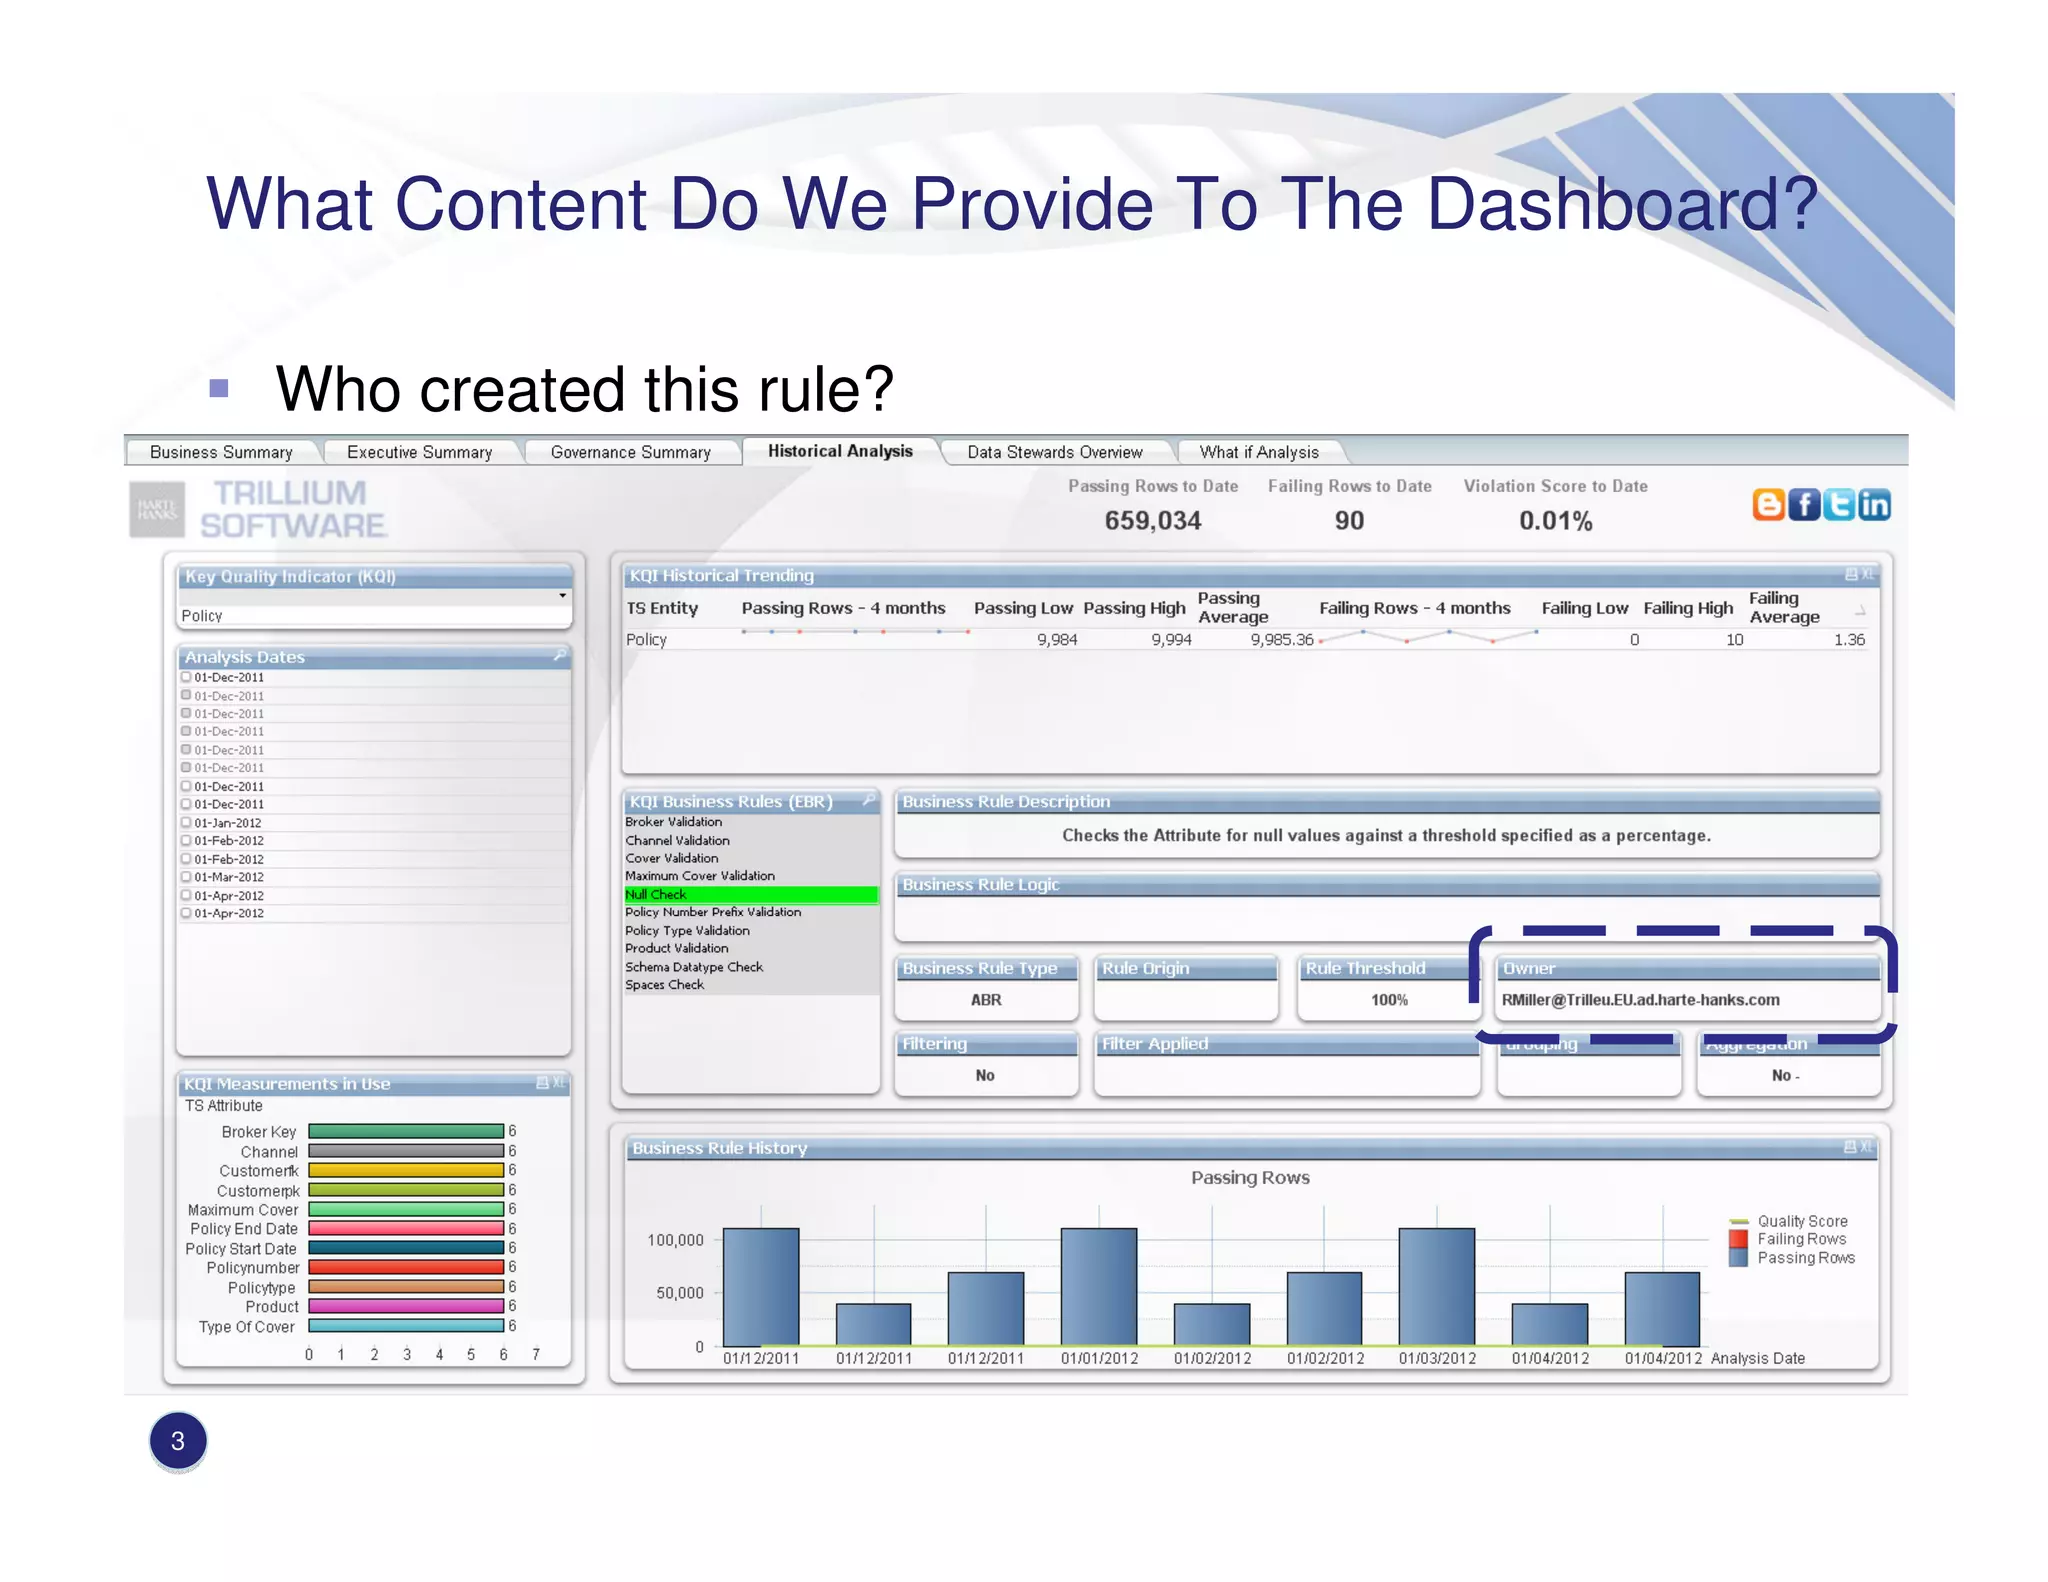
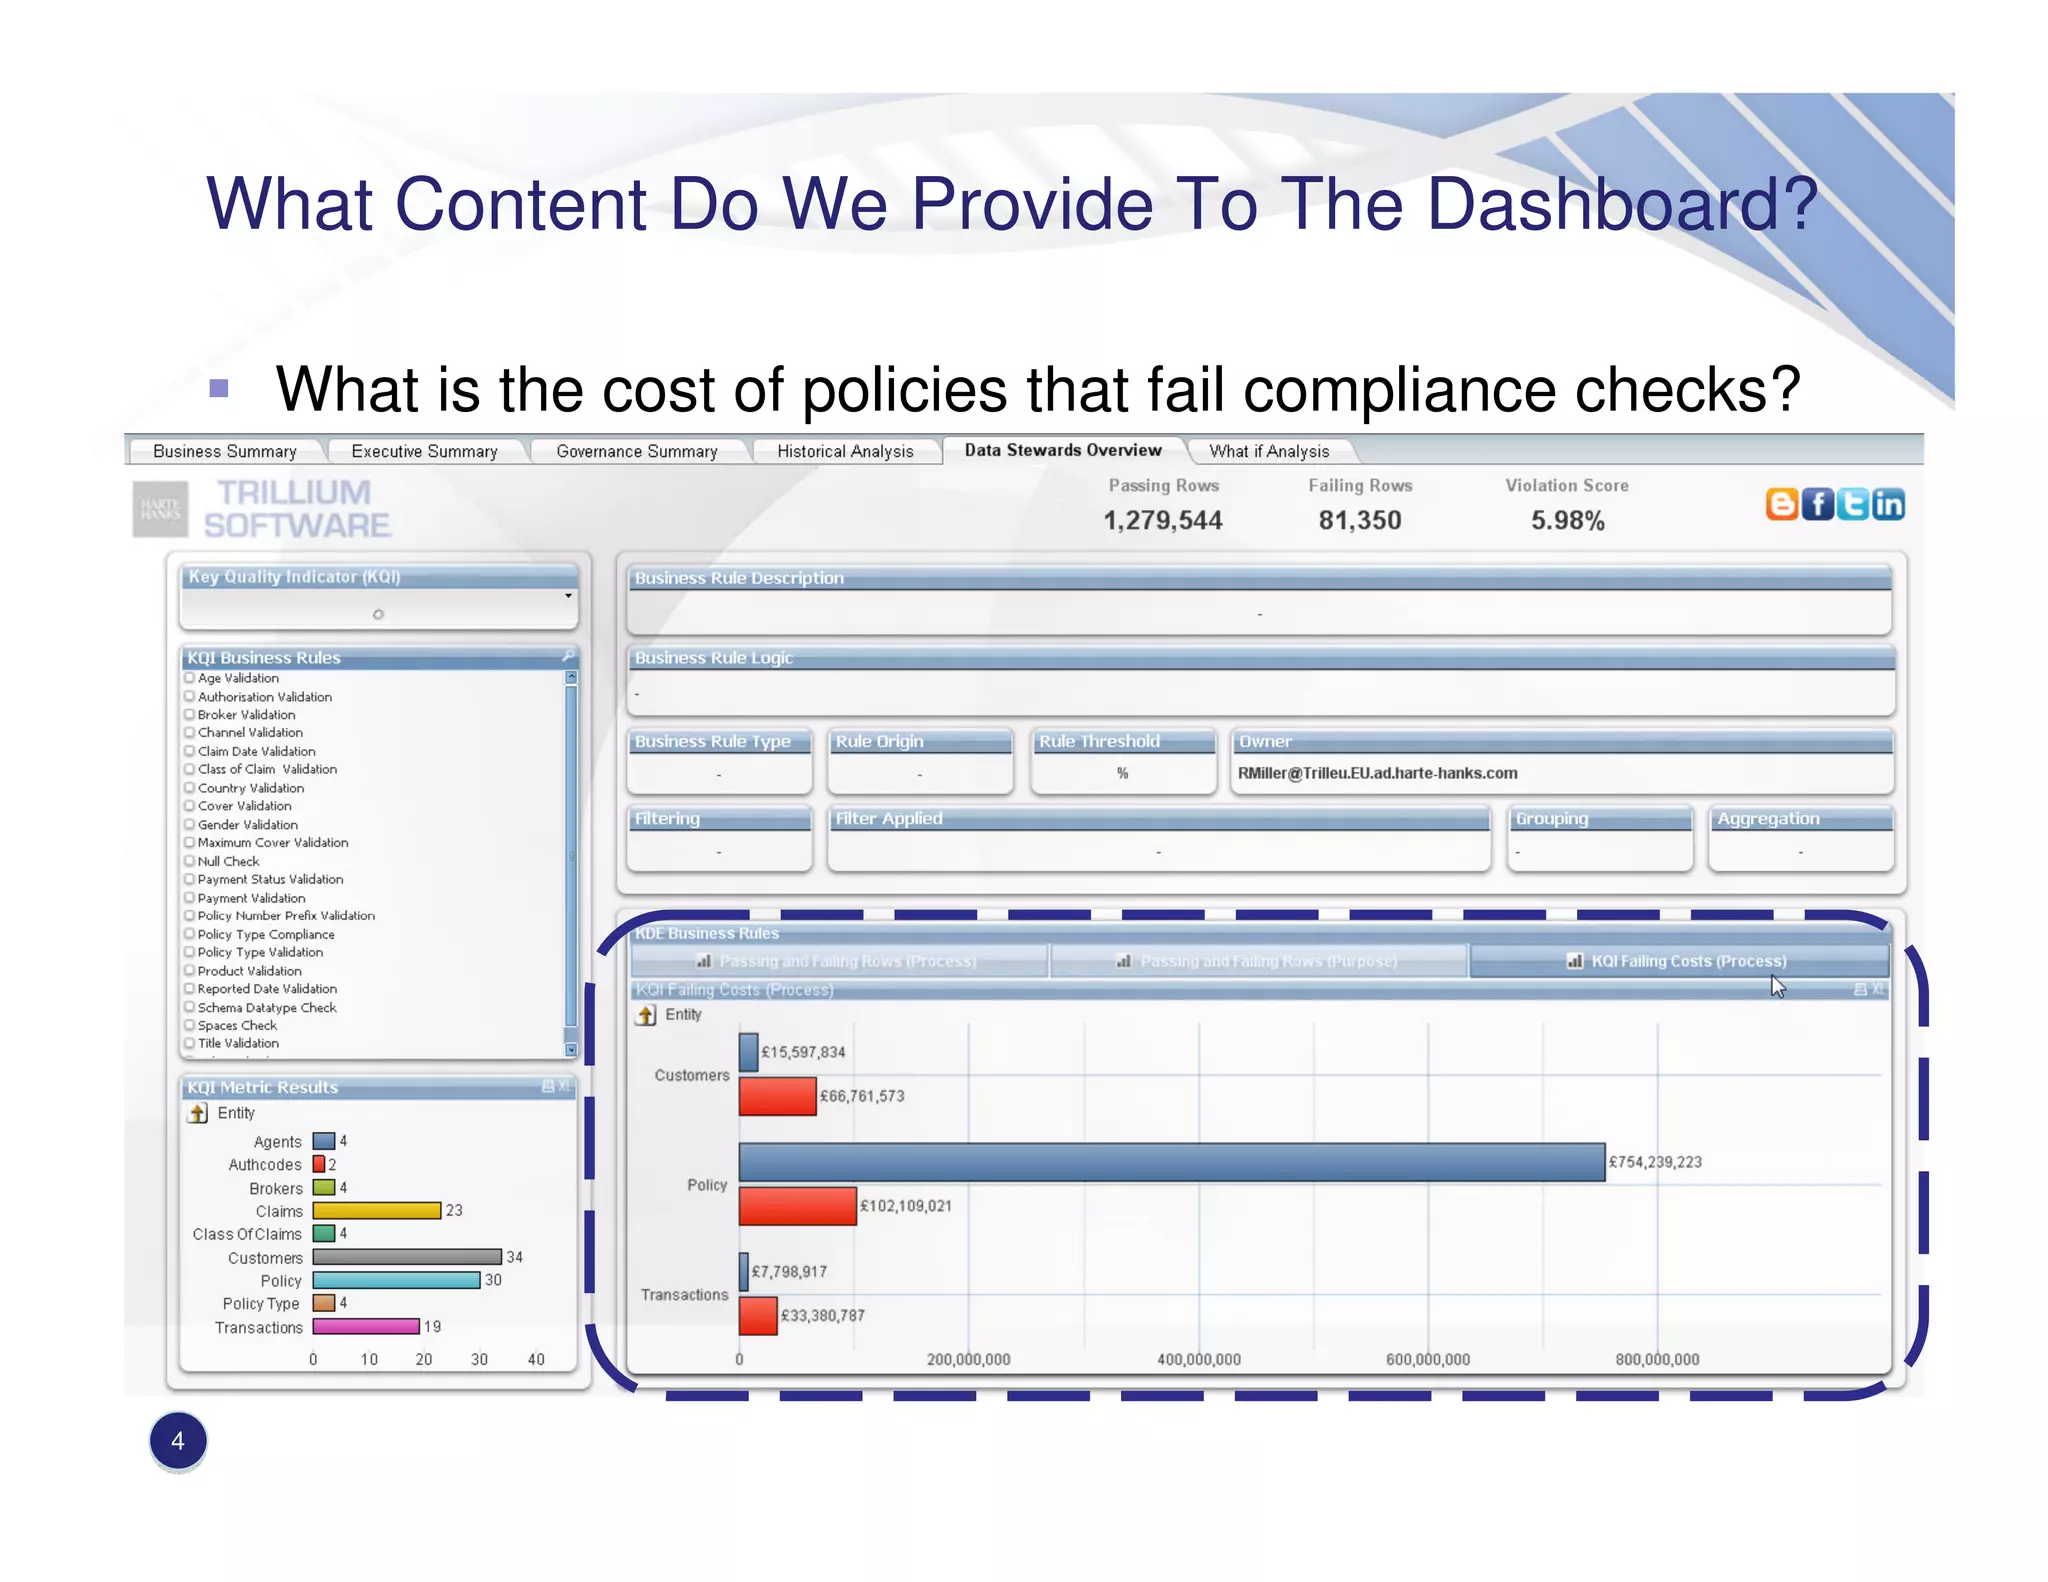
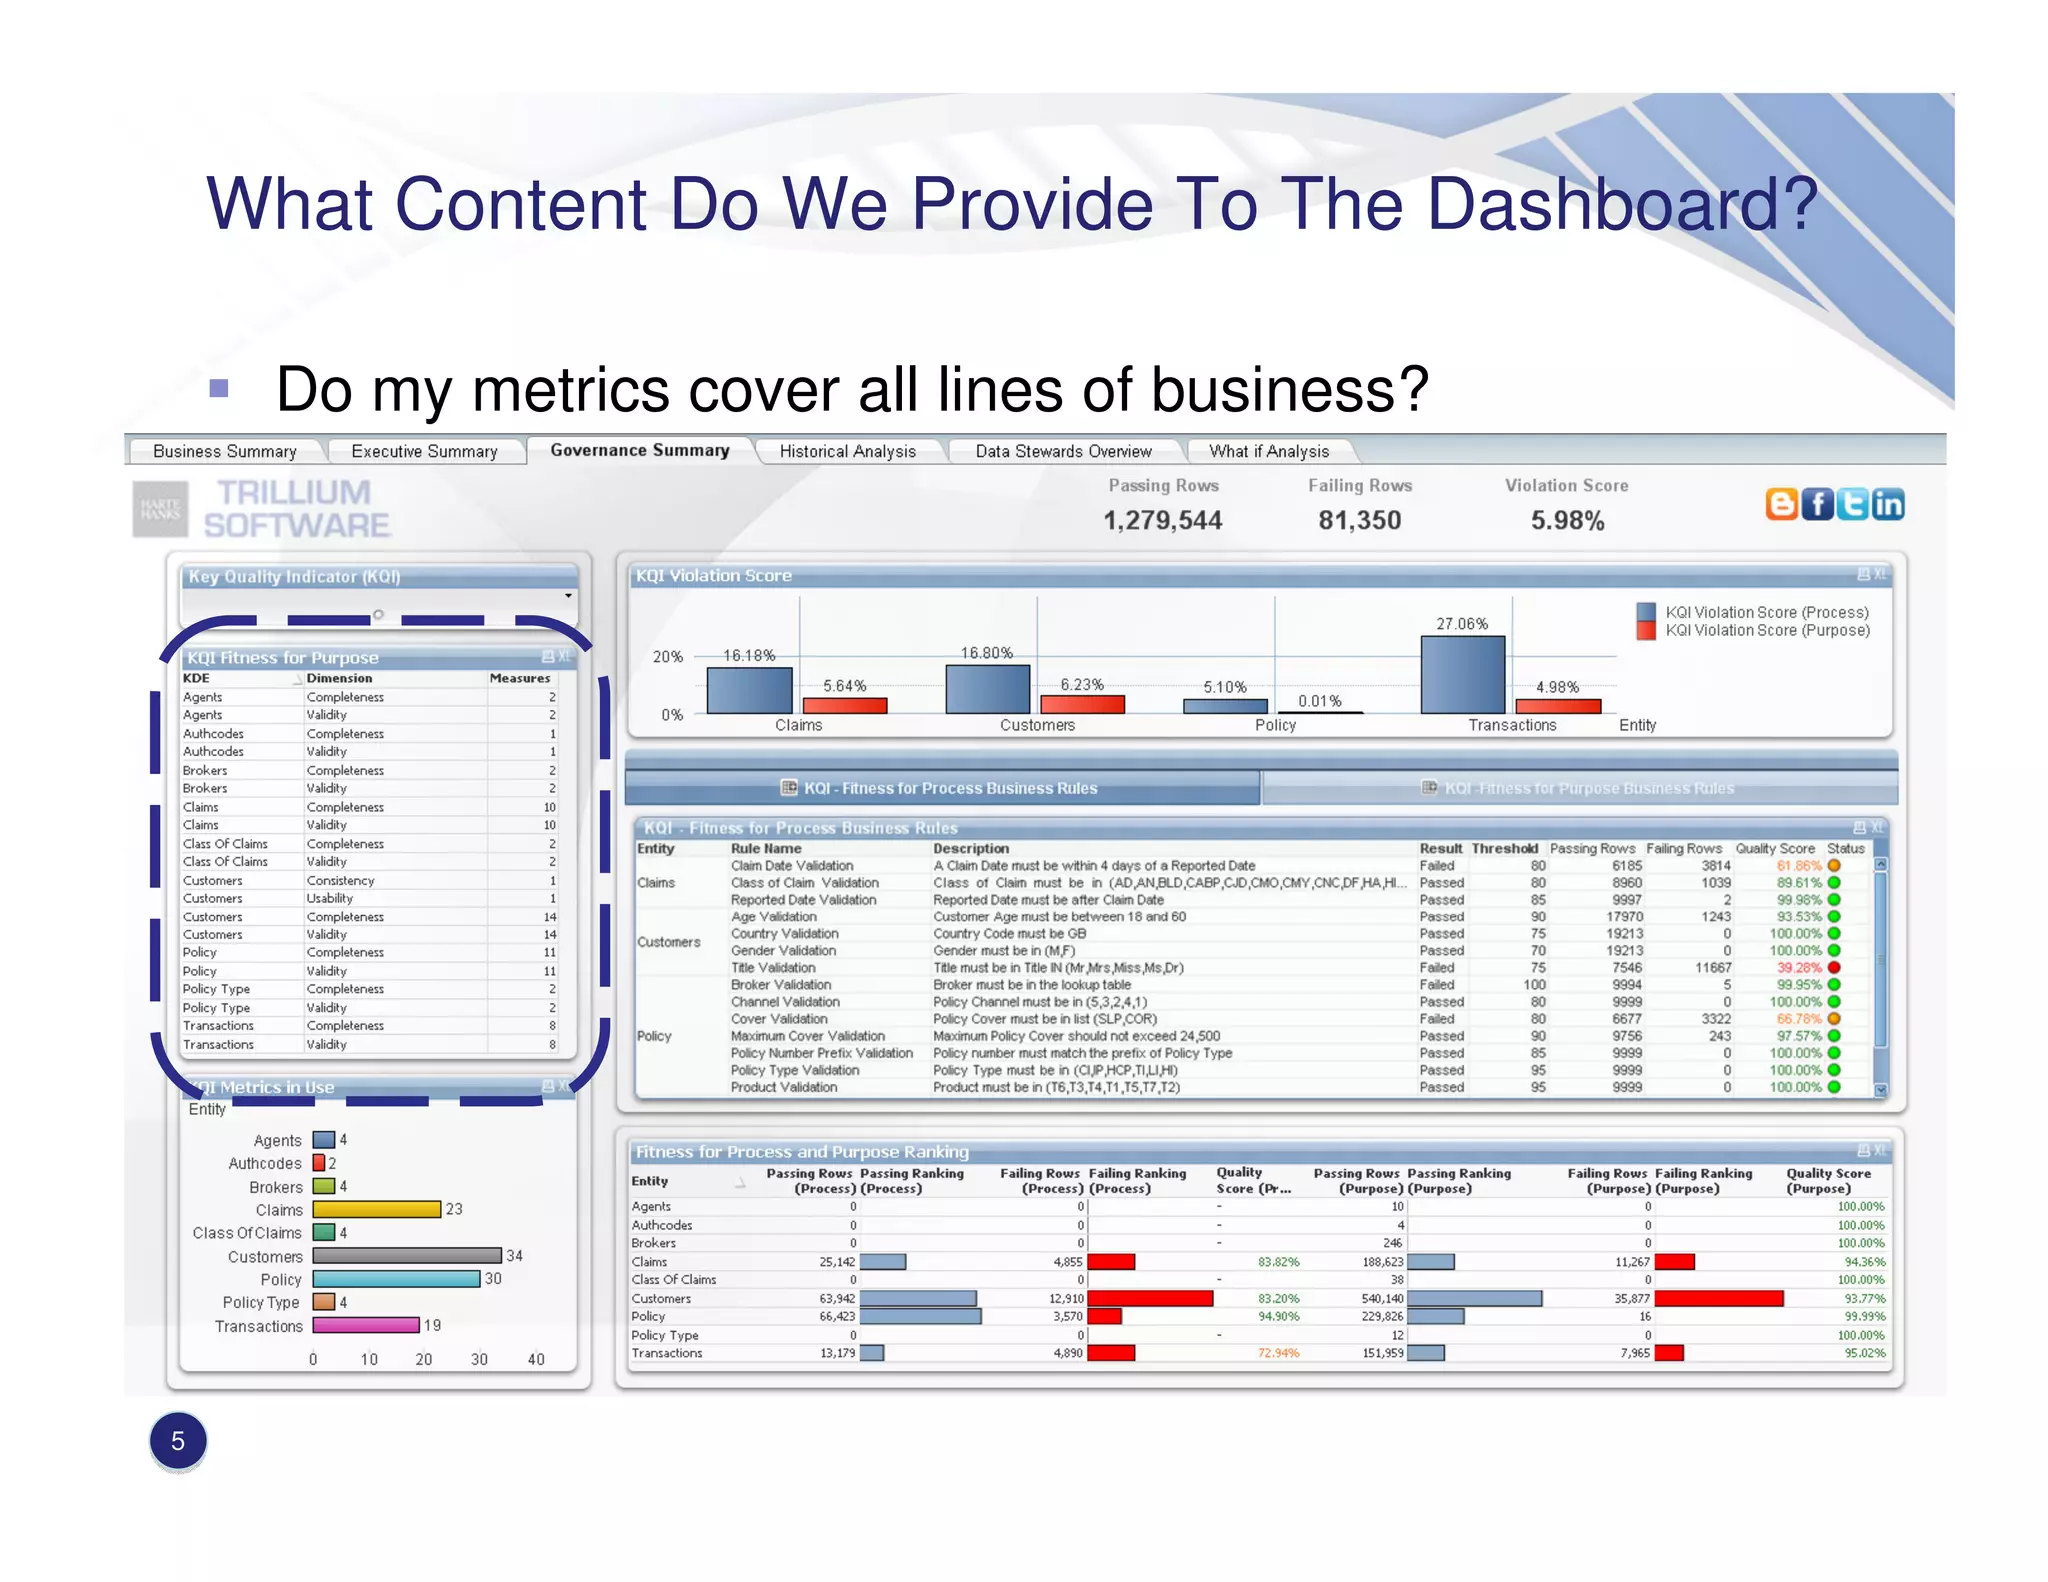
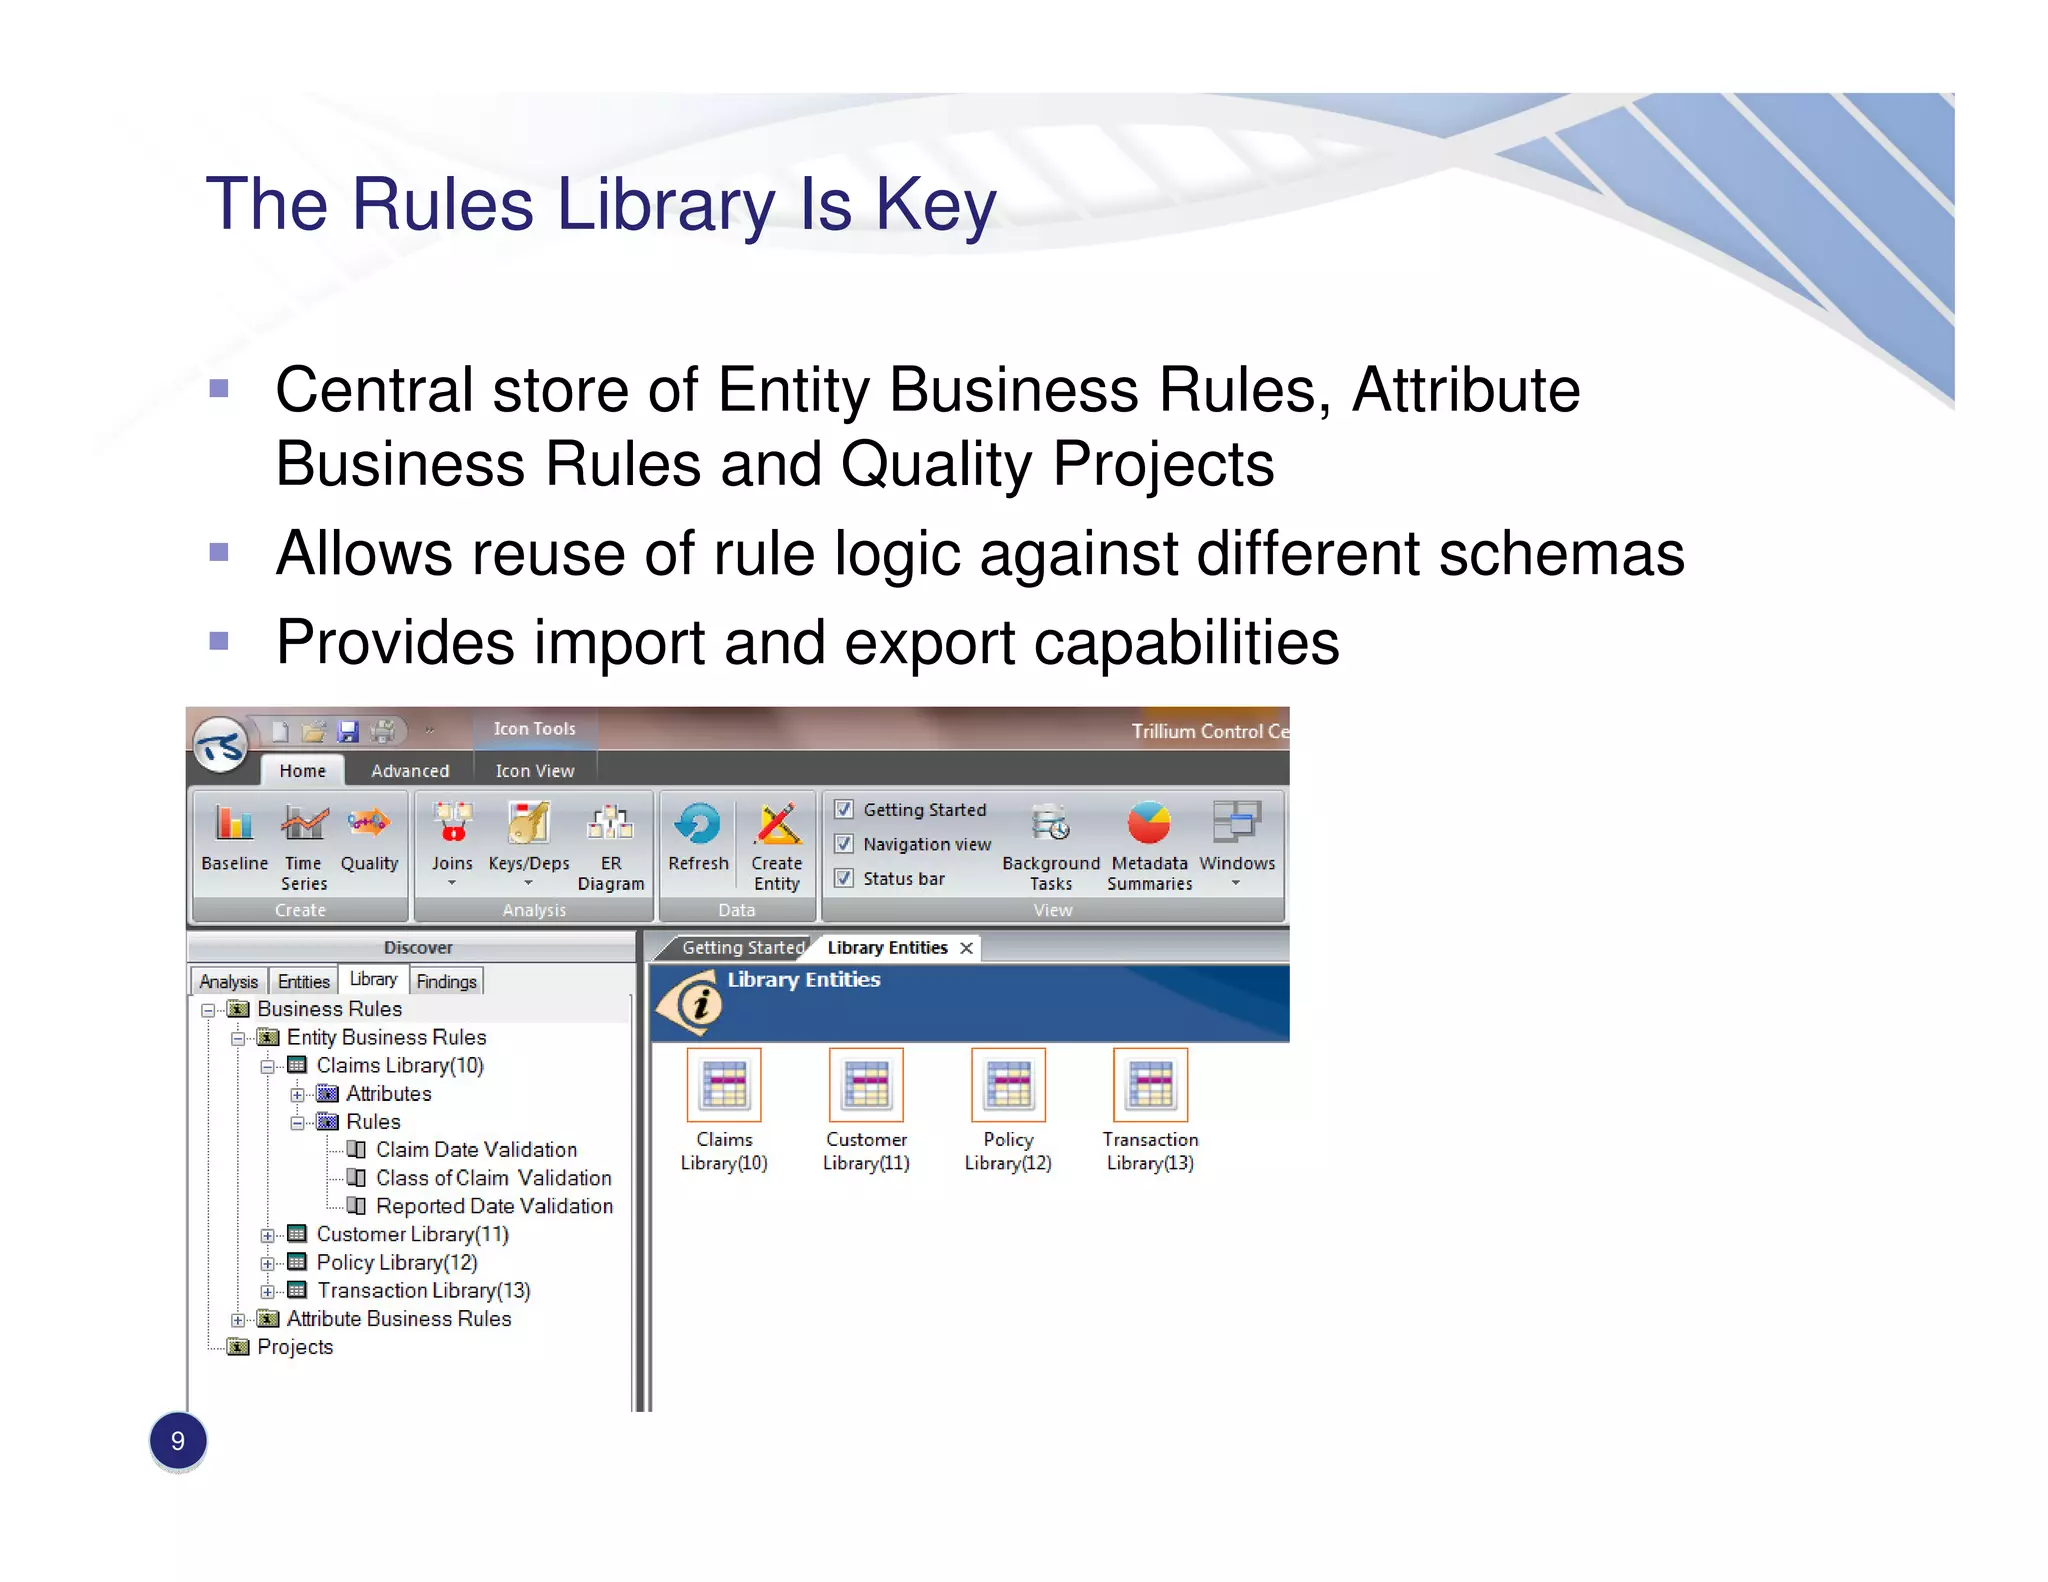
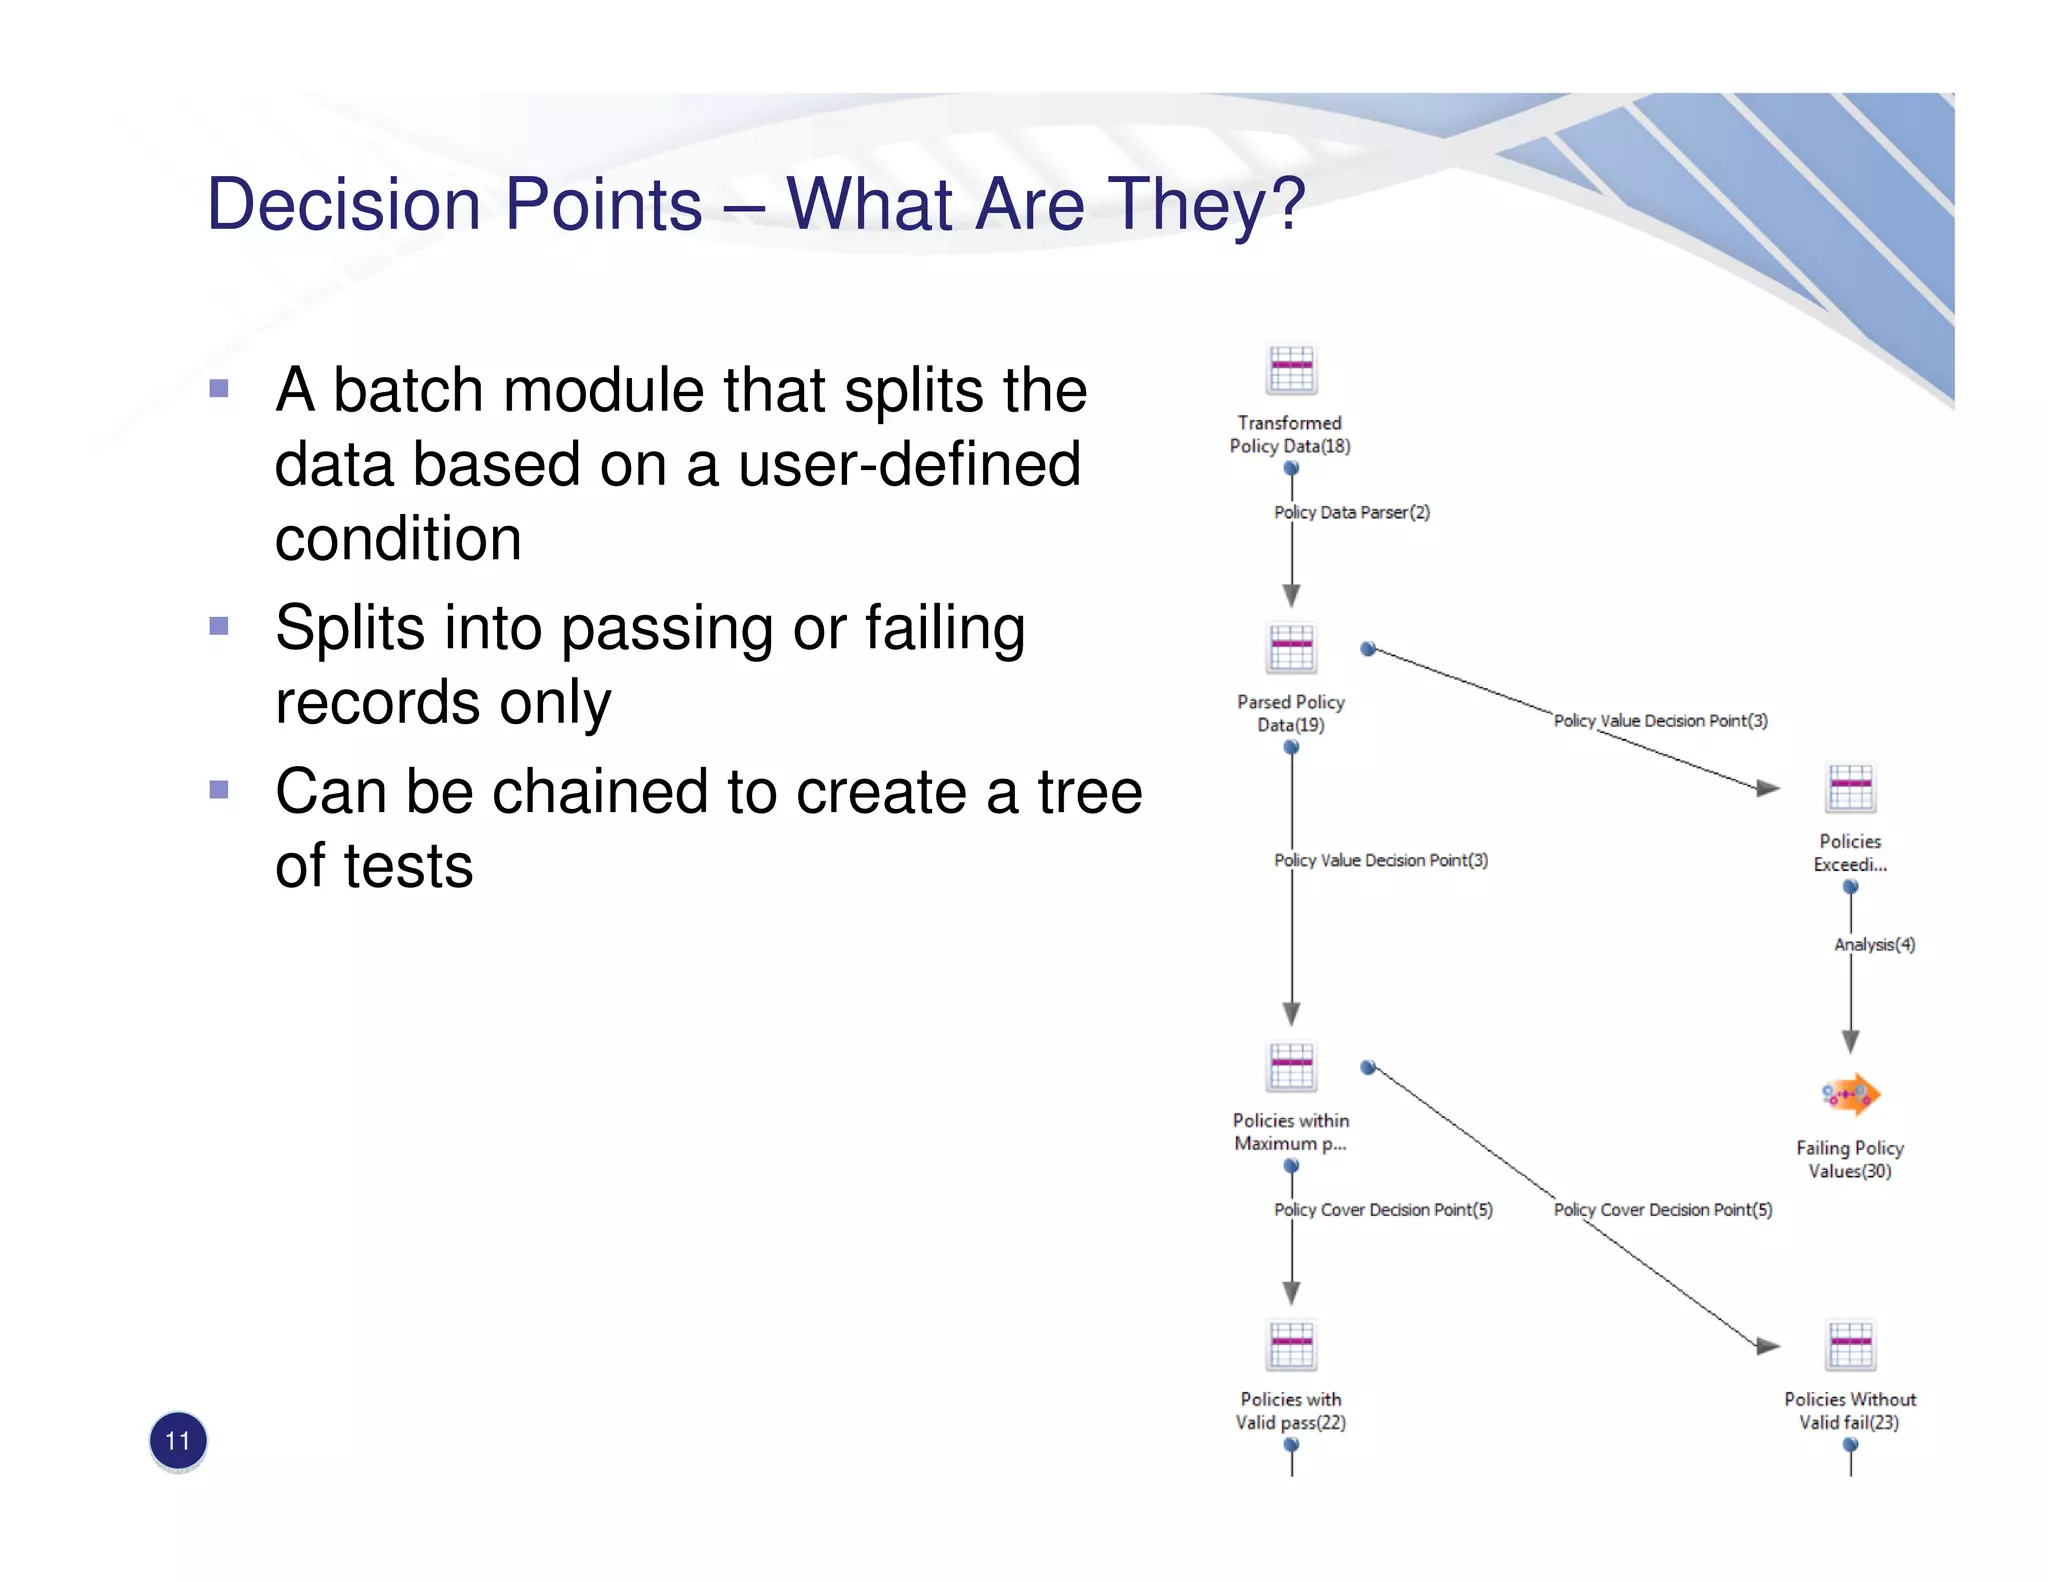
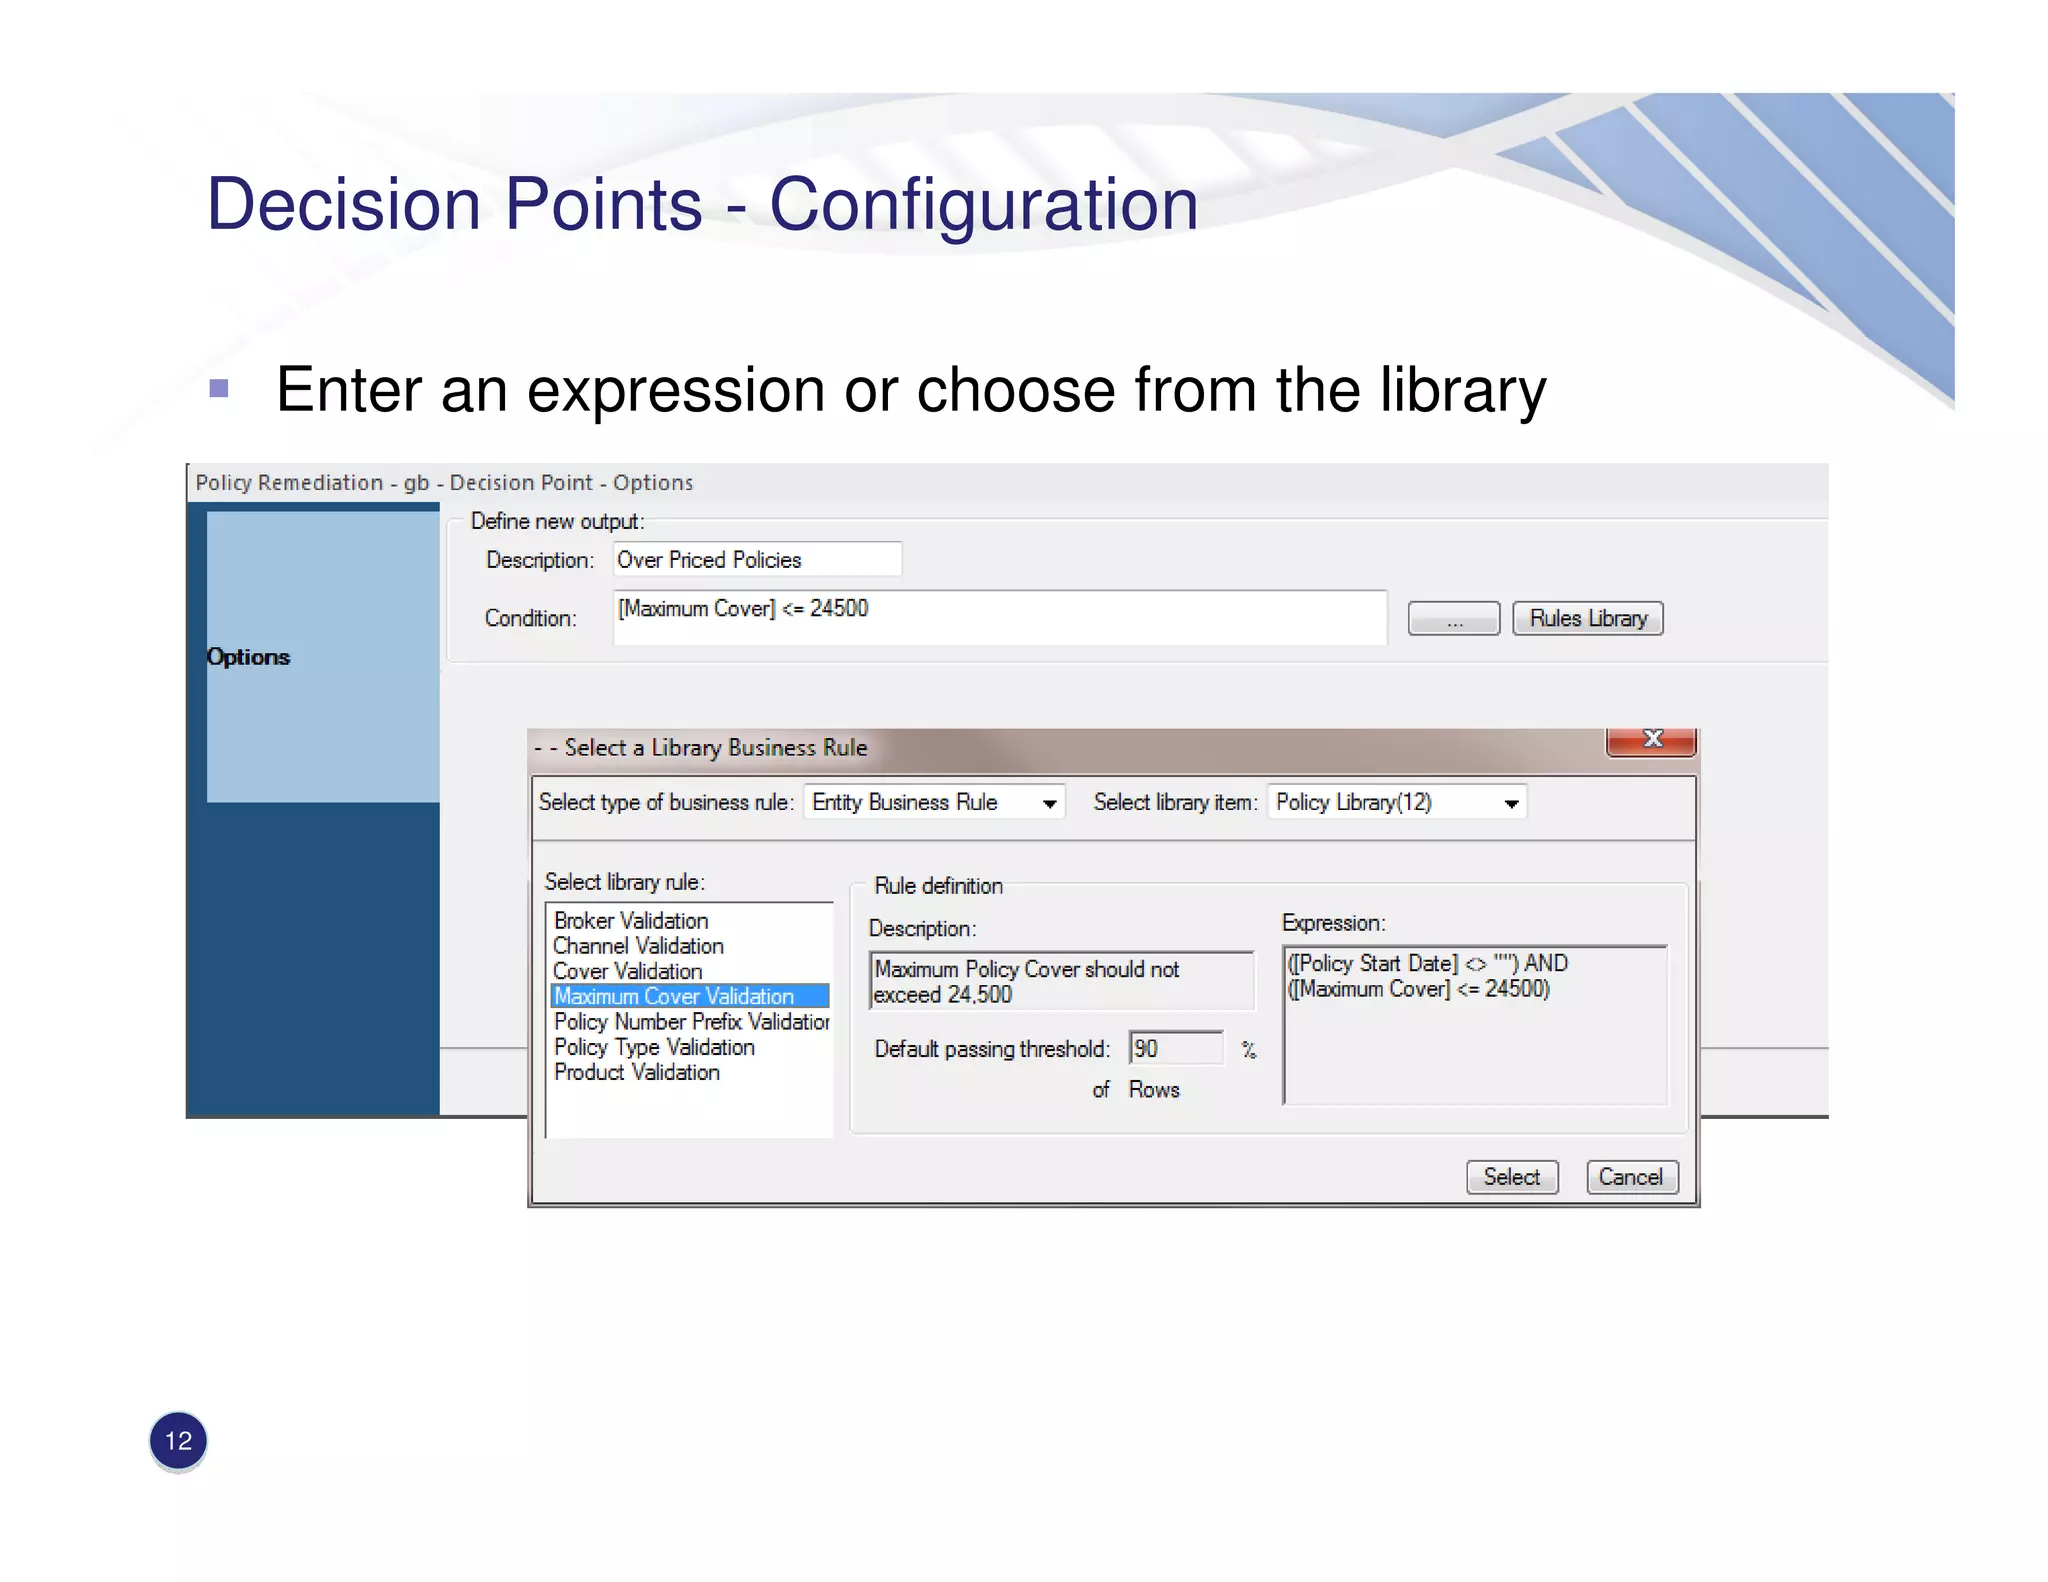
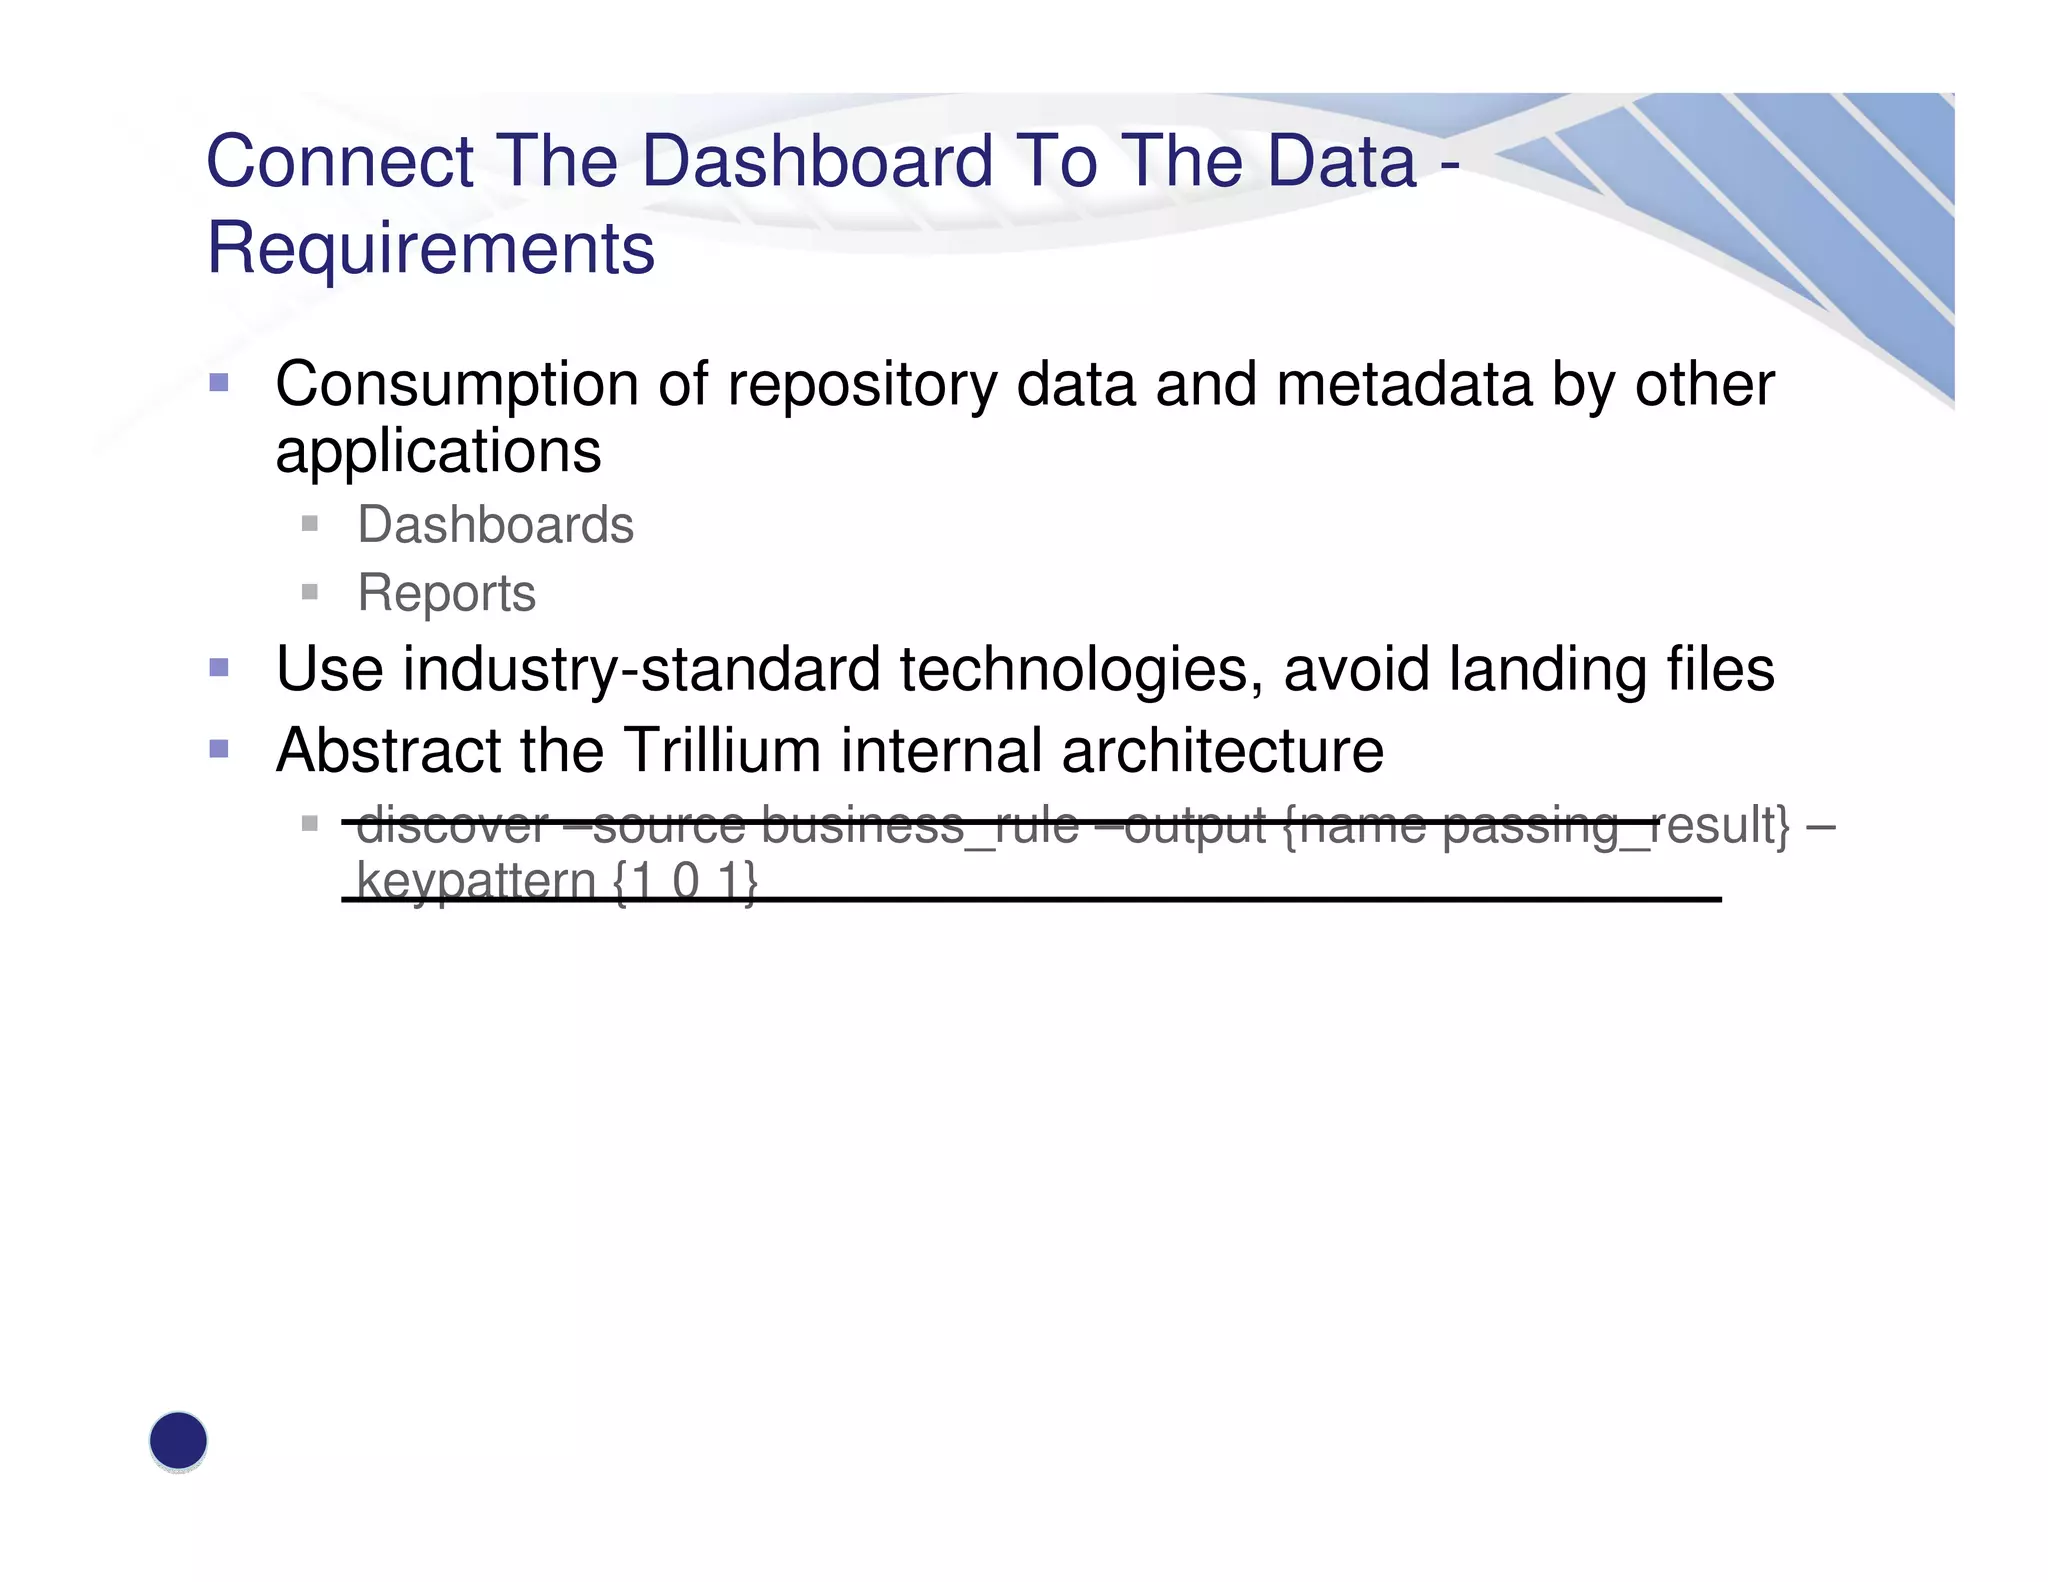
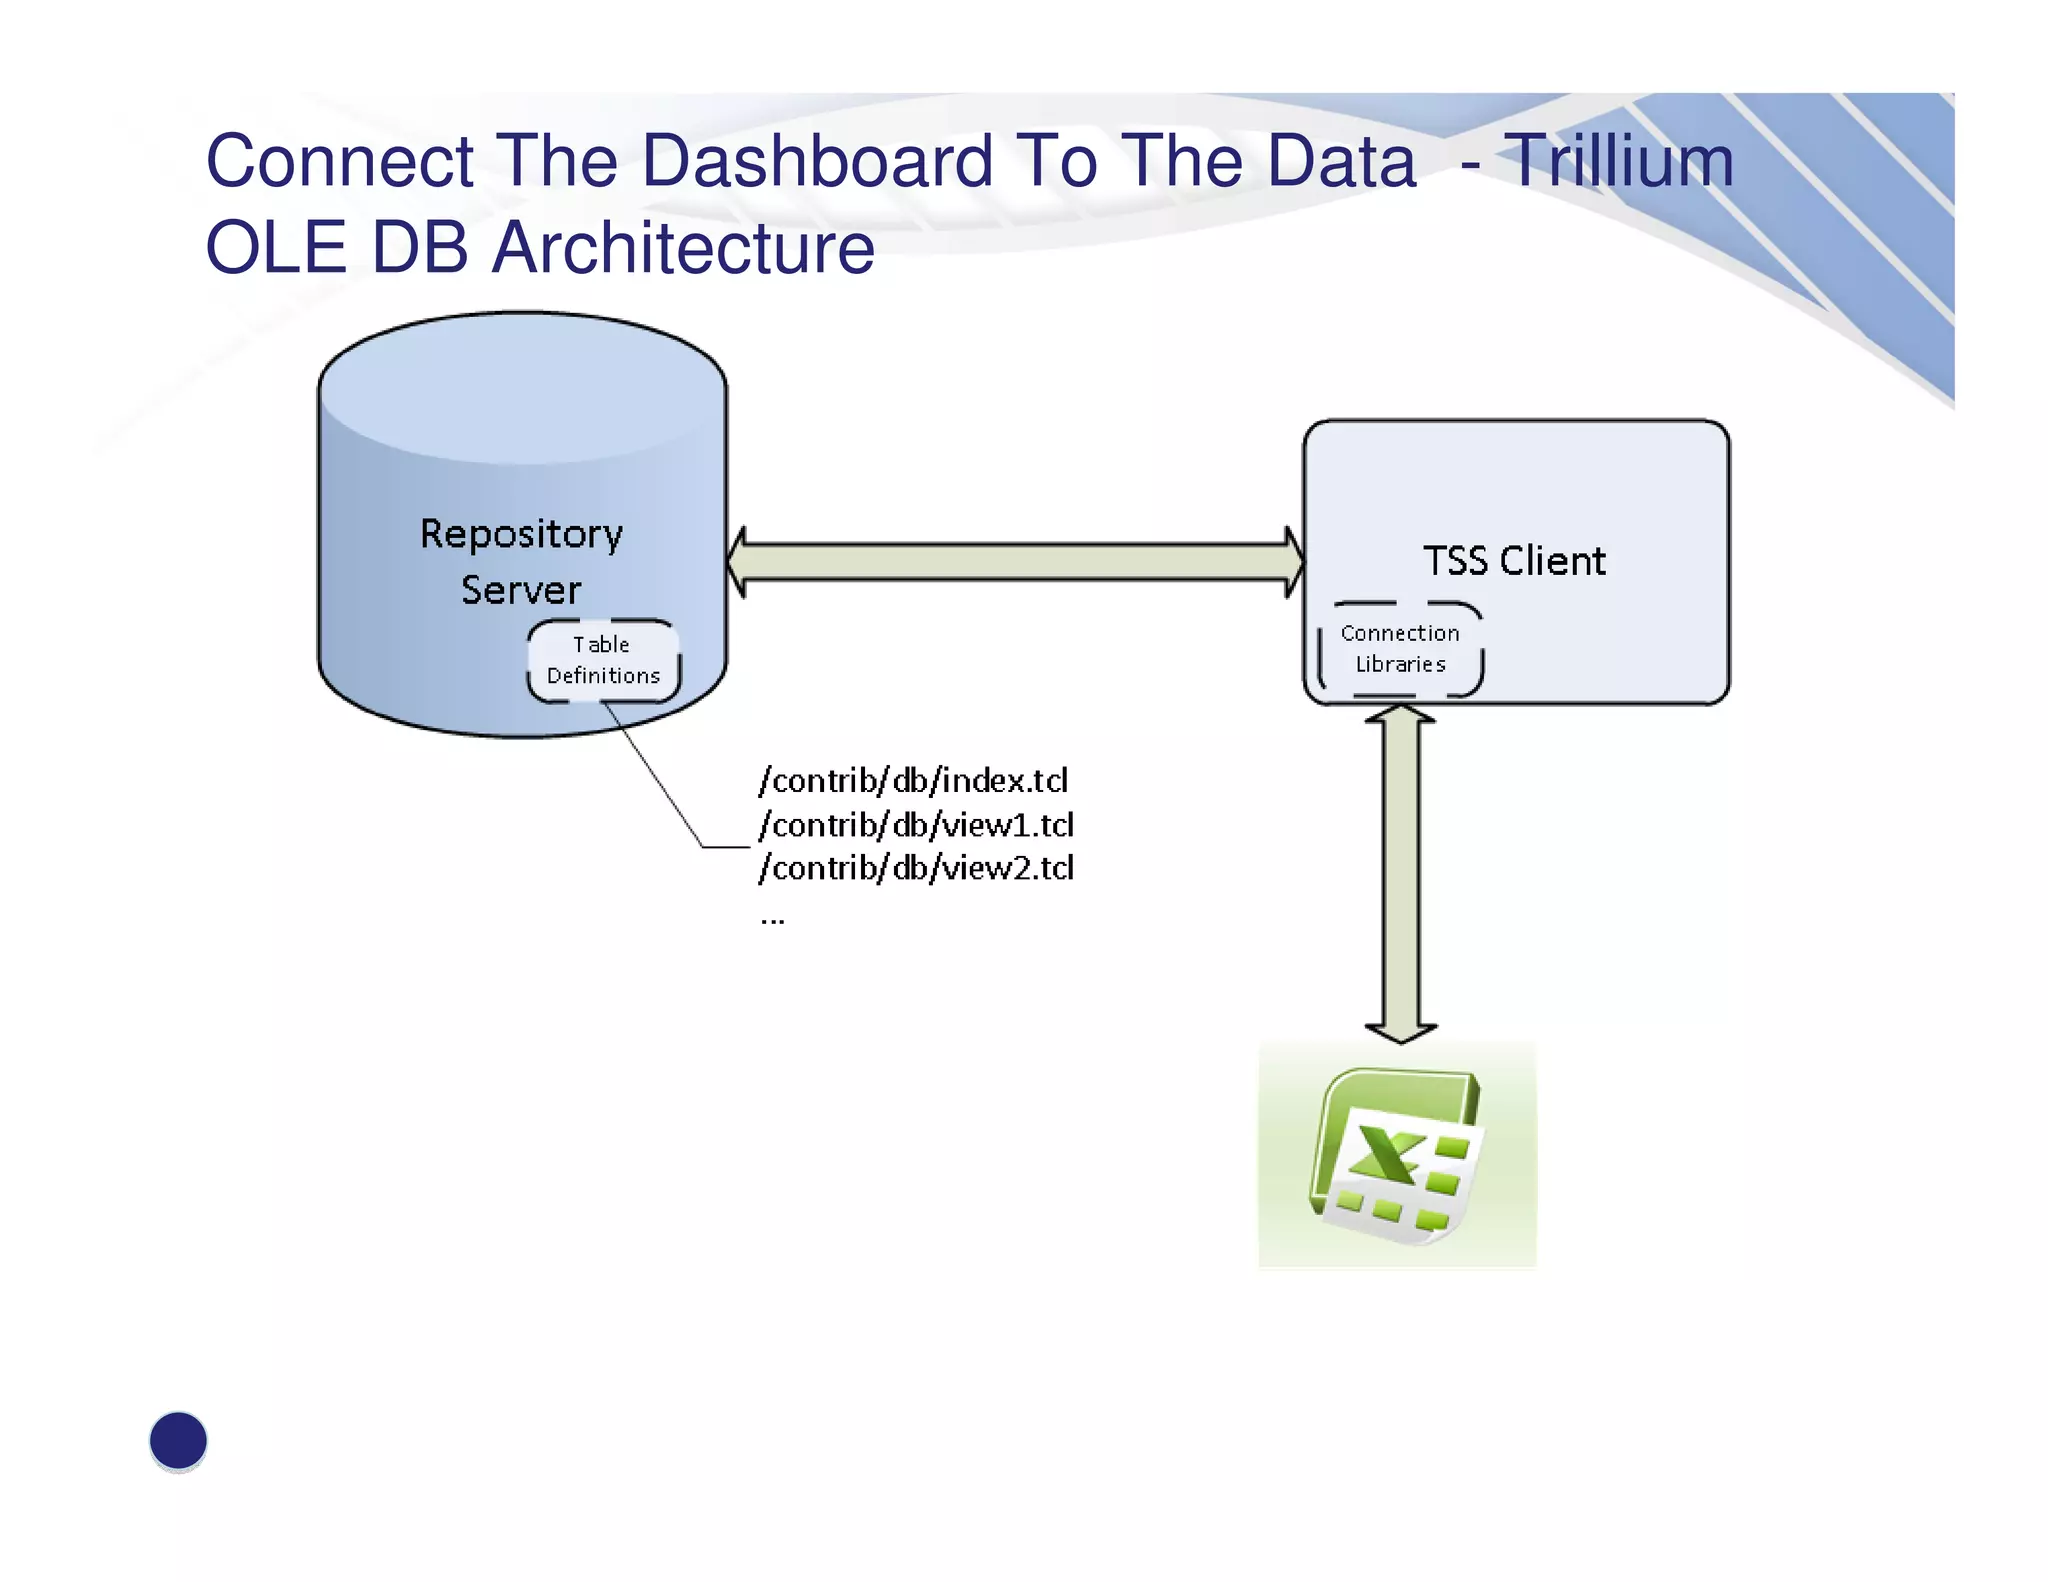
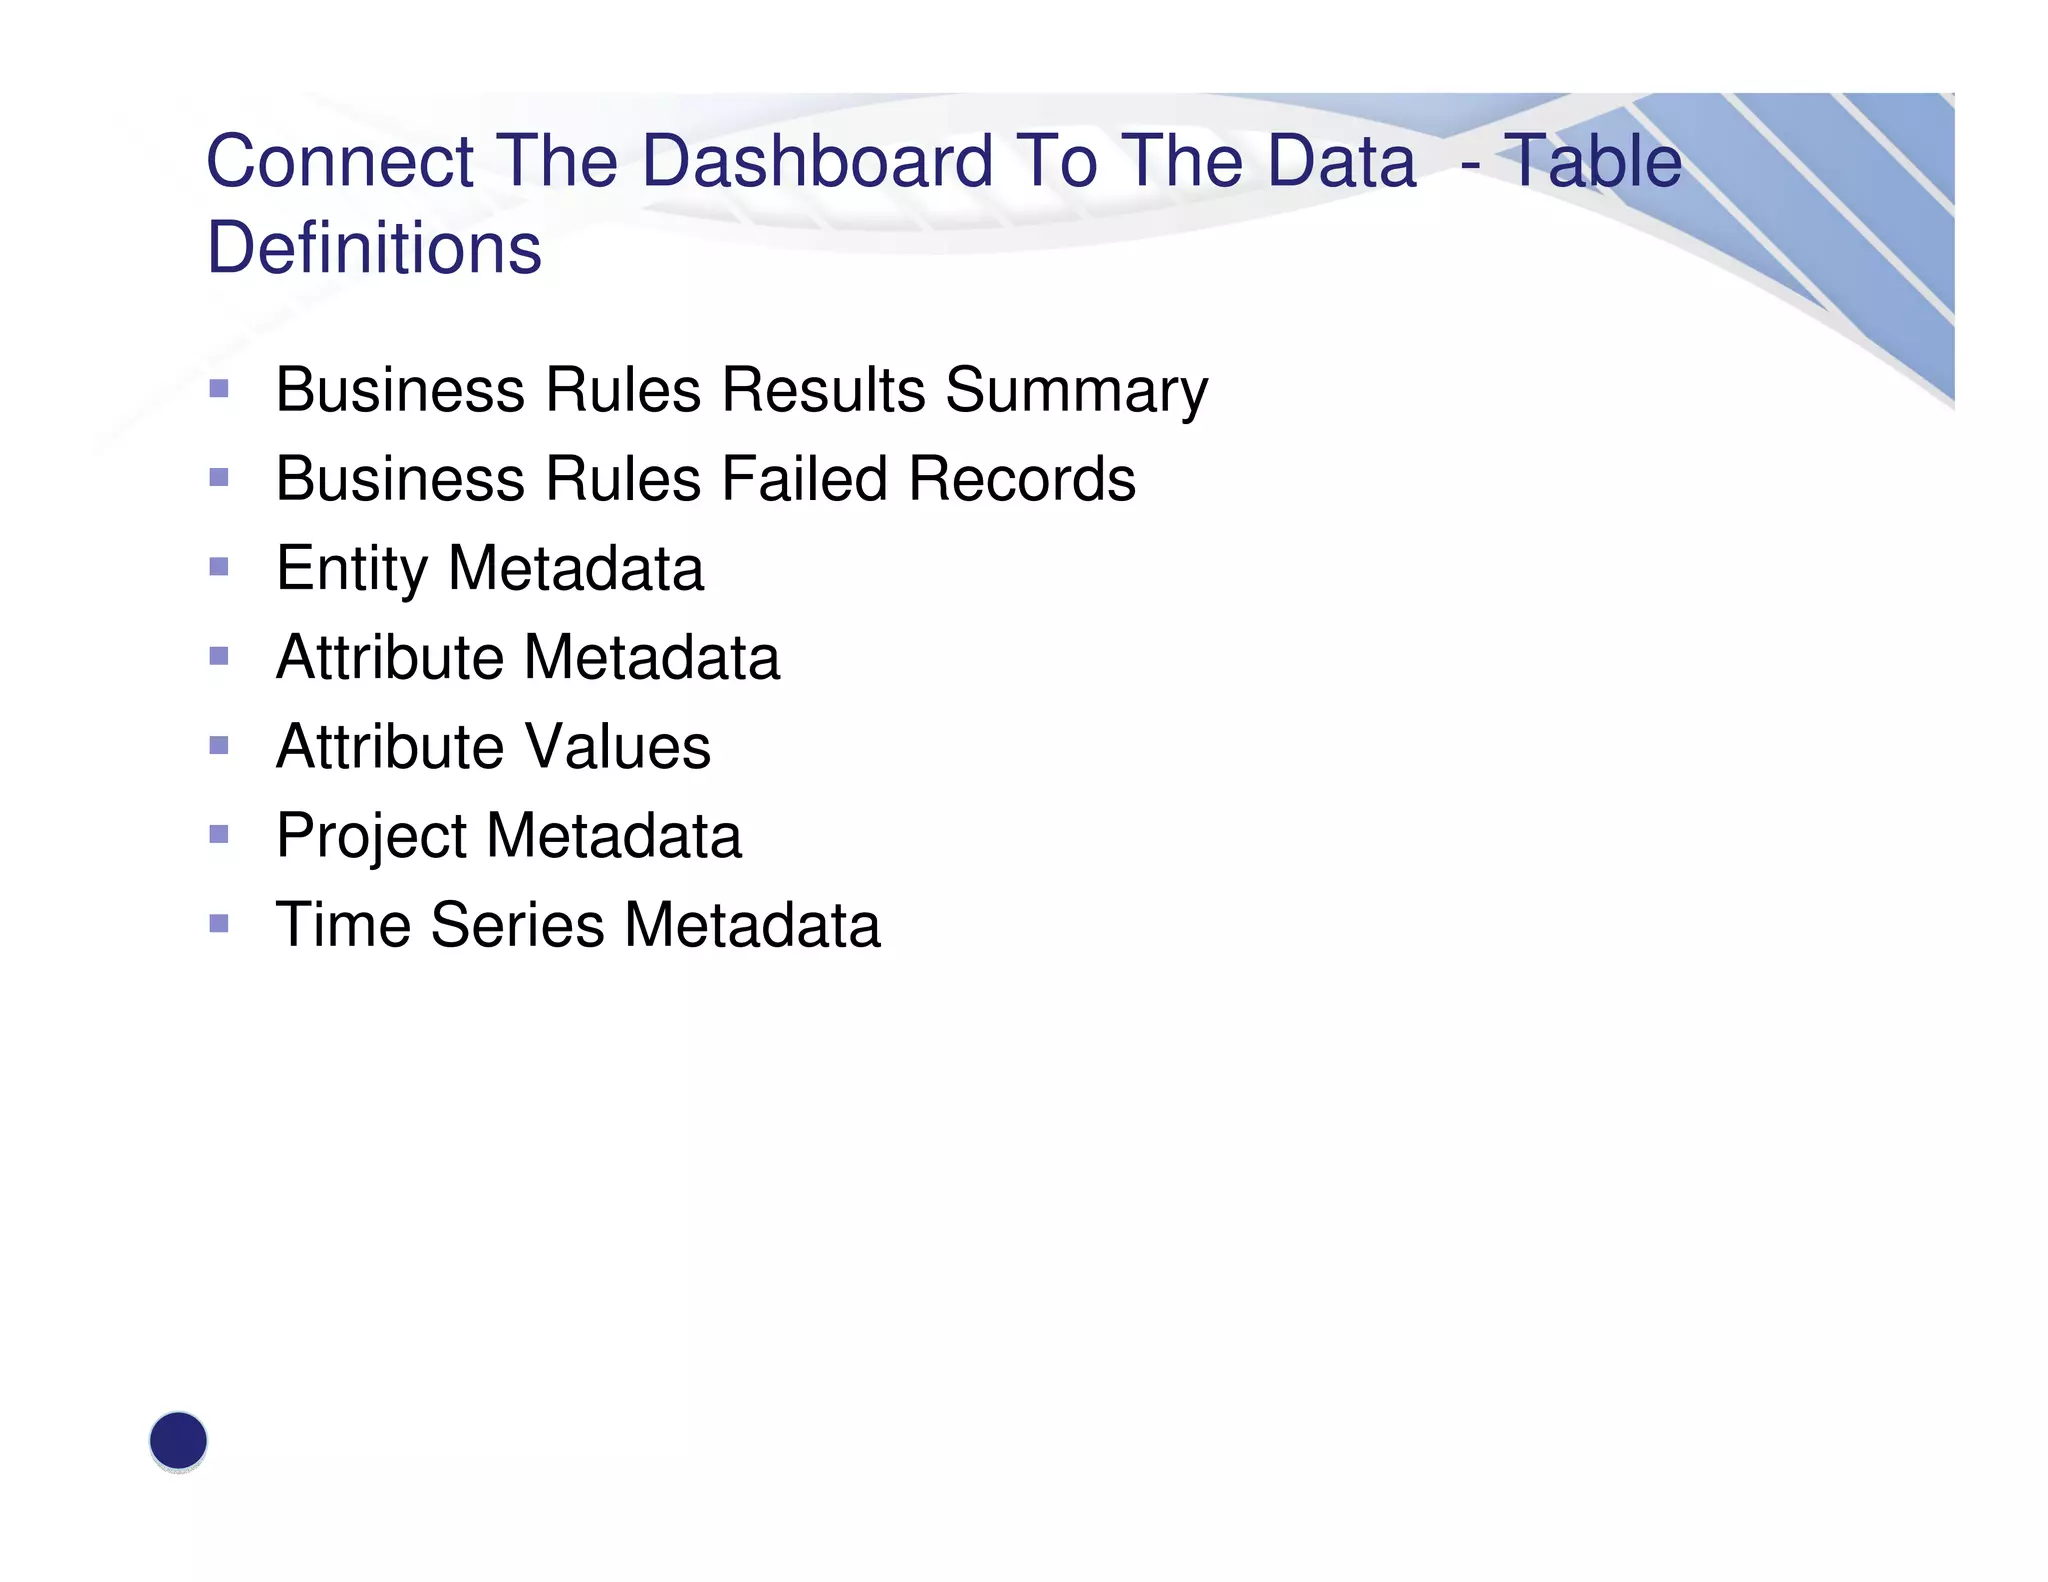
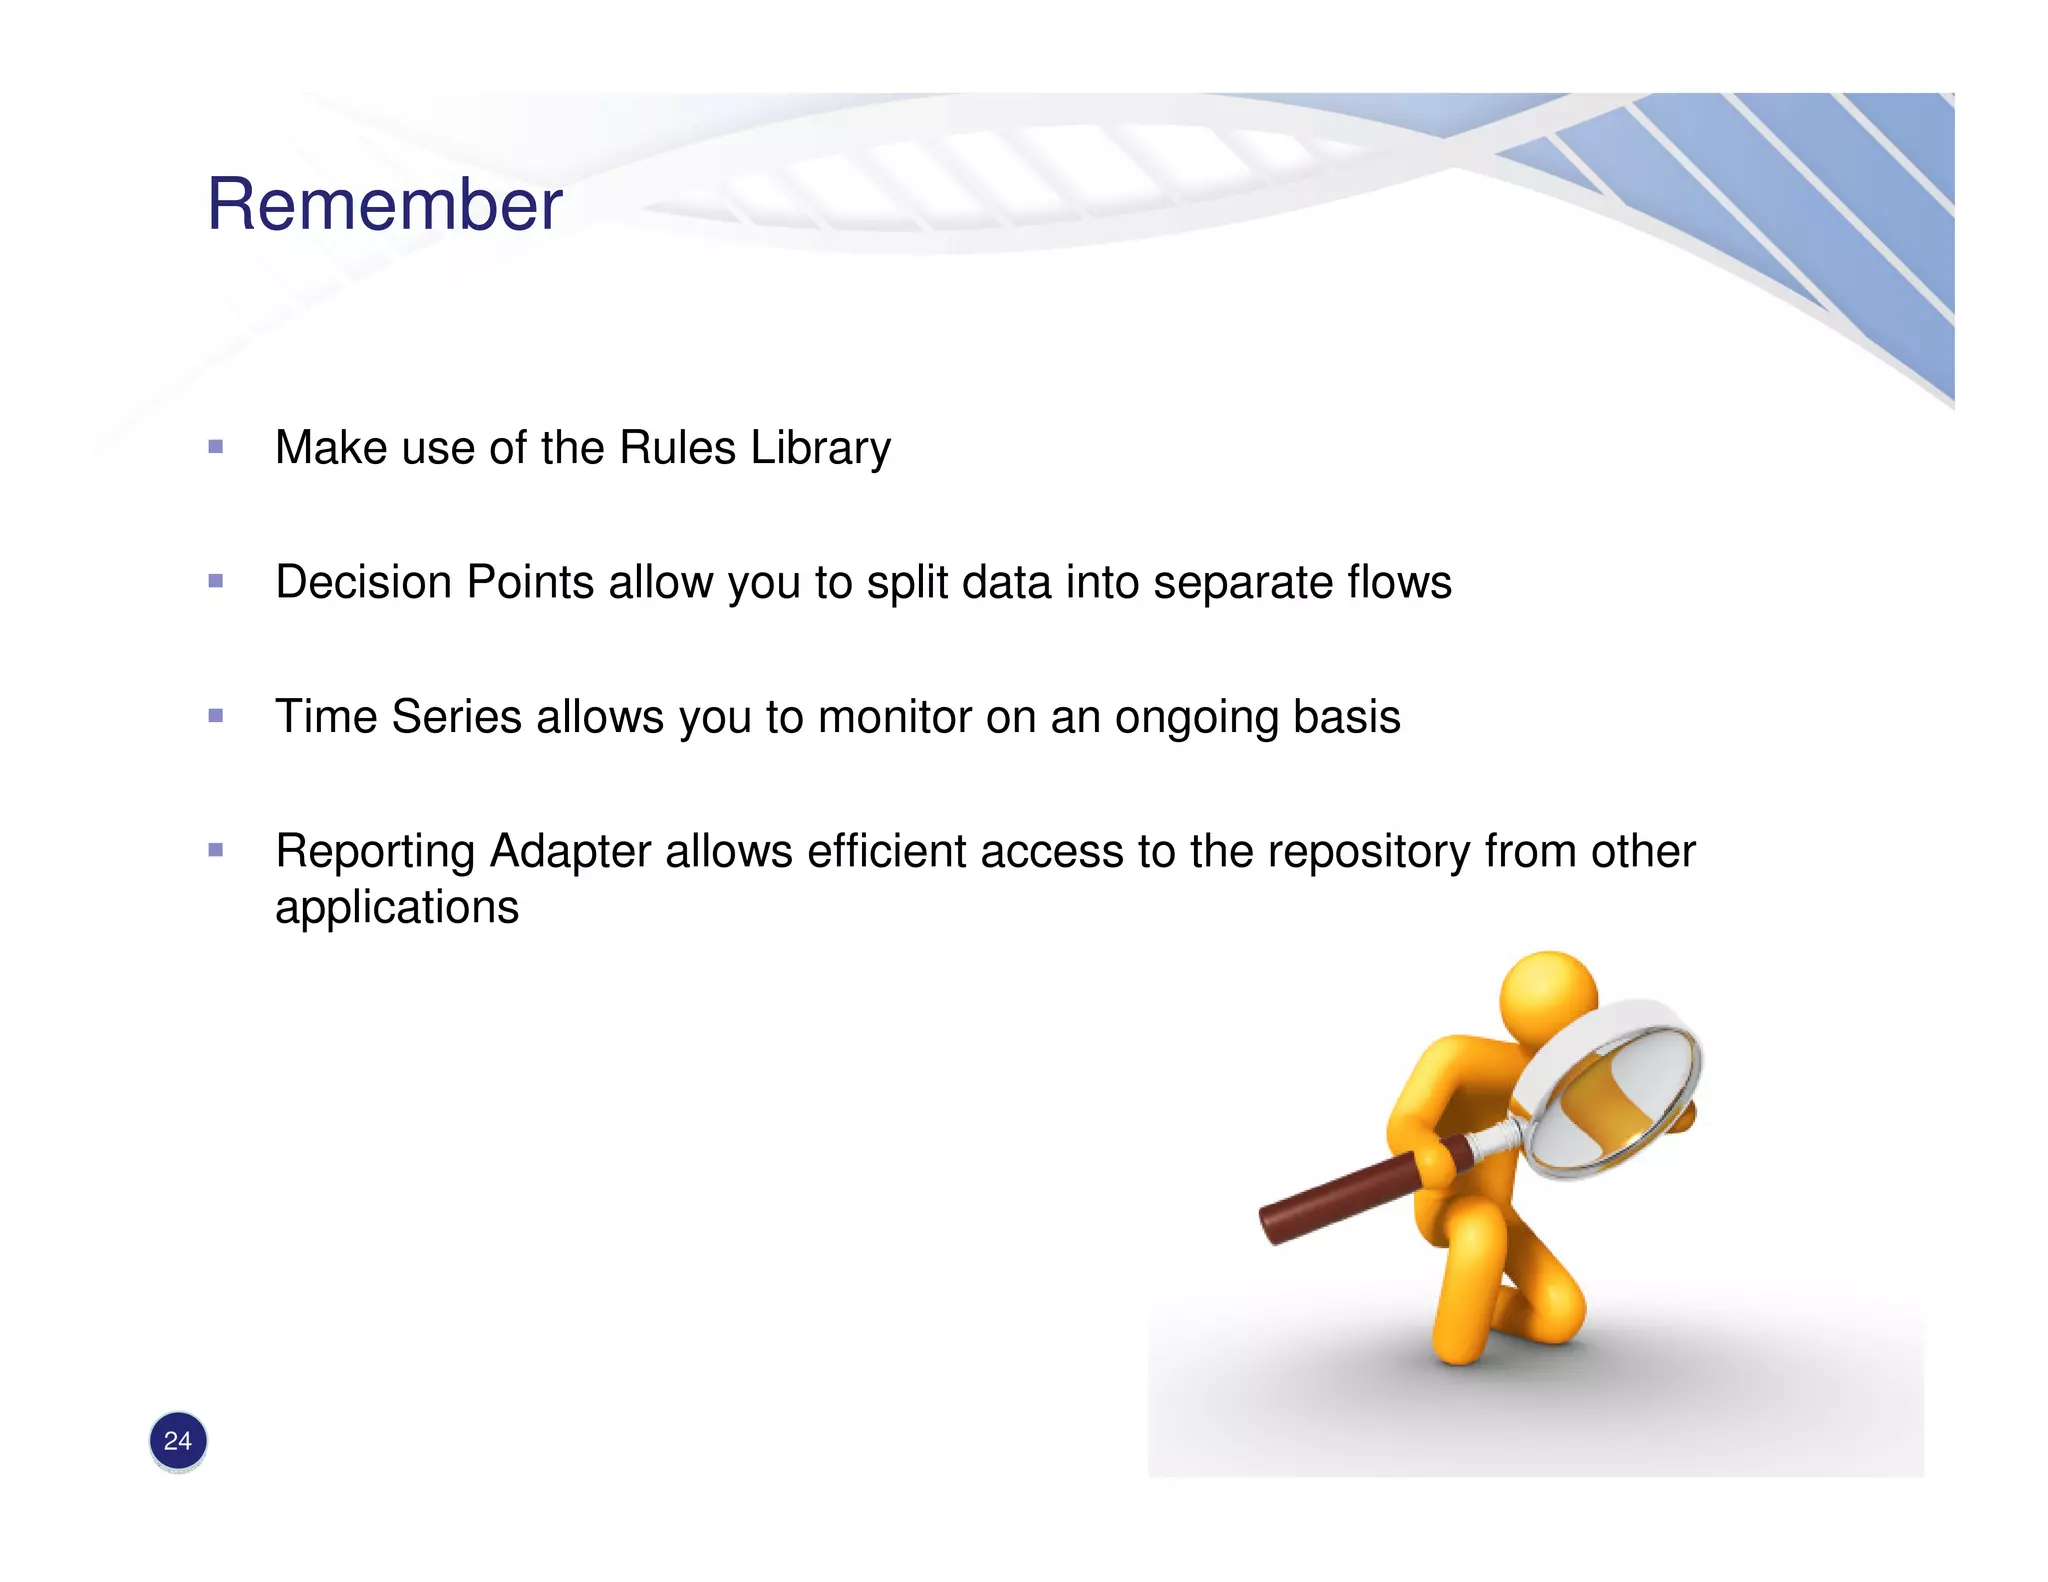


This document discusses how to create a data governance dashboard by connecting it to Trillium Software's data quality platform. It recommends including business rule metadata, the rules library, decision points, and time series analysis in the dashboard. It demonstrates how to use the OLE DB provider to abstract the platform's architecture and define tables to retrieve metrics, rules results, metadata, and more. Connecting the dashboard to the repository in this way allows efficient ongoing monitoring of data quality.


