Downloaded 117 times
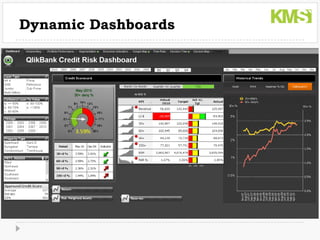
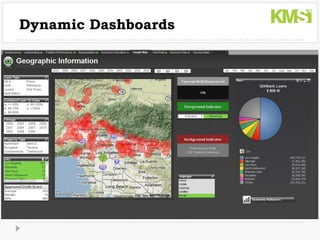
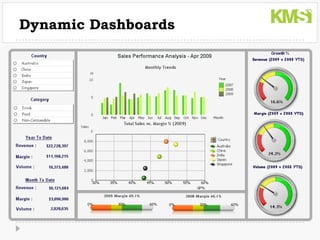
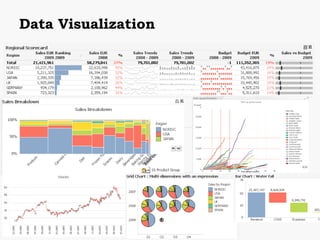
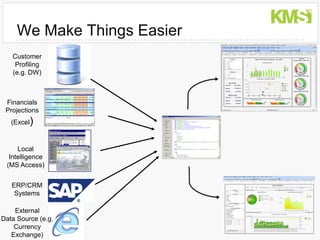

The document outlines a breakfast seminar focused on knowledge management solutions for CFOs, emphasizing the need for effective financial dashboards to improve decision-making and reporting efficiency. It highlights the challenges finance professionals face, such as poor data visualization and the demand for transparency, and presents the KMS financial dashboard as a solution that integrates data and enhances user experience. The session includes presentations from various industry leaders, showcasing the benefits of advanced analytics and real-time financial reporting.


