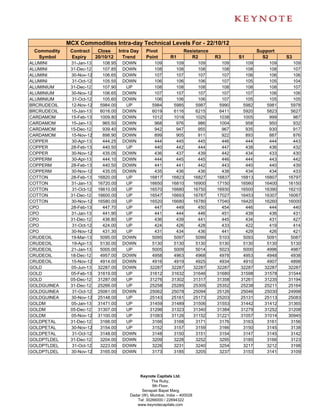
2. MCX Commodities Intra-day Technical Levels For - 22/10/12
Commodity Contract Close Intra Day Pivot Resistance Support
Symbol Expiry 20/10/12 Trend Point R1 R2 R3 S1 S2 S3
KAPAS 30-Mar-13 964.00 UP 959 973 982 1005 950 936 913
KAPAS 30-Apr-13 989.50 UP 983 1000 1011 1039 972 955 927
KAPASKHALI 30-Apr-13 1491.00 DOWN 1491 1492 1493 1495 1490 1489 1487
KAPASKHALI 28-Feb-13 1470.00 UP 1467 1477 1484 1501 1460 1450 1433
KAPASKHALI 30-Mar-13 1486.50 UP 1486 1501 1516 1546 1471 1456 1426
KAPASKHALI 31-Jan-13 1449.00 UP 1447 1456 1463 1479 1440 1431 1415
KAPASKHALI 31-Dec-12 1436.00 UP 1435 1444 1451 1467 1428 1419 1403
LEAD 31-Jan-13 114.05 DOWN 114 114 114 115 114 114 114
LEAD 31-Dec-12 113.65 DOWN 114 114 114 115 113 113 112
LEAD 30-Nov-12 113.45 DOWN 114 114 114 115 113 113 112
LEAD 31-Oct-12 113.25 DOWN 113 114 114 115 113 112 112
LEADMINI 31-Jan-13 113.95 UP 114 114 114 115 114 113 113
LEADMINI 31-Dec-12 113.60 DOWN 114 114 114 115 113 113 112
LEADMINI 30-Nov-12 113.50 DOWN 114 114 114 115 113 113 112
LEADMINI 31-Oct-12 113.25 DOWN 113 114 114 115 113 112 112
MENTHAOIL 31-Jan-13 1198.60 UP 1195 1203 1208 1221 1190 1182 1169
MENTHAOIL 31-Dec-12 1197.70 UP 1195 1204 1210 1225 1189 1180 1165
MENTHAOIL 30-Nov-12 1187.10 UP 1184 1193 1200 1215 1178 1169 1153
MENTHAOIL 31-Oct-12 1173.30 UP 1170 1180 1187 1203 1164 1154 1137
NATURALGAS 26-Dec-12 219.80 DOWN 220 221 222 224 219 218 216
NATURALGAS 27-Nov-12 212.50 DOWN 213 214 215 218 211 210 208
NATURALGAS 26-Oct-12 194.50 DOWN 195 196 197 199 194 193 190
NICKEL 31-Jan-13 937.80 DOWN 938 938 938 938 938 938 938
NICKEL 31-Dec-12 929.50 DOWN 930 930 931 932 929 928 927
NICKEL 30-Nov-12 922.30 UP 922 923 924 926 921 920 919
NICKEL 31-Oct-12 914.00 UP 914 915 916 917 913 912 910
NICKELM 31-Jan-13 937.80 DOWN 938 938 939 939 937 937 936
NICKELM 31-Dec-12 929.70 DOWN 930 931 932 933 929 928 926
NICKELM 30-Nov-12 922.40 UP 922 923 924 926 922 921 919
NICKELM 31-Oct-12 914.10 UP 914 915 916 917 913 912 910
POTATO 15-May-13 733.10 DOWN 734 738 744 753 729 725 715
POTATO 15-Apr-13 706.90 DOWN 707 709 712 717 705 703 698
POTATO 15-Mar-13 734.00 DOWN 736 738 743 749 731 729 722
SILVER 04-May-13 63195.00 DOWN 63198 63217 63238 63278 63177 63158 63118
SILVER 05-Mar-13 61650.00 UP 61630 61691 61731 61832 61590 61529 61428
SILVER 05-Dec-12 59841.00 UP 59819 59899 59958 60097 59760 59680 59541
SILVER1000 31-Dec-12 60350.00 DOWN 60350 60350 60350 60350 60350 60350 60350
SILVER1000 31-Oct-12 59507.00 UP 59438 59727 59946 60454 59219 58930 58422
SILVER1000 30-Nov-12 59843.00 UP 59808 59915 59988 60168 59735 59628 59448
SILVERM 30-Apr-13 63224.00 DOWN 63241 63270 63317 63393 63194 63165 63089
SILVERM 28-Feb-13 61673.00 UP 61658 61717 61762 61866 61613 61554 61450
SILVERM 30-Nov-12 59864.00 UP 59840 59924 59984 60128 59780 59696 59552
SILVERMIC 30-Apr-13 63247.00 UP 63192 63335 63422 63652 63105 62962 62732
SILVERMIC 28-Feb-13 61682.00 UP 61666 61732 61782 61898 61616 61550 61434
SILVERMIC 30-Nov-12 59868.00 UP 59837 59921 59973 60109 59785 59701 59565
ZINC 31-Jan-13 103.95 DOWN 104 104 104 104 104 104 104
Keynote Capitals Ltd.
The Ruby,
9th Floor,
Senapati Bapat Marg,
Dadar (W), Mumbai, India – 400028
Tel: 30266000 / 22694322
www.keynotecapitals.com
3. MCX Commodities Intra-day Technical Levels For - 22/10/12
Commodity Contract Close Intra Day Pivot Resistance Support
Symbol Expiry 20/10/12 Trend Point R1 R2 R3 S1 S2 S3
ZINC 31-Dec-12 102.85 UP 103 103 103 103 103 103 102
ZINC 30-Nov-12 101.55 DOWN 102 102 102 102 101 101 101
ZINC 31-Oct-12 99.95 DOWN 100 100 100 101 100 100 99
ZINCMINI 31-Dec-12 102.70 DOWN 103 103 103 104 103 102 102
ZINCMINI 30-Nov-12 101.55 DOWN 102 102 102 102 101 101 101
ZINCMINI 31-Oct-12 99.95 DOWN 100 100 100 101 100 100 99
Sanjay Bhatia (AVP – Technical Research),
Email Id sanjay@keynotecapitals.net
Pivot Point: Intra- Day Trading Tool. - The key to the use of this tool is the use of Stop Loss
Intra Day Trend: It is valid only till the point where Price trades above Pivot Point. For Eg. “UP” would be valid till Price
remains above Pivot Point. It would become “DOWN” in event Price trades below Pivot Point.
Pivot Point (PP): This is a trigger point for Intra Day Buy / Sell based on the price range of the previous day.
R1: Resistance 1: 1st Resistance level over Pivot Point, R2: Resistance 2: Next Resistance level after R1.
R3: Resistance 3: Next Resistance level after R2.
S1: Support 1: 1st Support level after Pivot Point, S2: Support 2: Next Support level after S1.
S3: Support 3: Next Support level after S2.
Note: As per this tool, the trader should take BUY position just above the Pivot Point and keep the Pivot Point level as stop
loss and the first target would be R1 level (Resistance 1). If R1 is crossed then R2 (Resistance 2) becomes the next target
with the stop loss placed at R1 level. If R2 is crossed then R3 (Resistance 3) becomes the next target with the stop loss
placed at R2 level.
Similarly if price goes below the Pivot Point the trader should take a SELL position and keep the Pivot Point level as the
stop loss and the first target would be S1 level (Support 1). If S1 level is breached then S2 level (Support 2) becomes the
next target with the stop loss placed at S1 level. If S2 level is breached then S3 level (Support 3) becomes the next target
with the stop loss placed at S2 level.
Disclaimer: This document is not for public distribution and has been furnished to you solely for your information and must not be reproduced or
redistributed to any other person. Persons into whose possession this document may come are required to observe these restrictions. This material is
for the personal information of the authorized recipient, and we are not soliciting any action based upon it. This report is not to be construed as an offer
to sell or the solicitation of an offer to buy any security in any jurisdiction where such an offer or solicitation would be illegal. It is for the general
information of clients of Keynote Capitals Ltd. It does not constitute a personal recommendation or take into account the particular investment
objectives, financial situations, or needs of individual clients. We have reviewed the report, and in so far as it includes current or historical information,
it is believed to be reliable though its accuracy or completeness cannot be guaranteed. Neither Keynote Capitals Ltd., nor any person connected with
it, accepts any liability arising from the use of this document. The recipients of this material should rely on their own investigations and take their own
professional advice. Price and value of the investments referred to in this material may go up or down. Past performance is not a guide for future
performance. Certain transactions -including those involving futures, options and other derivatives as well as non-investment grade securities - involve
substantial risk and are not suitable for all investors. Reports based on technical analysis centers on studying charts of a stock’s price movement and
trading volume, as opposed to focusing on a company’s fundamentals and as such, may not match with a report on a company’s fundamentals.
Opinions expressed are our current opinions as of the date appearing on this material only. While we endeavor to update on a reasonable basis the
information discussed in this material, there may be regulatory, compliance, or other reasons that prevent us from doing so. Prospective investors and
others are cautioned that any forward-looking statements are not predictions and may be subject to change without notice. Our proprietary trading and
investment businesses may make investment decisions that are inconsistent with the recommendations expressed herein. We and our affiliates,
officers, directors, and employees world wide may: (a) from time to time, have long or short positions in, and buy or sell the securities thereof, of
company (ies) mentioned herein or (b) be engaged in any other transaction involving such securities and earn brokerage or other compensation or act
as a market maker in the financial instruments of the company (ies) discussed herein or act as advisor or lender / borrower to such company (ies) or
have other potential conflict of interest with respect to any recommendation and related information and opinions. The analyst for this report certifies
that all of the views expressed in this report accurately reflect his or her personal views about the subject company or companies and its or their
securities, and no part of his or her compensation was, is or will be, directly or indirectly related to specific recommendations or views expressed in this
report. No part of this material may be duplicated in any form and/or redistributed without Keynote Capitals Ltd’s., prior written consent.
Keynote Capitals Ltd.
The Ruby,
9th Floor,
Senapati Bapat Marg,
Dadar (W), Mumbai, India – 400028
Tel: 30266000 / 22694322
www.keynotecapitals.com