Download as PDF, PPTX
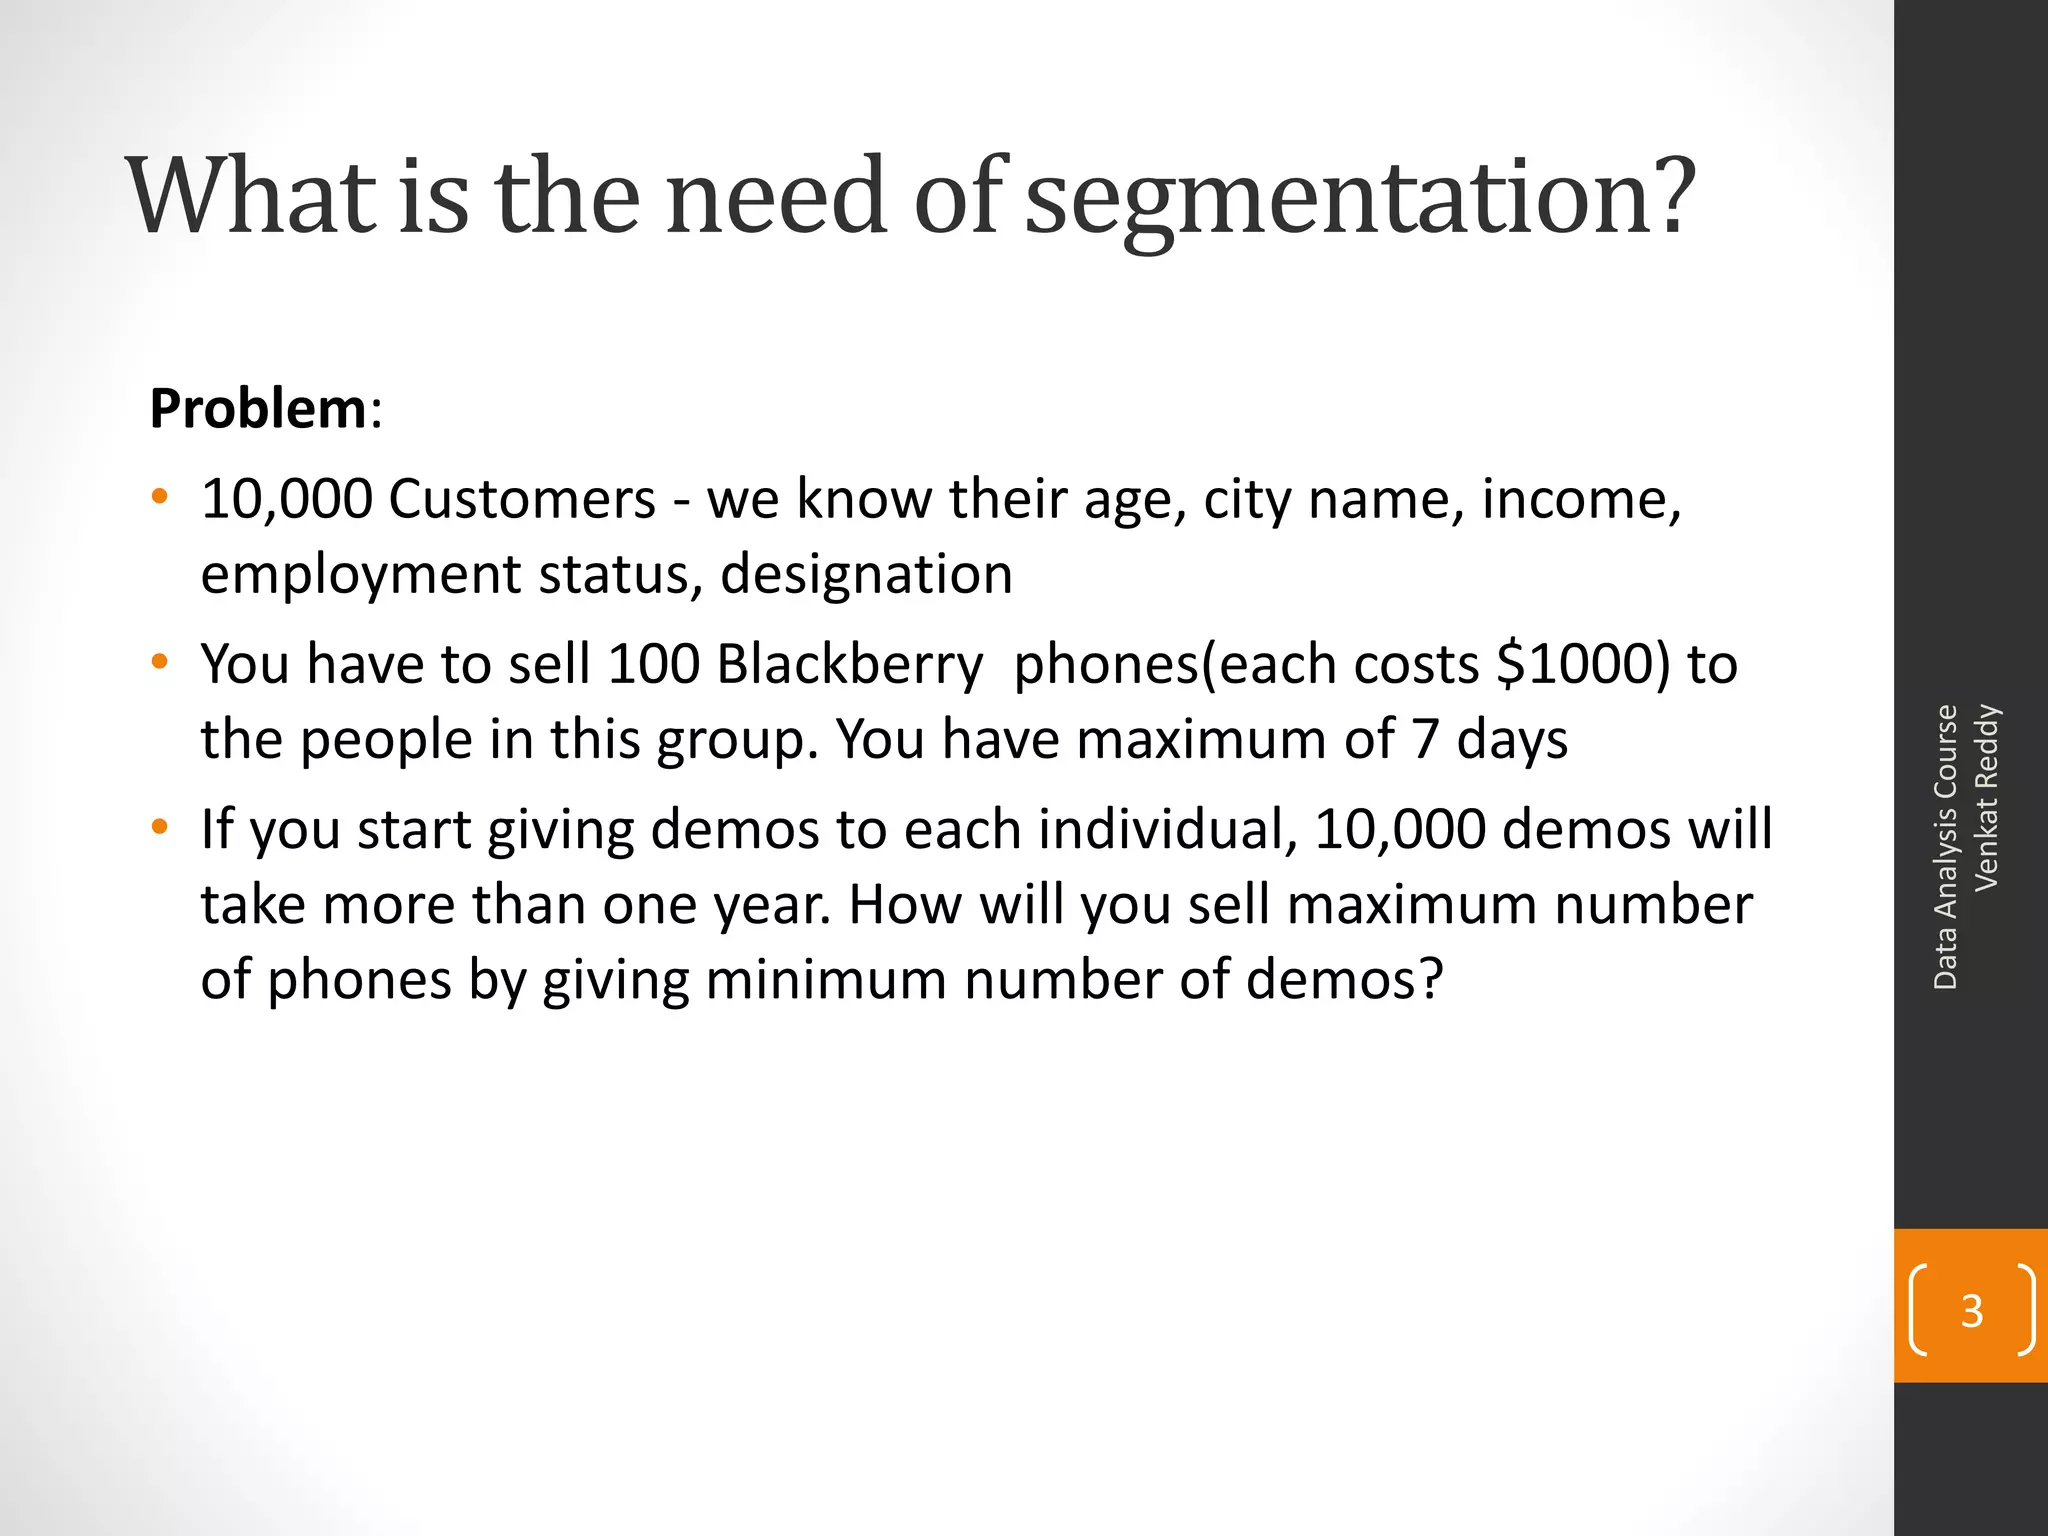
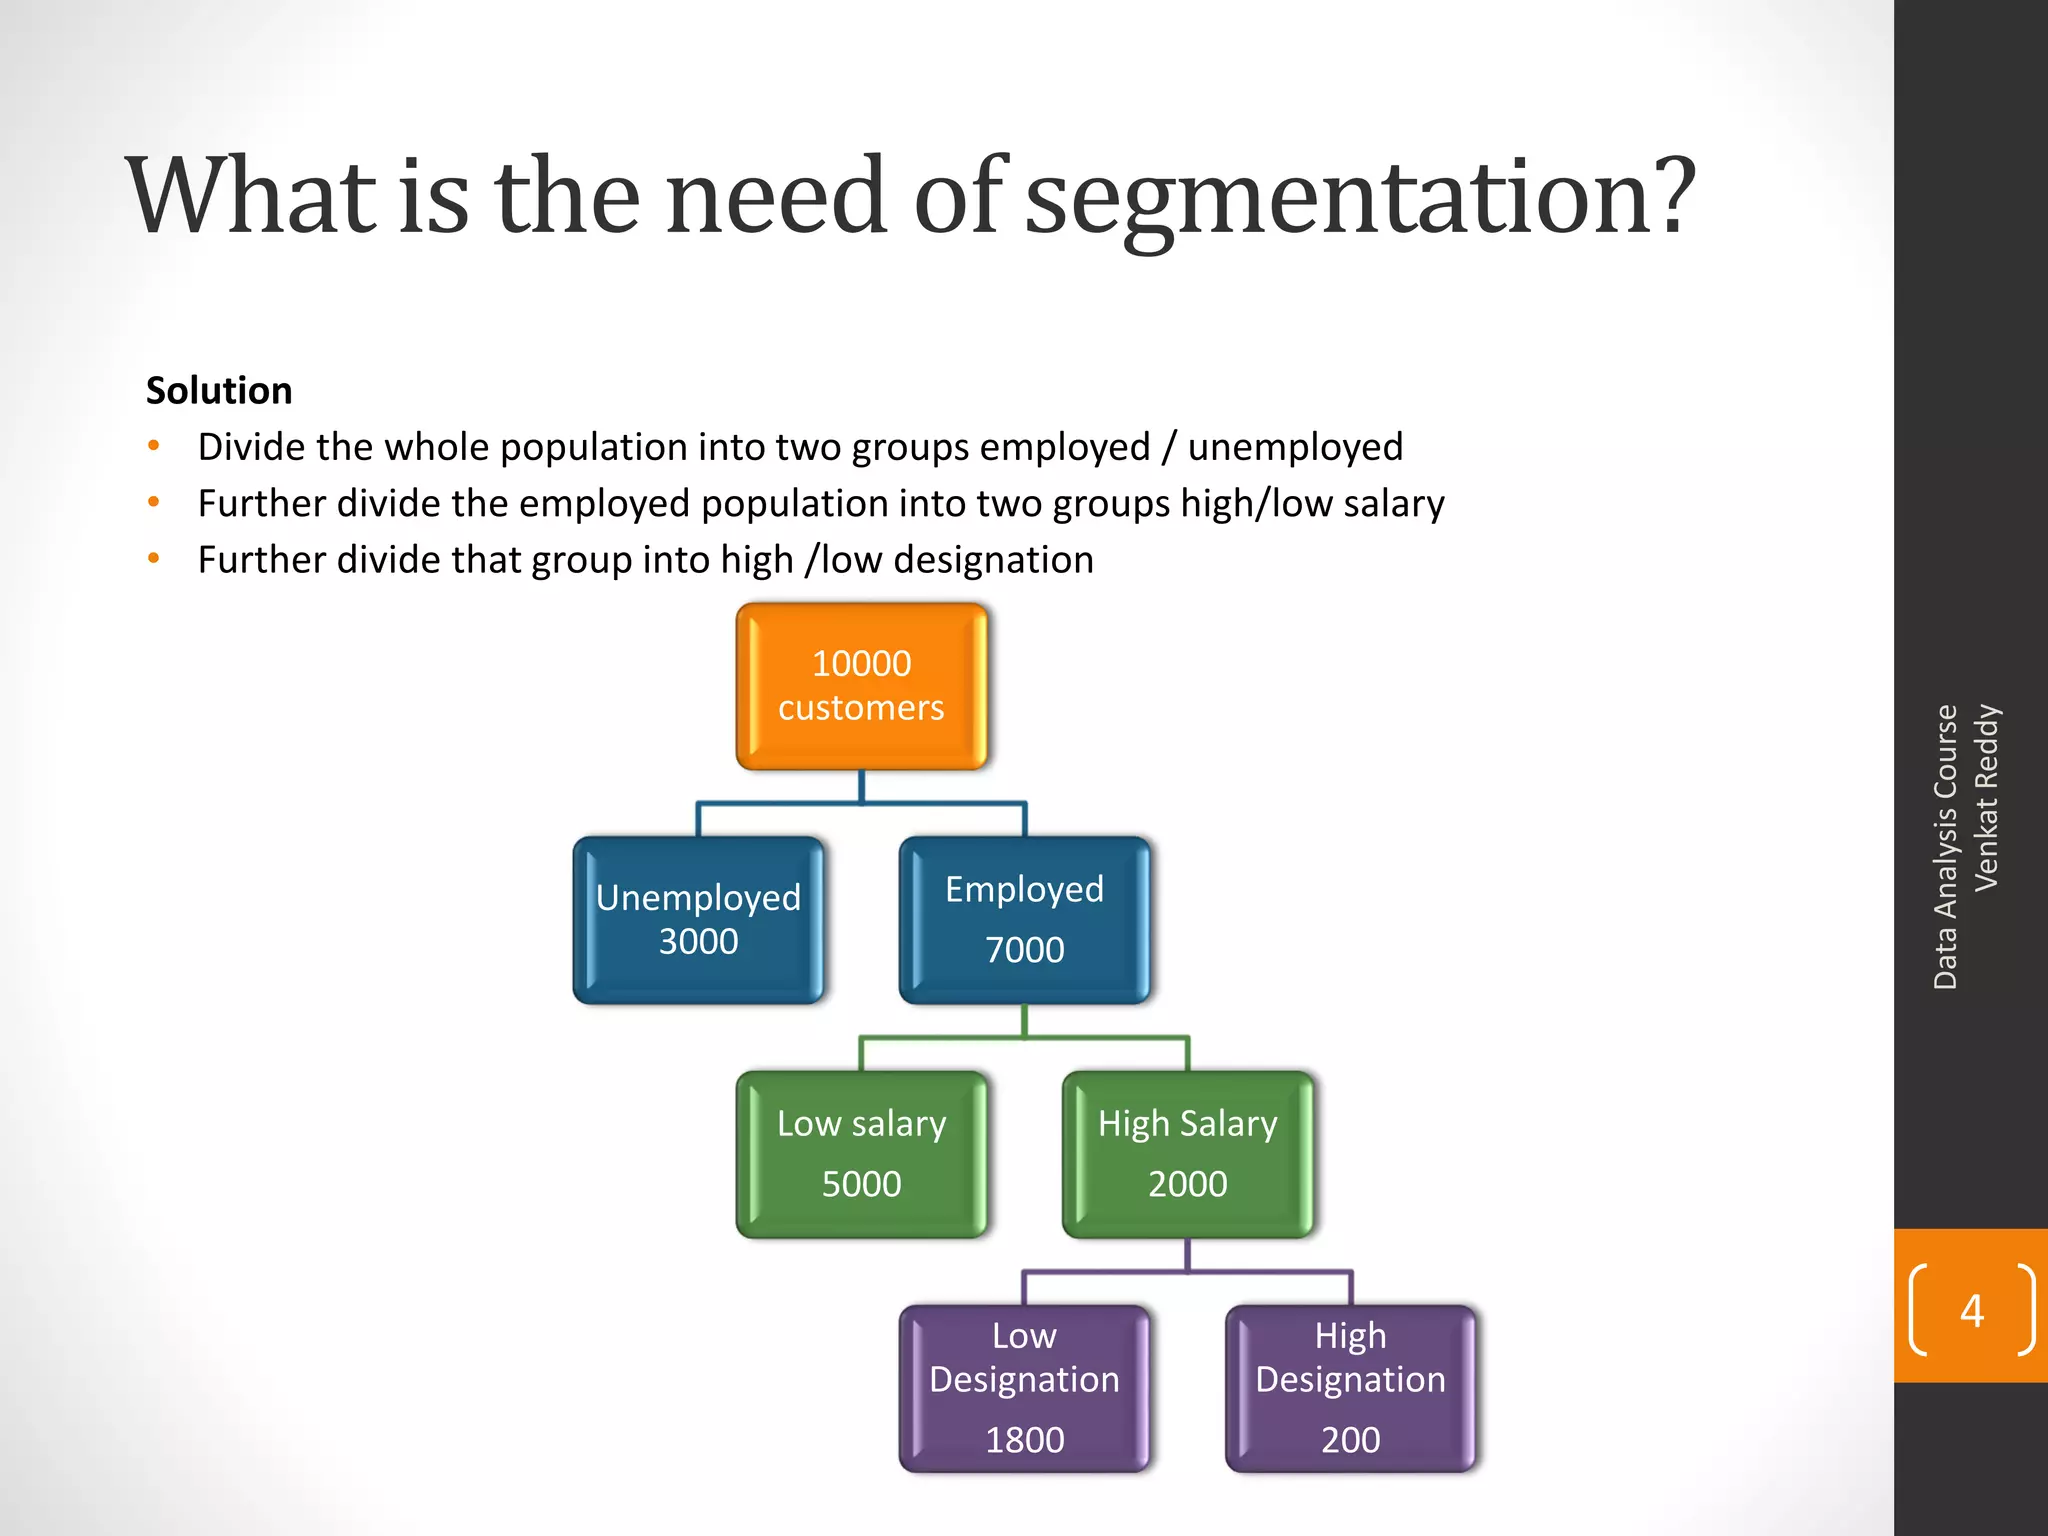
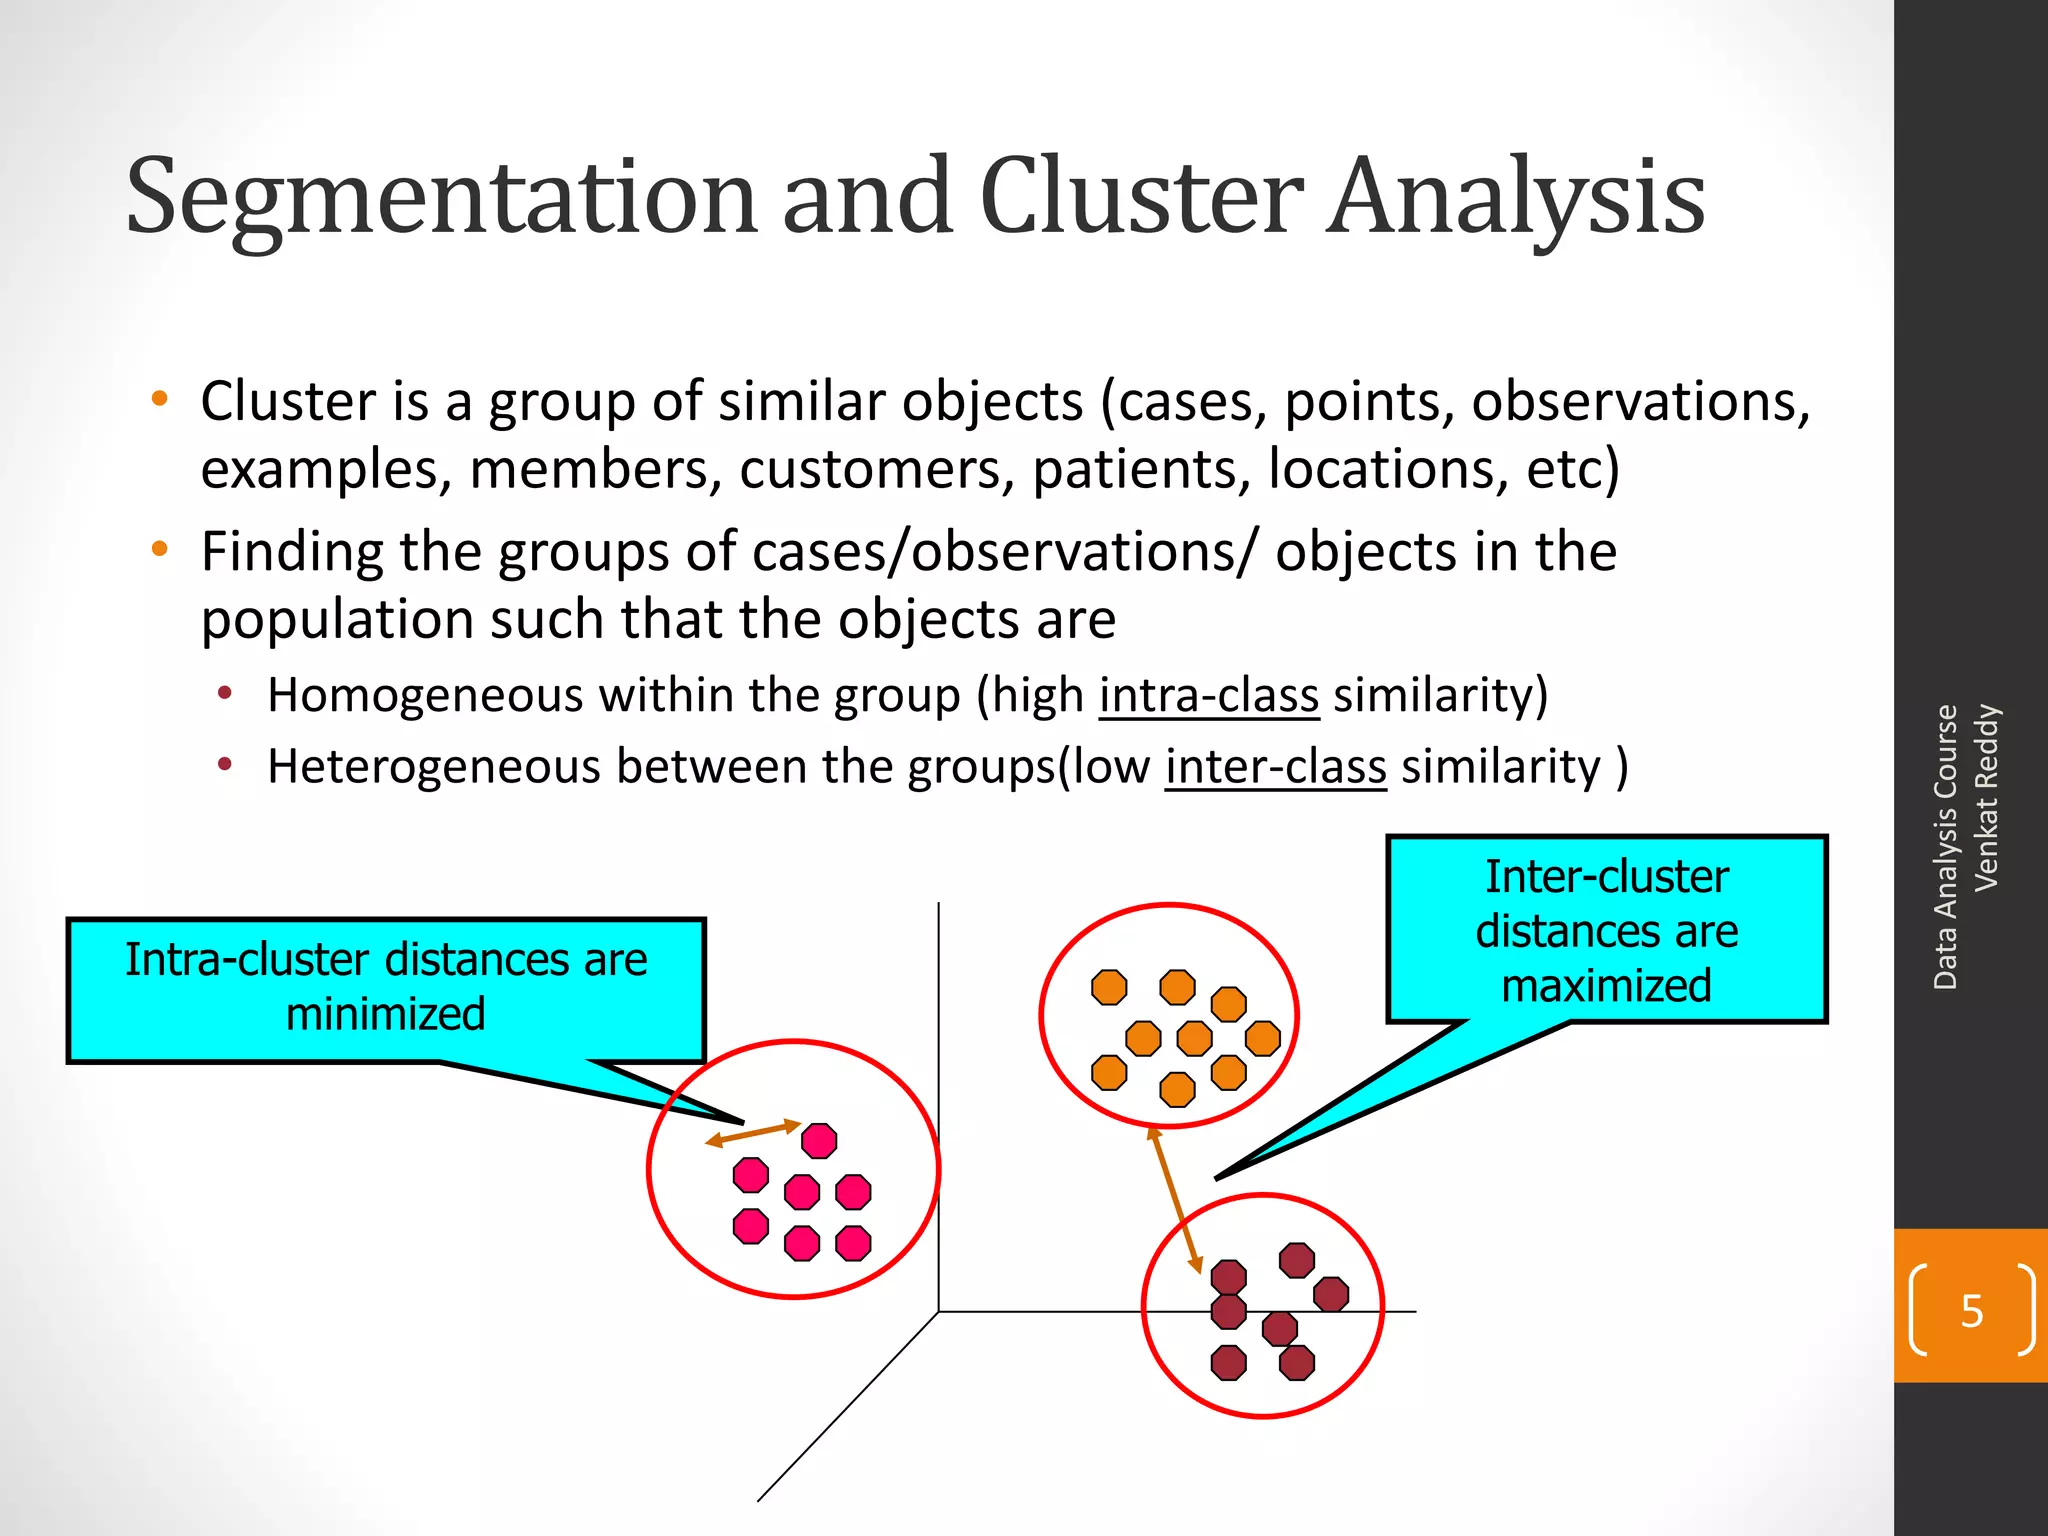
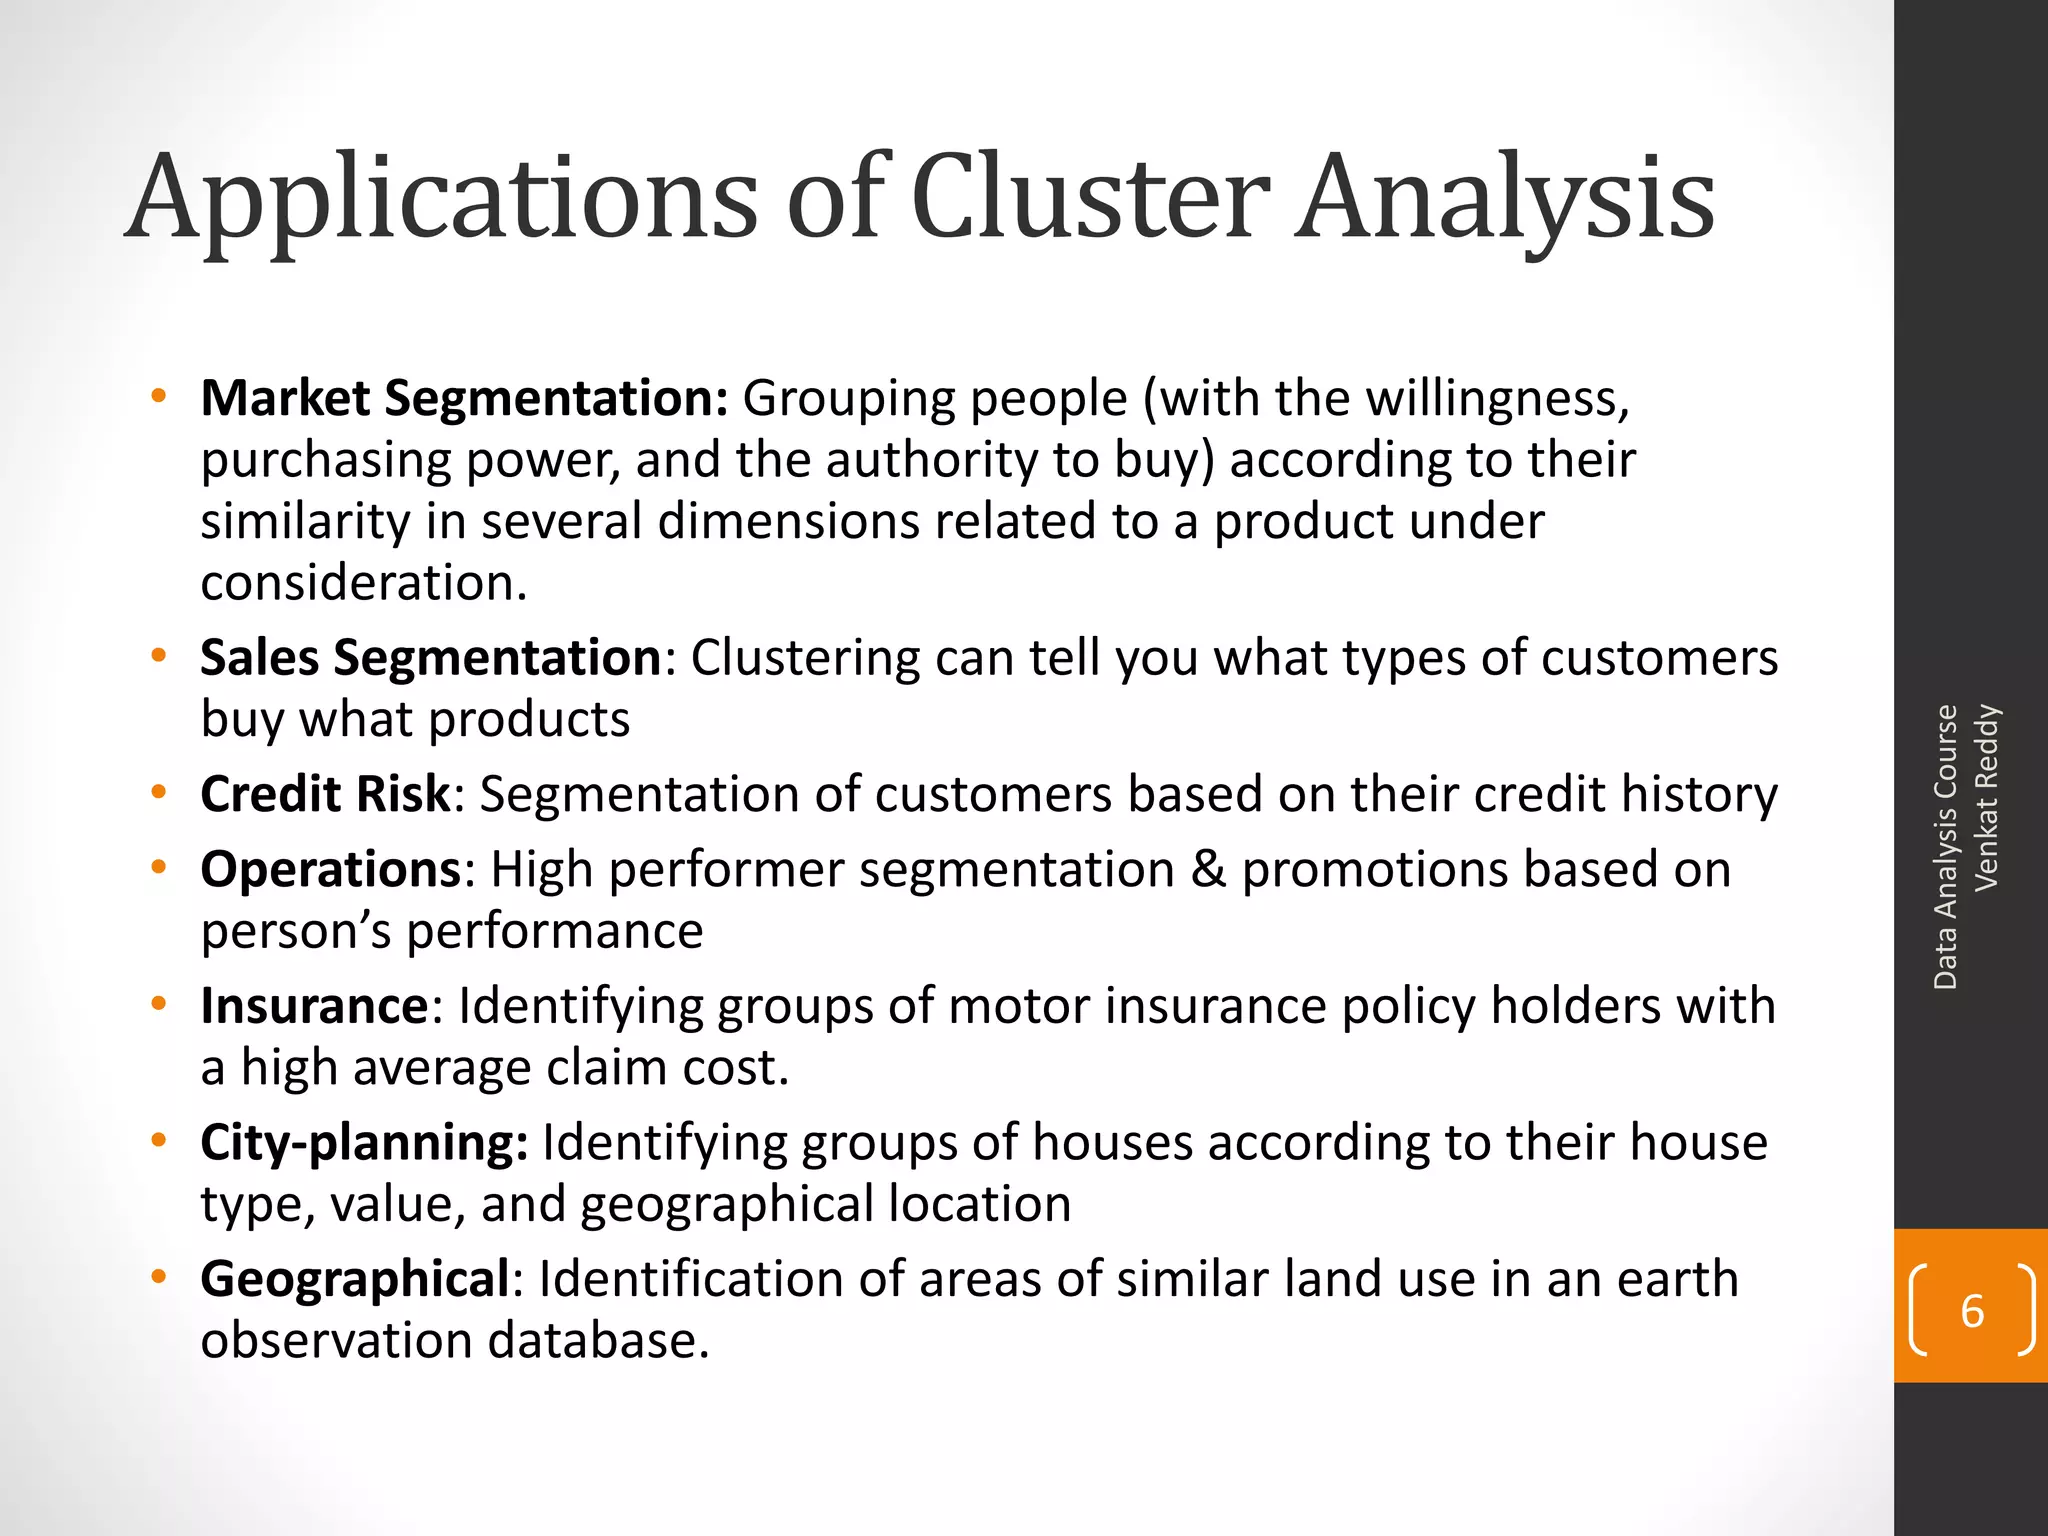
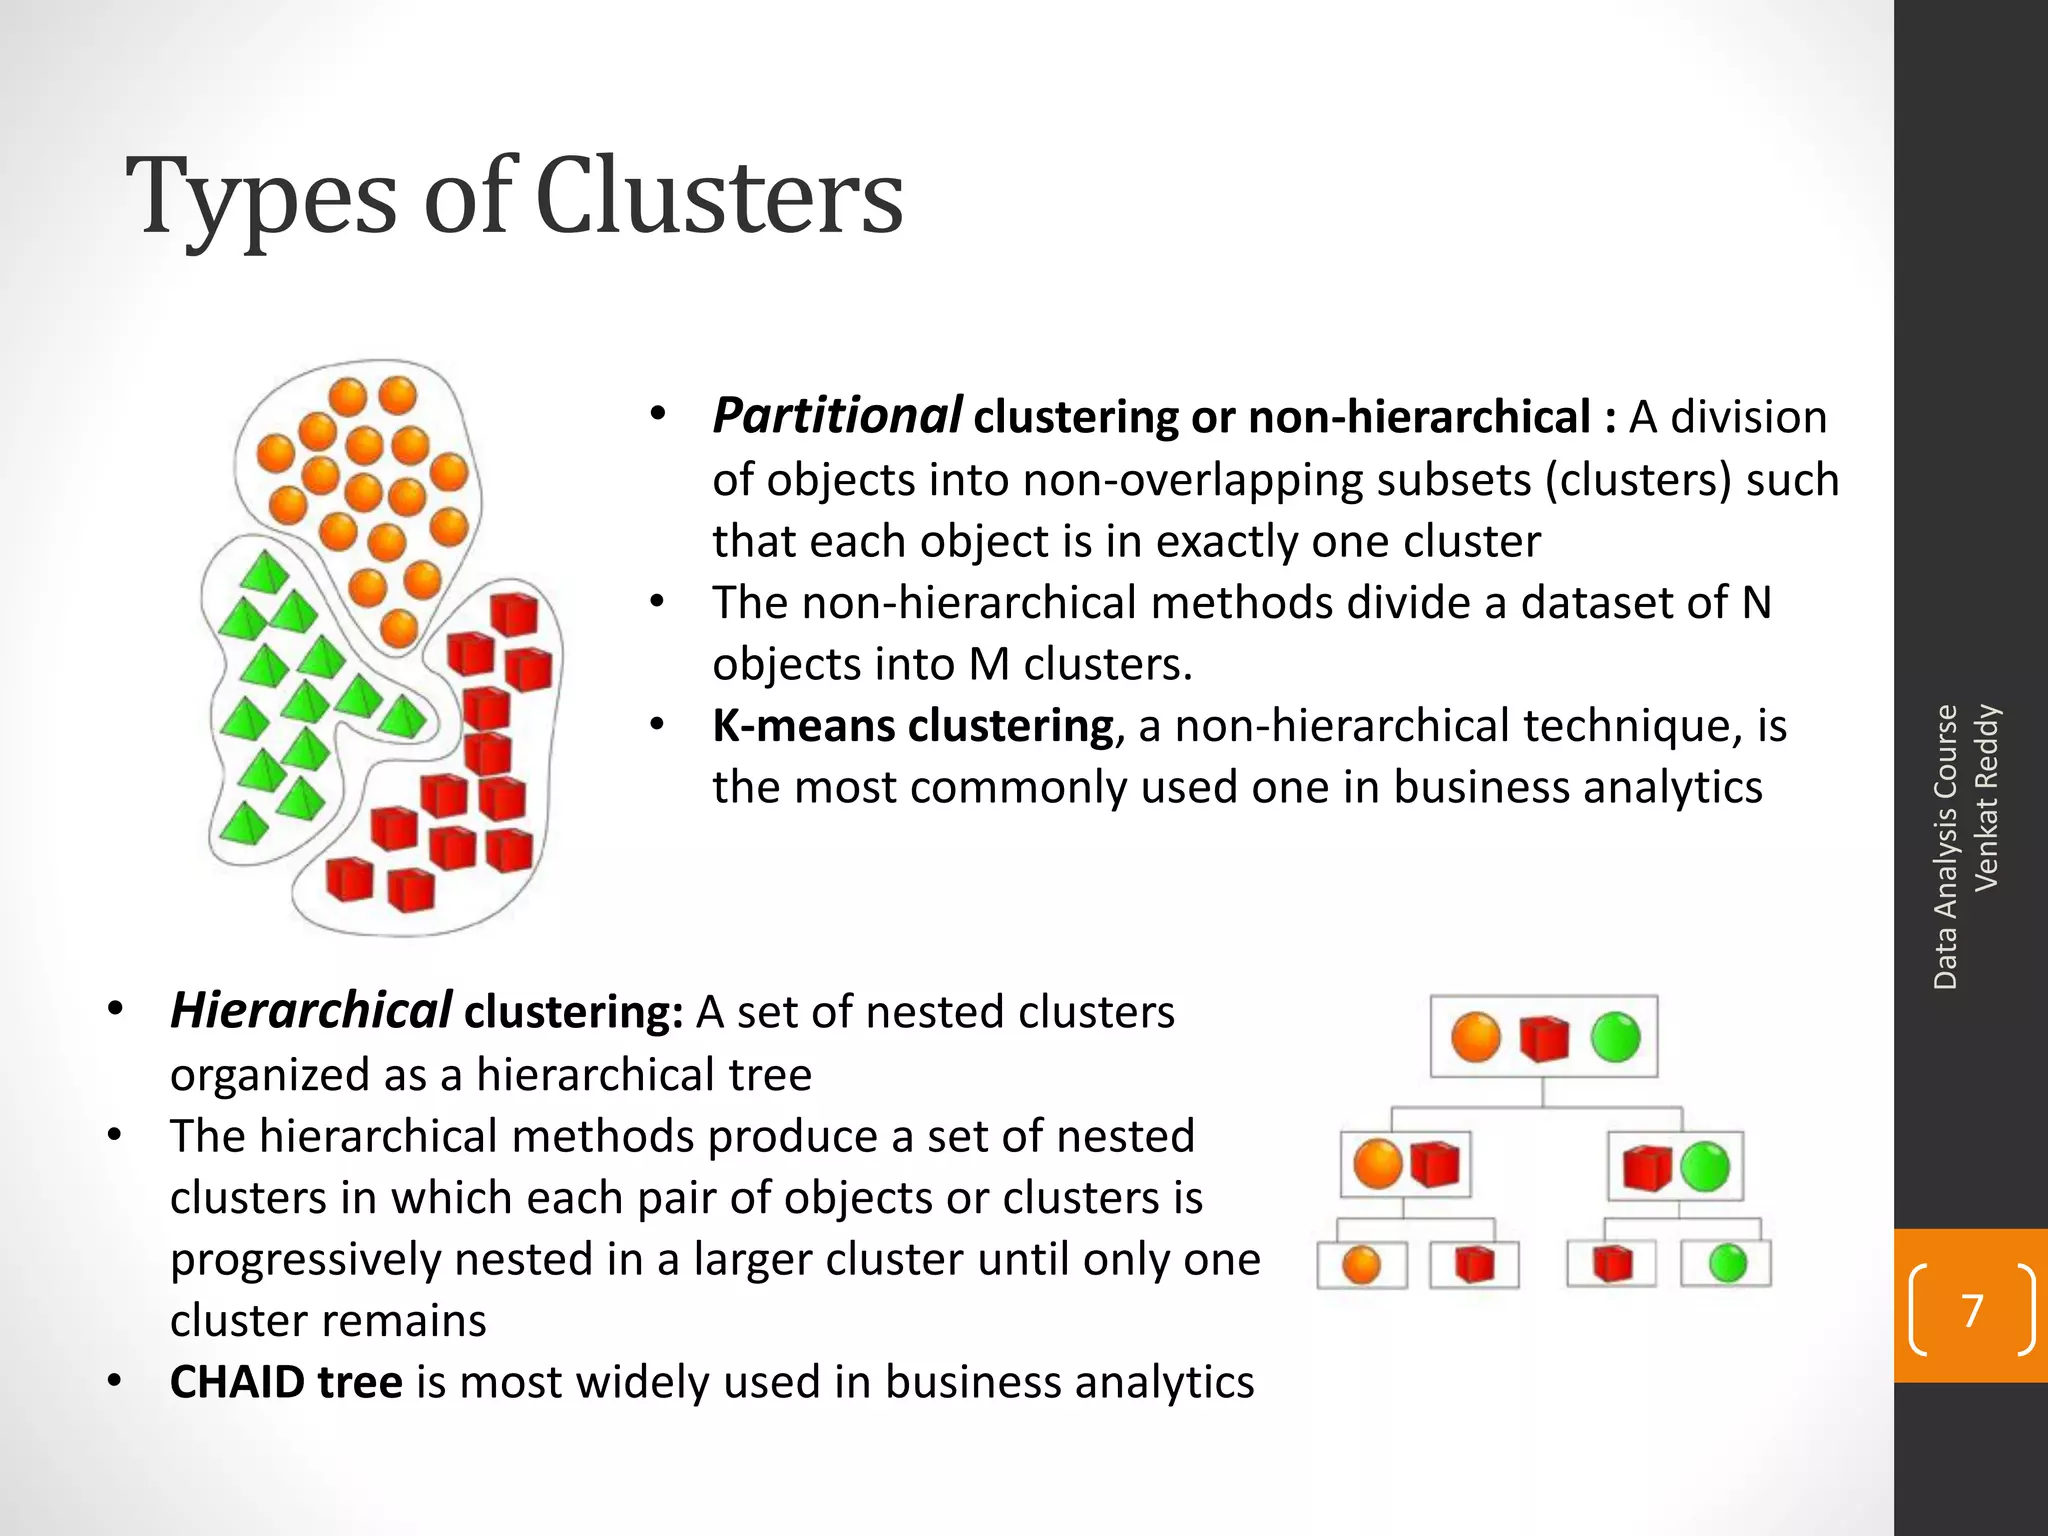
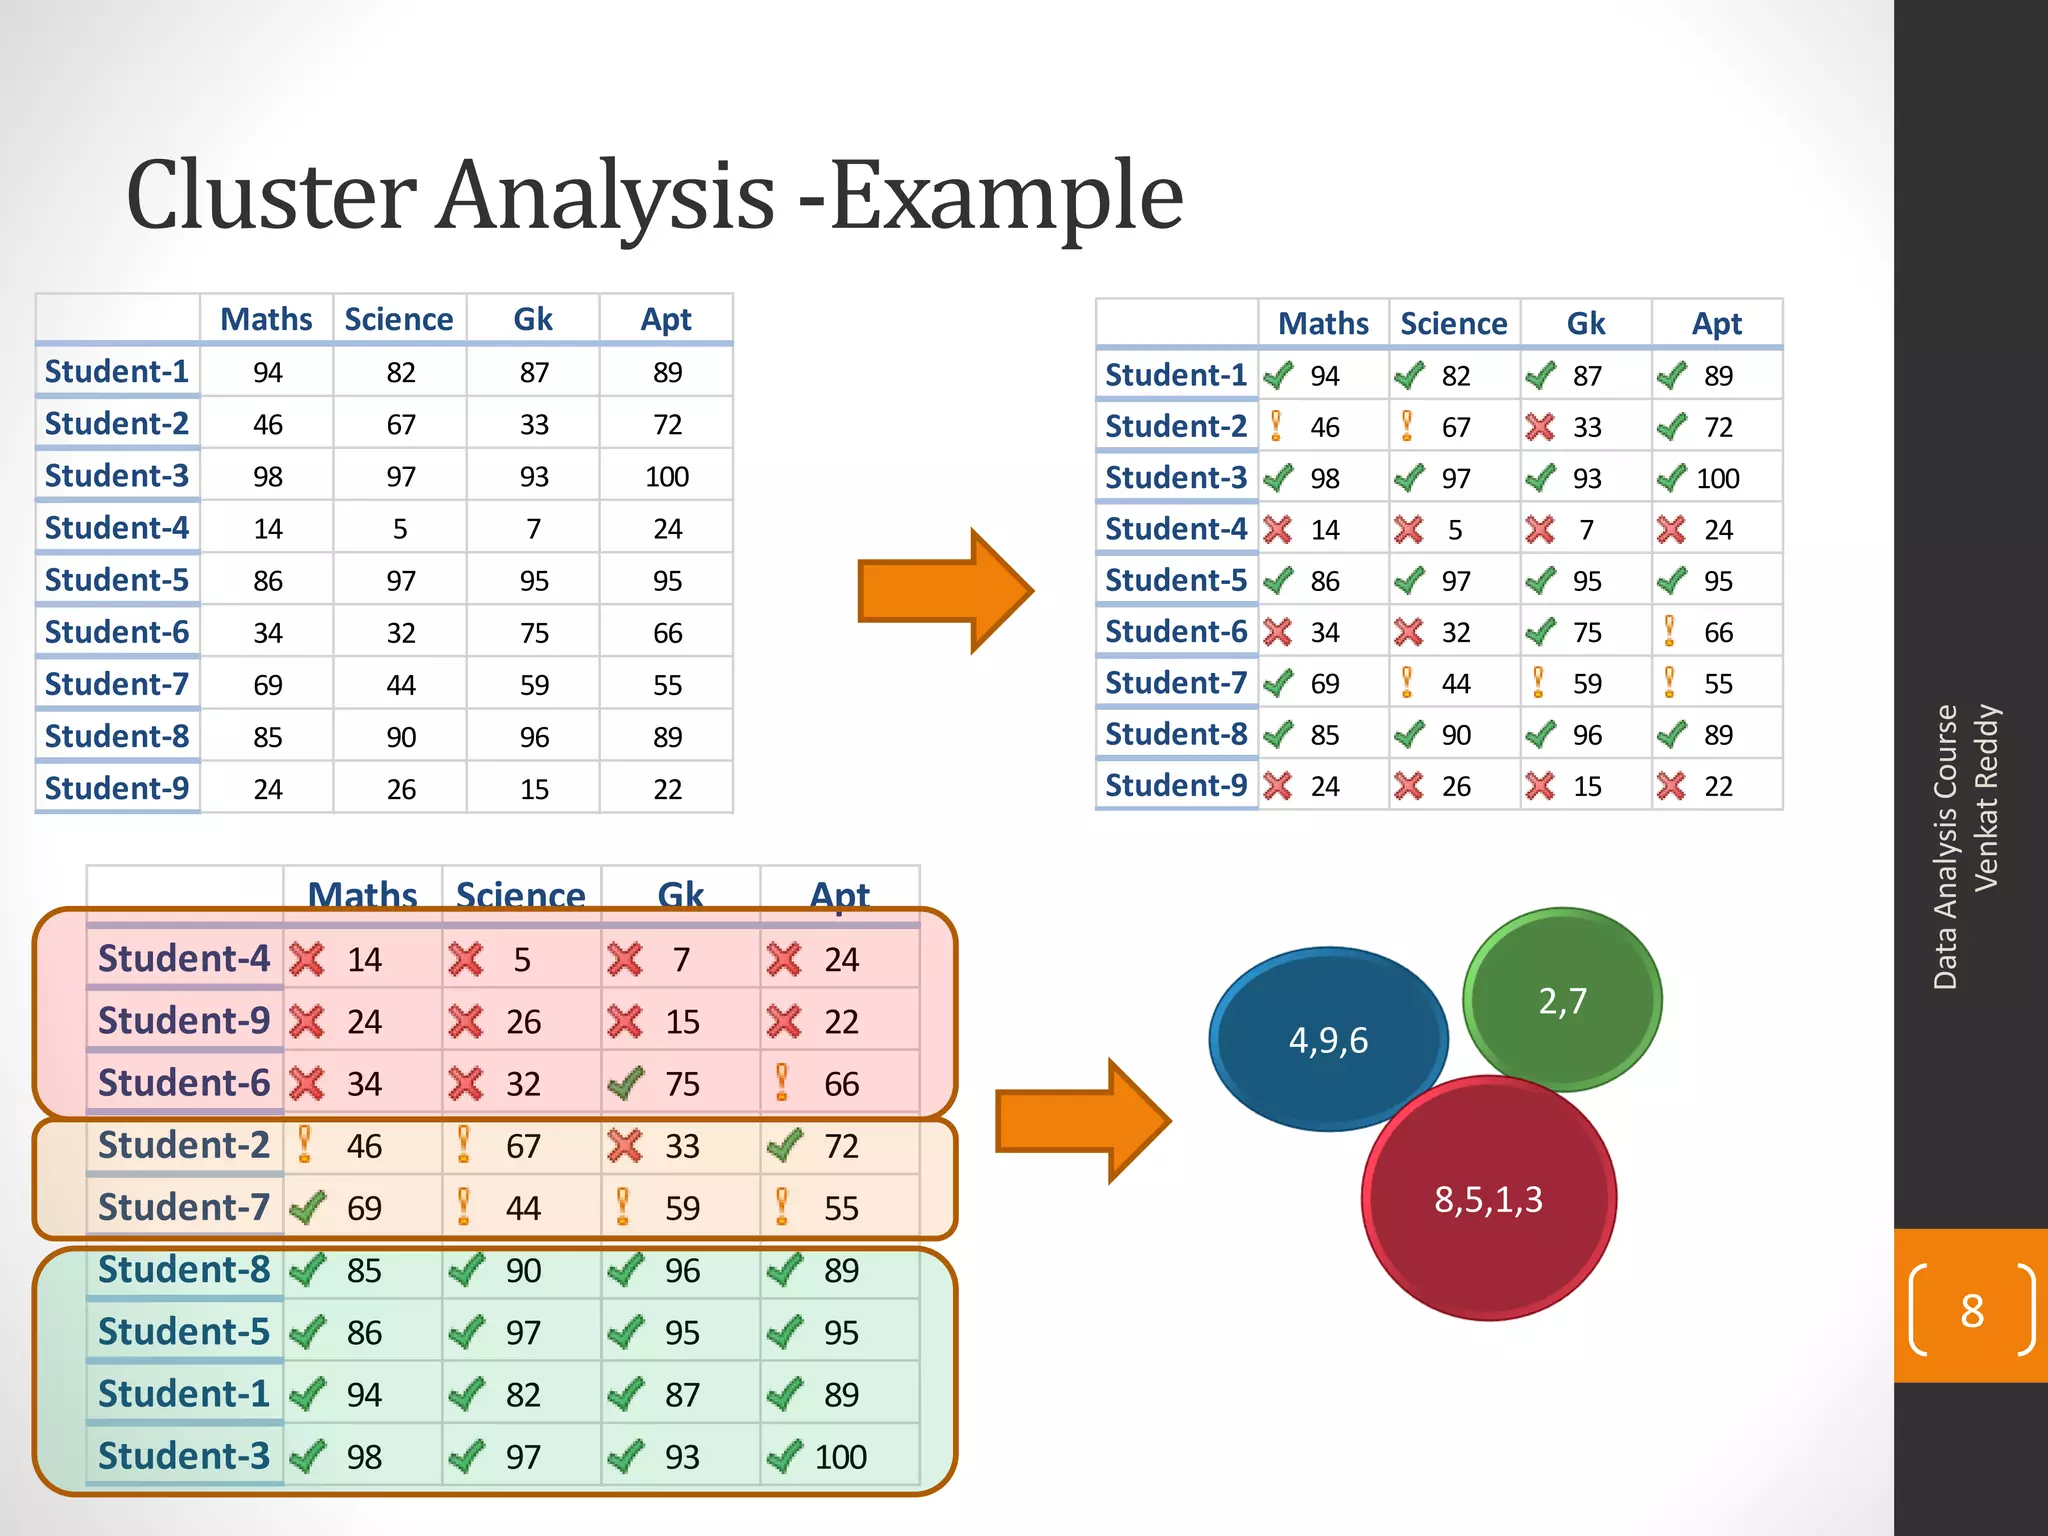
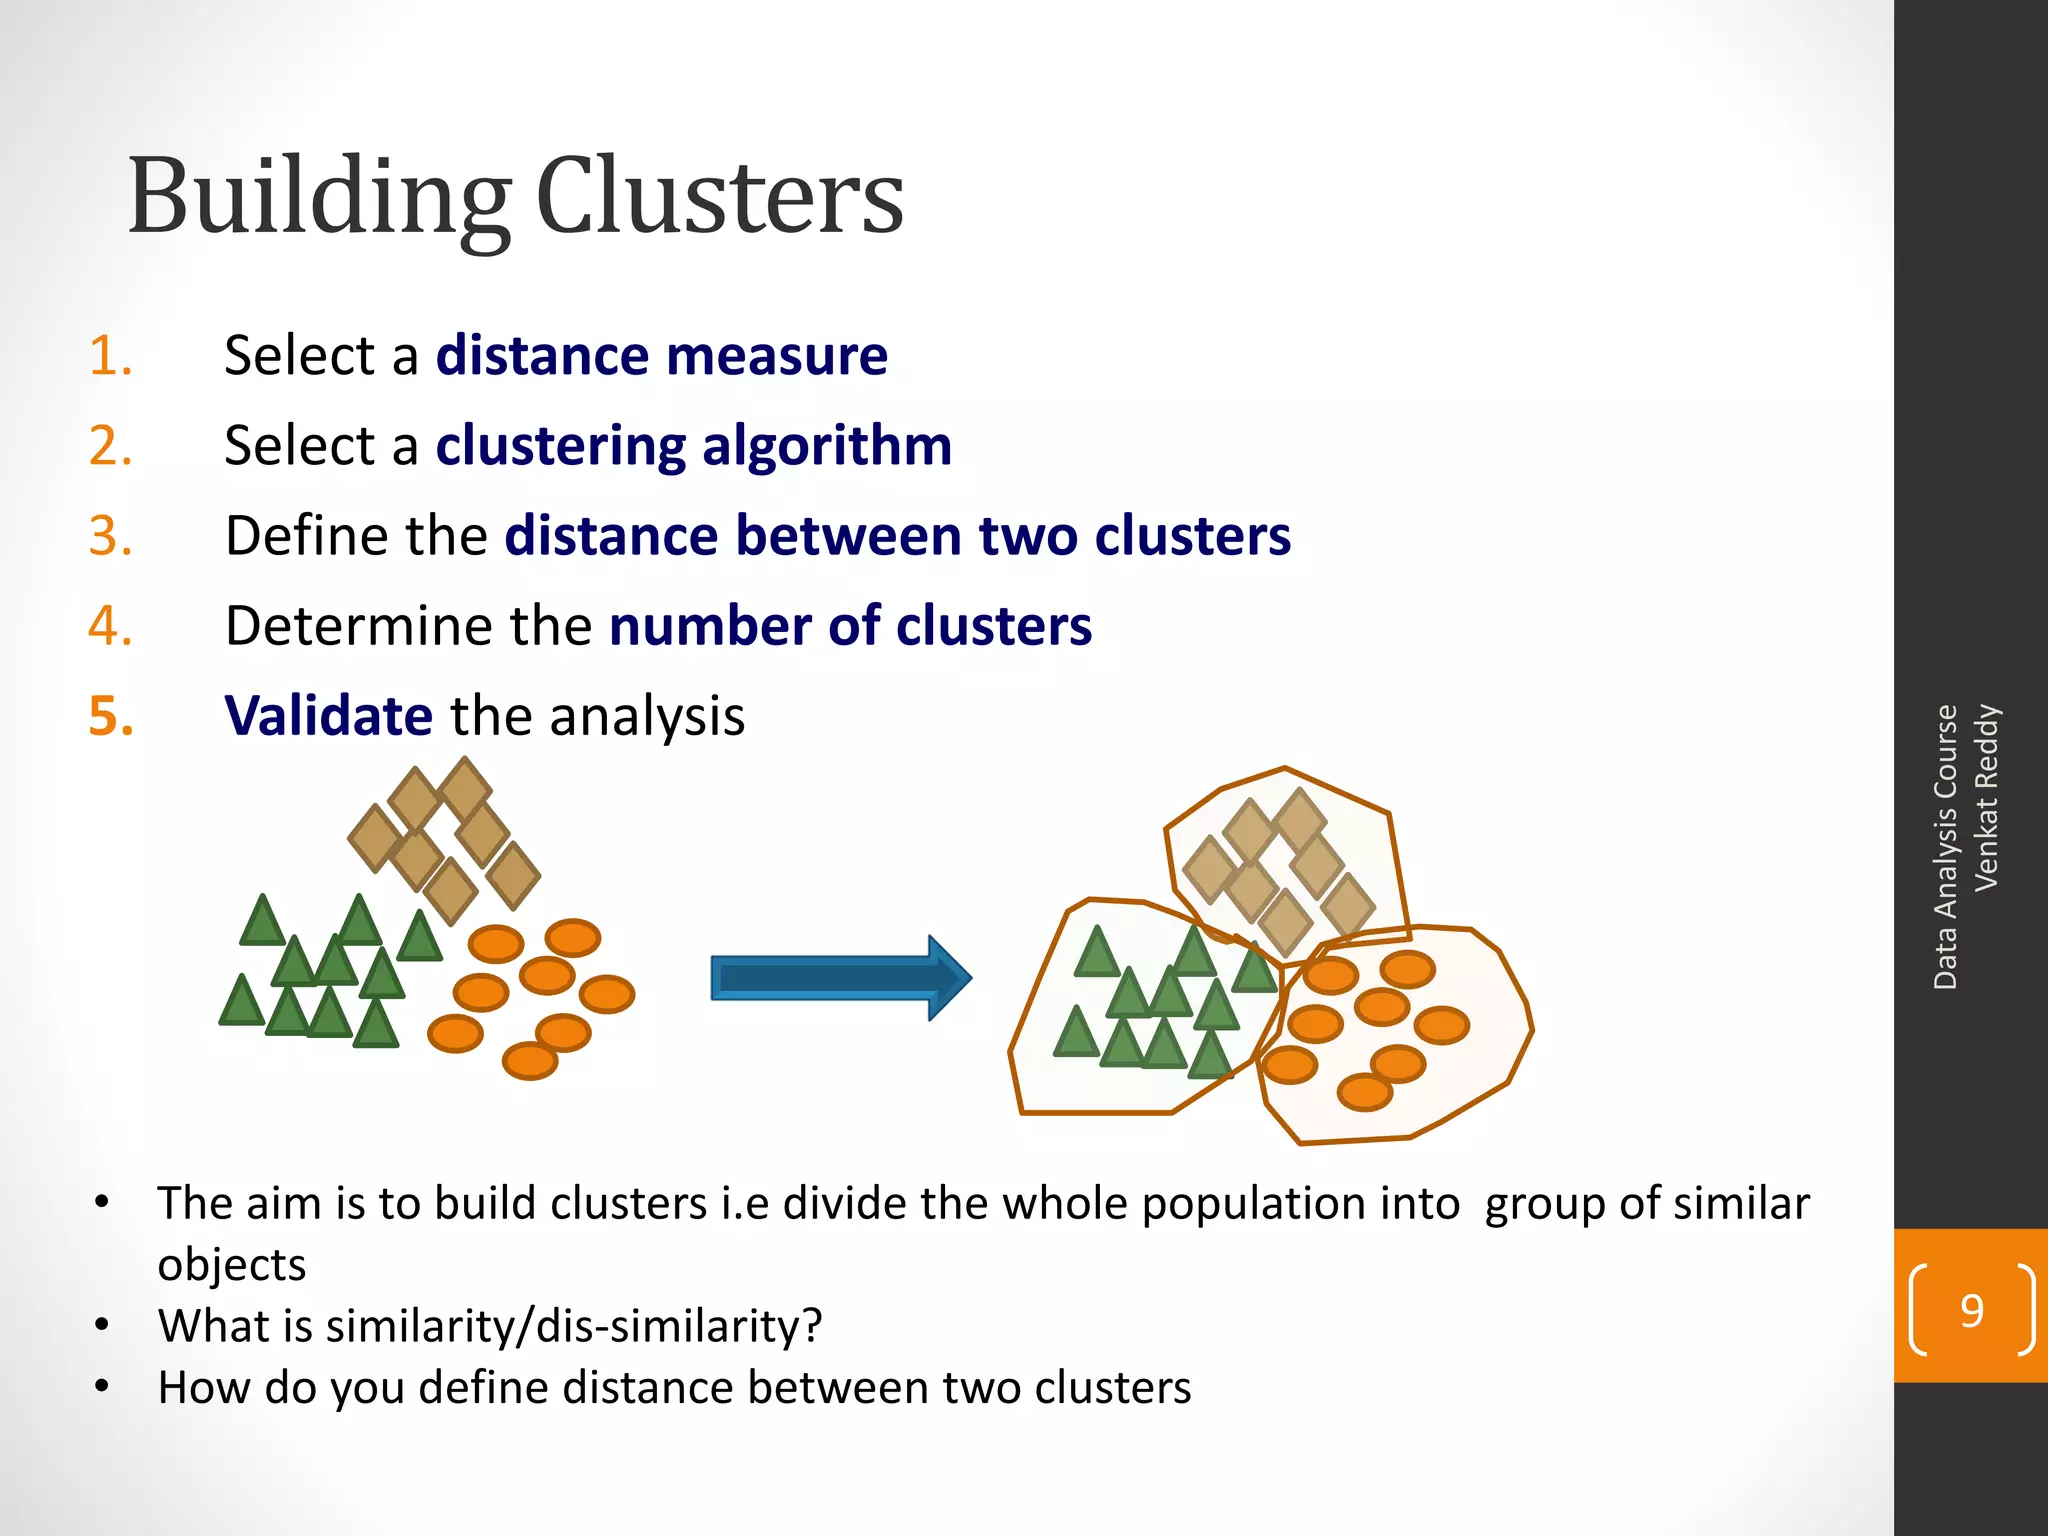
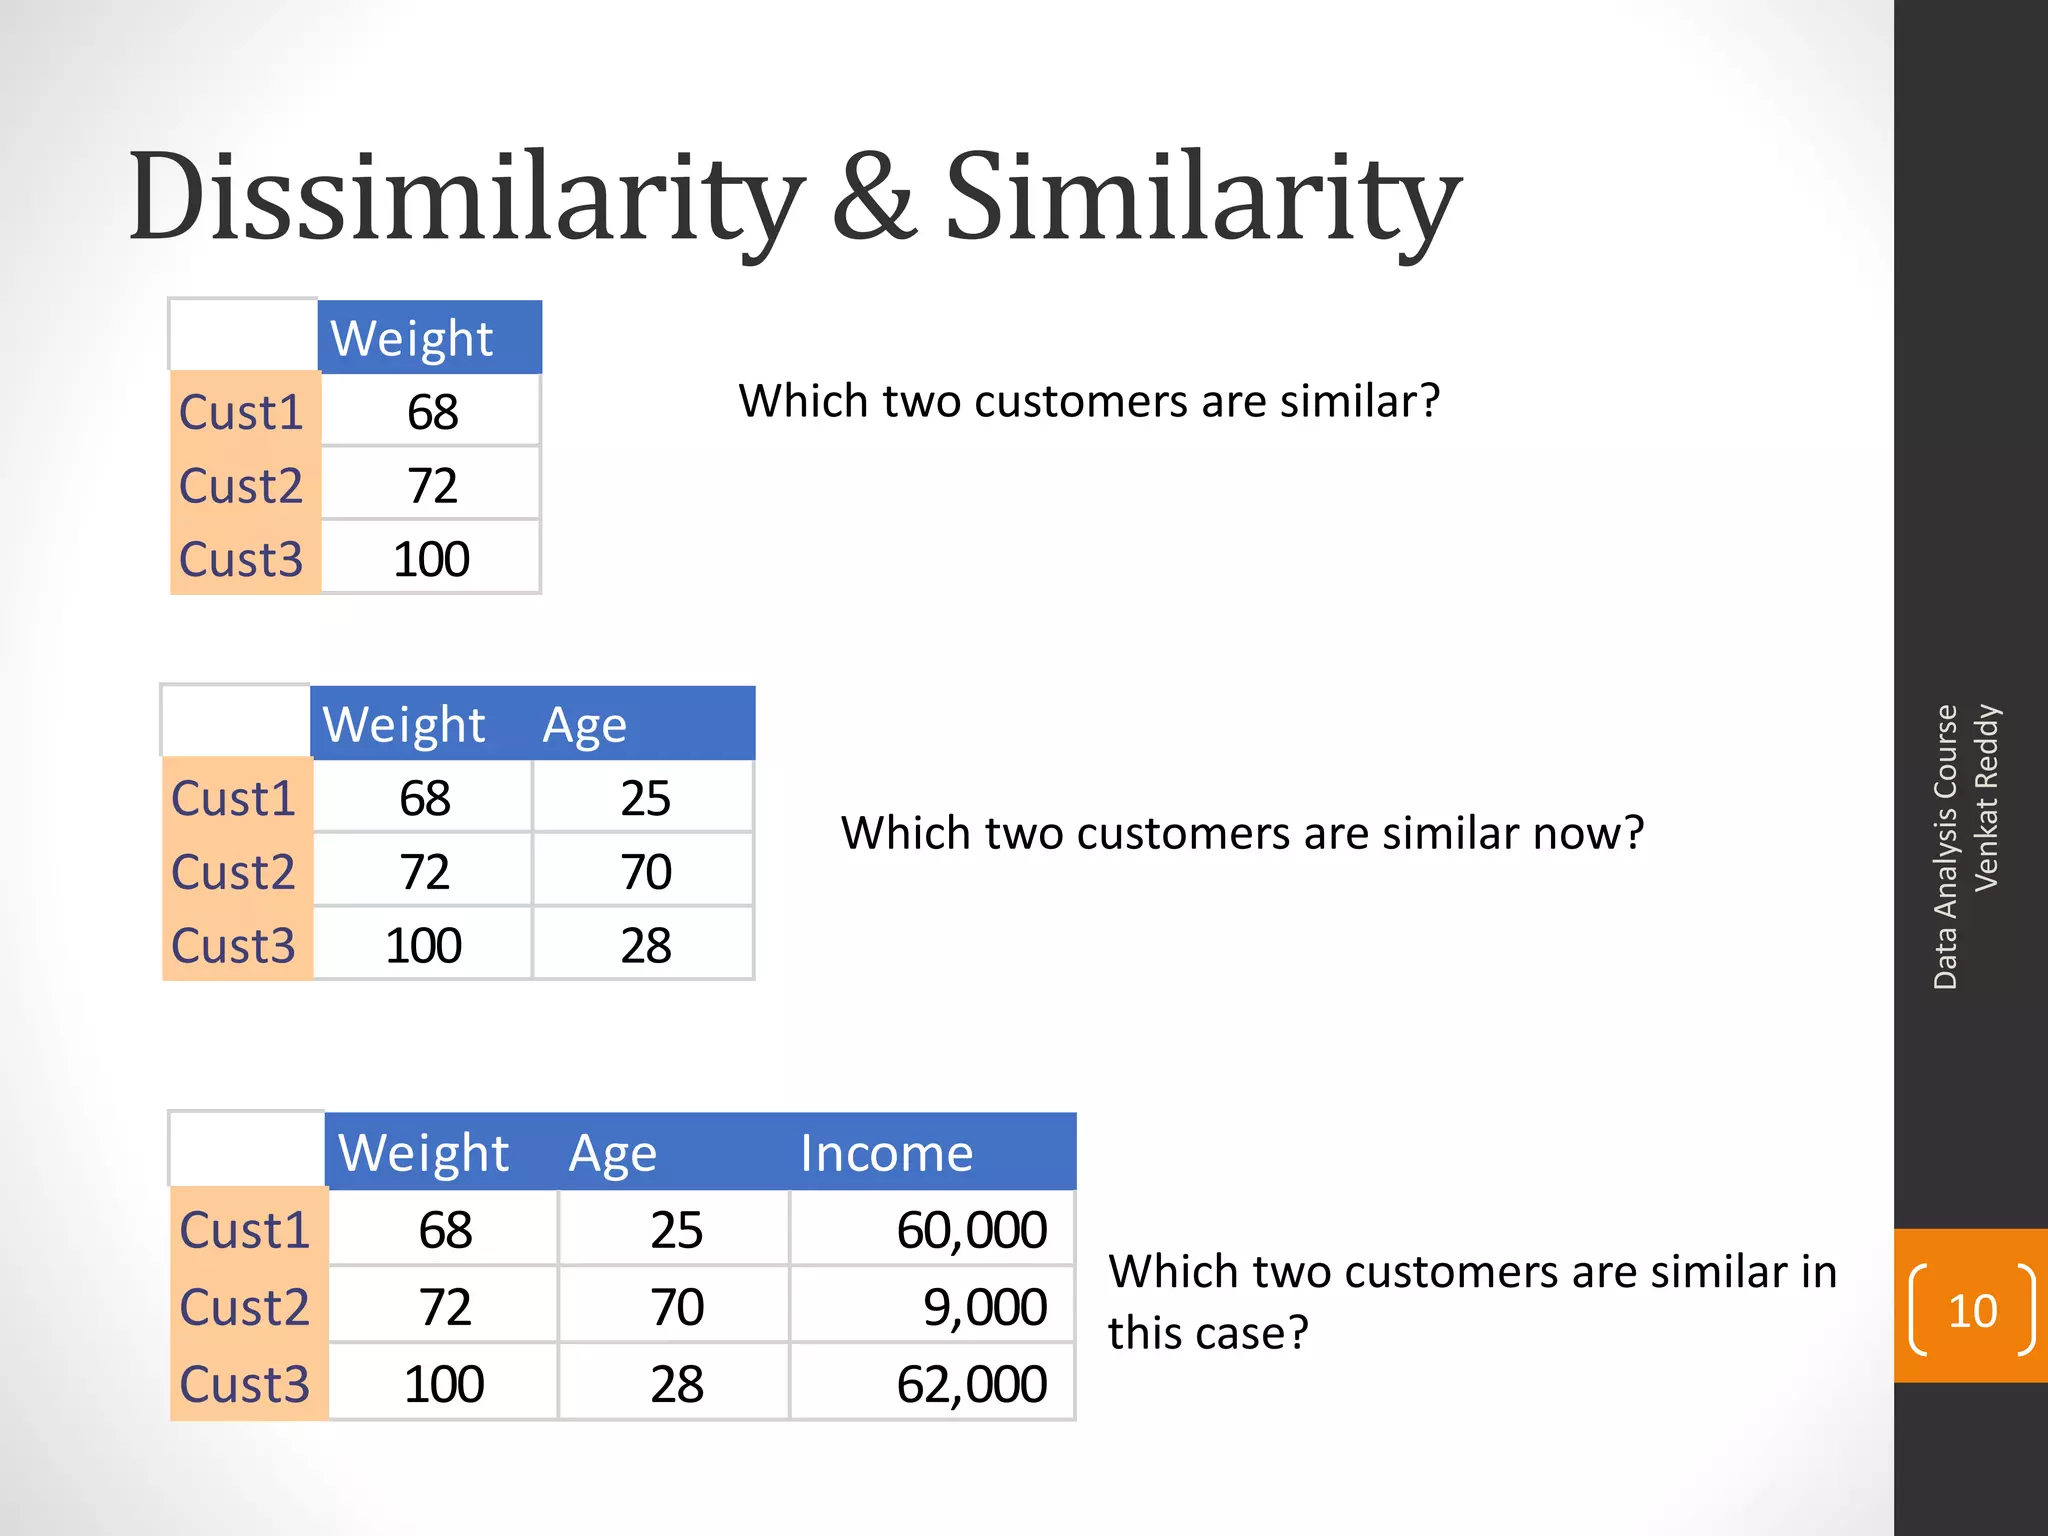
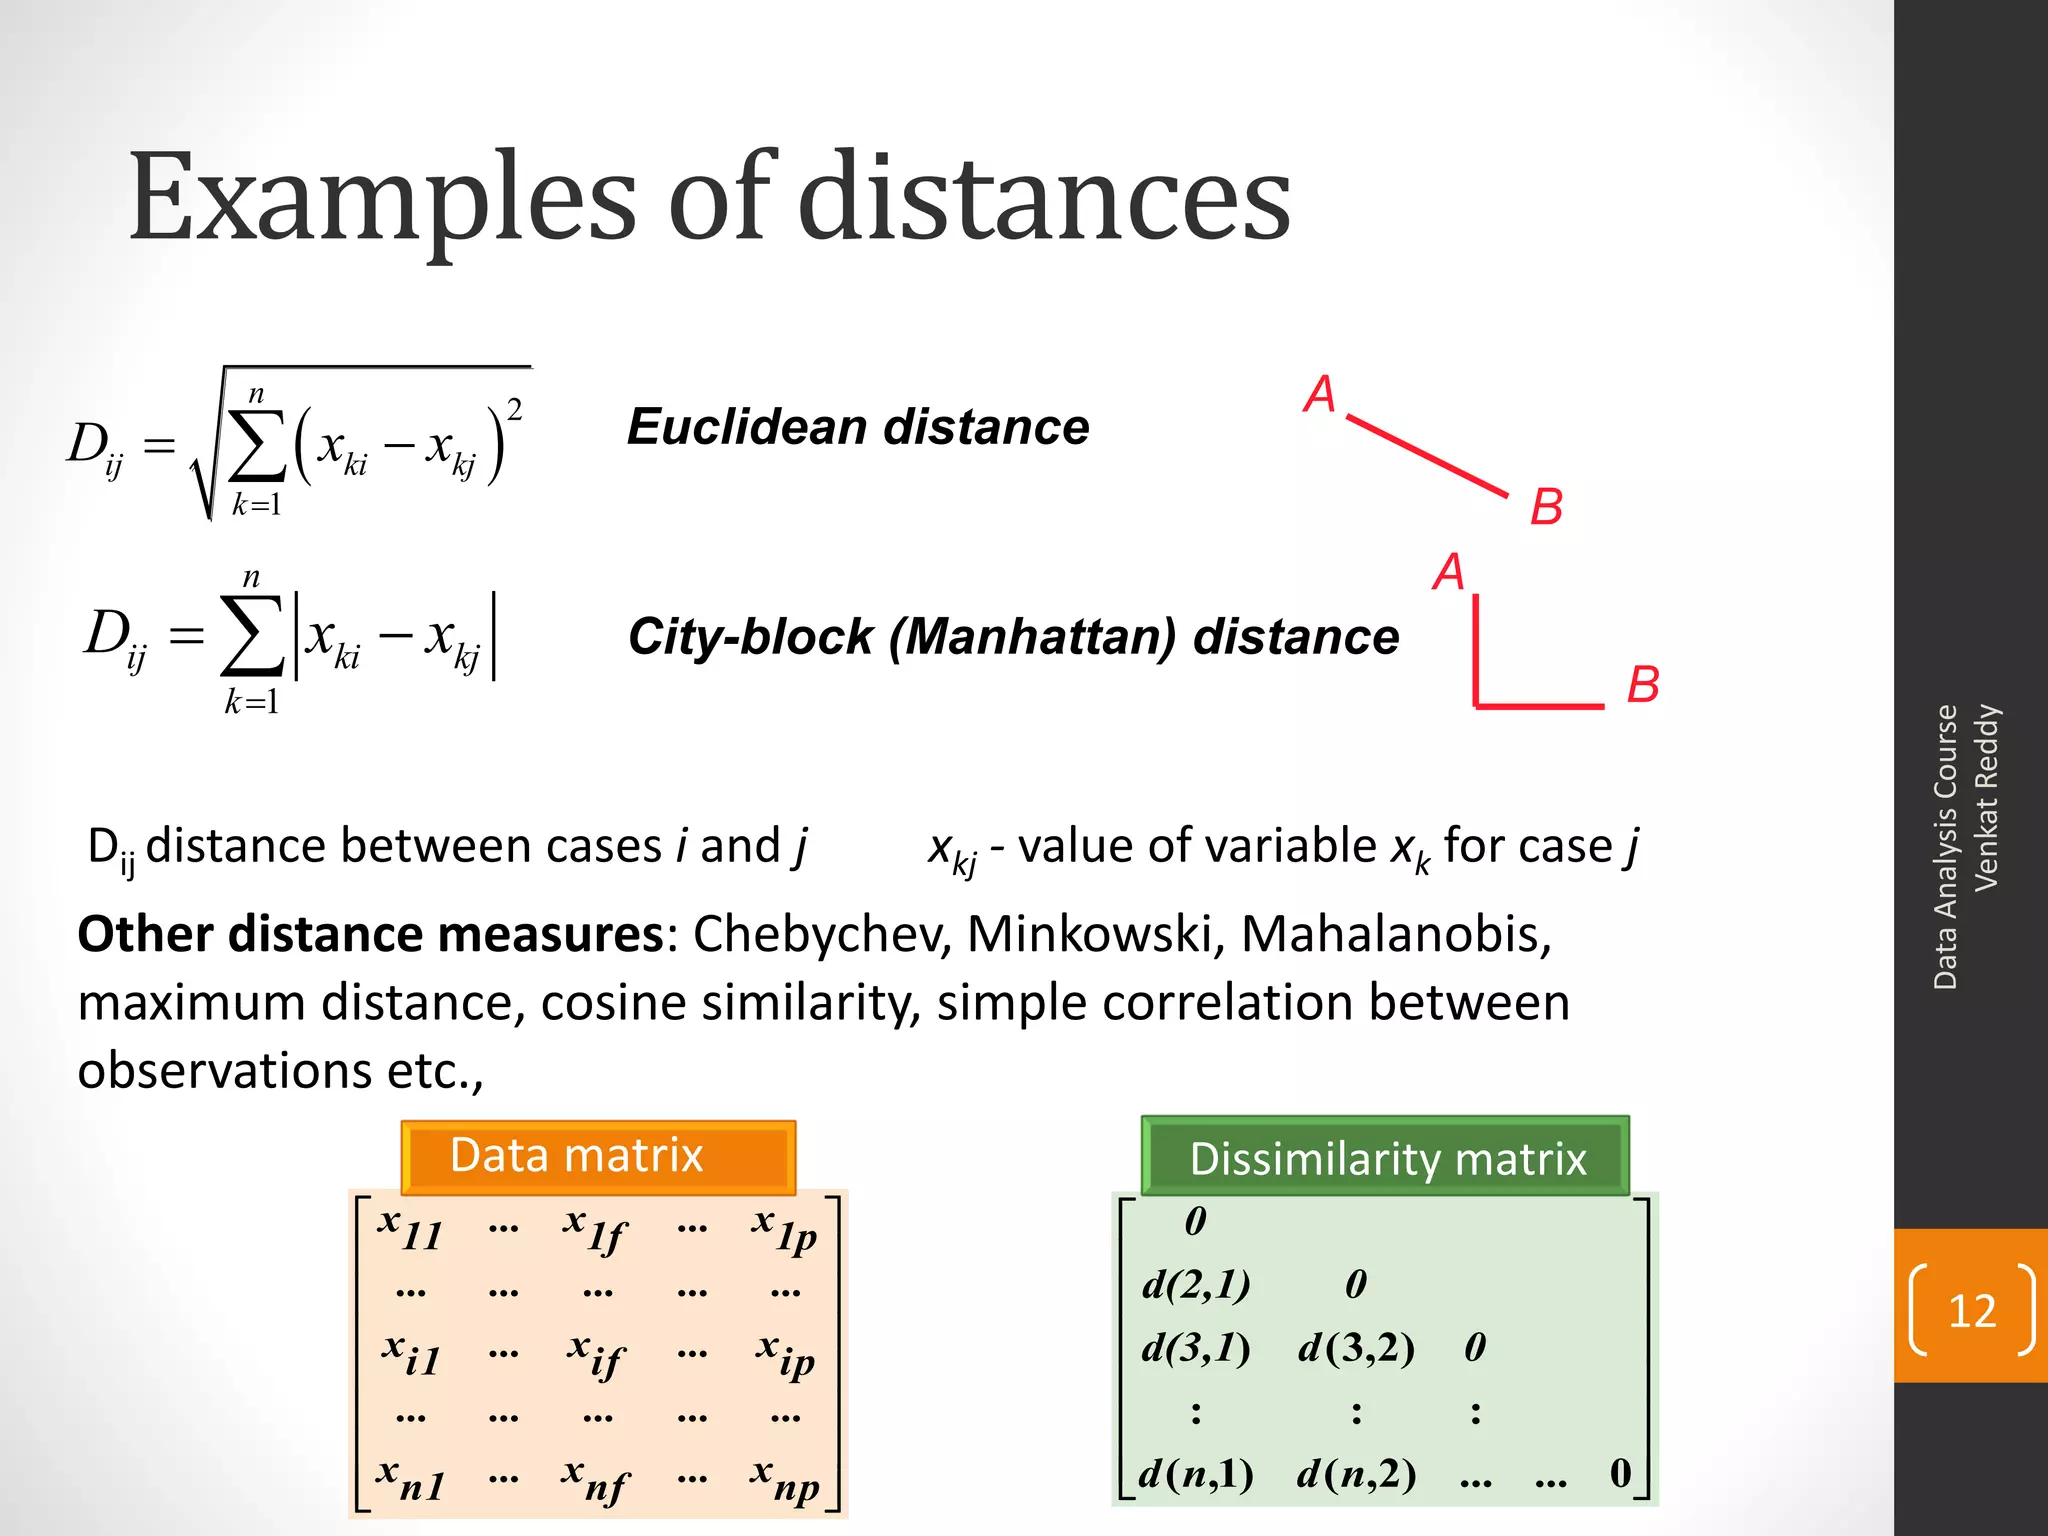
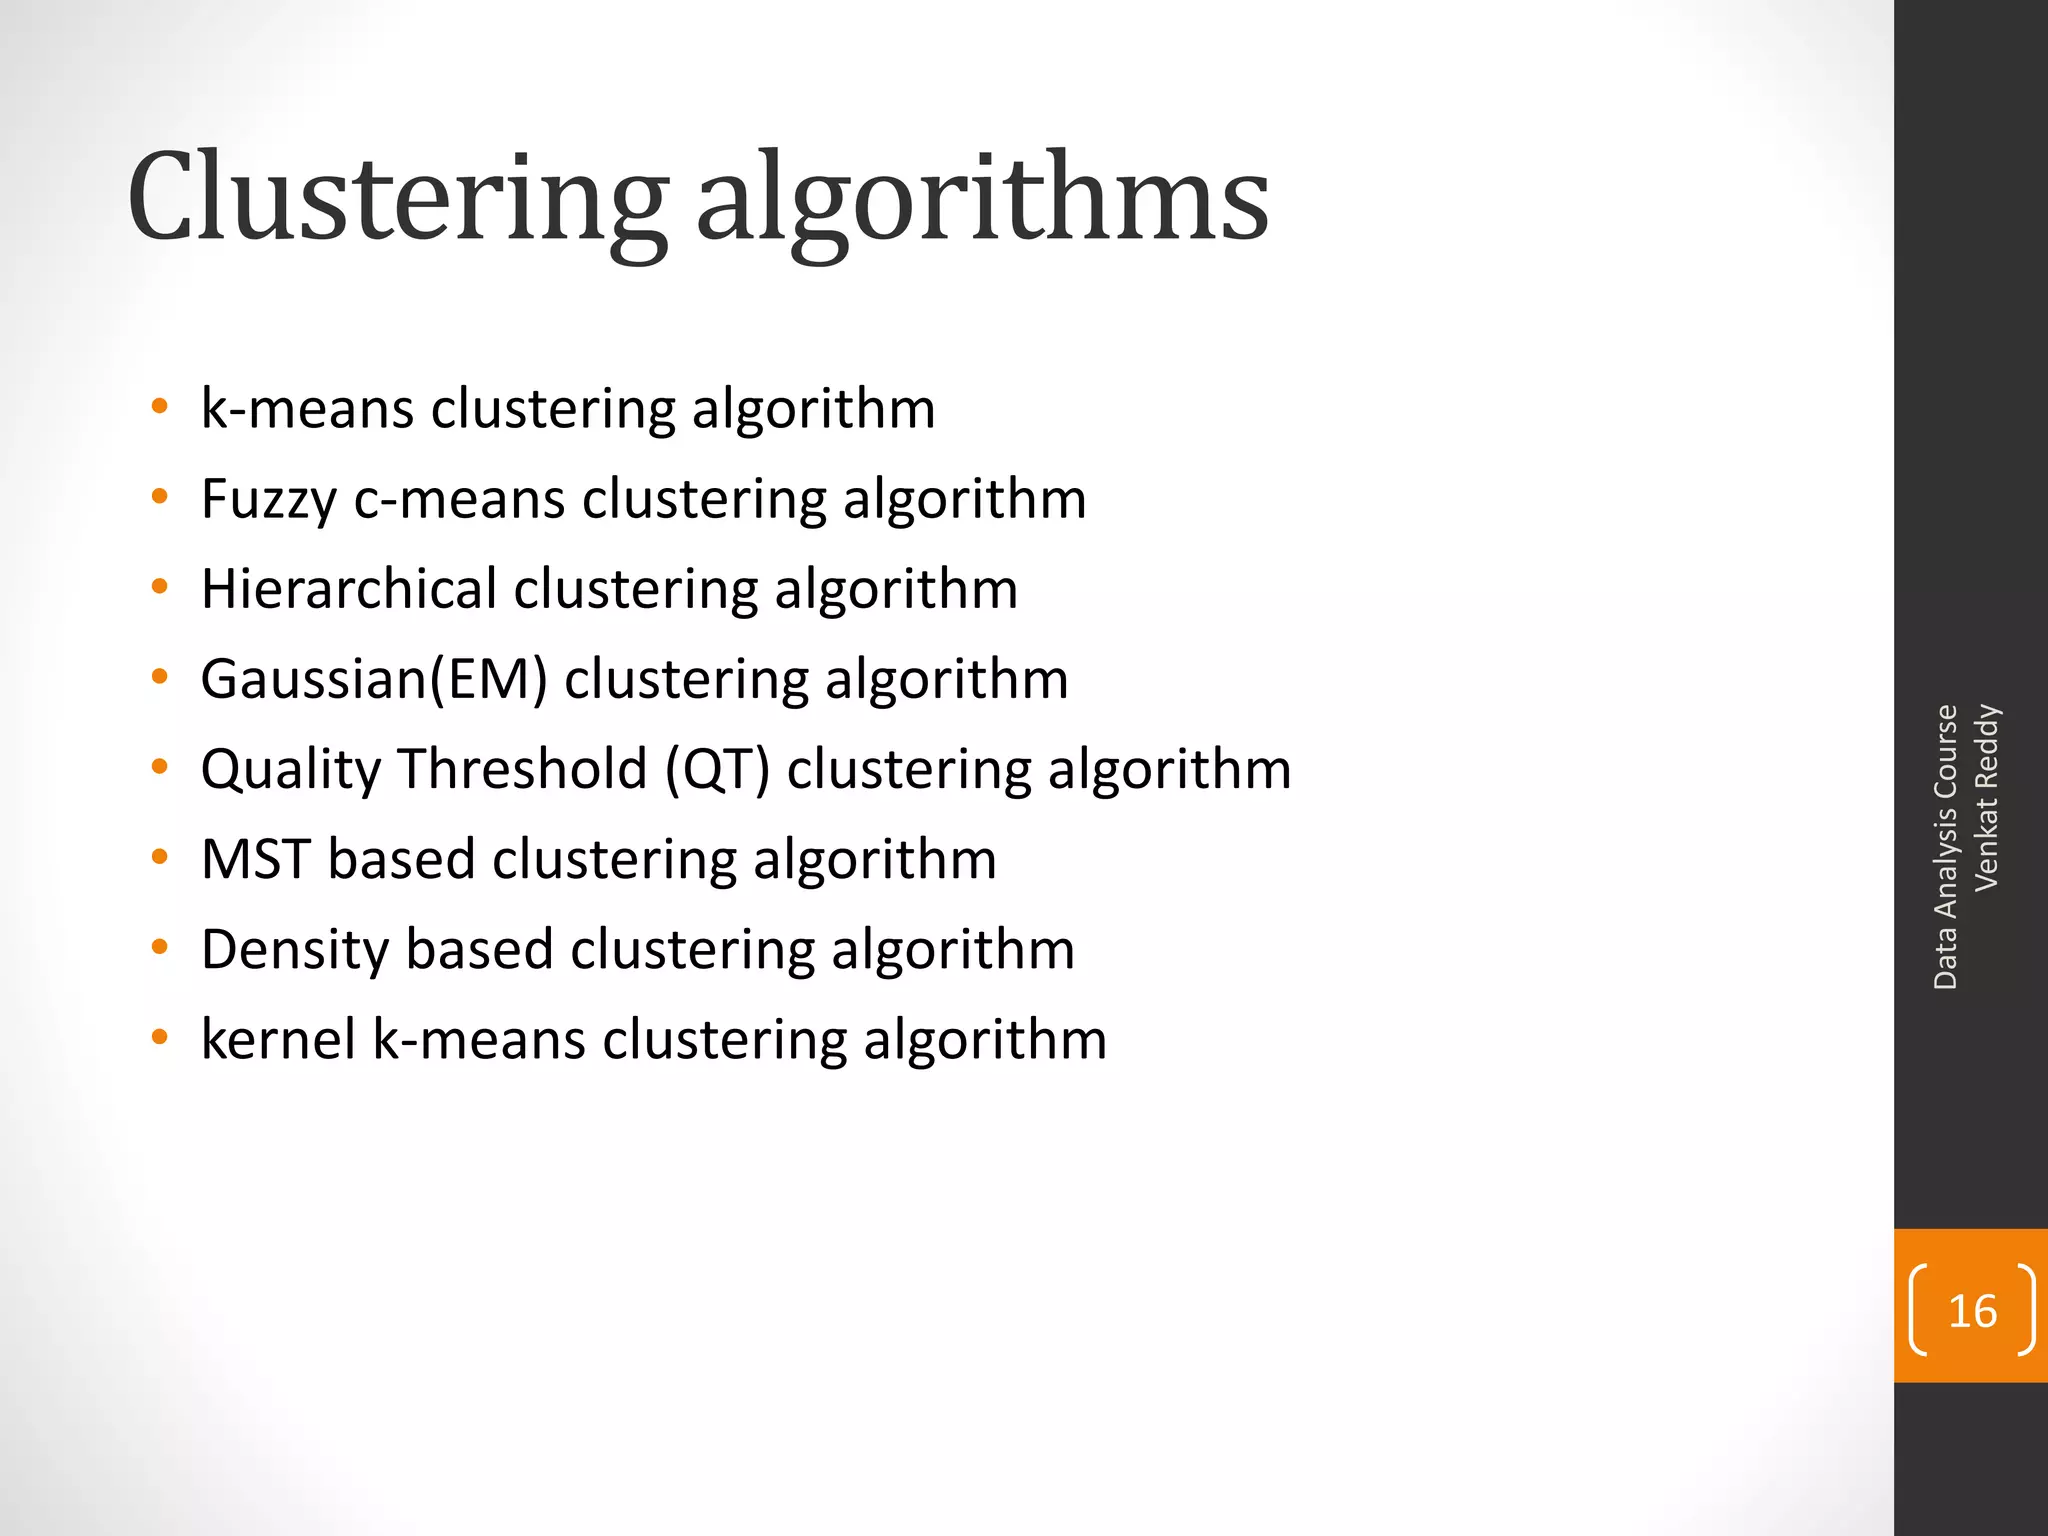
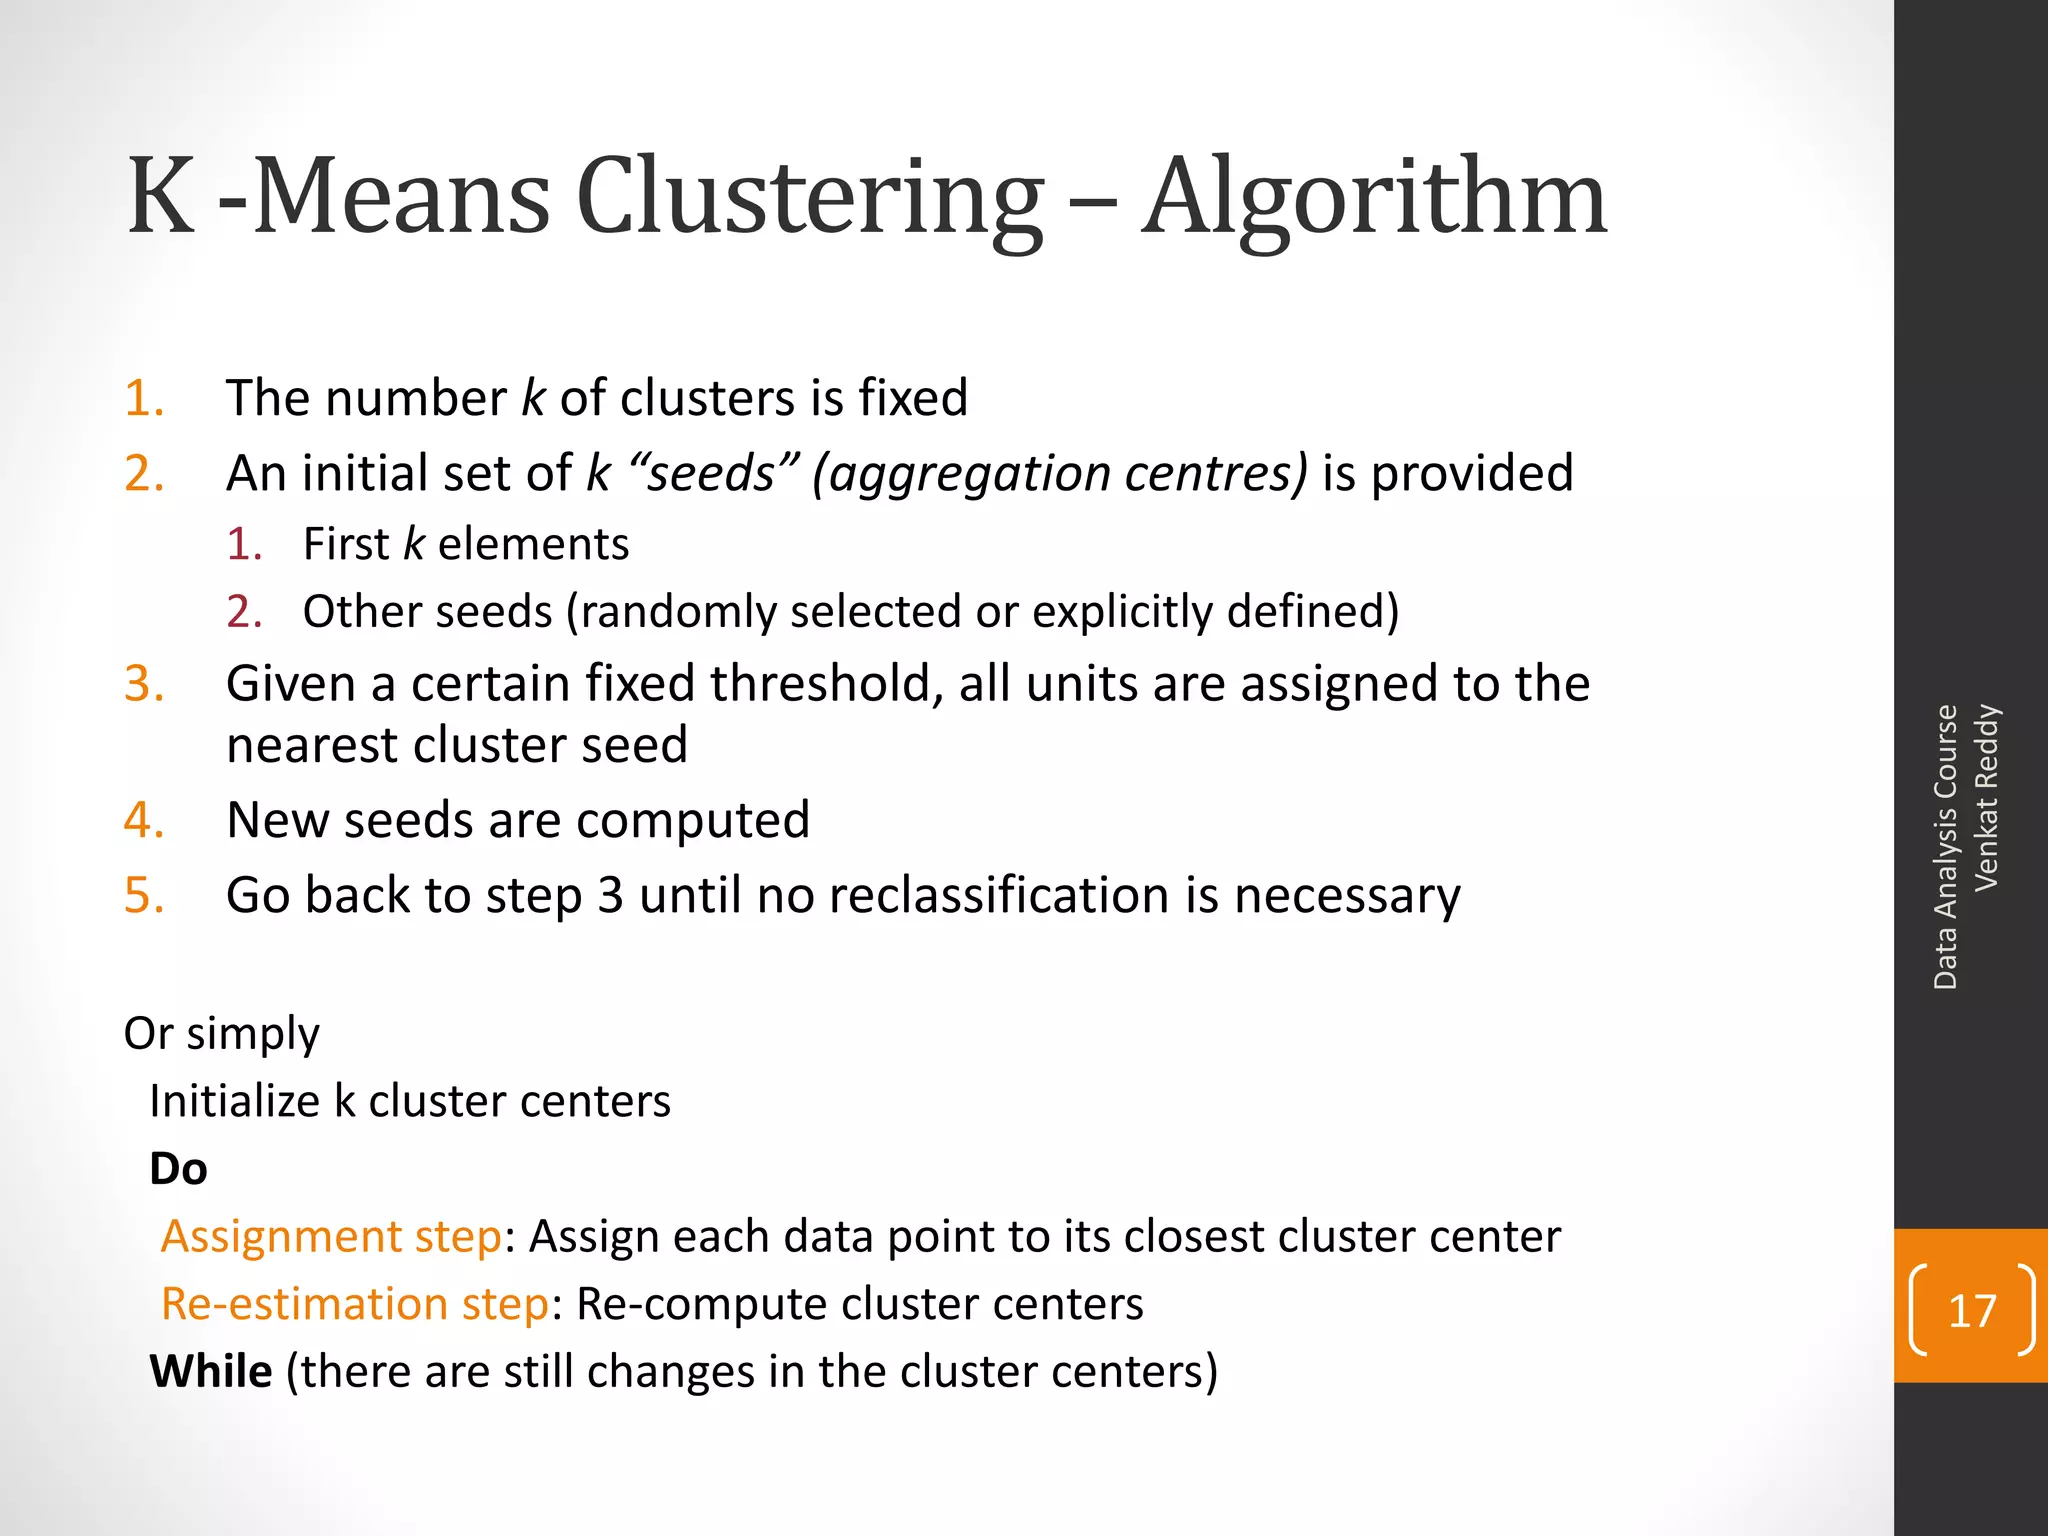
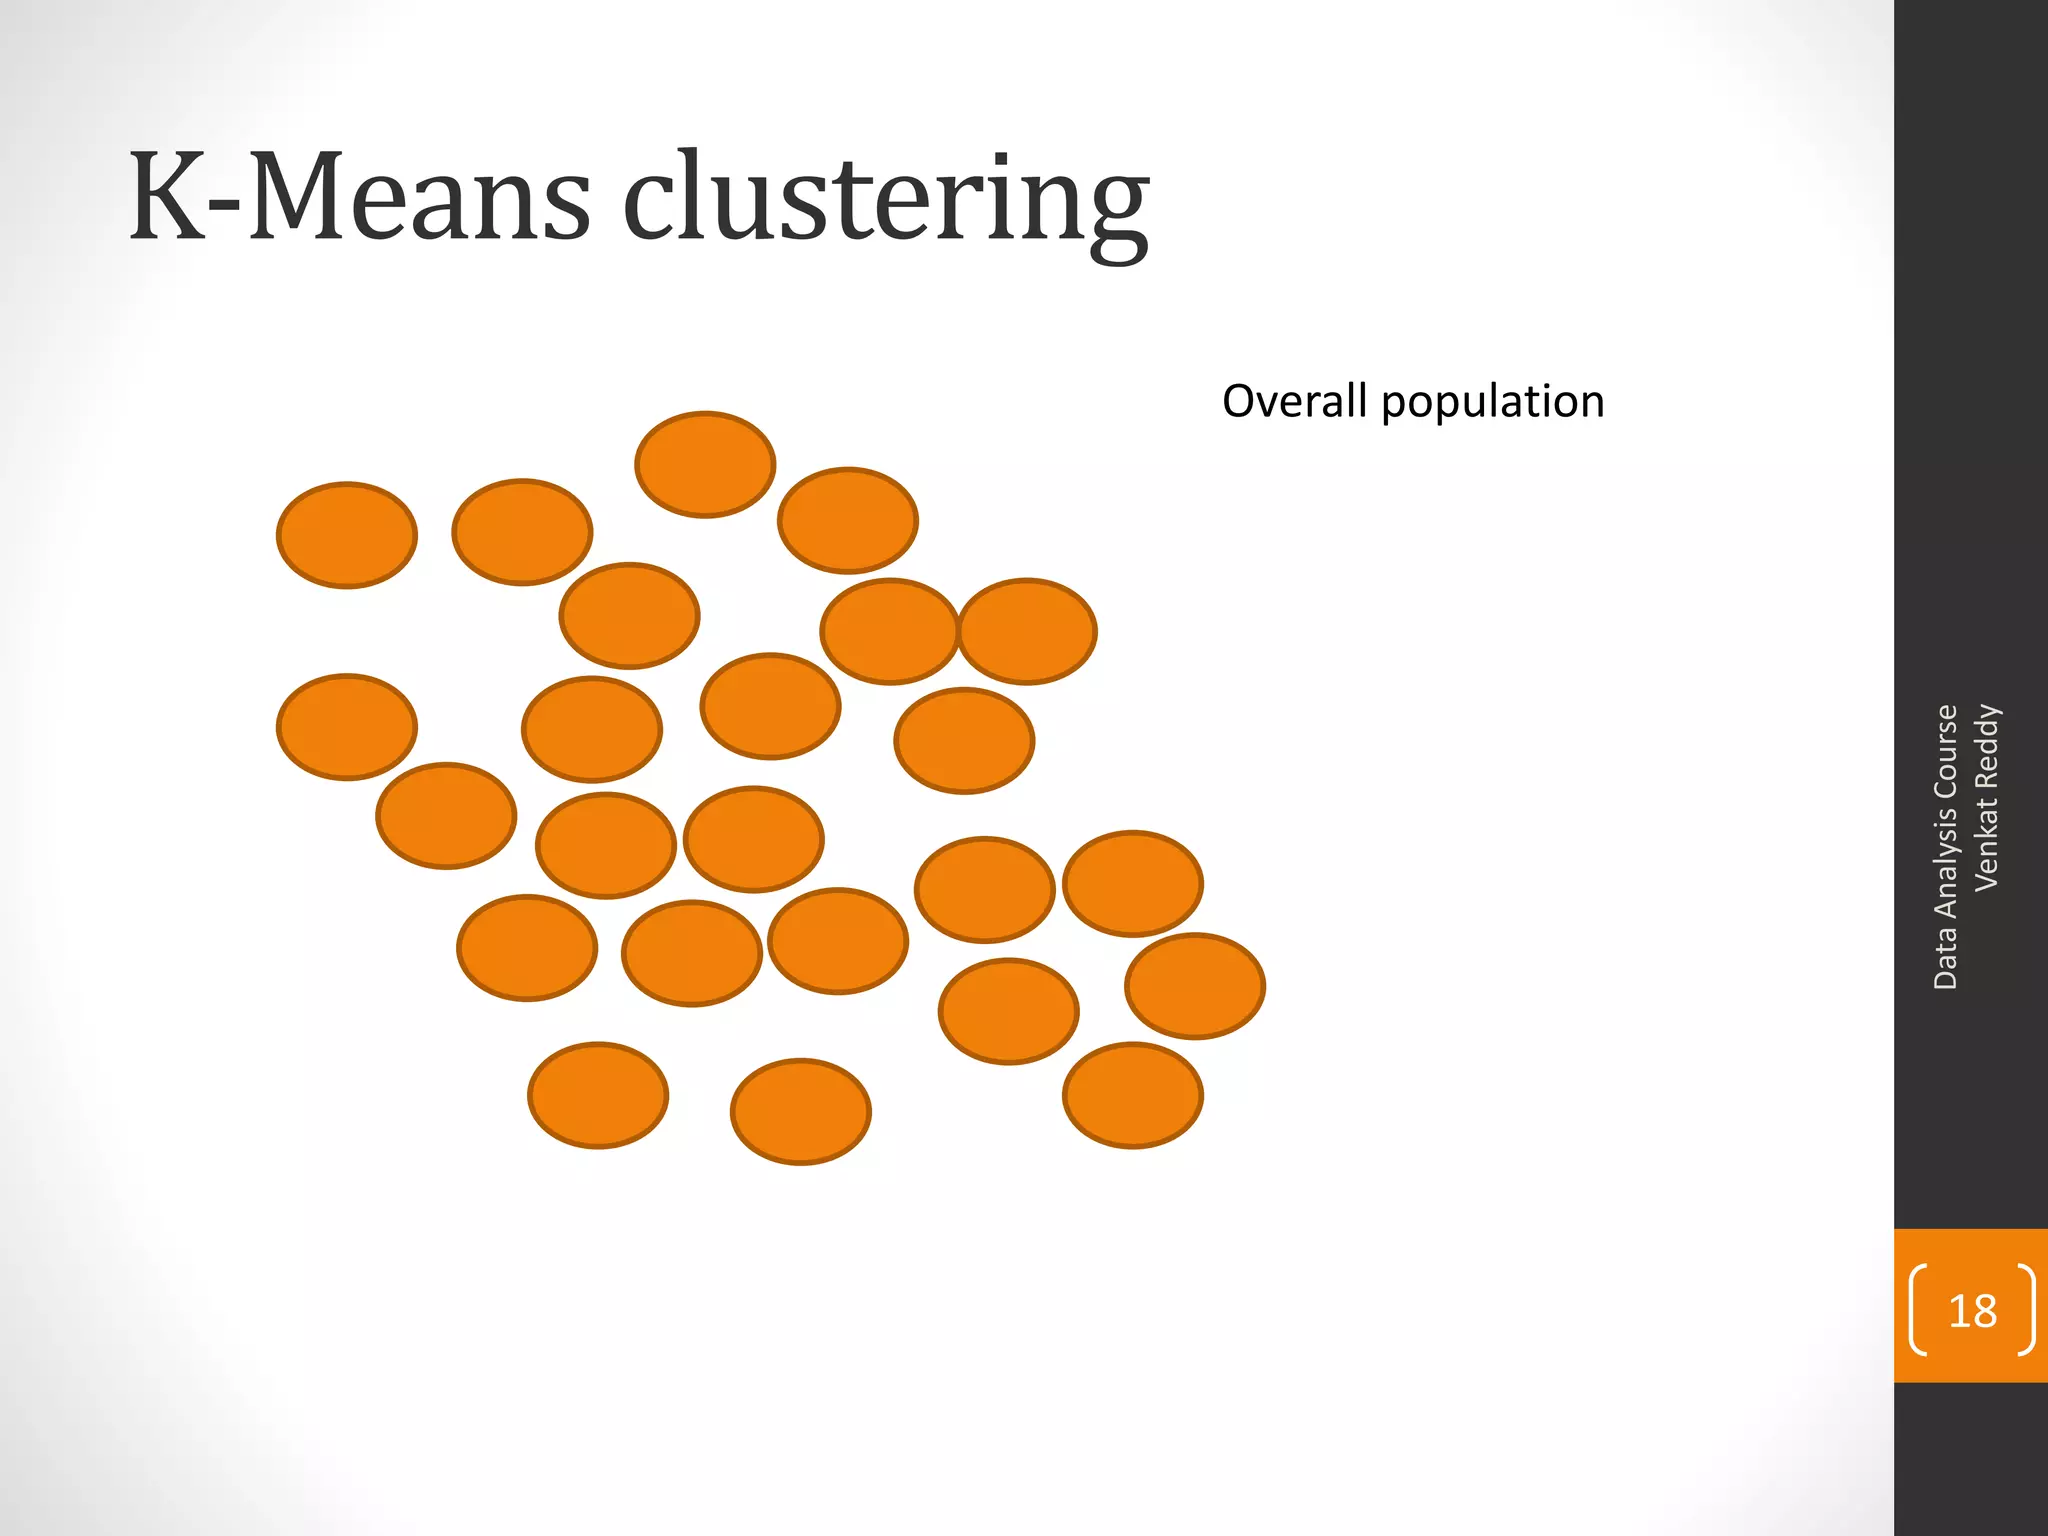
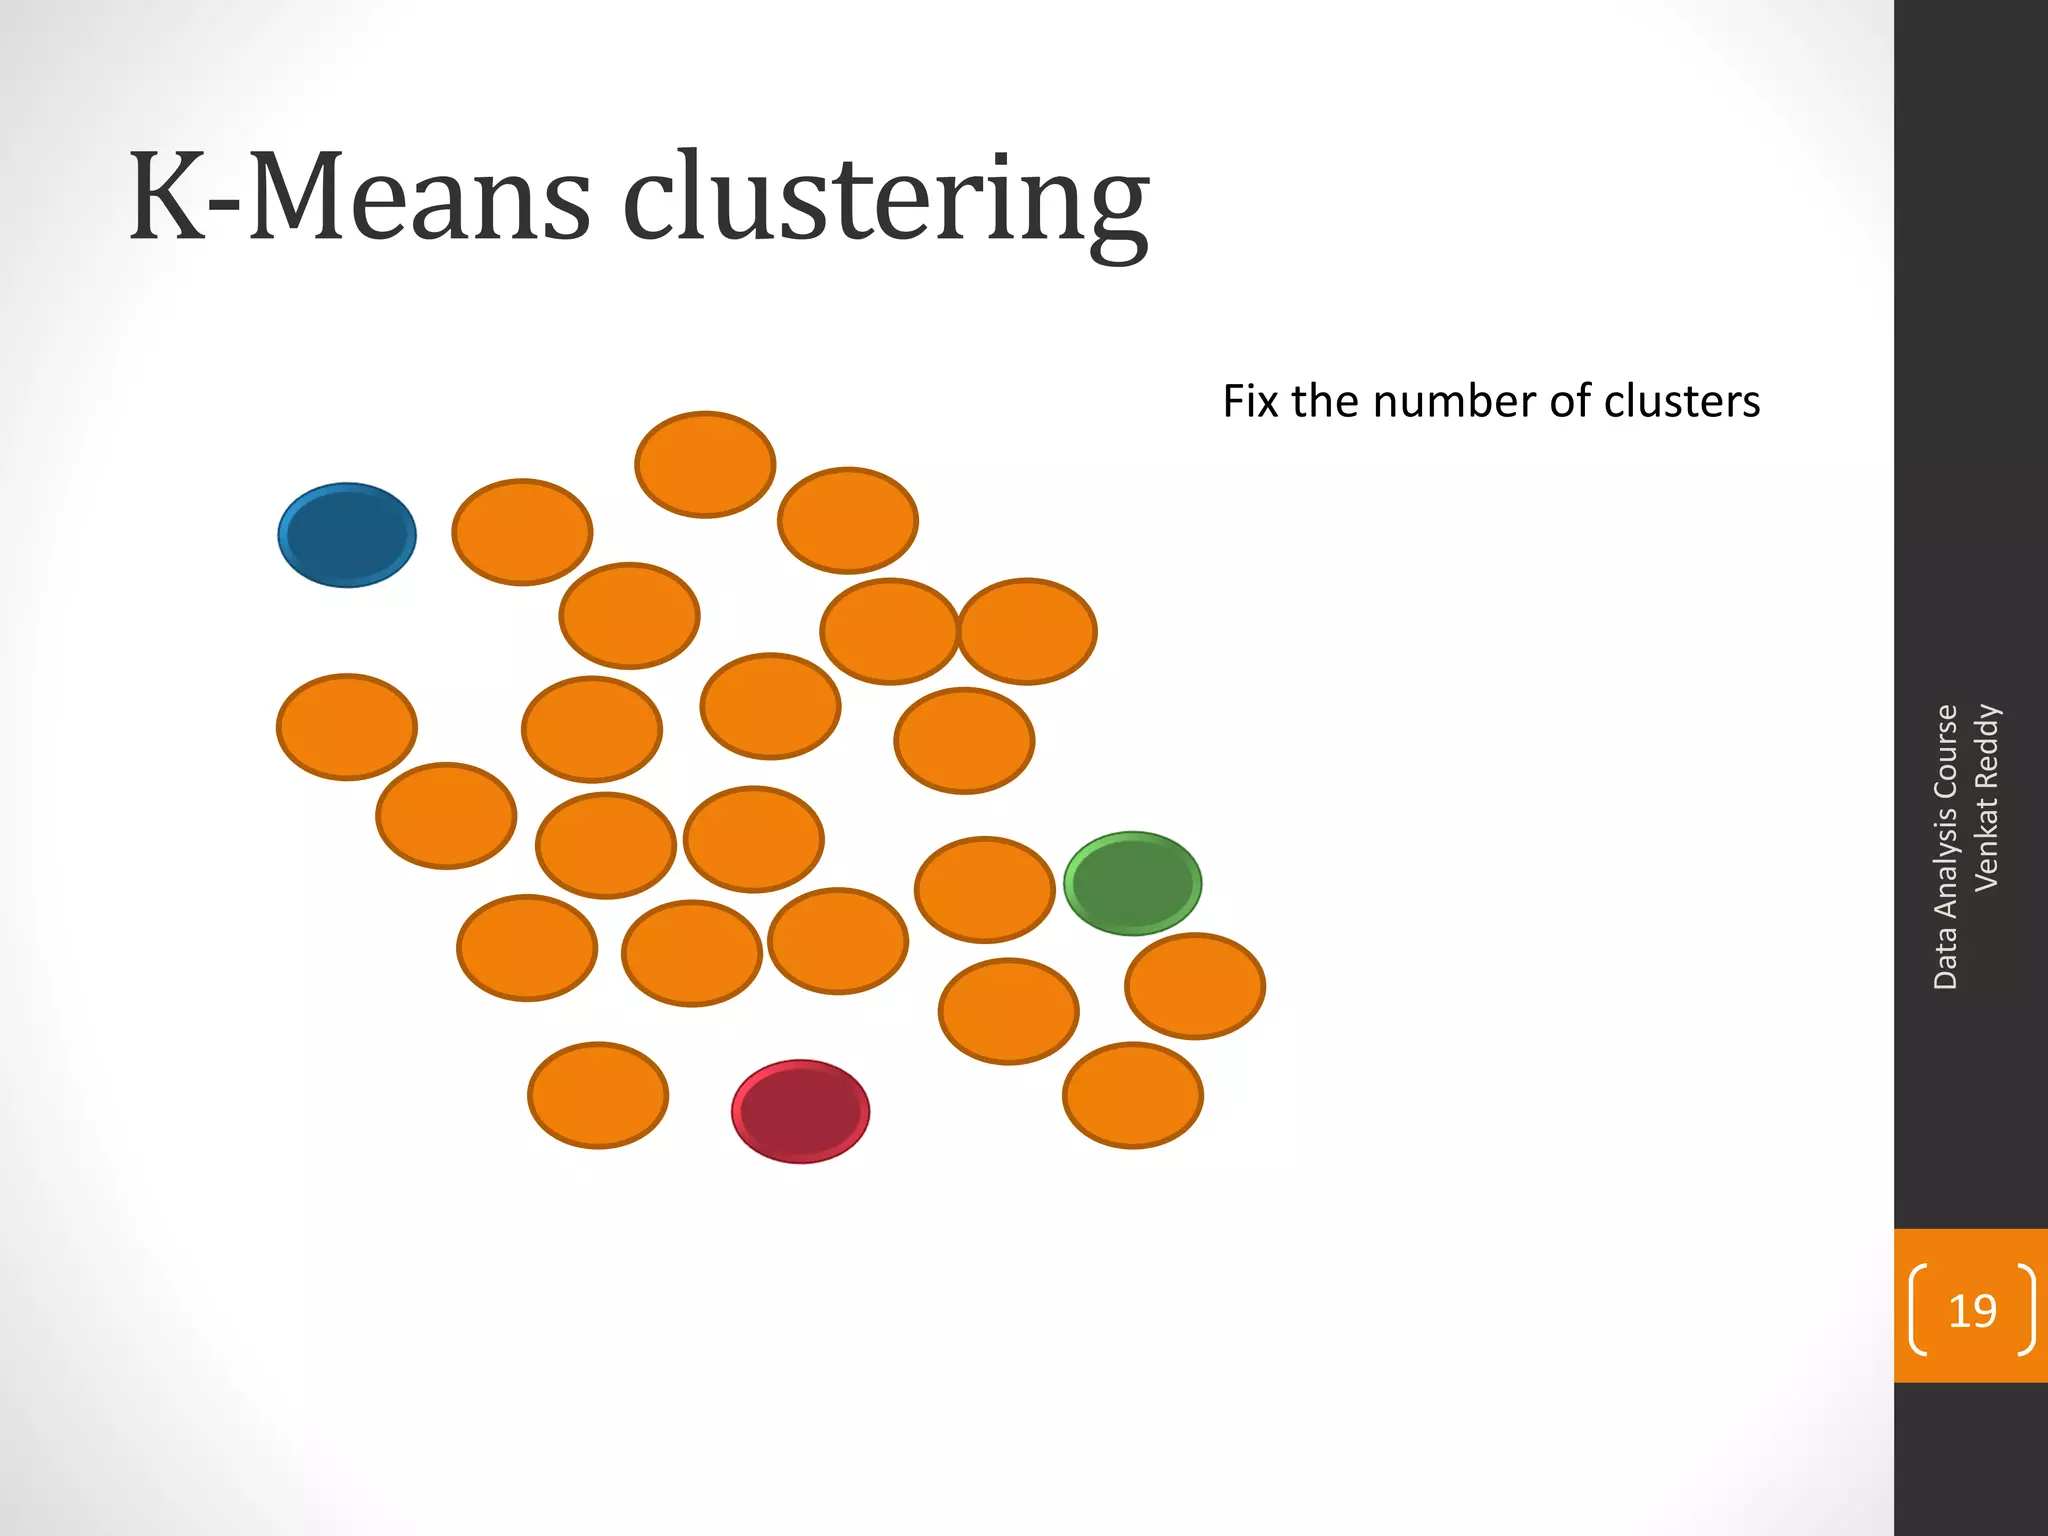
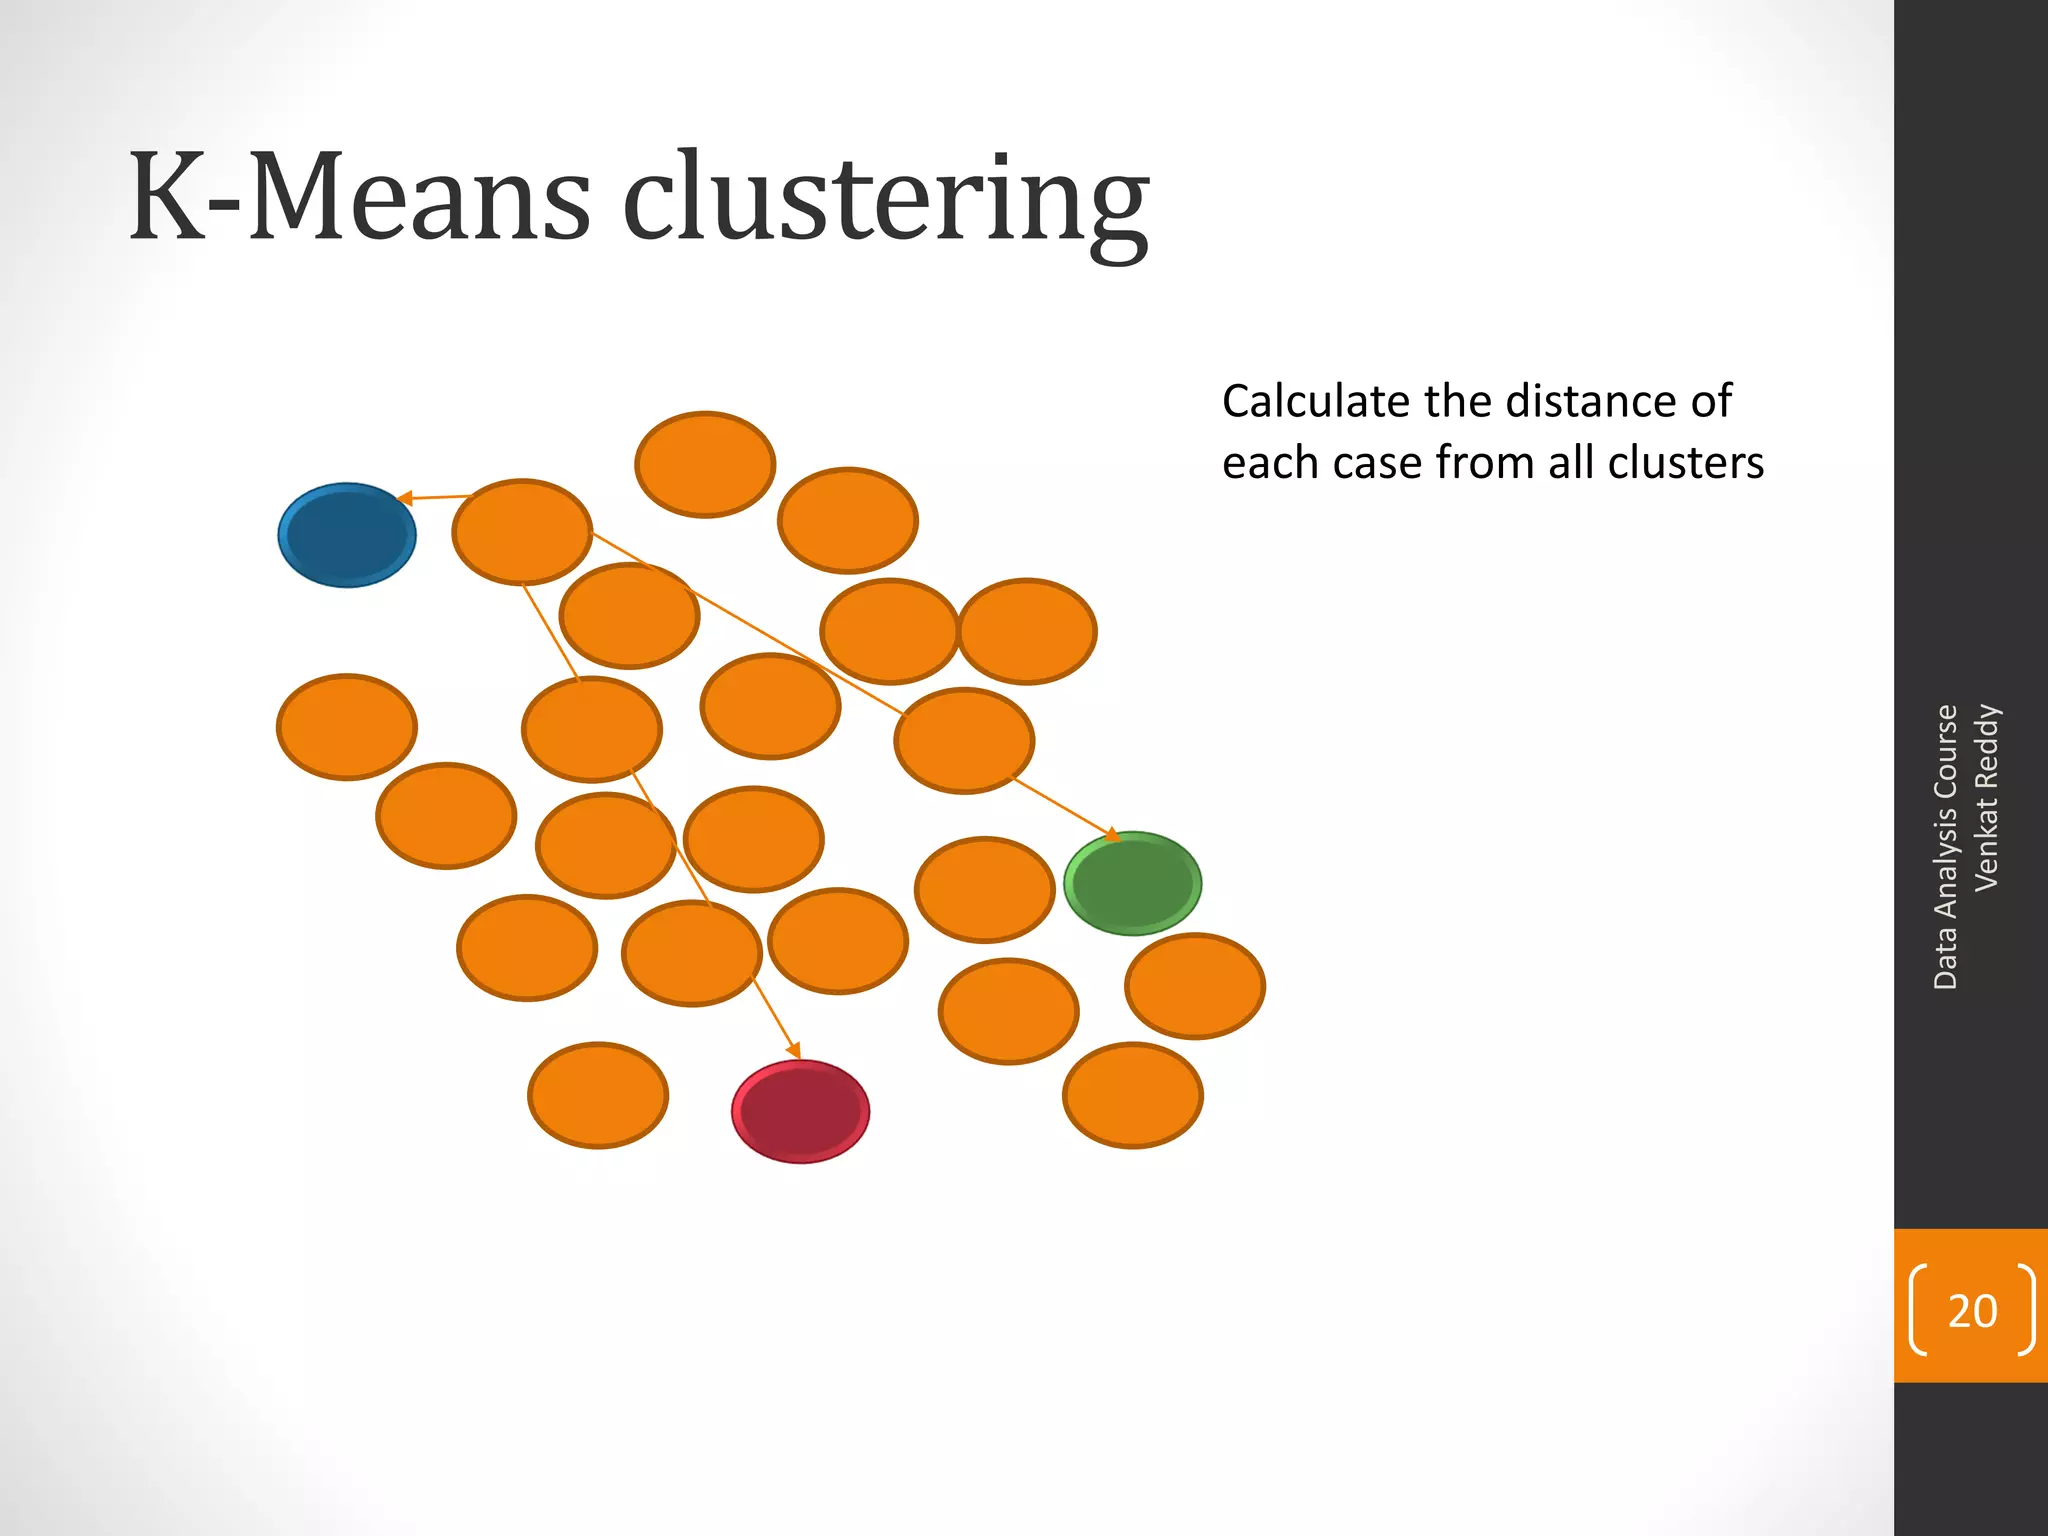
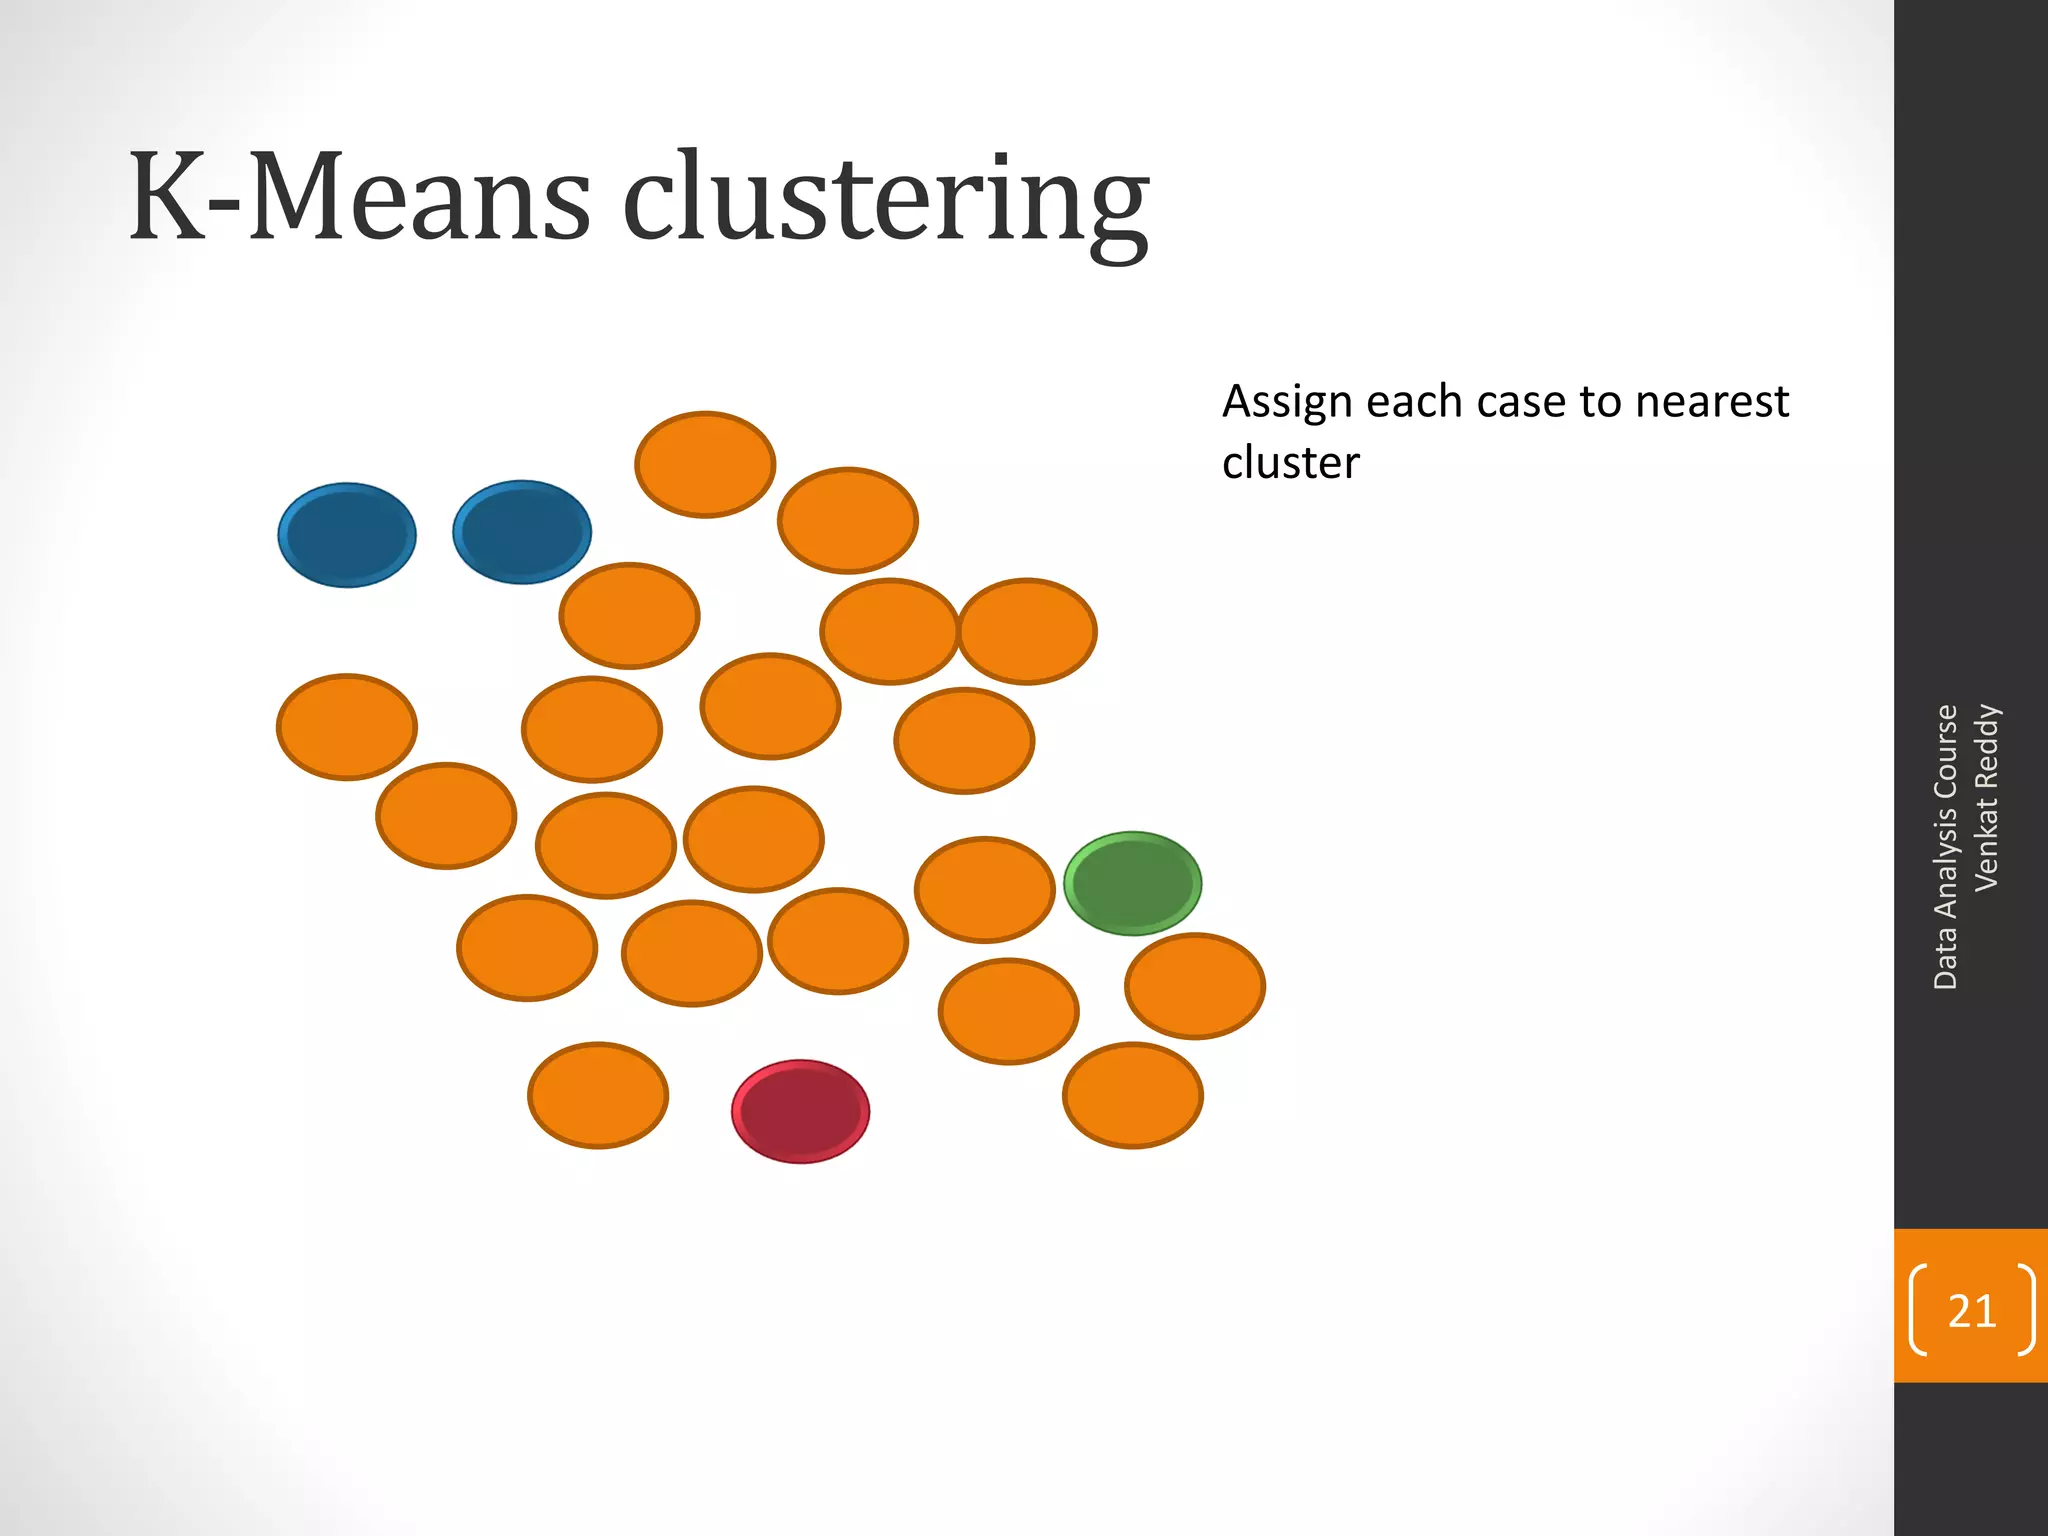
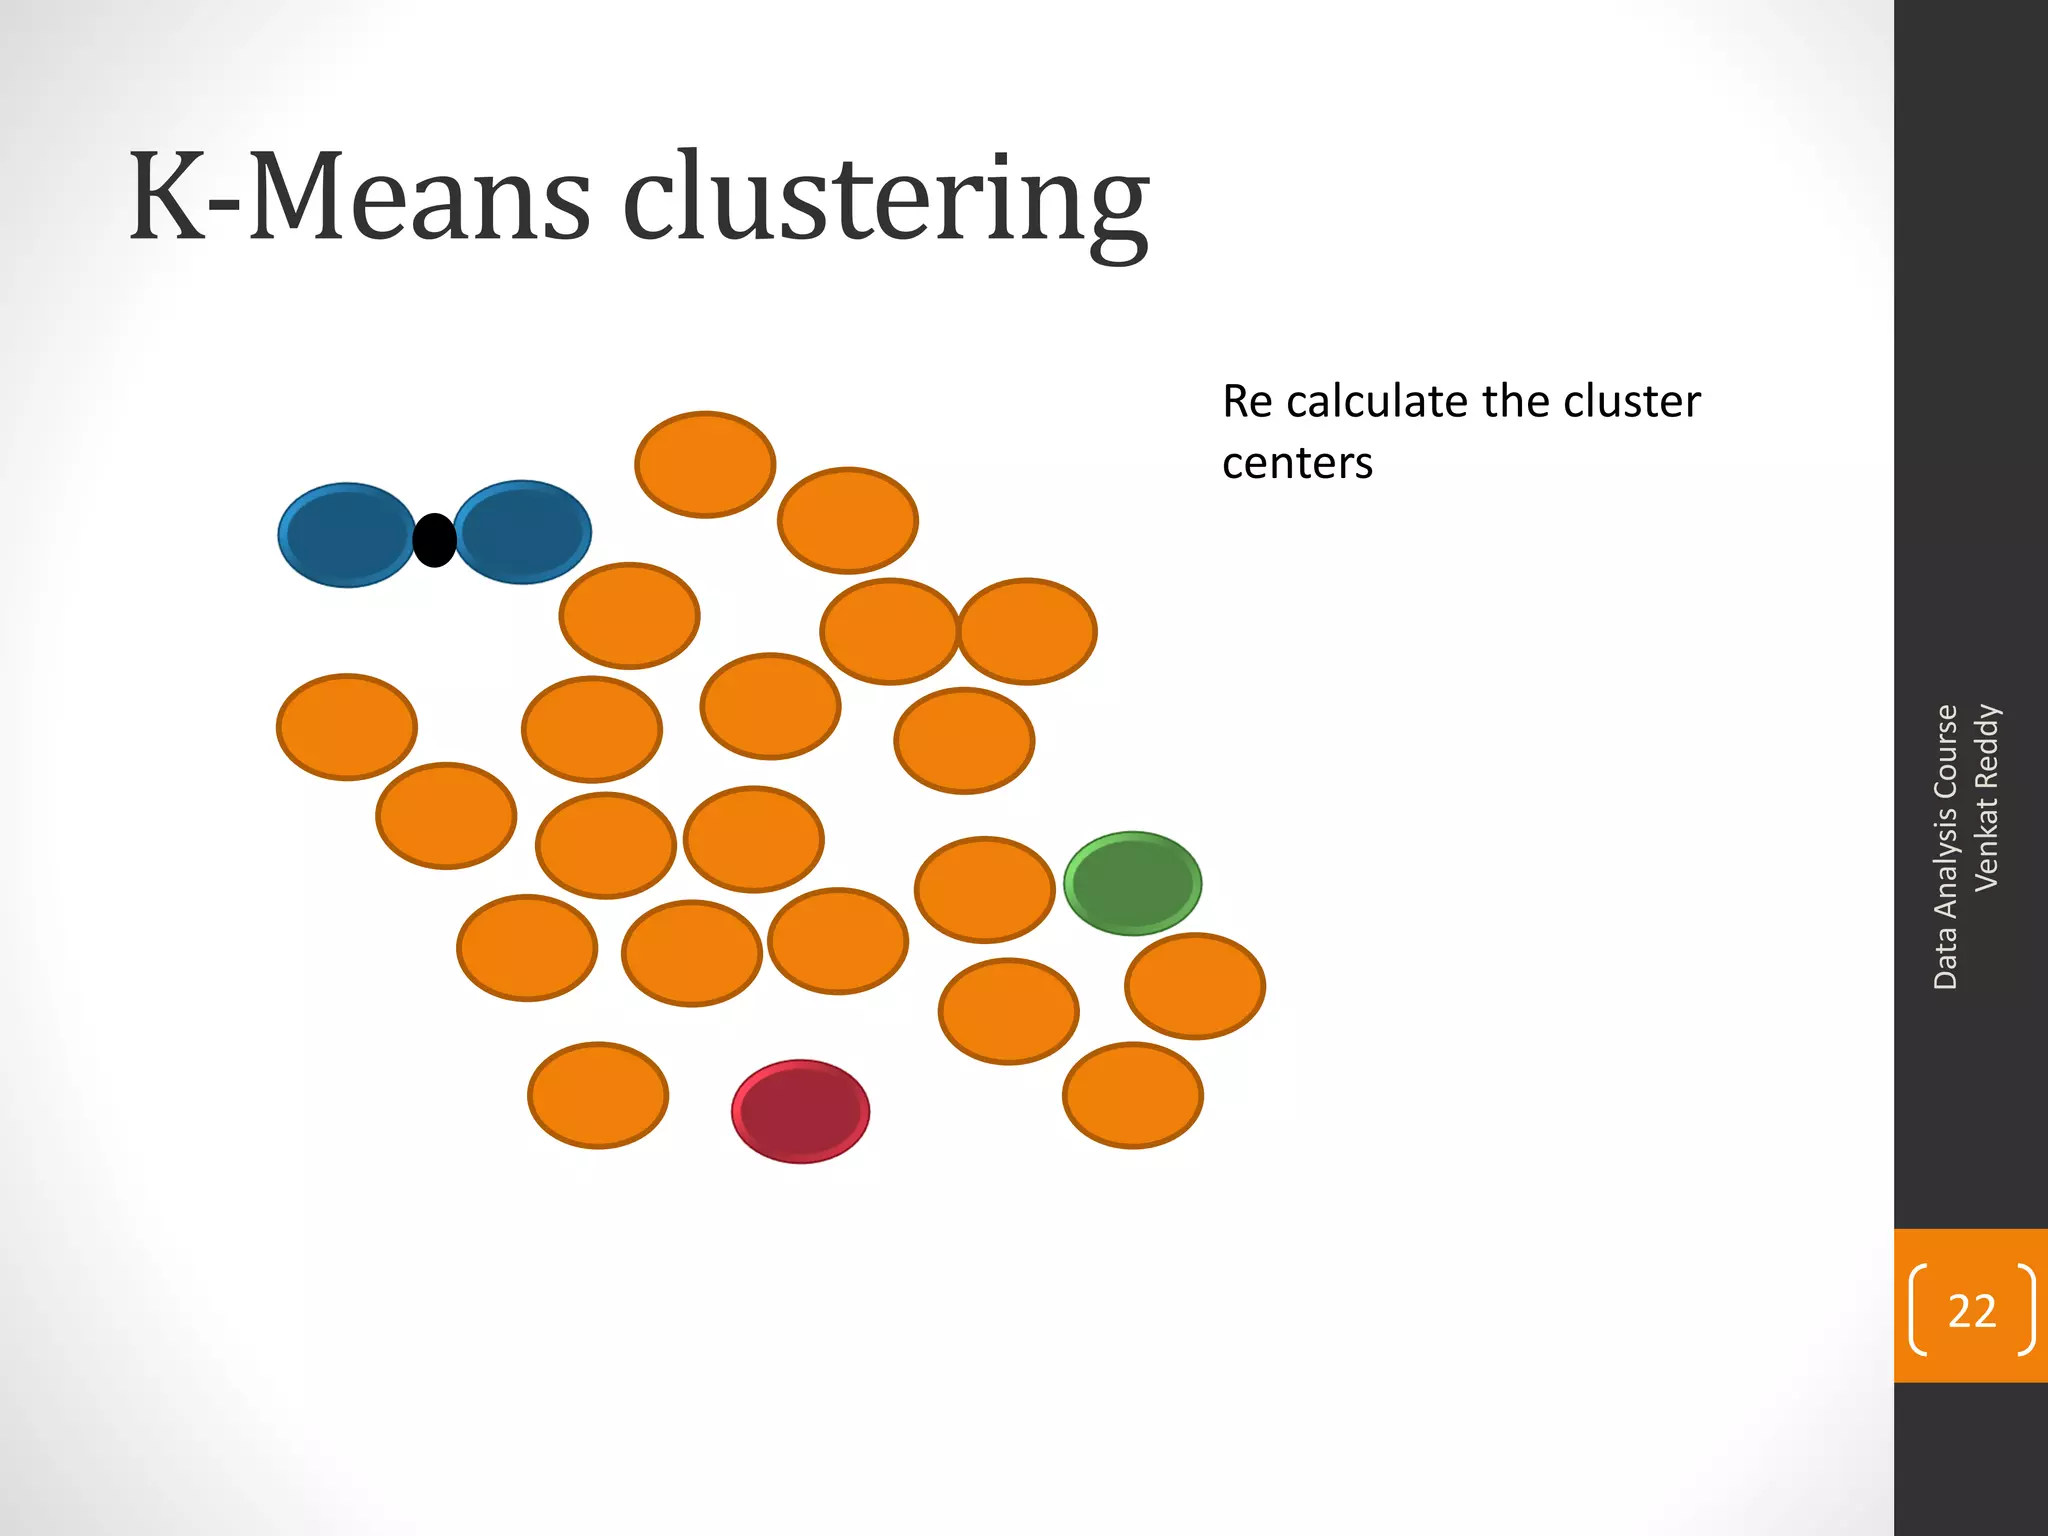
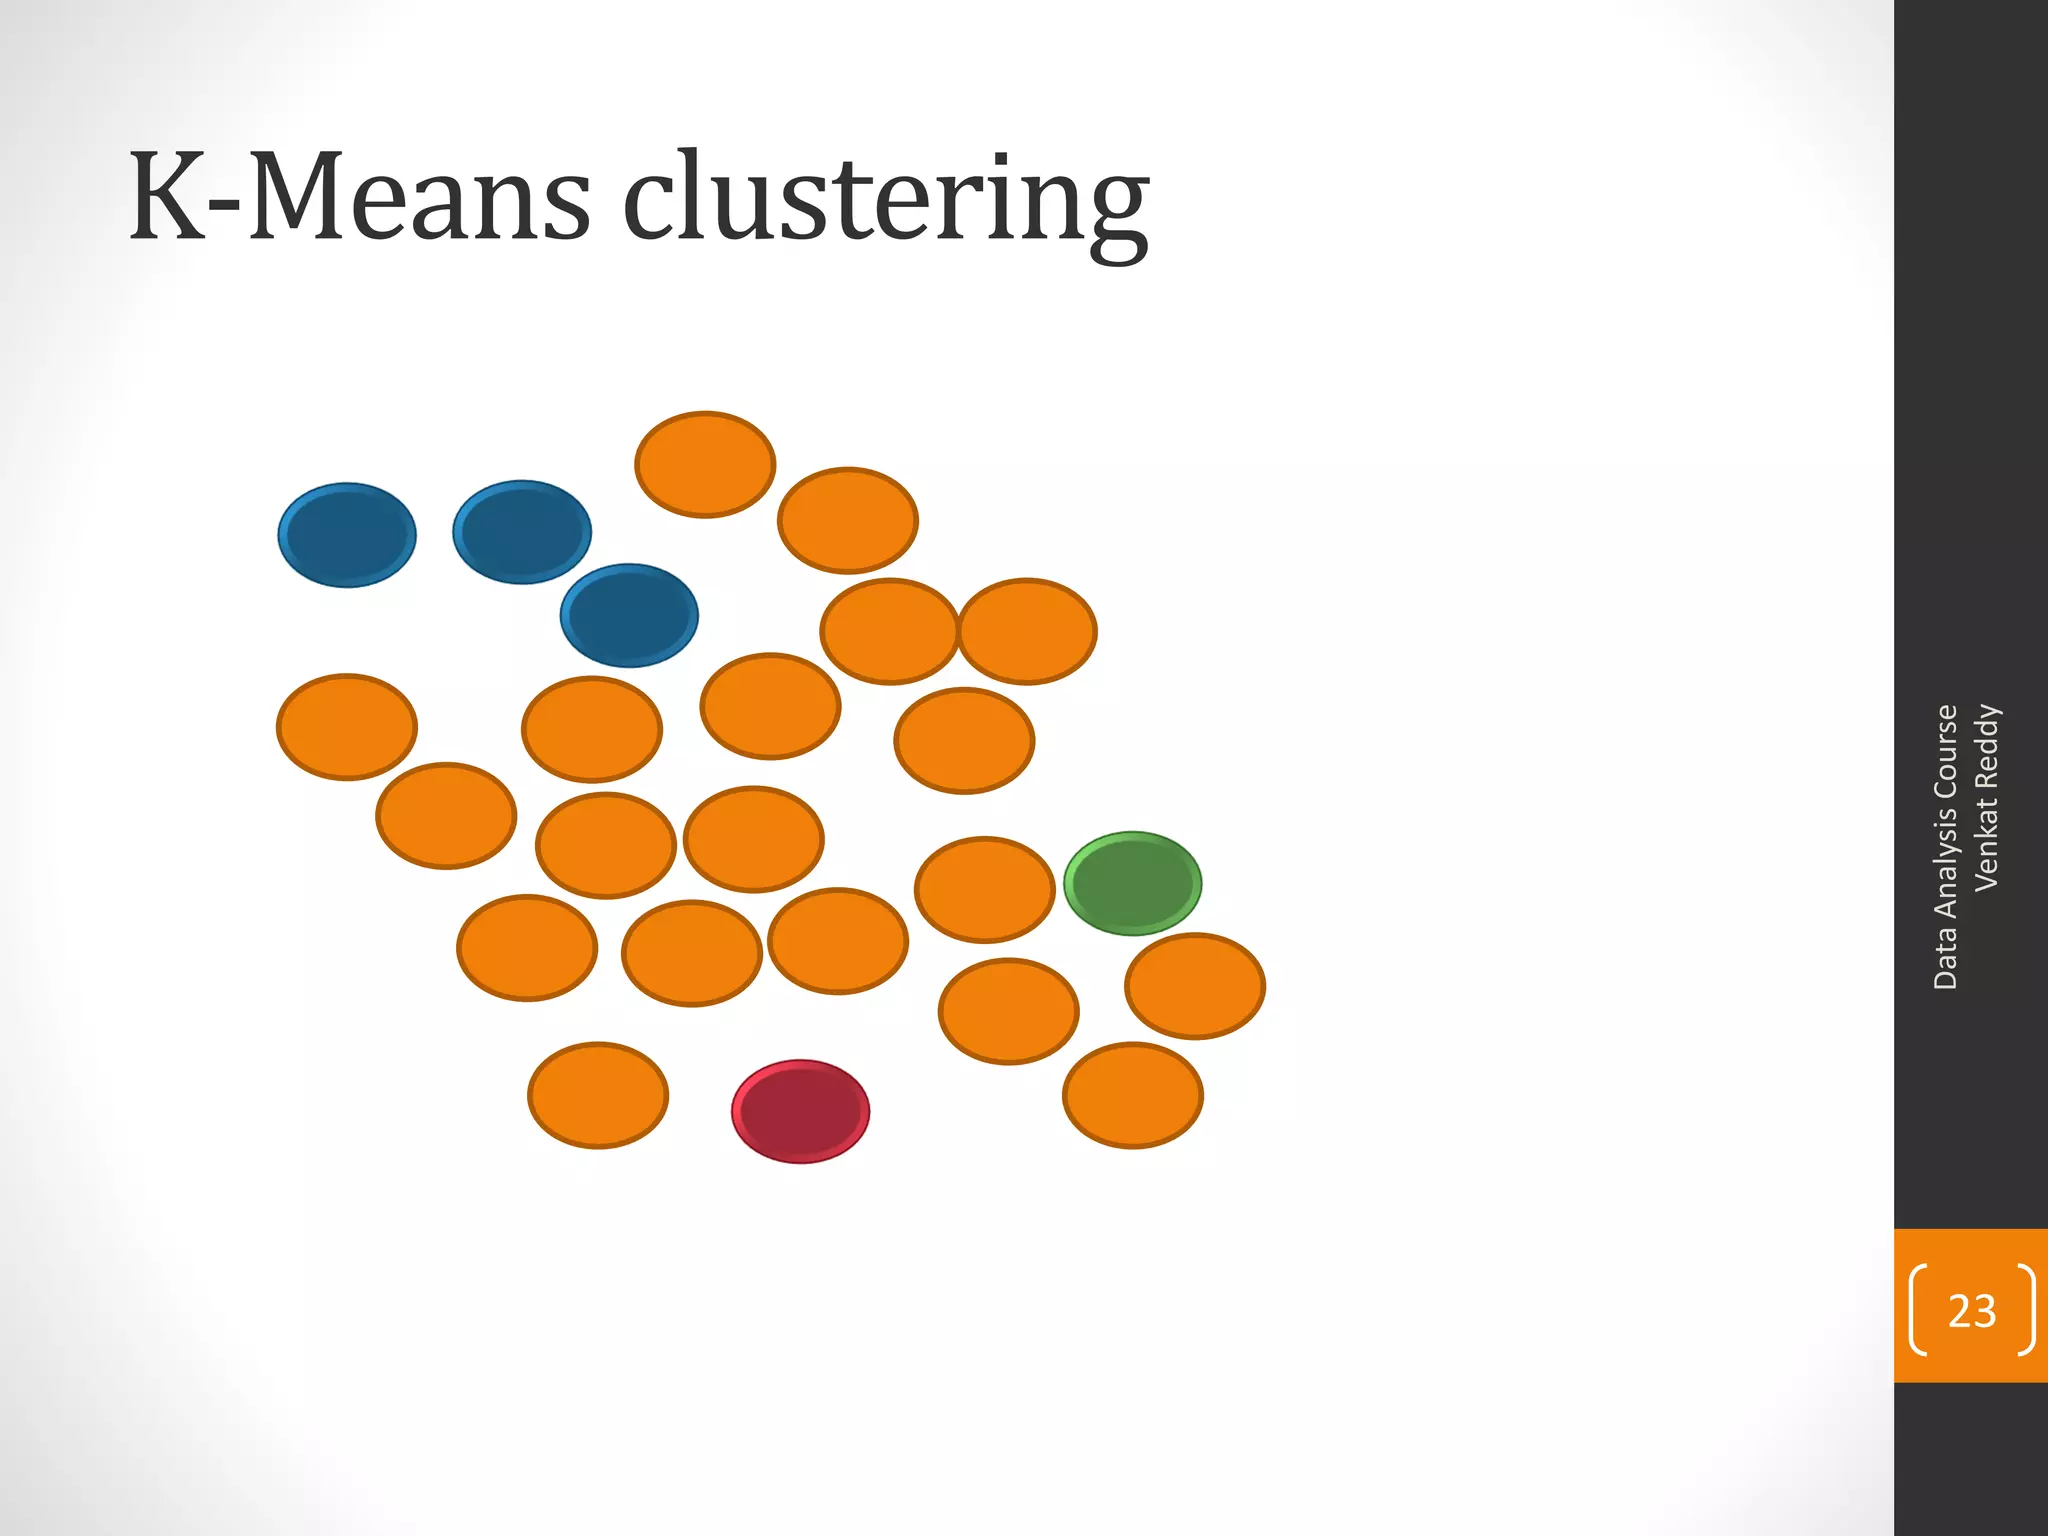
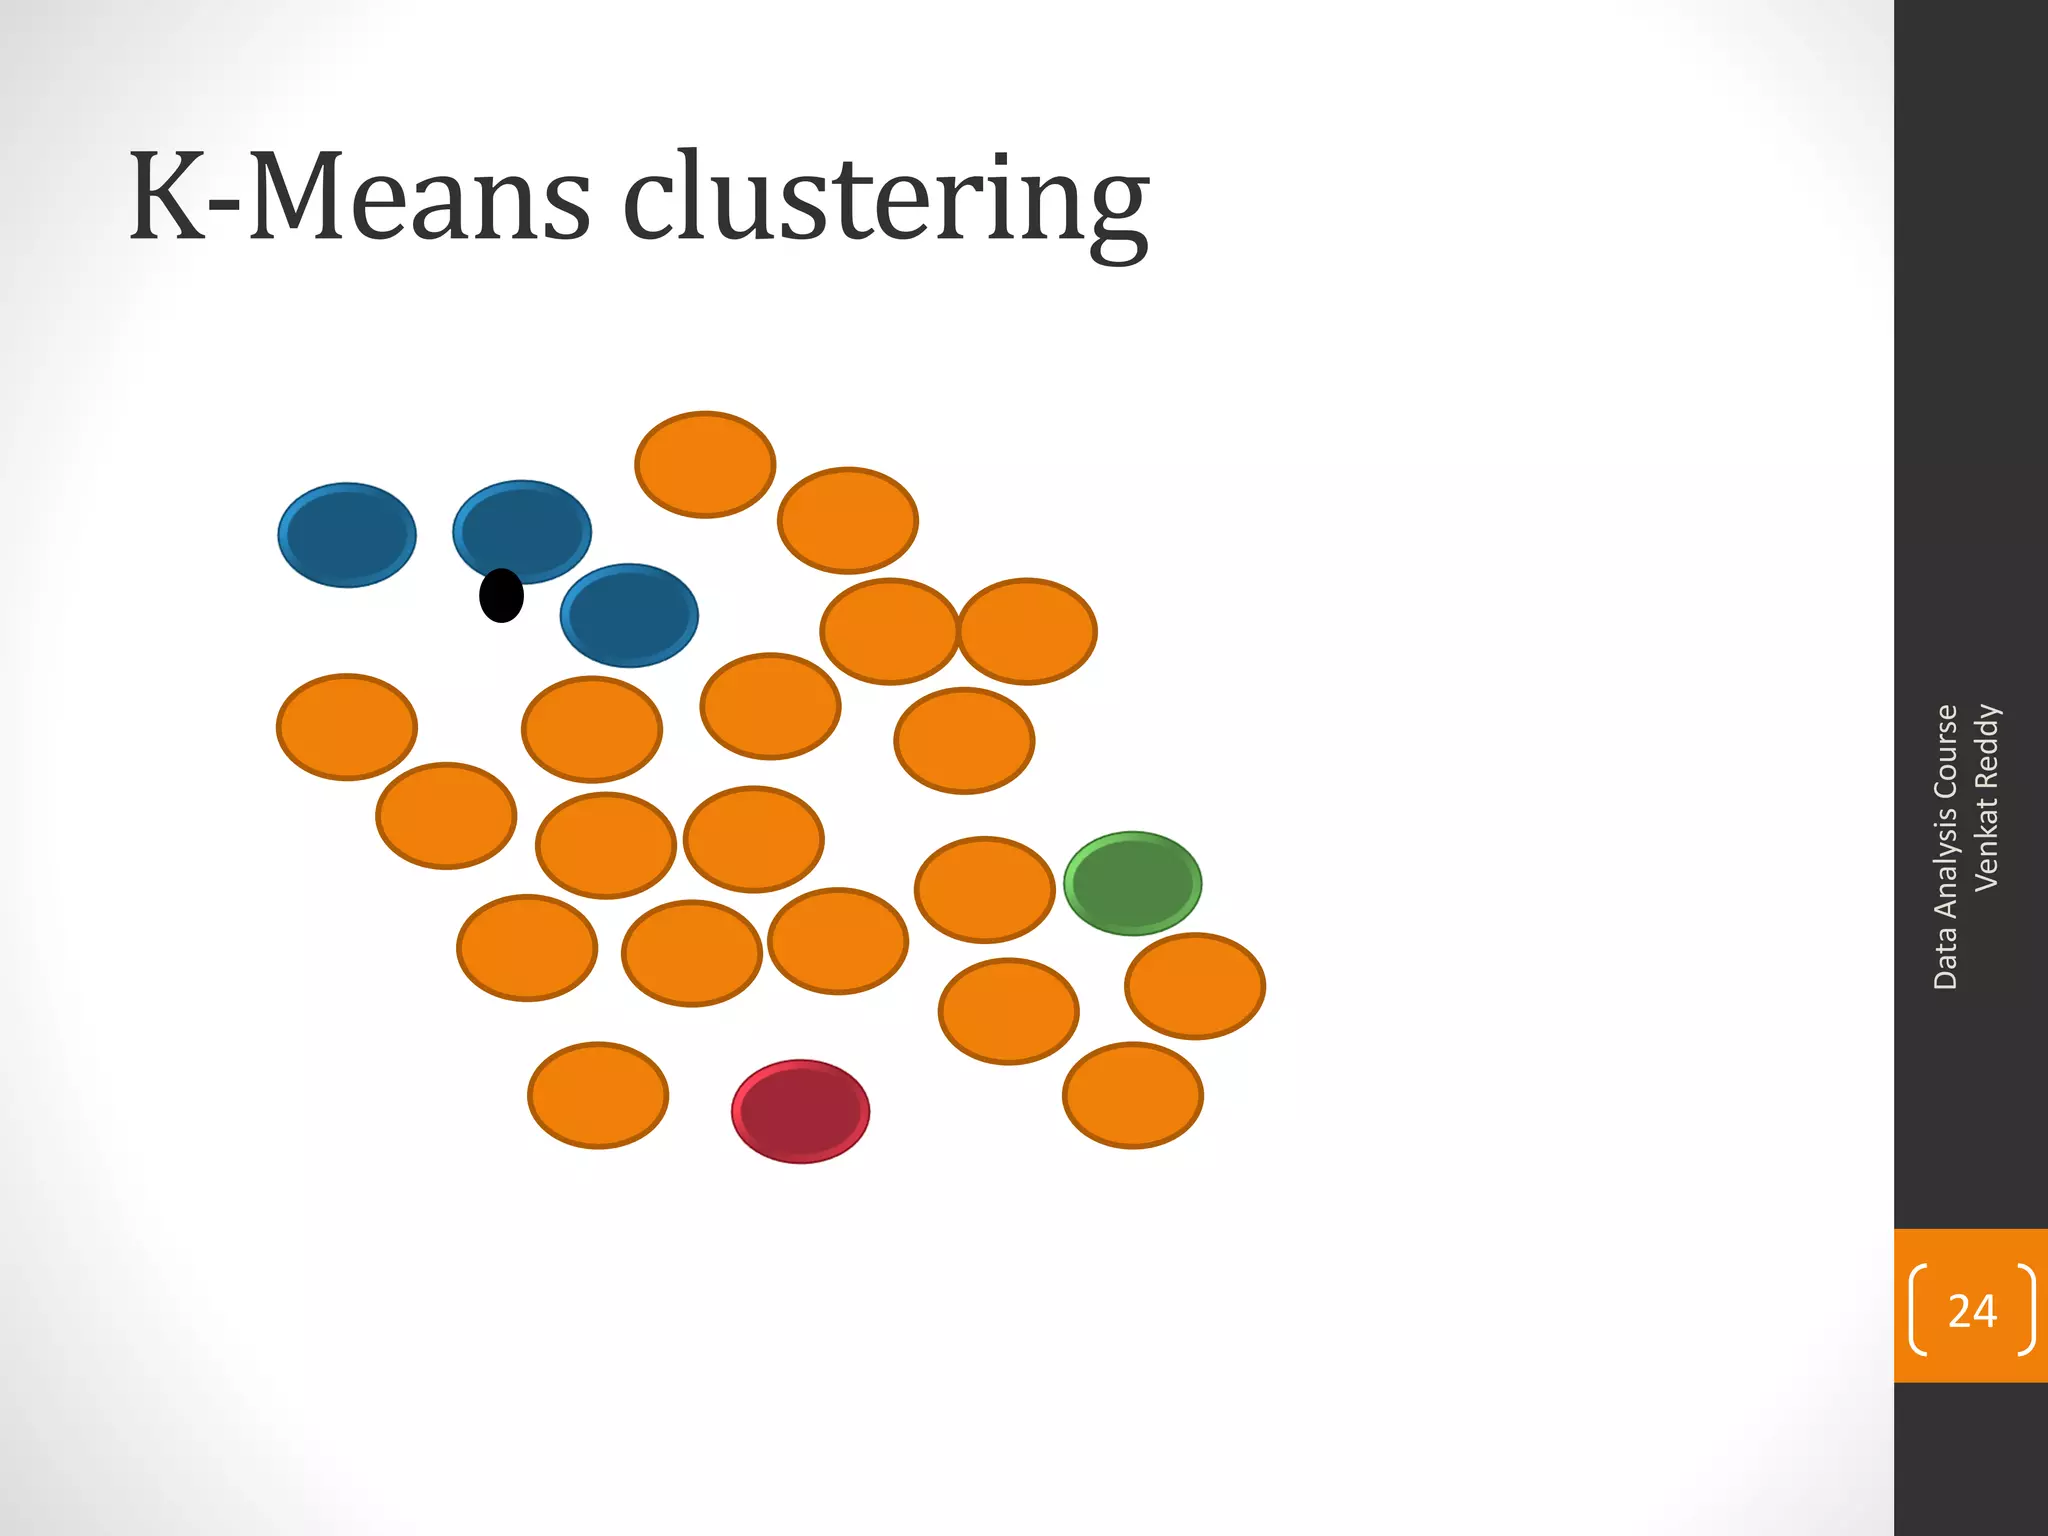

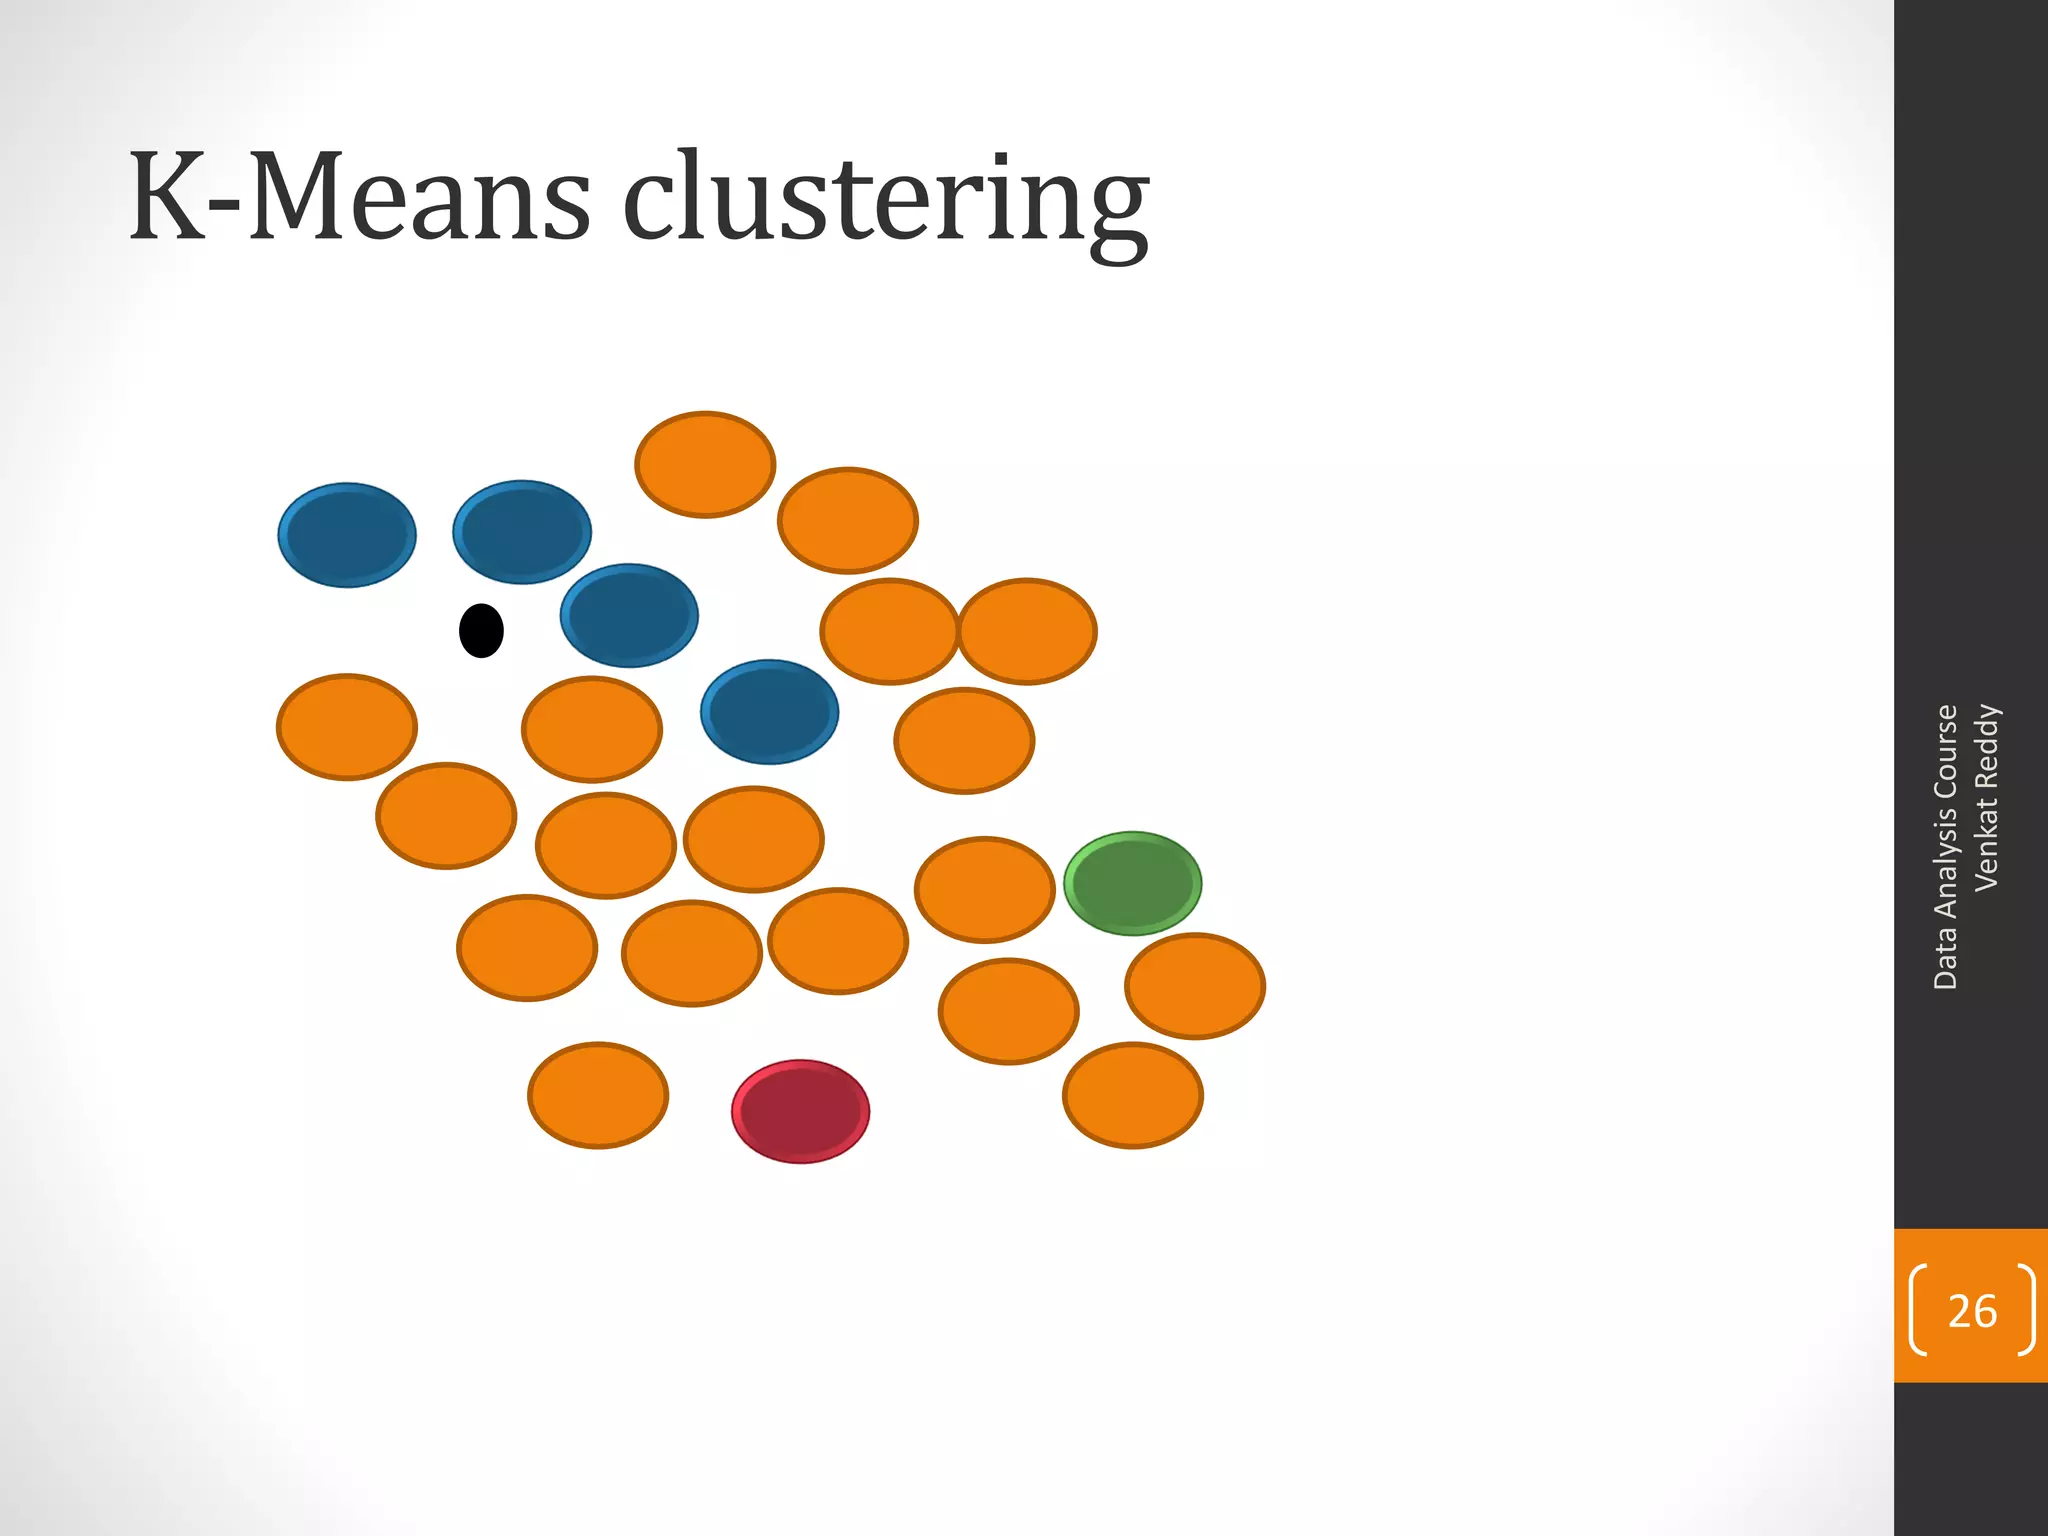

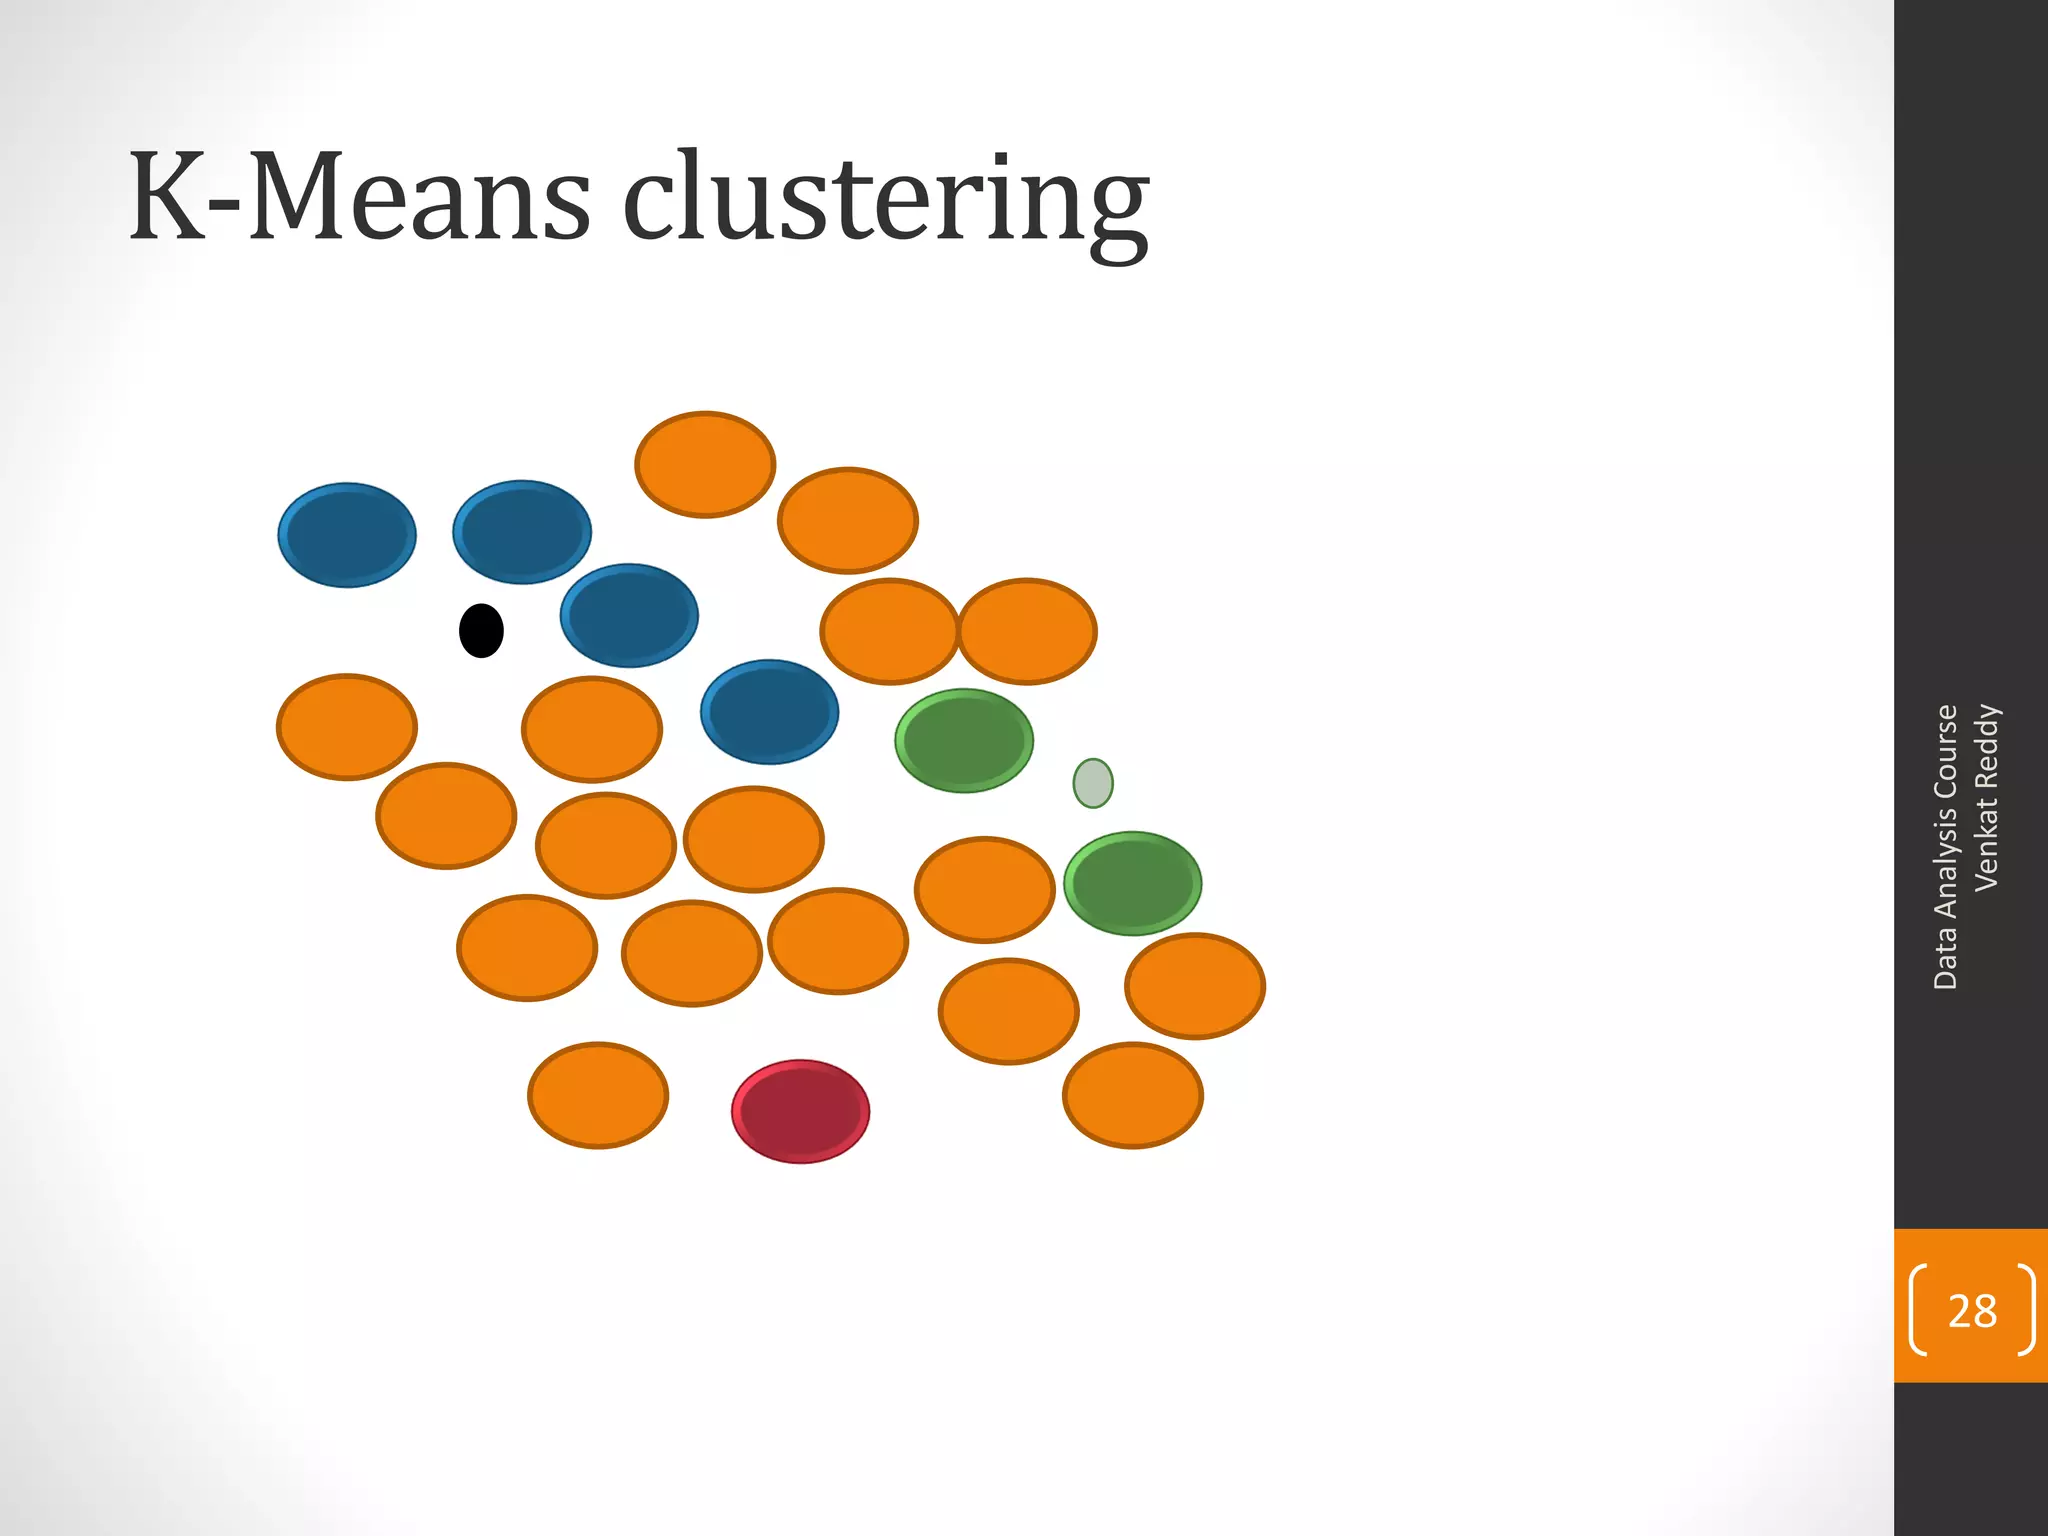
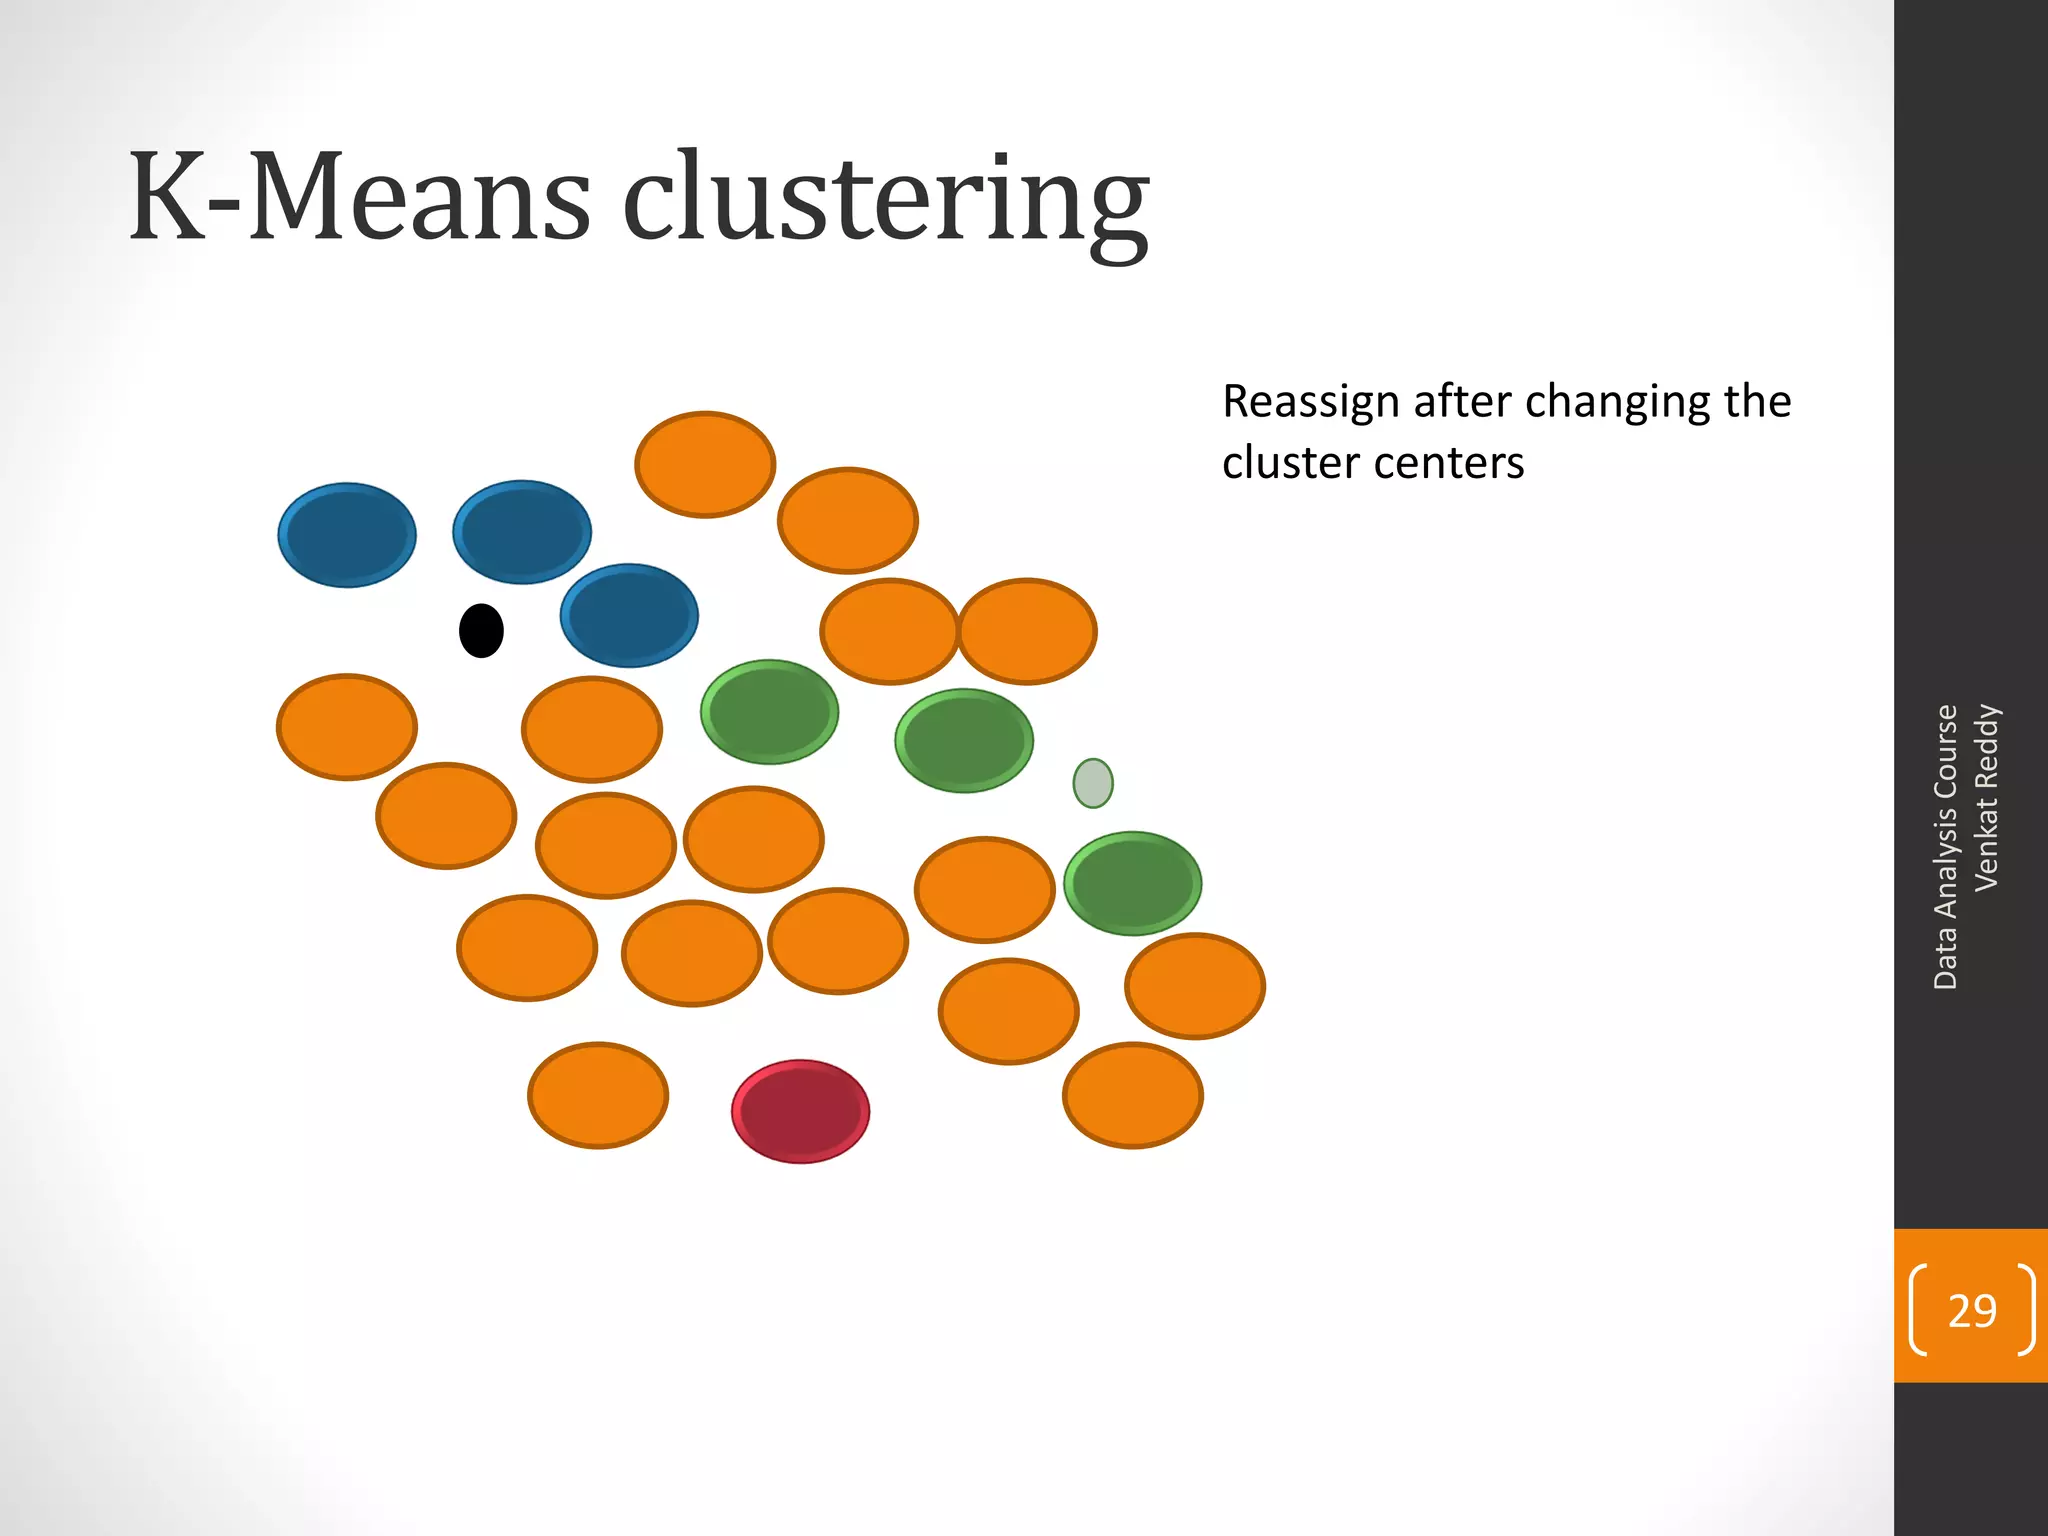

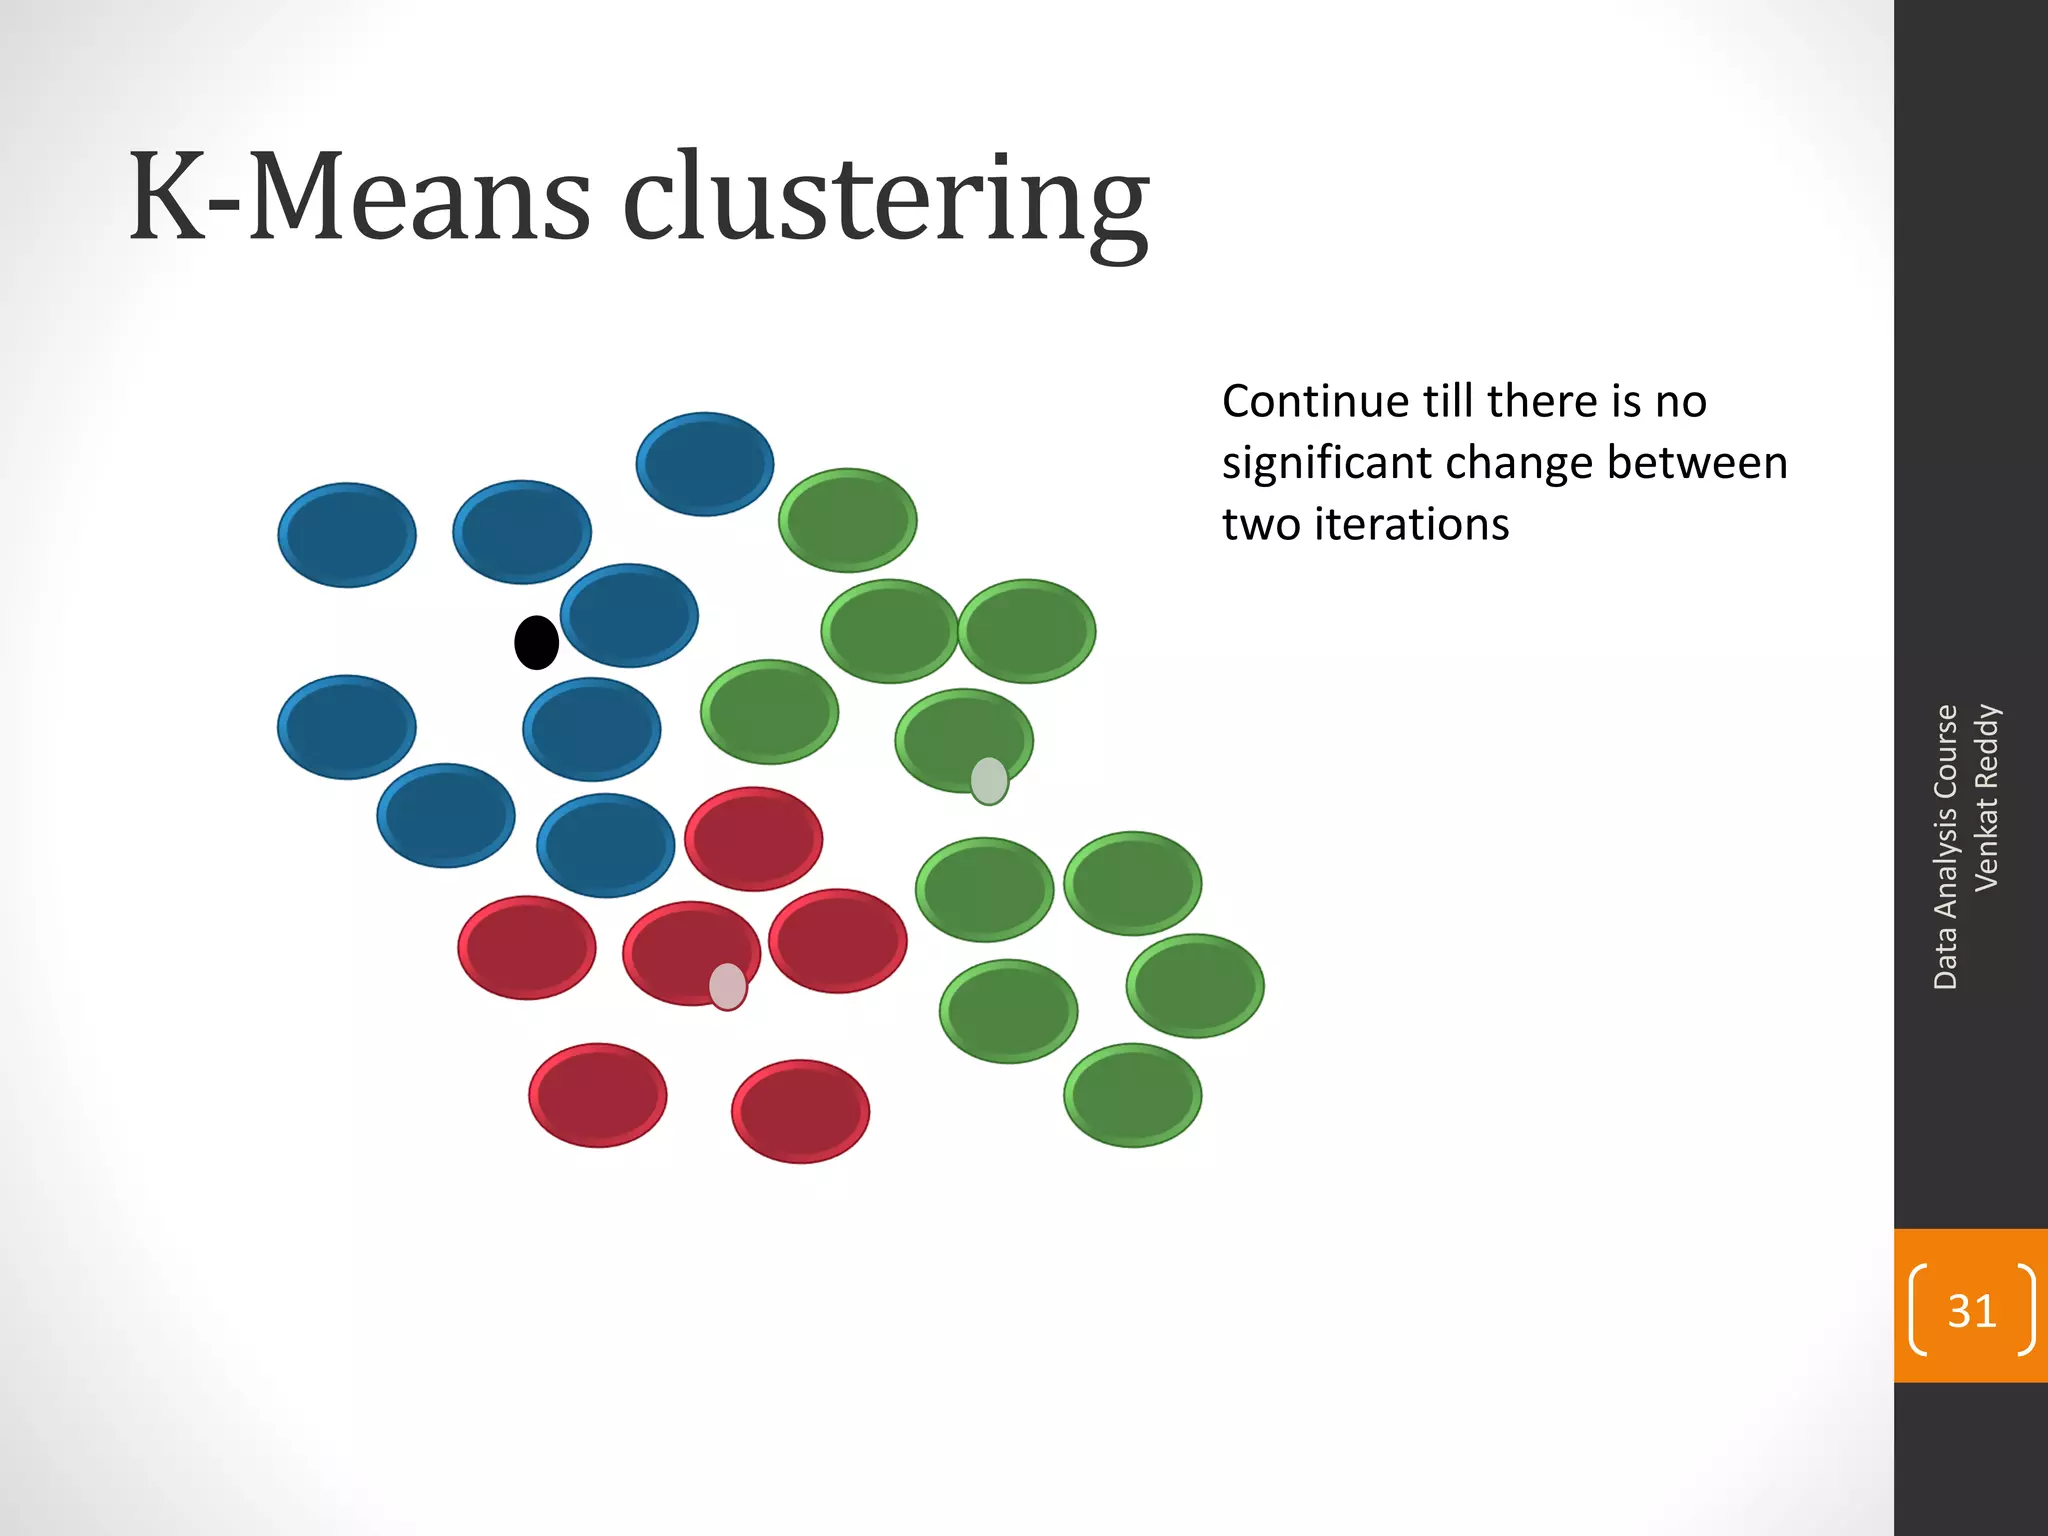

The document provides an overview of cluster analysis techniques. It discusses the need for segmentation to group large populations into meaningful subsets. Common clustering algorithms like k-means are introduced, which assign data points to clusters based on similarity. The document also covers calculating distances between observations, defining the distance between clusters, and interpreting the results of clustering analysis. Real-world applications of segmentation and clustering are mentioned such as market research, credit risk analysis, and operations management.