SlideShare a Scribd company logo
1 of 8
Download to read offline
Measuring Word Alignment Quality for
Statistical Machine Translation
Alexander Fraser Daniel Marcu∗
University of Southern California University of Southern California
Automatic word alignment plays a critical role in statistical machine translation. Unfor-
tunately the relationship between alignment quality and statistical machine translation perfor-
mance has not been well understood. In the recent literature the alignment task has frequently
been decoupled from the translation task, and assumptions have been made about measuring
alignment quality for machine translation which, it turns out, are not justified. In particular,
none of the tens of papers published over the last five years has shown that significant decreases
in Alignment Error Rate, AER (Och and Ney, 2003), result in significant increases in trans-
lation quality. This paper explains this state of affairs and presents steps towards measuring
alignment quality in a way which is predictive of statistical machine translation quality.
1. Introduction
Word alignment is the problem of determining translational correspondence at the word
level given a corpus of parallel sentences. Automatic word alignment (Brown et al.,
1993) has received extensive treatment in the literature as it is a vital component of all
statistical machine translation approaches. However, the relationship between word
alignment quality and statistical machine translation quality has not been explained.
There have been a number of research papers presented from 2000 to 2005 at ACL,
NAACL, HLT, COLING, WPT03, WPT05, etc, outlining techniques for attempting to
increase word alignment quality. Despite this high level of interest, none of these has
been shown to result in a large gain in translation performance.
We confirm experimentally that previous metrics do not predict MT performance
well and develop a methodology for measuring alignment quality which is predictive
of statistical machine translation (SMT) quality. Unfortunately our findings invalidate
the evaluations and conclusions of much of the recent work on word alignment which
has relied on previous metrics such as AER.
2. Experimental Methodology
2.1 Data
To build an SMT system we require a bitext and a word alignment of that bitext, as well
as language models built from target language data. In all of our experiments, we will
hold the bitext and target language resources constant, and only vary how we construct
the word alignment.
The gold standard word alignment sets we use have been manually annotated us-
ing links between words showing translational correspondence. Links which must be
present in a hypothesized alignment in order for it be to correct are called “Sure” links.
Some of the alignment sets also have links which are not “Sure” links but are “Possible”
∗ USC/ISI - Natural Language Group, 4676 Admiralty Way, Suite 1001, Marina del Rey, CA 90292-6601.
Email: fraser at isi.edu, marcu at isi.edu
c ISI-University of Southern California
ISI-University of Southern California ISI-TR-616
links (Och and Ney, 2003). The intuition for links that are “Possible” but not “Sure”1
is
that such links may be present but need not be present.
We evaluate the translation quality of SMT systems by translating a held-out trans-
lation test set and evaluating our hypothesized translations against one or more refer-
ence translations using BLEU (Papineni et al., 2001). We also have an additional held-
out translation set which we call the Maximum BLEU set, which is employed by the
MT system to train the weights of its log-linear model to the final performance crite-
rion (Och, 2003). We work with data sets for three different language pairs, examining
French to English, Arabic to English, and Romanian to English translation tasks.
The training data for the French/English data set is taken from the LDC Canadian
Hansard data set, from which the word aligned data (presented in (Och and Ney, 2003))
was also taken. The English side of the bitext is 67.4 million words. We used a separate
Canadian Hansard data set (released by ISI) as the source of the translation test set and
the Maximum BLEU set. We evaluate two different tasks using this data, a medium task
where 1/8 of the data (8.4 million English words) is used as the fixed bitext, and a large
task where all of the data is used as the fixed bitext. The gold standard word alignments
have 4376 Sure Links and 19,222 Possible links.
The Arabic/English training corpus is the data used for the NIST 2004 machine
translation evaluation 2
. The English side of the bitext is 99.3 million words. The Maxi-
mum BLEU set is the “NIST 2002 Dry Run”, while the test set is the “NIST 2003 evalua-
tion set”. We have annotated gold standard alignments for 100 parallel sentences using
Sure links, following the Blinker guidelines (Melamed, 1998) which calls for Sure links
only (there were 2,154 sure links). Here we also examine a medium task using 1/8 of
the data (12.4 million English words) and a large task using all of the data.
The Romanian/English training data was used for the tasks on Romanian/English
alignment at WPT03 (Mihalcea and Pederson, 2003) and WPT05 (Martin, Mihalcea, and
Pedersen, 2005). We carefully removed two sections of news bitext for training Maxi-
mum BLEU and testing MT quality. The English side of the training corpus is 964,000
words. The alignment set is the first 148 annotated sentences used for the 2003 task
(there were 3,181 Sure links).
2.2 Measuring Translation Quality Changes Caused By Alignment
In consecutive word phrasal SMT (Koehn, Och, and Marcu, 2003) the knowledge sources
which vary with the word alignment are the phrase translation lexicon (which maps
source phrases to target phrases using counts from the word alignment) and some of
the word level translation parameters (sometimes called lexical smoothing). However,
many knowledge sources are used which do not vary with the final word alignment,
such as rescoring with IBM Model 1, N-gram language models and the length penalty
(these are constant in our experiments).
In our experiments, we use a state of the art phrase-based system, similar to (Koehn,
Och, and Marcu, 2003). The weights of the different knowledge sources in the log-linear
model used by our system are trained using the Maximum BLEU training algorithm
defined by Och (2003). For all of our experiments, we use two language models, one
built using the target language training data and the other built using additional news
data. We run Maximum BLEU for 25 iterations individually for each system.
1“Sure” links are by definition also “Possible”.
2http://www.nist.gov/speech/tests/summaries/2004/mt04.htm
2
Measuring Word Alignment Quality for Statistical Machine Translation Fraser and Marcu
2.3 Generating Alignments of Varying Quality
We have observed in the past that generative models used for statistical word alignment
create alignments of increasing quality as they are exposed to more data. The intuition
behind this is simple; as more cooccurrences of source and targets words are observed,
the word alignments are better. Following this intuition, if we wish to increase the
quality of a word alignment, we allow the alignment process access to extra data which
is used only during the alignment process and then removed. If we wish to decrease
the quality of a word alignment, we divide the bitext into pieces and align the pieces
independently of one another, finally concatenating the results together.
To generate word alignments, we follow the current state of the art, using GIZA++
(Och and Ney, 2003), which implements both the IBM Models of (Brown et al., 1993) and
the HMM model (Vogel, Ney, and Tillmann, 1996). We use IBM Model 1, the Aachen
HMM, and IBM Model 4 in that order (these models “bootstrap” from one another).
The output of these models is an alignment of the bitext which projects one language to
another. In this approach, GIZA++ is run end-to-end twice. In one case we project the
source language to the target language, and in the other we project the target language
to the source language. The output of GIZA++ is then post-processed using “sym-
metrization heuristics”. We use three symmetrization heuristics described in (Och and
Ney, 2003). We evaluate our approaches using these three heuristics because we would
like to account for alignments generated in different fashions. These three approaches
have been used as the baselines in virtually all of the recent work on automatic word
alignment, and most of the best SMT systems use these techniques as well.
3. Word Alignment Quality Metrics
One challenge for working with alignment systems is measuring the quality of a hy-
pothesized alignment. Alignment quality can be compared by building state of the art
SMT systems where only the alignment of a fixed bitext is allowed to vary. But this is
a slow way to evaluate. It would be desirable to have a fast intrinsic metric of align-
ment quality to use for system development, and to use as a criterion for discriminative
training of more sophisticated alignment models.
3.1 Alignment Error Rate is an Inadequate Measure of Alignment Quality
We begin our study of metrics for word alignment quality by testing Alignment Error
Rate (AER) (Och and Ney, 2003). AER requires a gold standard manually annotated
set of “Sure” links and “Possible” links (referred to as S and P). “Sure” links are used
for measuring Recall, and “Possible” links are used for measuring Precision. Given a
hypothesized alignment consisting of the link set A, three measures are defined:
Precision(A, P) =
|P ∩ A|
|A|
(1)
Recall(A, S) =
|S ∩ A|
|S|
(2)
AER(A, P, S) = 1 −
|P ∩ A| + |S ∩ A|
|S| + |A|
(3)
In our graphs, we will present 1 − AER so that we have an accuracy measure. We
first aligned the bitext itself. We took the medium French/English training set and broke
it into pieces corresponding to 1/16, 1/8, 1/4 and 1/2 of the medium set to generate
artificially degraded alignments. We used 2, 4, and 8 times the medium data to generate
3
ISI-University of Southern California ISI-TR-616
artificially enhanced alignments. The graph in Figure 1 shows the correlation of 1−AER
with machine translation quality, measured by BLEU. For the “fractional” data sizes, the
average AER of the “fractional” alignments is used (ie, for 1/16, we calculate AER 16
times, once for each piece). High correlation would look like a line from the bottom
left corner to the top right corner. As can be seen by looking at the graph, there is low
correlation between 1 − AER and the BLEU score. A concise mathematical description
of correlation is the coefficient of determination (r2
), which is the square of the Pearson
product-moment correlation coefficient (r). Here, r2
= 0.12, which is low3
.
One reason that the correlation is low is because of what we believe to be a signif-
icant shortcoming of AER which to our knowledge has not been previously reported.
(Och and Ney, 2003) states that AER is derived from F-Measure. But AER does not share
a very important property of F-Measure, which is that unbalanced precision and recall
are penalized, in many scenarios where S ⊂ P (ie, we make the Sure versus Possible
distinction, instead of annotating all links as Sure). This is easy to show algebraically
using an example. We first define the measure “F-Measure with Sure and Possible” us-
ing Och and Ney’s Precision and Recall formulae together with the standard F-Measure
formula (Manning and Schuetze, 1999). In the F-Measure formula, there is a parame-
ter α which sets the trade-off between Precision and Recall. When an equal trade-off is
desired, α is set to 0.5.
F-measure with Sure and Possible(A, P, S, α) =
1
α
Precision(A,P )
+ (1−α)
Recall(A,S)
(4)
We compare two hypothesized alignments where |A|, the number of hypothesized
alignment links, is the same, for instance, |A| = 100. Let |S| = 100.
In the first case, let |P ∩ A| = 50 and |S ∩ A| = 50. Precision is 0.50 and Recall is
0.50. In the second case, let |P ∩ A| = 75 and |S ∩ A| = 25. Precision is 0.75 and Recall
is 0.25.
The basic property of F-Measure, if we set α equal to 0.5, is that unbalanced preci-
sion and recall should be penalized. The first hypothesized alignment has an F-Measure
with Sure and Possible score of 0.50. The second hypothesized alignment has a worse
score, 0.375. This shows that if we use the formula for F-Measure with Sure and Possi-
ble, unbalanced precision and recall are correctly penalized.
However, if we substitute the relevant values into the formula for AER, we see
that 1 − AER for both of the hypothesized alignments is 0.5. Therefore AER does not
share the property of F-Measure (with α = 0.5) that unbalanced precision and recall
are penalized. Because of this, it is possible to maximize AER by favoring precision
over recall, which can be done by simply guessing very few alignment links. This is
not a problem if S = P because the two quantities |P ∩ A| and |S ∩ A| are the same.
Unfortunately when S ⊂ P this leads to strong biases which makes AER not useful.
If we examine the graph in Figure 2, we see that F-Measure with Sure and Possible
has some predictive power for the data points of a particular heuristic, but the overall
correlation independent of heuristic is low, r2
= 0.21. We need a measure which pre-
dicts BLEU without having a dependency on the way the alignments were generated.
3.2 Balanced F-Measure is Better, but Still Inadequate
We wondered whether the low correlation was caused by the Sure and Possible distinc-
tion. We reannotated the first 110 sentences of the 484 sentence test set using the Blinker
3r2 can be thought of as a percentage of correlation. It does not show the direction of correlation. All
correlations in this work are positive correlations.
4
Measuring Word Alignment Quality for Statistical Machine Translation Fraser and Marcu
guidelines (there were 2,292 Sure links). We define F-Measure without the Sure versus
Possible distinction (ie, all links are Sure) in Equation 5. This measure has been exten-
sively used with other word alignment test sets. Figure 3 shows the results. Correlation
is higher, r2
= 0.64.
F-measure(A, S, α) =
1
α
Precision(A,S)
+ (1−α)
Recall(A,S)
(5)
3.3 Varying the Trade-off Between Precision and Recall leads to Good Measurement
of Quality
We then hypothesized that the trade-off between precision and recall is important. This
is controlled in both F-Measure formulae by the constant α. We search α = 0, 0.1, 0.2, ..., 1.0.
The best results are: α = 0.3 for the original annotation annotated with Sure and Possi-
ble (see Figure 4), and α = 0.6 for the first 110 sentences as annotated by us (see Figure
5)4
. The relevant r2
scores were 0.84 and 0.93 respectively. With a good α setting, we
are able to predict the resulting machine translation quality reasonably well.
For the original annotation, recall is more important, while for our annotation, pre-
cision is more important5
. Our results suggest that higher correlation will be achieved
when using the Blinker Sure-only annotation style than with the original annotation
style which used Sure and Possible links.
We then decided to try this using the medium Arabic training set. See figure 6
which shows the results for the best setting α = 0.2, for which r2
= 0.92. This is
again a good correlation and shows that F-Measure is effective in predicting machine
translation quality for this set.
We tested our techniques with the larger corpora mentioned in Section 2.1. For the
large French/English corpus the best results are with α = 0.3 for the original annota-
tion of 484 sentences and α = 0.7 for the new annotation of 110 sentences with Sure
links (see Figure 7). Relevant r2
scores were the same, at 0.64 and 0.64 respectively.
Disappointingly, our measures are not able to fully explain resulting MT quality for the
large French/English task. This may be caused by interactions between the size of the
phrasal lexicons extracted and the settings used for the search for the best translation
hypothesis (such as probabilistic and histogram beams (Koehn, Och, and Marcu, 2003))
at these large data sizes.
For the large Arabic/English corpus, the results were better, the best correlation was
with α = 0.2, for which r2
= 0.89, see Figure 8. For the large Arabic/English task, we
can predict resulting MT quality. It is worth noting that the Arabic/English translation
task and data set has been tested in conjunction with our translation system over a long
period, but the French/English translation task and data has not. As a result, there may
be hidden factors that affect the performance of our MT system which only appear in
conjunction with the large French/English task.
We also tested a smaller corpus. One well-studied task is the Romanian/English
shared word alignment task from the Workshop on Parallel Text at ACL 2005 (Martin,
Mihalcea, and Pedersen, 2005). We again only decreased the quality of the alignments
and because the bitext is small only 5 data points for each symmetrization heuristic were
used. The best setting of α was α = 0.4, for which r2
= 0.87, showing that F-Measure is
effective for this task.
4We also checked the first 110 sentences using the original annotation to ensure that the differences
observed were not an effect of restricting our annotation to these sentences.
5α less than 0.5 weights recall higher, while α greater than 0.5 weights precision higher, see the F-
Measure formulae.
5
ISI-University of Southern California ISI-TR-616
26.5
27
27.5
28
28.5
29
29.5
0.76 0.78 0.8 0.82 0.84 0.86 0.88 0.9 0.92 0.94
BLEU
1 - AER
Refined
Union
Intersection
Figure 1
French 1 − AER versus BLEU, r2
= 0.12
26.5
27
27.5
28
28.5
29
29.5
0.8 0.82 0.84 0.86 0.88 0.9 0.92 0.94
BLEU
F-Measure with Sure and Possible
Refined
Union
Intersection
Figure 2
French F-Measure with Sure and Possible α = 0.5
versus BLEU, r2
= 0.21
26.5
27
27.5
28
28.5
29
29.5
0.6 0.62 0.64 0.66 0.68 0.7 0.72 0.74
BLEU
F-Measure
Refined
Union
Intersection
Figure 3
French F-Measure α = 0.5 versus BLEU, r2
= 0.64
26.5
27
27.5
28
28.5
29
29.5
0.86 0.87 0.88 0.89 0.9 0.91 0.92 0.93
BLEU
F-Measure with Sure and Possible
Refined
Union
Intersection
Figure 4
French F-Measure with Sure and Possible α = 0.3
versus BLEU, r2
= 0.84
26.5
27
27.5
28
28.5
29
29.5
0.64 0.66 0.68 0.7 0.72 0.74 0.76
BLEU
F-Measure
Refined
Union
Intersection
Figure 5
French F-Measure α = 0.6 versus BLEU, r2
= 0.93
28
30
32
34
36
38
40
42
44
46
0.25 0.3 0.35 0.4 0.45 0.5 0.55 0.6 0.65 0.7
BLEU
F-Measure
Refined
Union
Intersection
Figure 6
Arabic F-Measure α = 0.2 versus BLEU, r2
= 0.92
28
28.5
29
29.5
30
30.5
31
31.5
0.6 0.62 0.64 0.66 0.68 0.7 0.72 0.74 0.76 0.78
BLEU
F-Measure
Refined
Union
Intersection
Figure 7
Large French F-Measure α = 0.7 (110 sentences)
versus BLEU, r2
= 0.64
34
36
38
40
42
44
46
48
50
0.25 0.3 0.35 0.4 0.45 0.5 0.55 0.6 0.65 0.7
BLEU
F-Measure
Refined
Union
Intersection
Figure 8
Large Arabic F-Measure α = 0.2 (100 sentences)
versus BLEU, r2
= 0.89
6
Measuring Word Alignment Quality for Statistical Machine Translation Fraser and Marcu
4. Conclusion
We have presented an empirical study of the use of simple evaluation metrics based on
gold standard alignment of a small number of sentences to predict machine translation
quality. On the basis of our experiments we can now draw the following conclusions:
1. When S = P, AER does not share the important property of F-Measure that
unequal precision and recall are penalized, making it easy to obtain good AER
scores by simply guessing less alignment links. As a result we believe AER is
not a useful metric for predicting MT accuracy.
2. Good correlation was obtained for the medium French and Arabic data sets,
the large Arabic data set and the small Romanian data set. We have explained
most of the effect of alignment quality on these sets, and if we are given the
F-measure of a hypothesized word alignment for the bitext we can make a rea-
sonable prediction as to what the resulting BLEU score will be.
3. We have only partially explained the effect of alignment quality on BLEU for
the large French data set, and further investigation is warranted.
4. We recommend using the Blinker guidelines as a starting point for new align-
ment annotation efforts, and based on our results recommend that the Sure-only
annotation style outlined in that document be used. However, we believe our
results show that if a gold standard alignment set is already available which is
already annotated using the Sure versus Possible distinction, this will have only
slightly worse results.
5. While we have addressed measuring alignment quality for phrasal SMT, similar
work is now required to see how to measure alignment quality for other settings
of machine translation and for other tasks.
Our work invalidates the conclusions of recent alignment work which presented
only evaluations based on metrics like AER or balanced F-Measure, and explains the
lack of correlation in the few works which presented both such a metric and final MT
results. A good example of the former are our own results (Fraser and Marcu, 2005).
The work presented there had the highest balanced F-Measure scores for the Roma-
nian/English WPT05 shared task, but based on the findings here we do not know if our
alignments were the best for SMT quality, and it is possible that a different algorithm
tuned for the correct criterion would have had better MT performance. Other examples
include work relying on combining the Competitive Linking algorithm (Melamed, 2000)
with discriminative scoring functions (Cherry and Lin, 2003; Taskar, Lacoste-Julien, and
Klein, 2005). Competitive Linking usually results in higher precision and lower recall
than IBM Model 4 symmetrized using the “Refined” or “Union” heuristics, because it
enforces a constraint that each word has at most one translation correspondent. But we
showed that AER is broken in a way that favors precision in Section 3.1. It is therefore
likely that the results reported in these papers are affected by the AER bias and that the
corresponding improvements in AER score do not correlate with increases in phrasal
SMT performance. To avoid these problems we think that it is good practice to com-
pare alignment algorithms by measuring performance in an identified final task such
as machine translation. F-Measure with an appropriate setting of α will be useful dur-
ing the development process of new alignment models, or as a maximization criterion
for discriminative training of alignment models (Cherry and Lin, 2003; Liu, Liu, and
Lin, 2005; Fraser and Marcu, 2005; Ittycheriah and Roukos, 2005; Moore, 2005; Taskar,
Lacoste-Julien, and Klein, 2005).
7
ISI-University of Southern California ISI-TR-616
Acknowledgments
This work was supported by DARPA-ITO grant
NN66001-00-1-9814, NSF grant IIS-0326276 and
by the GALE program of the Defense Advanced
Research Projects Agency, Contract No. HR0011-
06-C-0022.
We would like to thank the USC Center for
High Performance Computing and Communi-
cations (HPCC).
References
Brown, Peter F., Stephen A. Della Pietra,
Vincent J. Della Pietra, and R. L. Mercer.
1993. The mathematics of statistical machine
translation: Parameter estimation.
Computational Linguistics, 19(2):263–311.
Cherry, Colin and Dekang Lin. 2003. A
probability model to improve word
alignment. In Proc. of the 41st Annual Meeting
of the Association for Computational Linguistics
(ACL), Sapporo, Japan, July.
Fraser, Alexander and Daniel Marcu. 2005.
Isi’s participation in the romanian-english
alignment task. In ACL 2005 Workshop on
Building and Using Parallel Texts: Data-Driven
Machine Translation and Beyond, Ann Arbor,
Michigan.
Ittycheriah, Abraham and Salim Roukos. 2005.
A maximum entropy word aligner for
Arabic-English machine translation. In Proc.
of Human Language Technology Conference and
Conference on Empirical Methods in Natural
Language Processing, Vancouver, British
Columbia, October.
Koehn, Philipp, Franz Josef Och, and Daniel
Marcu. 2003. Statistical phrase-based
translation. In Proceedings of the Human
Language Technology and North American
Association for Computational Linguistics
Conference (HLT/NAACL), pages 127–133,
Edmonton, Canada.
Liu, Yang, Qun Liu, and Shouxun Lin. 2005.
Log-linear models for word alignment. In
Proc. of the 43rd Annual Meeting of the
Association for Computational Linguistics
(ACL), pages 459–466, Ann Arbor, Michigan,
June.
Manning, Christopher D. and Hinrich
Schuetze. 1999. Foundations of Statistical
Natural Language Processing. MIT Press,
Cambridge, MA.
Martin, Joel, Rada Mihalcea, and Ted
Pedersen. 2005. Word alignment for
languages with scarce resources. In ACL
2005 Workshop on Building and Using Parallel
Texts: Data-Driven Machine Translation and
Beyond, Ann Arbor, Michigan, June.
Melamed, I. Dan. 1998. Manual annotation of
translational equivalence: The blinker
project. Technical Report 98-07, Institute for
Research in Cognitive Science, Philadelphia,
PA.
Melamed, I. Dan. 2000. Models of
translational equivalence among words.
Computational Linguistics, 26(2):221–249.
Mihalcea, Rada and Ted Pederson. 2003. An
evaluation exercise for word alignment. In
HLT-NAACL 2003 Workshop on Building and
Using Parallel Texts: Data Driven Machine
Translation and Beyond, Edmonton, Alberta,
July.
Moore, Robert C. 2005. A discriminative
framework for bilingual word alignment. In
Proc. of Human Language Technology
Conference and Conference on Empirical
Methods in Natural Language Processing,
Vancouver, British Columbia, October.
Och, Franz Josef. 2003. Minimum error rate
training in statistical machine translation. In
Proc. of the 41st Annual Meeting of the
Association for Computational Linguistics
(ACL), pages 160–167, Sapporo, Japan, July.
Och, Franz Josef and Hermann Ney. 2003. A
systematic comparison of various statistical
alignment models. Computational Linguistics,
29(1):19–51.
Papineni, Kishore A., Salim Roukos, Todd
Ward, and Wei-Jing Zhu. 2001. BLEU: a
method for automatic evaluation of machine
translation. Technical Report RC22176
(W0109-022), IBM Research Division,
Thomas J. Watson Research Center,
Yorktown Heights, NY, September.
Taskar, Ben, Simon Lacoste-Julien, and Dan
Klein. 2005. A discriminative matching
approach to word alignment. In Proc. of
Human Language Technology Conference and
Conference on Empirical Methods in Natural
Language Processing, Vancouver, British
Columbia, October.
Vogel, Stephan, Hermann Ney, and Christoph
Tillmann. 1996. HMM-based word
alignment in statistical translation. In
COLING ’96: The 16th Int. Conf. on
Computational Linguistics, pages 836–841,
Copenhagen, Denmark, August.
8

More Related Content

What's hot

Ijarcet vol-2-issue-7-2252-2257
Ijarcet vol-2-issue-7-2252-2257Ijarcet vol-2-issue-7-2252-2257
Ijarcet vol-2-issue-7-2252-2257Editor IJARCET
 
Cohesive Software Design
Cohesive Software DesignCohesive Software Design
Cohesive Software Designijtsrd
 
A SURVEY OF MARKOV CHAIN MODELS IN LINGUISTICS APPLICATIONS
A SURVEY OF MARKOV CHAIN MODELS IN LINGUISTICS APPLICATIONSA SURVEY OF MARKOV CHAIN MODELS IN LINGUISTICS APPLICATIONS
A SURVEY OF MARKOV CHAIN MODELS IN LINGUISTICS APPLICATIONScsandit
 
A SURVEY ON SIMILARITY MEASURES IN TEXT MINING
A SURVEY ON SIMILARITY MEASURES IN TEXT MINING A SURVEY ON SIMILARITY MEASURES IN TEXT MINING
A SURVEY ON SIMILARITY MEASURES IN TEXT MINING mlaij
 
Context Sensitive Relatedness Measure of Word Pairs
Context Sensitive Relatedness Measure of Word PairsContext Sensitive Relatedness Measure of Word Pairs
Context Sensitive Relatedness Measure of Word PairsIJCSIS Research Publications
 
STATISTICAL FUNCTION TAGGING AND GRAMMATICAL RELATIONS OF MYANMAR SENTENCES
STATISTICAL FUNCTION TAGGING AND GRAMMATICAL RELATIONS OF MYANMAR SENTENCESSTATISTICAL FUNCTION TAGGING AND GRAMMATICAL RELATIONS OF MYANMAR SENTENCES
STATISTICAL FUNCTION TAGGING AND GRAMMATICAL RELATIONS OF MYANMAR SENTENCEScscpconf
 
Compression-Based Parts-of-Speech Tagger for The Arabic Language
Compression-Based Parts-of-Speech Tagger for The Arabic LanguageCompression-Based Parts-of-Speech Tagger for The Arabic Language
Compression-Based Parts-of-Speech Tagger for The Arabic LanguageCSCJournals
 
THE ABILITY OF WORD EMBEDDINGS TO CAPTURE WORD SIMILARITIES
THE ABILITY OF WORD EMBEDDINGS TO CAPTURE WORD SIMILARITIESTHE ABILITY OF WORD EMBEDDINGS TO CAPTURE WORD SIMILARITIES
THE ABILITY OF WORD EMBEDDINGS TO CAPTURE WORD SIMILARITIESkevig
 
Reference Scope Identification of Citances Using Convolutional Neural Network
Reference Scope Identification of Citances Using Convolutional Neural NetworkReference Scope Identification of Citances Using Convolutional Neural Network
Reference Scope Identification of Citances Using Convolutional Neural NetworkSaurav Jha
 
Two Level Disambiguation Model for Query Translation
Two Level Disambiguation Model for Query TranslationTwo Level Disambiguation Model for Query Translation
Two Level Disambiguation Model for Query TranslationIJECEIAES
 
GENDER AND AUTHORSHIP CATEGORISATION OF ARABIC TEXT FROM TWITTER USING PPM
GENDER AND AUTHORSHIP CATEGORISATION OF ARABIC TEXT FROM TWITTER USING PPMGENDER AND AUTHORSHIP CATEGORISATION OF ARABIC TEXT FROM TWITTER USING PPM
GENDER AND AUTHORSHIP CATEGORISATION OF ARABIC TEXT FROM TWITTER USING PPMijcsit
 
PARSING OF MYANMAR SENTENCES WITH FUNCTION TAGGING
PARSING OF MYANMAR SENTENCES WITH FUNCTION TAGGINGPARSING OF MYANMAR SENTENCES WITH FUNCTION TAGGING
PARSING OF MYANMAR SENTENCES WITH FUNCTION TAGGINGkevig
 

What's hot (13)

Ijarcet vol-2-issue-7-2252-2257
Ijarcet vol-2-issue-7-2252-2257Ijarcet vol-2-issue-7-2252-2257
Ijarcet vol-2-issue-7-2252-2257
 
Cohesive Software Design
Cohesive Software DesignCohesive Software Design
Cohesive Software Design
 
A SURVEY OF MARKOV CHAIN MODELS IN LINGUISTICS APPLICATIONS
A SURVEY OF MARKOV CHAIN MODELS IN LINGUISTICS APPLICATIONSA SURVEY OF MARKOV CHAIN MODELS IN LINGUISTICS APPLICATIONS
A SURVEY OF MARKOV CHAIN MODELS IN LINGUISTICS APPLICATIONS
 
A SURVEY ON SIMILARITY MEASURES IN TEXT MINING
A SURVEY ON SIMILARITY MEASURES IN TEXT MINING A SURVEY ON SIMILARITY MEASURES IN TEXT MINING
A SURVEY ON SIMILARITY MEASURES IN TEXT MINING
 
Context Sensitive Relatedness Measure of Word Pairs
Context Sensitive Relatedness Measure of Word PairsContext Sensitive Relatedness Measure of Word Pairs
Context Sensitive Relatedness Measure of Word Pairs
 
STATISTICAL FUNCTION TAGGING AND GRAMMATICAL RELATIONS OF MYANMAR SENTENCES
STATISTICAL FUNCTION TAGGING AND GRAMMATICAL RELATIONS OF MYANMAR SENTENCESSTATISTICAL FUNCTION TAGGING AND GRAMMATICAL RELATIONS OF MYANMAR SENTENCES
STATISTICAL FUNCTION TAGGING AND GRAMMATICAL RELATIONS OF MYANMAR SENTENCES
 
Compression-Based Parts-of-Speech Tagger for The Arabic Language
Compression-Based Parts-of-Speech Tagger for The Arabic LanguageCompression-Based Parts-of-Speech Tagger for The Arabic Language
Compression-Based Parts-of-Speech Tagger for The Arabic Language
 
THE ABILITY OF WORD EMBEDDINGS TO CAPTURE WORD SIMILARITIES
THE ABILITY OF WORD EMBEDDINGS TO CAPTURE WORD SIMILARITIESTHE ABILITY OF WORD EMBEDDINGS TO CAPTURE WORD SIMILARITIES
THE ABILITY OF WORD EMBEDDINGS TO CAPTURE WORD SIMILARITIES
 
Reference Scope Identification of Citances Using Convolutional Neural Network
Reference Scope Identification of Citances Using Convolutional Neural NetworkReference Scope Identification of Citances Using Convolutional Neural Network
Reference Scope Identification of Citances Using Convolutional Neural Network
 
arttt.pdf
arttt.pdfarttt.pdf
arttt.pdf
 
Two Level Disambiguation Model for Query Translation
Two Level Disambiguation Model for Query TranslationTwo Level Disambiguation Model for Query Translation
Two Level Disambiguation Model for Query Translation
 
GENDER AND AUTHORSHIP CATEGORISATION OF ARABIC TEXT FROM TWITTER USING PPM
GENDER AND AUTHORSHIP CATEGORISATION OF ARABIC TEXT FROM TWITTER USING PPMGENDER AND AUTHORSHIP CATEGORISATION OF ARABIC TEXT FROM TWITTER USING PPM
GENDER AND AUTHORSHIP CATEGORISATION OF ARABIC TEXT FROM TWITTER USING PPM
 
PARSING OF MYANMAR SENTENCES WITH FUNCTION TAGGING
PARSING OF MYANMAR SENTENCES WITH FUNCTION TAGGINGPARSING OF MYANMAR SENTENCES WITH FUNCTION TAGGING
PARSING OF MYANMAR SENTENCES WITH FUNCTION TAGGING
 

Viewers also liked

Sy ti 2015-a_datalogger_bohorquez-ludena-ortiz
Sy ti 2015-a_datalogger_bohorquez-ludena-ortizSy ti 2015-a_datalogger_bohorquez-ludena-ortiz
Sy ti 2015-a_datalogger_bohorquez-ludena-ortizDataloger
 
Ci 350 project based learning
Ci 350   project based learningCi 350   project based learning
Ci 350 project based learningmiller909
 
Corrosión sección 01. Notas finales
Corrosión sección 01. Notas finales Corrosión sección 01. Notas finales
Corrosión sección 01. Notas finales Lialbert
 
Algoritmo Needleman-Wunsch
Algoritmo Needleman-WunschAlgoritmo Needleman-Wunsch
Algoritmo Needleman-WunschMarcos Castro
 

Viewers also liked (8)

Sy ti 2015-a_datalogger_bohorquez-ludena-ortiz
Sy ti 2015-a_datalogger_bohorquez-ludena-ortizSy ti 2015-a_datalogger_bohorquez-ludena-ortiz
Sy ti 2015-a_datalogger_bohorquez-ludena-ortiz
 
Doa yang dijawab
Doa yang dijawabDoa yang dijawab
Doa yang dijawab
 
Ci 350 project based learning
Ci 350   project based learningCi 350   project based learning
Ci 350 project based learning
 
Futbol
FutbolFutbol
Futbol
 
Moral agama
Moral agamaMoral agama
Moral agama
 
Don'Elephant
Don'ElephantDon'Elephant
Don'Elephant
 
Corrosión sección 01. Notas finales
Corrosión sección 01. Notas finales Corrosión sección 01. Notas finales
Corrosión sección 01. Notas finales
 
Algoritmo Needleman-Wunsch
Algoritmo Needleman-WunschAlgoritmo Needleman-Wunsch
Algoritmo Needleman-Wunsch
 

Similar to Measuring Word Alignment Quality for Statistical Machine Translation Performance

ACL-WMT2013.A Description of Tunable Machine Translation Evaluation Systems i...
ACL-WMT2013.A Description of Tunable Machine Translation Evaluation Systems i...ACL-WMT2013.A Description of Tunable Machine Translation Evaluation Systems i...
ACL-WMT2013.A Description of Tunable Machine Translation Evaluation Systems i...Lifeng (Aaron) Han
 
COLING 2012 - LEPOR: A Robust Evaluation Metric for Machine Translation with ...
COLING 2012 - LEPOR: A Robust Evaluation Metric for Machine Translation with ...COLING 2012 - LEPOR: A Robust Evaluation Metric for Machine Translation with ...
COLING 2012 - LEPOR: A Robust Evaluation Metric for Machine Translation with ...Lifeng (Aaron) Han
 
A COMPARISON OF DOCUMENT SIMILARITY ALGORITHMS
A COMPARISON OF DOCUMENT SIMILARITY ALGORITHMSA COMPARISON OF DOCUMENT SIMILARITY ALGORITHMS
A COMPARISON OF DOCUMENT SIMILARITY ALGORITHMSgerogepatton
 
A COMPARISON OF DOCUMENT SIMILARITY ALGORITHMS
A COMPARISON OF DOCUMENT SIMILARITY ALGORITHMSA COMPARISON OF DOCUMENT SIMILARITY ALGORITHMS
A COMPARISON OF DOCUMENT SIMILARITY ALGORITHMSgerogepatton
 
A Pilot Study On Computer-Aided Coreference Annotation
A Pilot Study On Computer-Aided Coreference AnnotationA Pilot Study On Computer-Aided Coreference Annotation
A Pilot Study On Computer-Aided Coreference AnnotationDarian Pruitt
 
SemEval-2012 Task 6: A Pilot on Semantic Textual Similarity
SemEval-2012 Task 6: A Pilot on Semantic Textual SimilaritySemEval-2012 Task 6: A Pilot on Semantic Textual Similarity
SemEval-2012 Task 6: A Pilot on Semantic Textual Similaritypathsproject
 
THE ABILITY OF WORD EMBEDDINGS TO CAPTURE WORD SIMILARITIES
THE ABILITY OF WORD EMBEDDINGS TO CAPTURE WORD SIMILARITIESTHE ABILITY OF WORD EMBEDDINGS TO CAPTURE WORD SIMILARITIES
THE ABILITY OF WORD EMBEDDINGS TO CAPTURE WORD SIMILARITIESkevig
 
EMPLOYING PIVOT LANGUAGE TECHNIQUE THROUGH STATISTICAL AND NEURAL MACHINE TRA...
EMPLOYING PIVOT LANGUAGE TECHNIQUE THROUGH STATISTICAL AND NEURAL MACHINE TRA...EMPLOYING PIVOT LANGUAGE TECHNIQUE THROUGH STATISTICAL AND NEURAL MACHINE TRA...
EMPLOYING PIVOT LANGUAGE TECHNIQUE THROUGH STATISTICAL AND NEURAL MACHINE TRA...ijnlc
 
Conceptual similarity measurement algorithm for domain specific ontology[
Conceptual similarity measurement algorithm for domain specific ontology[Conceptual similarity measurement algorithm for domain specific ontology[
Conceptual similarity measurement algorithm for domain specific ontology[Zac Darcy
 
TSD2013.AUTOMATIC MACHINE TRANSLATION EVALUATION WITH PART-OF-SPEECH INFORMATION
TSD2013.AUTOMATIC MACHINE TRANSLATION EVALUATION WITH PART-OF-SPEECH INFORMATIONTSD2013.AUTOMATIC MACHINE TRANSLATION EVALUATION WITH PART-OF-SPEECH INFORMATION
TSD2013.AUTOMATIC MACHINE TRANSLATION EVALUATION WITH PART-OF-SPEECH INFORMATIONLifeng (Aaron) Han
 
Conceptual Similarity Measurement Algorithm For Domain Specific Ontology
Conceptual Similarity Measurement Algorithm For Domain Specific OntologyConceptual Similarity Measurement Algorithm For Domain Specific Ontology
Conceptual Similarity Measurement Algorithm For Domain Specific OntologyZac Darcy
 
Unsupervised Quality Estimation Model for English to German Translation and I...
Unsupervised Quality Estimation Model for English to German Translation and I...Unsupervised Quality Estimation Model for English to German Translation and I...
Unsupervised Quality Estimation Model for English to German Translation and I...Lifeng (Aaron) Han
 
EVALUATION OF SEMANTIC ANSWER SIMILARITY METRICS
EVALUATION OF SEMANTIC ANSWER SIMILARITY METRICSEVALUATION OF SEMANTIC ANSWER SIMILARITY METRICS
EVALUATION OF SEMANTIC ANSWER SIMILARITY METRICSkevig
 
EVALUATION OF SEMANTIC ANSWER SIMILARITY METRICS
EVALUATION OF SEMANTIC ANSWER SIMILARITY METRICSEVALUATION OF SEMANTIC ANSWER SIMILARITY METRICS
EVALUATION OF SEMANTIC ANSWER SIMILARITY METRICSkevig
 
amta-decision-trees.doc Word document
amta-decision-trees.doc Word documentamta-decision-trees.doc Word document
amta-decision-trees.doc Word documentbutest
 
A survey of Stemming Algorithms for Information Retrieval
A survey of Stemming Algorithms for Information RetrievalA survey of Stemming Algorithms for Information Retrieval
A survey of Stemming Algorithms for Information Retrievaliosrjce
 

Similar to Measuring Word Alignment Quality for Statistical Machine Translation Performance (20)

ACL-WMT2013.A Description of Tunable Machine Translation Evaluation Systems i...
ACL-WMT2013.A Description of Tunable Machine Translation Evaluation Systems i...ACL-WMT2013.A Description of Tunable Machine Translation Evaluation Systems i...
ACL-WMT2013.A Description of Tunable Machine Translation Evaluation Systems i...
 
Ceis 3
Ceis 3Ceis 3
Ceis 3
 
COLING 2012 - LEPOR: A Robust Evaluation Metric for Machine Translation with ...
COLING 2012 - LEPOR: A Robust Evaluation Metric for Machine Translation with ...COLING 2012 - LEPOR: A Robust Evaluation Metric for Machine Translation with ...
COLING 2012 - LEPOR: A Robust Evaluation Metric for Machine Translation with ...
 
A COMPARISON OF DOCUMENT SIMILARITY ALGORITHMS
A COMPARISON OF DOCUMENT SIMILARITY ALGORITHMSA COMPARISON OF DOCUMENT SIMILARITY ALGORITHMS
A COMPARISON OF DOCUMENT SIMILARITY ALGORITHMS
 
A COMPARISON OF DOCUMENT SIMILARITY ALGORITHMS
A COMPARISON OF DOCUMENT SIMILARITY ALGORITHMSA COMPARISON OF DOCUMENT SIMILARITY ALGORITHMS
A COMPARISON OF DOCUMENT SIMILARITY ALGORITHMS
 
A Pilot Study On Computer-Aided Coreference Annotation
A Pilot Study On Computer-Aided Coreference AnnotationA Pilot Study On Computer-Aided Coreference Annotation
A Pilot Study On Computer-Aided Coreference Annotation
 
SemEval-2012 Task 6: A Pilot on Semantic Textual Similarity
SemEval-2012 Task 6: A Pilot on Semantic Textual SimilaritySemEval-2012 Task 6: A Pilot on Semantic Textual Similarity
SemEval-2012 Task 6: A Pilot on Semantic Textual Similarity
 
THE ABILITY OF WORD EMBEDDINGS TO CAPTURE WORD SIMILARITIES
THE ABILITY OF WORD EMBEDDINGS TO CAPTURE WORD SIMILARITIESTHE ABILITY OF WORD EMBEDDINGS TO CAPTURE WORD SIMILARITIES
THE ABILITY OF WORD EMBEDDINGS TO CAPTURE WORD SIMILARITIES
 
EMPLOYING PIVOT LANGUAGE TECHNIQUE THROUGH STATISTICAL AND NEURAL MACHINE TRA...
EMPLOYING PIVOT LANGUAGE TECHNIQUE THROUGH STATISTICAL AND NEURAL MACHINE TRA...EMPLOYING PIVOT LANGUAGE TECHNIQUE THROUGH STATISTICAL AND NEURAL MACHINE TRA...
EMPLOYING PIVOT LANGUAGE TECHNIQUE THROUGH STATISTICAL AND NEURAL MACHINE TRA...
 
P13 corley
P13 corleyP13 corley
P13 corley
 
Conceptual similarity measurement algorithm for domain specific ontology[
Conceptual similarity measurement algorithm for domain specific ontology[Conceptual similarity measurement algorithm for domain specific ontology[
Conceptual similarity measurement algorithm for domain specific ontology[
 
TSD2013.AUTOMATIC MACHINE TRANSLATION EVALUATION WITH PART-OF-SPEECH INFORMATION
TSD2013.AUTOMATIC MACHINE TRANSLATION EVALUATION WITH PART-OF-SPEECH INFORMATIONTSD2013.AUTOMATIC MACHINE TRANSLATION EVALUATION WITH PART-OF-SPEECH INFORMATION
TSD2013.AUTOMATIC MACHINE TRANSLATION EVALUATION WITH PART-OF-SPEECH INFORMATION
 
Conceptual Similarity Measurement Algorithm For Domain Specific Ontology
Conceptual Similarity Measurement Algorithm For Domain Specific OntologyConceptual Similarity Measurement Algorithm For Domain Specific Ontology
Conceptual Similarity Measurement Algorithm For Domain Specific Ontology
 
Unsupervised Quality Estimation Model for English to German Translation and I...
Unsupervised Quality Estimation Model for English to German Translation and I...Unsupervised Quality Estimation Model for English to German Translation and I...
Unsupervised Quality Estimation Model for English to German Translation and I...
 
EVALUATION OF SEMANTIC ANSWER SIMILARITY METRICS
EVALUATION OF SEMANTIC ANSWER SIMILARITY METRICSEVALUATION OF SEMANTIC ANSWER SIMILARITY METRICS
EVALUATION OF SEMANTIC ANSWER SIMILARITY METRICS
 
EVALUATION OF SEMANTIC ANSWER SIMILARITY METRICS
EVALUATION OF SEMANTIC ANSWER SIMILARITY METRICSEVALUATION OF SEMANTIC ANSWER SIMILARITY METRICS
EVALUATION OF SEMANTIC ANSWER SIMILARITY METRICS
 
amta-decision-trees.doc Word document
amta-decision-trees.doc Word documentamta-decision-trees.doc Word document
amta-decision-trees.doc Word document
 
semeval2016
semeval2016semeval2016
semeval2016
 
K017367680
K017367680K017367680
K017367680
 
A survey of Stemming Algorithms for Information Retrieval
A survey of Stemming Algorithms for Information RetrievalA survey of Stemming Algorithms for Information Retrieval
A survey of Stemming Algorithms for Information Retrieval
 

Recently uploaded

ECONOMIC CONTEXT - LONG FORM TV DRAMA - PPT
ECONOMIC CONTEXT - LONG FORM TV DRAMA - PPTECONOMIC CONTEXT - LONG FORM TV DRAMA - PPT
ECONOMIC CONTEXT - LONG FORM TV DRAMA - PPTiammrhaywood
 
Types of Journalistic Writing Grade 8.pptx
Types of Journalistic Writing Grade 8.pptxTypes of Journalistic Writing Grade 8.pptx
Types of Journalistic Writing Grade 8.pptxEyham Joco
 
CARE OF CHILD IN INCUBATOR..........pptx
CARE OF CHILD IN INCUBATOR..........pptxCARE OF CHILD IN INCUBATOR..........pptx
CARE OF CHILD IN INCUBATOR..........pptxGaneshChakor2
 
Incoming and Outgoing Shipments in 1 STEP Using Odoo 17
Incoming and Outgoing Shipments in 1 STEP Using Odoo 17Incoming and Outgoing Shipments in 1 STEP Using Odoo 17
Incoming and Outgoing Shipments in 1 STEP Using Odoo 17Celine George
 
Introduction to ArtificiaI Intelligence in Higher Education
Introduction to ArtificiaI Intelligence in Higher EducationIntroduction to ArtificiaI Intelligence in Higher Education
Introduction to ArtificiaI Intelligence in Higher Educationpboyjonauth
 
Introduction to AI in Higher Education_draft.pptx
Introduction to AI in Higher Education_draft.pptxIntroduction to AI in Higher Education_draft.pptx
Introduction to AI in Higher Education_draft.pptxpboyjonauth
 
भारत-रोम व्यापार.pptx, Indo-Roman Trade,
भारत-रोम व्यापार.pptx, Indo-Roman Trade,भारत-रोम व्यापार.pptx, Indo-Roman Trade,
भारत-रोम व्यापार.pptx, Indo-Roman Trade,Virag Sontakke
 
Solving Puzzles Benefits Everyone (English).pptx
Solving Puzzles Benefits Everyone (English).pptxSolving Puzzles Benefits Everyone (English).pptx
Solving Puzzles Benefits Everyone (English).pptxOH TEIK BIN
 
Proudly South Africa powerpoint Thorisha.pptx
Proudly South Africa powerpoint Thorisha.pptxProudly South Africa powerpoint Thorisha.pptx
Proudly South Africa powerpoint Thorisha.pptxthorishapillay1
 
Capitol Tech U Doctoral Presentation - April 2024.pptx
Capitol Tech U Doctoral Presentation - April 2024.pptxCapitol Tech U Doctoral Presentation - April 2024.pptx
Capitol Tech U Doctoral Presentation - April 2024.pptxCapitolTechU
 
Software Engineering Methodologies (overview)
Software Engineering Methodologies (overview)Software Engineering Methodologies (overview)
Software Engineering Methodologies (overview)eniolaolutunde
 
DATA STRUCTURE AND ALGORITHM for beginners
DATA STRUCTURE AND ALGORITHM for beginnersDATA STRUCTURE AND ALGORITHM for beginners
DATA STRUCTURE AND ALGORITHM for beginnersSabitha Banu
 
Computed Fields and api Depends in the Odoo 17
Computed Fields and api Depends in the Odoo 17Computed Fields and api Depends in the Odoo 17
Computed Fields and api Depends in the Odoo 17Celine George
 
How to Make a Pirate ship Primary Education.pptx
How to Make a Pirate ship Primary Education.pptxHow to Make a Pirate ship Primary Education.pptx
How to Make a Pirate ship Primary Education.pptxmanuelaromero2013
 
EPANDING THE CONTENT OF AN OUTLINE using notes.pptx
EPANDING THE CONTENT OF AN OUTLINE using notes.pptxEPANDING THE CONTENT OF AN OUTLINE using notes.pptx
EPANDING THE CONTENT OF AN OUTLINE using notes.pptxRaymartEstabillo3
 
History Class XII Ch. 3 Kinship, Caste and Class (1).pptx
History Class XII Ch. 3 Kinship, Caste and Class (1).pptxHistory Class XII Ch. 3 Kinship, Caste and Class (1).pptx
History Class XII Ch. 3 Kinship, Caste and Class (1).pptxsocialsciencegdgrohi
 
Final demo Grade 9 for demo Plan dessert.pptx
Final demo Grade 9 for demo Plan dessert.pptxFinal demo Grade 9 for demo Plan dessert.pptx
Final demo Grade 9 for demo Plan dessert.pptxAvyJaneVismanos
 
Earth Day Presentation wow hello nice great
Earth Day Presentation wow hello nice greatEarth Day Presentation wow hello nice great
Earth Day Presentation wow hello nice greatYousafMalik24
 

Recently uploaded (20)

ECONOMIC CONTEXT - LONG FORM TV DRAMA - PPT
ECONOMIC CONTEXT - LONG FORM TV DRAMA - PPTECONOMIC CONTEXT - LONG FORM TV DRAMA - PPT
ECONOMIC CONTEXT - LONG FORM TV DRAMA - PPT
 
Types of Journalistic Writing Grade 8.pptx
Types of Journalistic Writing Grade 8.pptxTypes of Journalistic Writing Grade 8.pptx
Types of Journalistic Writing Grade 8.pptx
 
CARE OF CHILD IN INCUBATOR..........pptx
CARE OF CHILD IN INCUBATOR..........pptxCARE OF CHILD IN INCUBATOR..........pptx
CARE OF CHILD IN INCUBATOR..........pptx
 
Incoming and Outgoing Shipments in 1 STEP Using Odoo 17
Incoming and Outgoing Shipments in 1 STEP Using Odoo 17Incoming and Outgoing Shipments in 1 STEP Using Odoo 17
Incoming and Outgoing Shipments in 1 STEP Using Odoo 17
 
Introduction to ArtificiaI Intelligence in Higher Education
Introduction to ArtificiaI Intelligence in Higher EducationIntroduction to ArtificiaI Intelligence in Higher Education
Introduction to ArtificiaI Intelligence in Higher Education
 
Introduction to AI in Higher Education_draft.pptx
Introduction to AI in Higher Education_draft.pptxIntroduction to AI in Higher Education_draft.pptx
Introduction to AI in Higher Education_draft.pptx
 
भारत-रोम व्यापार.pptx, Indo-Roman Trade,
भारत-रोम व्यापार.pptx, Indo-Roman Trade,भारत-रोम व्यापार.pptx, Indo-Roman Trade,
भारत-रोम व्यापार.pptx, Indo-Roman Trade,
 
Solving Puzzles Benefits Everyone (English).pptx
Solving Puzzles Benefits Everyone (English).pptxSolving Puzzles Benefits Everyone (English).pptx
Solving Puzzles Benefits Everyone (English).pptx
 
Proudly South Africa powerpoint Thorisha.pptx
Proudly South Africa powerpoint Thorisha.pptxProudly South Africa powerpoint Thorisha.pptx
Proudly South Africa powerpoint Thorisha.pptx
 
Capitol Tech U Doctoral Presentation - April 2024.pptx
Capitol Tech U Doctoral Presentation - April 2024.pptxCapitol Tech U Doctoral Presentation - April 2024.pptx
Capitol Tech U Doctoral Presentation - April 2024.pptx
 
Software Engineering Methodologies (overview)
Software Engineering Methodologies (overview)Software Engineering Methodologies (overview)
Software Engineering Methodologies (overview)
 
DATA STRUCTURE AND ALGORITHM for beginners
DATA STRUCTURE AND ALGORITHM for beginnersDATA STRUCTURE AND ALGORITHM for beginners
DATA STRUCTURE AND ALGORITHM for beginners
 
Computed Fields and api Depends in the Odoo 17
Computed Fields and api Depends in the Odoo 17Computed Fields and api Depends in the Odoo 17
Computed Fields and api Depends in the Odoo 17
 
How to Make a Pirate ship Primary Education.pptx
How to Make a Pirate ship Primary Education.pptxHow to Make a Pirate ship Primary Education.pptx
How to Make a Pirate ship Primary Education.pptx
 
9953330565 Low Rate Call Girls In Rohini Delhi NCR
9953330565 Low Rate Call Girls In Rohini  Delhi NCR9953330565 Low Rate Call Girls In Rohini  Delhi NCR
9953330565 Low Rate Call Girls In Rohini Delhi NCR
 
EPANDING THE CONTENT OF AN OUTLINE using notes.pptx
EPANDING THE CONTENT OF AN OUTLINE using notes.pptxEPANDING THE CONTENT OF AN OUTLINE using notes.pptx
EPANDING THE CONTENT OF AN OUTLINE using notes.pptx
 
History Class XII Ch. 3 Kinship, Caste and Class (1).pptx
History Class XII Ch. 3 Kinship, Caste and Class (1).pptxHistory Class XII Ch. 3 Kinship, Caste and Class (1).pptx
History Class XII Ch. 3 Kinship, Caste and Class (1).pptx
 
Final demo Grade 9 for demo Plan dessert.pptx
Final demo Grade 9 for demo Plan dessert.pptxFinal demo Grade 9 for demo Plan dessert.pptx
Final demo Grade 9 for demo Plan dessert.pptx
 
Earth Day Presentation wow hello nice great
Earth Day Presentation wow hello nice greatEarth Day Presentation wow hello nice great
Earth Day Presentation wow hello nice great
 
TataKelola dan KamSiber Kecerdasan Buatan v022.pdf
TataKelola dan KamSiber Kecerdasan Buatan v022.pdfTataKelola dan KamSiber Kecerdasan Buatan v022.pdf
TataKelola dan KamSiber Kecerdasan Buatan v022.pdf
 

Measuring Word Alignment Quality for Statistical Machine Translation Performance

  • 1. Measuring Word Alignment Quality for Statistical Machine Translation Alexander Fraser Daniel Marcu∗ University of Southern California University of Southern California Automatic word alignment plays a critical role in statistical machine translation. Unfor- tunately the relationship between alignment quality and statistical machine translation perfor- mance has not been well understood. In the recent literature the alignment task has frequently been decoupled from the translation task, and assumptions have been made about measuring alignment quality for machine translation which, it turns out, are not justified. In particular, none of the tens of papers published over the last five years has shown that significant decreases in Alignment Error Rate, AER (Och and Ney, 2003), result in significant increases in trans- lation quality. This paper explains this state of affairs and presents steps towards measuring alignment quality in a way which is predictive of statistical machine translation quality. 1. Introduction Word alignment is the problem of determining translational correspondence at the word level given a corpus of parallel sentences. Automatic word alignment (Brown et al., 1993) has received extensive treatment in the literature as it is a vital component of all statistical machine translation approaches. However, the relationship between word alignment quality and statistical machine translation quality has not been explained. There have been a number of research papers presented from 2000 to 2005 at ACL, NAACL, HLT, COLING, WPT03, WPT05, etc, outlining techniques for attempting to increase word alignment quality. Despite this high level of interest, none of these has been shown to result in a large gain in translation performance. We confirm experimentally that previous metrics do not predict MT performance well and develop a methodology for measuring alignment quality which is predictive of statistical machine translation (SMT) quality. Unfortunately our findings invalidate the evaluations and conclusions of much of the recent work on word alignment which has relied on previous metrics such as AER. 2. Experimental Methodology 2.1 Data To build an SMT system we require a bitext and a word alignment of that bitext, as well as language models built from target language data. In all of our experiments, we will hold the bitext and target language resources constant, and only vary how we construct the word alignment. The gold standard word alignment sets we use have been manually annotated us- ing links between words showing translational correspondence. Links which must be present in a hypothesized alignment in order for it be to correct are called “Sure” links. Some of the alignment sets also have links which are not “Sure” links but are “Possible” ∗ USC/ISI - Natural Language Group, 4676 Admiralty Way, Suite 1001, Marina del Rey, CA 90292-6601. Email: fraser at isi.edu, marcu at isi.edu c ISI-University of Southern California
  • 2. ISI-University of Southern California ISI-TR-616 links (Och and Ney, 2003). The intuition for links that are “Possible” but not “Sure”1 is that such links may be present but need not be present. We evaluate the translation quality of SMT systems by translating a held-out trans- lation test set and evaluating our hypothesized translations against one or more refer- ence translations using BLEU (Papineni et al., 2001). We also have an additional held- out translation set which we call the Maximum BLEU set, which is employed by the MT system to train the weights of its log-linear model to the final performance crite- rion (Och, 2003). We work with data sets for three different language pairs, examining French to English, Arabic to English, and Romanian to English translation tasks. The training data for the French/English data set is taken from the LDC Canadian Hansard data set, from which the word aligned data (presented in (Och and Ney, 2003)) was also taken. The English side of the bitext is 67.4 million words. We used a separate Canadian Hansard data set (released by ISI) as the source of the translation test set and the Maximum BLEU set. We evaluate two different tasks using this data, a medium task where 1/8 of the data (8.4 million English words) is used as the fixed bitext, and a large task where all of the data is used as the fixed bitext. The gold standard word alignments have 4376 Sure Links and 19,222 Possible links. The Arabic/English training corpus is the data used for the NIST 2004 machine translation evaluation 2 . The English side of the bitext is 99.3 million words. The Maxi- mum BLEU set is the “NIST 2002 Dry Run”, while the test set is the “NIST 2003 evalua- tion set”. We have annotated gold standard alignments for 100 parallel sentences using Sure links, following the Blinker guidelines (Melamed, 1998) which calls for Sure links only (there were 2,154 sure links). Here we also examine a medium task using 1/8 of the data (12.4 million English words) and a large task using all of the data. The Romanian/English training data was used for the tasks on Romanian/English alignment at WPT03 (Mihalcea and Pederson, 2003) and WPT05 (Martin, Mihalcea, and Pedersen, 2005). We carefully removed two sections of news bitext for training Maxi- mum BLEU and testing MT quality. The English side of the training corpus is 964,000 words. The alignment set is the first 148 annotated sentences used for the 2003 task (there were 3,181 Sure links). 2.2 Measuring Translation Quality Changes Caused By Alignment In consecutive word phrasal SMT (Koehn, Och, and Marcu, 2003) the knowledge sources which vary with the word alignment are the phrase translation lexicon (which maps source phrases to target phrases using counts from the word alignment) and some of the word level translation parameters (sometimes called lexical smoothing). However, many knowledge sources are used which do not vary with the final word alignment, such as rescoring with IBM Model 1, N-gram language models and the length penalty (these are constant in our experiments). In our experiments, we use a state of the art phrase-based system, similar to (Koehn, Och, and Marcu, 2003). The weights of the different knowledge sources in the log-linear model used by our system are trained using the Maximum BLEU training algorithm defined by Och (2003). For all of our experiments, we use two language models, one built using the target language training data and the other built using additional news data. We run Maximum BLEU for 25 iterations individually for each system. 1“Sure” links are by definition also “Possible”. 2http://www.nist.gov/speech/tests/summaries/2004/mt04.htm 2
  • 3. Measuring Word Alignment Quality for Statistical Machine Translation Fraser and Marcu 2.3 Generating Alignments of Varying Quality We have observed in the past that generative models used for statistical word alignment create alignments of increasing quality as they are exposed to more data. The intuition behind this is simple; as more cooccurrences of source and targets words are observed, the word alignments are better. Following this intuition, if we wish to increase the quality of a word alignment, we allow the alignment process access to extra data which is used only during the alignment process and then removed. If we wish to decrease the quality of a word alignment, we divide the bitext into pieces and align the pieces independently of one another, finally concatenating the results together. To generate word alignments, we follow the current state of the art, using GIZA++ (Och and Ney, 2003), which implements both the IBM Models of (Brown et al., 1993) and the HMM model (Vogel, Ney, and Tillmann, 1996). We use IBM Model 1, the Aachen HMM, and IBM Model 4 in that order (these models “bootstrap” from one another). The output of these models is an alignment of the bitext which projects one language to another. In this approach, GIZA++ is run end-to-end twice. In one case we project the source language to the target language, and in the other we project the target language to the source language. The output of GIZA++ is then post-processed using “sym- metrization heuristics”. We use three symmetrization heuristics described in (Och and Ney, 2003). We evaluate our approaches using these three heuristics because we would like to account for alignments generated in different fashions. These three approaches have been used as the baselines in virtually all of the recent work on automatic word alignment, and most of the best SMT systems use these techniques as well. 3. Word Alignment Quality Metrics One challenge for working with alignment systems is measuring the quality of a hy- pothesized alignment. Alignment quality can be compared by building state of the art SMT systems where only the alignment of a fixed bitext is allowed to vary. But this is a slow way to evaluate. It would be desirable to have a fast intrinsic metric of align- ment quality to use for system development, and to use as a criterion for discriminative training of more sophisticated alignment models. 3.1 Alignment Error Rate is an Inadequate Measure of Alignment Quality We begin our study of metrics for word alignment quality by testing Alignment Error Rate (AER) (Och and Ney, 2003). AER requires a gold standard manually annotated set of “Sure” links and “Possible” links (referred to as S and P). “Sure” links are used for measuring Recall, and “Possible” links are used for measuring Precision. Given a hypothesized alignment consisting of the link set A, three measures are defined: Precision(A, P) = |P ∩ A| |A| (1) Recall(A, S) = |S ∩ A| |S| (2) AER(A, P, S) = 1 − |P ∩ A| + |S ∩ A| |S| + |A| (3) In our graphs, we will present 1 − AER so that we have an accuracy measure. We first aligned the bitext itself. We took the medium French/English training set and broke it into pieces corresponding to 1/16, 1/8, 1/4 and 1/2 of the medium set to generate artificially degraded alignments. We used 2, 4, and 8 times the medium data to generate 3
  • 4. ISI-University of Southern California ISI-TR-616 artificially enhanced alignments. The graph in Figure 1 shows the correlation of 1−AER with machine translation quality, measured by BLEU. For the “fractional” data sizes, the average AER of the “fractional” alignments is used (ie, for 1/16, we calculate AER 16 times, once for each piece). High correlation would look like a line from the bottom left corner to the top right corner. As can be seen by looking at the graph, there is low correlation between 1 − AER and the BLEU score. A concise mathematical description of correlation is the coefficient of determination (r2 ), which is the square of the Pearson product-moment correlation coefficient (r). Here, r2 = 0.12, which is low3 . One reason that the correlation is low is because of what we believe to be a signif- icant shortcoming of AER which to our knowledge has not been previously reported. (Och and Ney, 2003) states that AER is derived from F-Measure. But AER does not share a very important property of F-Measure, which is that unbalanced precision and recall are penalized, in many scenarios where S ⊂ P (ie, we make the Sure versus Possible distinction, instead of annotating all links as Sure). This is easy to show algebraically using an example. We first define the measure “F-Measure with Sure and Possible” us- ing Och and Ney’s Precision and Recall formulae together with the standard F-Measure formula (Manning and Schuetze, 1999). In the F-Measure formula, there is a parame- ter α which sets the trade-off between Precision and Recall. When an equal trade-off is desired, α is set to 0.5. F-measure with Sure and Possible(A, P, S, α) = 1 α Precision(A,P ) + (1−α) Recall(A,S) (4) We compare two hypothesized alignments where |A|, the number of hypothesized alignment links, is the same, for instance, |A| = 100. Let |S| = 100. In the first case, let |P ∩ A| = 50 and |S ∩ A| = 50. Precision is 0.50 and Recall is 0.50. In the second case, let |P ∩ A| = 75 and |S ∩ A| = 25. Precision is 0.75 and Recall is 0.25. The basic property of F-Measure, if we set α equal to 0.5, is that unbalanced preci- sion and recall should be penalized. The first hypothesized alignment has an F-Measure with Sure and Possible score of 0.50. The second hypothesized alignment has a worse score, 0.375. This shows that if we use the formula for F-Measure with Sure and Possi- ble, unbalanced precision and recall are correctly penalized. However, if we substitute the relevant values into the formula for AER, we see that 1 − AER for both of the hypothesized alignments is 0.5. Therefore AER does not share the property of F-Measure (with α = 0.5) that unbalanced precision and recall are penalized. Because of this, it is possible to maximize AER by favoring precision over recall, which can be done by simply guessing very few alignment links. This is not a problem if S = P because the two quantities |P ∩ A| and |S ∩ A| are the same. Unfortunately when S ⊂ P this leads to strong biases which makes AER not useful. If we examine the graph in Figure 2, we see that F-Measure with Sure and Possible has some predictive power for the data points of a particular heuristic, but the overall correlation independent of heuristic is low, r2 = 0.21. We need a measure which pre- dicts BLEU without having a dependency on the way the alignments were generated. 3.2 Balanced F-Measure is Better, but Still Inadequate We wondered whether the low correlation was caused by the Sure and Possible distinc- tion. We reannotated the first 110 sentences of the 484 sentence test set using the Blinker 3r2 can be thought of as a percentage of correlation. It does not show the direction of correlation. All correlations in this work are positive correlations. 4
  • 5. Measuring Word Alignment Quality for Statistical Machine Translation Fraser and Marcu guidelines (there were 2,292 Sure links). We define F-Measure without the Sure versus Possible distinction (ie, all links are Sure) in Equation 5. This measure has been exten- sively used with other word alignment test sets. Figure 3 shows the results. Correlation is higher, r2 = 0.64. F-measure(A, S, α) = 1 α Precision(A,S) + (1−α) Recall(A,S) (5) 3.3 Varying the Trade-off Between Precision and Recall leads to Good Measurement of Quality We then hypothesized that the trade-off between precision and recall is important. This is controlled in both F-Measure formulae by the constant α. We search α = 0, 0.1, 0.2, ..., 1.0. The best results are: α = 0.3 for the original annotation annotated with Sure and Possi- ble (see Figure 4), and α = 0.6 for the first 110 sentences as annotated by us (see Figure 5)4 . The relevant r2 scores were 0.84 and 0.93 respectively. With a good α setting, we are able to predict the resulting machine translation quality reasonably well. For the original annotation, recall is more important, while for our annotation, pre- cision is more important5 . Our results suggest that higher correlation will be achieved when using the Blinker Sure-only annotation style than with the original annotation style which used Sure and Possible links. We then decided to try this using the medium Arabic training set. See figure 6 which shows the results for the best setting α = 0.2, for which r2 = 0.92. This is again a good correlation and shows that F-Measure is effective in predicting machine translation quality for this set. We tested our techniques with the larger corpora mentioned in Section 2.1. For the large French/English corpus the best results are with α = 0.3 for the original annota- tion of 484 sentences and α = 0.7 for the new annotation of 110 sentences with Sure links (see Figure 7). Relevant r2 scores were the same, at 0.64 and 0.64 respectively. Disappointingly, our measures are not able to fully explain resulting MT quality for the large French/English task. This may be caused by interactions between the size of the phrasal lexicons extracted and the settings used for the search for the best translation hypothesis (such as probabilistic and histogram beams (Koehn, Och, and Marcu, 2003)) at these large data sizes. For the large Arabic/English corpus, the results were better, the best correlation was with α = 0.2, for which r2 = 0.89, see Figure 8. For the large Arabic/English task, we can predict resulting MT quality. It is worth noting that the Arabic/English translation task and data set has been tested in conjunction with our translation system over a long period, but the French/English translation task and data has not. As a result, there may be hidden factors that affect the performance of our MT system which only appear in conjunction with the large French/English task. We also tested a smaller corpus. One well-studied task is the Romanian/English shared word alignment task from the Workshop on Parallel Text at ACL 2005 (Martin, Mihalcea, and Pedersen, 2005). We again only decreased the quality of the alignments and because the bitext is small only 5 data points for each symmetrization heuristic were used. The best setting of α was α = 0.4, for which r2 = 0.87, showing that F-Measure is effective for this task. 4We also checked the first 110 sentences using the original annotation to ensure that the differences observed were not an effect of restricting our annotation to these sentences. 5α less than 0.5 weights recall higher, while α greater than 0.5 weights precision higher, see the F- Measure formulae. 5
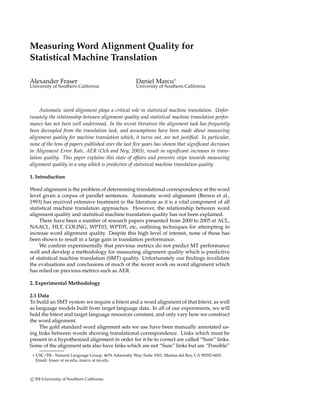
  • 6. ISI-University of Southern California ISI-TR-616 26.5 27 27.5 28 28.5 29 29.5 0.76 0.78 0.8 0.82 0.84 0.86 0.88 0.9 0.92 0.94 BLEU 1 - AER Refined Union Intersection Figure 1 French 1 − AER versus BLEU, r2 = 0.12 26.5 27 27.5 28 28.5 29 29.5 0.8 0.82 0.84 0.86 0.88 0.9 0.92 0.94 BLEU F-Measure with Sure and Possible Refined Union Intersection Figure 2 French F-Measure with Sure and Possible α = 0.5 versus BLEU, r2 = 0.21 26.5 27 27.5 28 28.5 29 29.5 0.6 0.62 0.64 0.66 0.68 0.7 0.72 0.74 BLEU F-Measure Refined Union Intersection Figure 3 French F-Measure α = 0.5 versus BLEU, r2 = 0.64 26.5 27 27.5 28 28.5 29 29.5 0.86 0.87 0.88 0.89 0.9 0.91 0.92 0.93 BLEU F-Measure with Sure and Possible Refined Union Intersection Figure 4 French F-Measure with Sure and Possible α = 0.3 versus BLEU, r2 = 0.84 26.5 27 27.5 28 28.5 29 29.5 0.64 0.66 0.68 0.7 0.72 0.74 0.76 BLEU F-Measure Refined Union Intersection Figure 5 French F-Measure α = 0.6 versus BLEU, r2 = 0.93 28 30 32 34 36 38 40 42 44 46 0.25 0.3 0.35 0.4 0.45 0.5 0.55 0.6 0.65 0.7 BLEU F-Measure Refined Union Intersection Figure 6 Arabic F-Measure α = 0.2 versus BLEU, r2 = 0.92 28 28.5 29 29.5 30 30.5 31 31.5 0.6 0.62 0.64 0.66 0.68 0.7 0.72 0.74 0.76 0.78 BLEU F-Measure Refined Union Intersection Figure 7 Large French F-Measure α = 0.7 (110 sentences) versus BLEU, r2 = 0.64 34 36 38 40 42 44 46 48 50 0.25 0.3 0.35 0.4 0.45 0.5 0.55 0.6 0.65 0.7 BLEU F-Measure Refined Union Intersection Figure 8 Large Arabic F-Measure α = 0.2 (100 sentences) versus BLEU, r2 = 0.89 6
  • 7. Measuring Word Alignment Quality for Statistical Machine Translation Fraser and Marcu 4. Conclusion We have presented an empirical study of the use of simple evaluation metrics based on gold standard alignment of a small number of sentences to predict machine translation quality. On the basis of our experiments we can now draw the following conclusions: 1. When S = P, AER does not share the important property of F-Measure that unequal precision and recall are penalized, making it easy to obtain good AER scores by simply guessing less alignment links. As a result we believe AER is not a useful metric for predicting MT accuracy. 2. Good correlation was obtained for the medium French and Arabic data sets, the large Arabic data set and the small Romanian data set. We have explained most of the effect of alignment quality on these sets, and if we are given the F-measure of a hypothesized word alignment for the bitext we can make a rea- sonable prediction as to what the resulting BLEU score will be. 3. We have only partially explained the effect of alignment quality on BLEU for the large French data set, and further investigation is warranted. 4. We recommend using the Blinker guidelines as a starting point for new align- ment annotation efforts, and based on our results recommend that the Sure-only annotation style outlined in that document be used. However, we believe our results show that if a gold standard alignment set is already available which is already annotated using the Sure versus Possible distinction, this will have only slightly worse results. 5. While we have addressed measuring alignment quality for phrasal SMT, similar work is now required to see how to measure alignment quality for other settings of machine translation and for other tasks. Our work invalidates the conclusions of recent alignment work which presented only evaluations based on metrics like AER or balanced F-Measure, and explains the lack of correlation in the few works which presented both such a metric and final MT results. A good example of the former are our own results (Fraser and Marcu, 2005). The work presented there had the highest balanced F-Measure scores for the Roma- nian/English WPT05 shared task, but based on the findings here we do not know if our alignments were the best for SMT quality, and it is possible that a different algorithm tuned for the correct criterion would have had better MT performance. Other examples include work relying on combining the Competitive Linking algorithm (Melamed, 2000) with discriminative scoring functions (Cherry and Lin, 2003; Taskar, Lacoste-Julien, and Klein, 2005). Competitive Linking usually results in higher precision and lower recall than IBM Model 4 symmetrized using the “Refined” or “Union” heuristics, because it enforces a constraint that each word has at most one translation correspondent. But we showed that AER is broken in a way that favors precision in Section 3.1. It is therefore likely that the results reported in these papers are affected by the AER bias and that the corresponding improvements in AER score do not correlate with increases in phrasal SMT performance. To avoid these problems we think that it is good practice to com- pare alignment algorithms by measuring performance in an identified final task such as machine translation. F-Measure with an appropriate setting of α will be useful dur- ing the development process of new alignment models, or as a maximization criterion for discriminative training of alignment models (Cherry and Lin, 2003; Liu, Liu, and Lin, 2005; Fraser and Marcu, 2005; Ittycheriah and Roukos, 2005; Moore, 2005; Taskar, Lacoste-Julien, and Klein, 2005). 7
  • 8. ISI-University of Southern California ISI-TR-616 Acknowledgments This work was supported by DARPA-ITO grant NN66001-00-1-9814, NSF grant IIS-0326276 and by the GALE program of the Defense Advanced Research Projects Agency, Contract No. HR0011- 06-C-0022. We would like to thank the USC Center for High Performance Computing and Communi- cations (HPCC). References Brown, Peter F., Stephen A. Della Pietra, Vincent J. Della Pietra, and R. L. Mercer. 1993. The mathematics of statistical machine translation: Parameter estimation. Computational Linguistics, 19(2):263–311. Cherry, Colin and Dekang Lin. 2003. A probability model to improve word alignment. In Proc. of the 41st Annual Meeting of the Association for Computational Linguistics (ACL), Sapporo, Japan, July. Fraser, Alexander and Daniel Marcu. 2005. Isi’s participation in the romanian-english alignment task. In ACL 2005 Workshop on Building and Using Parallel Texts: Data-Driven Machine Translation and Beyond, Ann Arbor, Michigan. Ittycheriah, Abraham and Salim Roukos. 2005. A maximum entropy word aligner for Arabic-English machine translation. In Proc. of Human Language Technology Conference and Conference on Empirical Methods in Natural Language Processing, Vancouver, British Columbia, October. Koehn, Philipp, Franz Josef Och, and Daniel Marcu. 2003. Statistical phrase-based translation. In Proceedings of the Human Language Technology and North American Association for Computational Linguistics Conference (HLT/NAACL), pages 127–133, Edmonton, Canada. Liu, Yang, Qun Liu, and Shouxun Lin. 2005. Log-linear models for word alignment. In Proc. of the 43rd Annual Meeting of the Association for Computational Linguistics (ACL), pages 459–466, Ann Arbor, Michigan, June. Manning, Christopher D. and Hinrich Schuetze. 1999. Foundations of Statistical Natural Language Processing. MIT Press, Cambridge, MA. Martin, Joel, Rada Mihalcea, and Ted Pedersen. 2005. Word alignment for languages with scarce resources. In ACL 2005 Workshop on Building and Using Parallel Texts: Data-Driven Machine Translation and Beyond, Ann Arbor, Michigan, June. Melamed, I. Dan. 1998. Manual annotation of translational equivalence: The blinker project. Technical Report 98-07, Institute for Research in Cognitive Science, Philadelphia, PA. Melamed, I. Dan. 2000. Models of translational equivalence among words. Computational Linguistics, 26(2):221–249. Mihalcea, Rada and Ted Pederson. 2003. An evaluation exercise for word alignment. In HLT-NAACL 2003 Workshop on Building and Using Parallel Texts: Data Driven Machine Translation and Beyond, Edmonton, Alberta, July. Moore, Robert C. 2005. A discriminative framework for bilingual word alignment. In Proc. of Human Language Technology Conference and Conference on Empirical Methods in Natural Language Processing, Vancouver, British Columbia, October. Och, Franz Josef. 2003. Minimum error rate training in statistical machine translation. In Proc. of the 41st Annual Meeting of the Association for Computational Linguistics (ACL), pages 160–167, Sapporo, Japan, July. Och, Franz Josef and Hermann Ney. 2003. A systematic comparison of various statistical alignment models. Computational Linguistics, 29(1):19–51. Papineni, Kishore A., Salim Roukos, Todd Ward, and Wei-Jing Zhu. 2001. BLEU: a method for automatic evaluation of machine translation. Technical Report RC22176 (W0109-022), IBM Research Division, Thomas J. Watson Research Center, Yorktown Heights, NY, September. Taskar, Ben, Simon Lacoste-Julien, and Dan Klein. 2005. A discriminative matching approach to word alignment. In Proc. of Human Language Technology Conference and Conference on Empirical Methods in Natural Language Processing, Vancouver, British Columbia, October. Vogel, Stephan, Hermann Ney, and Christoph Tillmann. 1996. HMM-based word alignment in statistical translation. In COLING ’96: The 16th Int. Conf. on Computational Linguistics, pages 836–841, Copenhagen, Denmark, August. 8