Download as PDF, PPTX


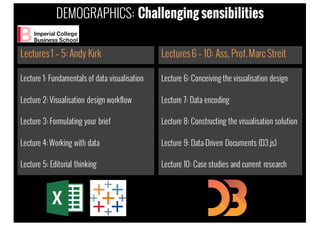

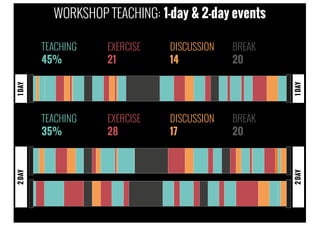
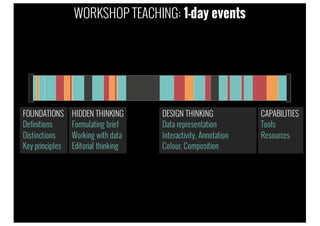
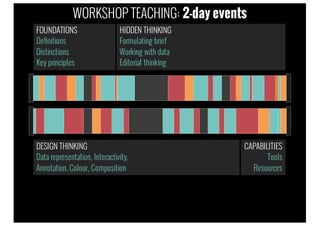
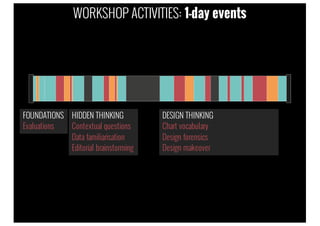
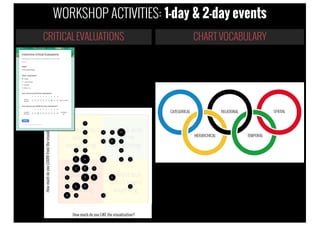
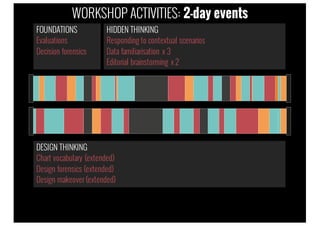


The document outlines a comprehensive training workshop on data visualization and infographic design, aimed at individuals from various backgrounds looking to enhance their skills. It describes the workshop structure, objectives, and content, including a focus on the design workflow and critical thinking in data representation. Delivered by Andy Kirk, the workshops cater to diverse audiences and emphasize the craft of visualization without being tied to specific tools.