SlideShare a Scribd company logo
1 of 2
HISTOGRAM
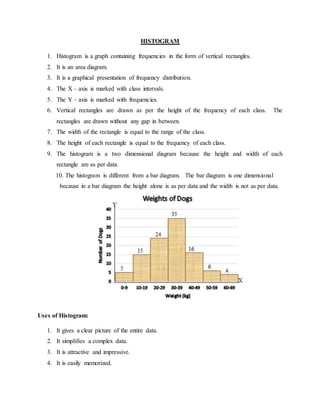
1. Histogram is a graph containing frequencies in the form of vertical rectangles.
2. It is an area diagram.
3. It is a graphical presentation of frequency distribution.
4. The X – axis is marked with class intervals.
5. The Y – axis is marked with frequencies.
6. Vertical rectangles are drawn as per the height of the frequency of each class. The
rectangles are drawn without any gap in between.
7. The width of the rectangle is equal to the range of the class.
8. The height of each rectangle is equal to the frequency of each class.
9. The histogram is a two dimensional diagram because the height and width of each
rectangle are as per data.
10. The histogram is different from a bar diagram. The bar diagram is one dimensional
because in a bar diagram the height alone is as per data and the width is not as per data.
Uses of Histogram:
1. It gives a clear picture of the entire data.
2. It simplifies a complex data.
3. It is attractive and impressive.
4. It is easily memorized.
5. Median and mode can be located.
6. It facilitates comparison of two or more frequency distributions on the same graph.
7. It gives an idea of the pattern of distribution of variables in the population.

More Related Content

What's hot

Pie Charts Histograms
Pie Charts HistogramsPie Charts Histograms
Pie Charts HistogramsAnna Gurney
 
Graphical representation of data mohit verma
Graphical representation of data mohit verma Graphical representation of data mohit verma
Graphical representation of data mohit verma MOHIT KUMAR VERMA
 
Bar Diagram (chart) in Statistics presentation
Bar Diagram (chart) in Statistics presentationBar Diagram (chart) in Statistics presentation
Bar Diagram (chart) in Statistics presentationsheiblu
 
FREQUENCY DISTRIBUTION.pptx
FREQUENCY DISTRIBUTION.pptxFREQUENCY DISTRIBUTION.pptx
FREQUENCY DISTRIBUTION.pptxSreeLatha98
 
Bar chart, pie chart, histogram
Bar chart, pie chart, histogramBar chart, pie chart, histogram
Bar chart, pie chart, histogramSajid Hasan
 
DATA GRAPHICS 8th Sem.pdf
DATA GRAPHICS 8th Sem.pdfDATA GRAPHICS 8th Sem.pdf
DATA GRAPHICS 8th Sem.pdfRavinandan A P
 
Frequency distribution
Frequency distributionFrequency distribution
Frequency distributionAishwarya PT
 
LEVEL OF SIGNIFICANCE.pptx
LEVEL OF SIGNIFICANCE.pptxLEVEL OF SIGNIFICANCE.pptx
LEVEL OF SIGNIFICANCE.pptxRingoNavarro3
 
biostatstics :Type and presentation of data
biostatstics :Type and presentation of databiostatstics :Type and presentation of data
biostatstics :Type and presentation of datanaresh gill
 
Experimental designs
Experimental designsExperimental designs
Experimental designsrx_sonali
 

What's hot (20)

Pie Charts Histograms
Pie Charts HistogramsPie Charts Histograms
Pie Charts Histograms
 
Histogram
HistogramHistogram
Histogram
 
Graphical representation of data mohit verma
Graphical representation of data mohit verma Graphical representation of data mohit verma
Graphical representation of data mohit verma
 
Non parametric test
Non parametric testNon parametric test
Non parametric test
 
Biostatistics Frequency distribution
Biostatistics Frequency distributionBiostatistics Frequency distribution
Biostatistics Frequency distribution
 
Bar Diagram (chart) in Statistics presentation
Bar Diagram (chart) in Statistics presentationBar Diagram (chart) in Statistics presentation
Bar Diagram (chart) in Statistics presentation
 
FREQUENCY DISTRIBUTION.pptx
FREQUENCY DISTRIBUTION.pptxFREQUENCY DISTRIBUTION.pptx
FREQUENCY DISTRIBUTION.pptx
 
Frequency Polygon
Frequency PolygonFrequency Polygon
Frequency Polygon
 
mean median mode
 mean median mode mean median mode
mean median mode
 
Bar chart, pie chart, histogram
Bar chart, pie chart, histogramBar chart, pie chart, histogram
Bar chart, pie chart, histogram
 
DATA GRAPHICS 8th Sem.pdf
DATA GRAPHICS 8th Sem.pdfDATA GRAPHICS 8th Sem.pdf
DATA GRAPHICS 8th Sem.pdf
 
Frequency Distribution
Frequency DistributionFrequency Distribution
Frequency Distribution
 
Frequency distribution
Frequency distributionFrequency distribution
Frequency distribution
 
TYPES OF GRAPH & FLOW CHART
TYPES OF GRAPH & FLOW CHARTTYPES OF GRAPH & FLOW CHART
TYPES OF GRAPH & FLOW CHART
 
LEVEL OF SIGNIFICANCE.pptx
LEVEL OF SIGNIFICANCE.pptxLEVEL OF SIGNIFICANCE.pptx
LEVEL OF SIGNIFICANCE.pptx
 
biostatstics :Type and presentation of data
biostatstics :Type and presentation of databiostatstics :Type and presentation of data
biostatstics :Type and presentation of data
 
PROBABILITY
PROBABILITYPROBABILITY
PROBABILITY
 
Regression Analysis
Regression AnalysisRegression Analysis
Regression Analysis
 
Experimental designs
Experimental designsExperimental designs
Experimental designs
 
Histogram
HistogramHistogram
Histogram
 

Similar to Histogram

Data Presentation using Descriptive Graphs.pptx
Data Presentation using Descriptive Graphs.pptxData Presentation using Descriptive Graphs.pptx
Data Presentation using Descriptive Graphs.pptxJeanettebagtoc
 
135. Graphic Presentation
135. Graphic Presentation135. Graphic Presentation
135. Graphic PresentationLAKSHMANAN S
 
Data presentation.pptx
Data presentation.pptxData presentation.pptx
Data presentation.pptxssusera0e0e9
 
diagrammatic and graphical representation of data
 diagrammatic and graphical representation of data diagrammatic and graphical representation of data
diagrammatic and graphical representation of dataVarun Prem Varu
 
Diagr-graph-presentation.ppt
Diagr-graph-presentation.pptDiagr-graph-presentation.ppt
Diagr-graph-presentation.pptDasariSreenivas
 
Plotting histogram in bigdata analytics
Plotting histogram in bigdata analyticsPlotting histogram in bigdata analytics
Plotting histogram in bigdata analyticsRajalakshmiK19
 
Graphs- A tool to present data
Graphs- A tool to present dataGraphs- A tool to present data
Graphs- A tool to present dataDr-Jitendra Patel
 
2 biostatistics presenting data
2  biostatistics presenting data2  biostatistics presenting data
2 biostatistics presenting dataDr. Nazar Jaf
 
PG STAT 531 Lecture 3 Graphical and Diagrammatic Representation of Data
PG STAT 531 Lecture 3 Graphical and Diagrammatic Representation of DataPG STAT 531 Lecture 3 Graphical and Diagrammatic Representation of Data
PG STAT 531 Lecture 3 Graphical and Diagrammatic Representation of DataAashish Patel
 
Lecture 2-PPT.pdf
Lecture 2-PPT.pdfLecture 2-PPT.pdf
Lecture 2-PPT.pdfRAJKAMAL282
 
Lecture 2-PPT statistics.pdf
Lecture 2-PPT statistics.pdfLecture 2-PPT statistics.pdf
Lecture 2-PPT statistics.pdfDrSJayashree
 
Data and graphs
Data and graphsData and graphs
Data and graphsMy_VivJaan
 
GRAPHS AND DIAGRAMS.pptx
GRAPHS AND DIAGRAMS.pptxGRAPHS AND DIAGRAMS.pptx
GRAPHS AND DIAGRAMS.pptxVinothiniSylvia
 
GI - Map skills and hypothesis
GI - Map skills and hypothesisGI - Map skills and hypothesis
GI - Map skills and hypothesisMissST
 

Similar to Histogram (20)

Data Presentation using Descriptive Graphs.pptx
Data Presentation using Descriptive Graphs.pptxData Presentation using Descriptive Graphs.pptx
Data Presentation using Descriptive Graphs.pptx
 
135. Graphic Presentation
135. Graphic Presentation135. Graphic Presentation
135. Graphic Presentation
 
Graphical method.pptx
Graphical method.pptxGraphical method.pptx
Graphical method.pptx
 
Data presentation.pptx
Data presentation.pptxData presentation.pptx
Data presentation.pptx
 
diagrammatic and graphical representation of data
 diagrammatic and graphical representation of data diagrammatic and graphical representation of data
diagrammatic and graphical representation of data
 
Frequency curve
Frequency curveFrequency curve
Frequency curve
 
seminar.pptx
seminar.pptxseminar.pptx
seminar.pptx
 
Diagr-graph-presentation.ppt
Diagr-graph-presentation.pptDiagr-graph-presentation.ppt
Diagr-graph-presentation.ppt
 
Plotting histogram in bigdata analytics
Plotting histogram in bigdata analyticsPlotting histogram in bigdata analytics
Plotting histogram in bigdata analytics
 
Graphs- A tool to present data
Graphs- A tool to present dataGraphs- A tool to present data
Graphs- A tool to present data
 
2 biostatistics presenting data
2  biostatistics presenting data2  biostatistics presenting data
2 biostatistics presenting data
 
Charts in Microsoft Excel
Charts in Microsoft ExcelCharts in Microsoft Excel
Charts in Microsoft Excel
 
PG STAT 531 Lecture 3 Graphical and Diagrammatic Representation of Data
PG STAT 531 Lecture 3 Graphical and Diagrammatic Representation of DataPG STAT 531 Lecture 3 Graphical and Diagrammatic Representation of Data
PG STAT 531 Lecture 3 Graphical and Diagrammatic Representation of Data
 
Statistical graphs
Statistical graphsStatistical graphs
Statistical graphs
 
Lecture 2-PPT.pdf
Lecture 2-PPT.pdfLecture 2-PPT.pdf
Lecture 2-PPT.pdf
 
Lecture 2-PPT statistics.pdf
Lecture 2-PPT statistics.pdfLecture 2-PPT statistics.pdf
Lecture 2-PPT statistics.pdf
 
Tabular and Graphical Representation of Data
Tabular and Graphical Representation of Data Tabular and Graphical Representation of Data
Tabular and Graphical Representation of Data
 
Data and graphs
Data and graphsData and graphs
Data and graphs
 
GRAPHS AND DIAGRAMS.pptx
GRAPHS AND DIAGRAMS.pptxGRAPHS AND DIAGRAMS.pptx
GRAPHS AND DIAGRAMS.pptx
 
GI - Map skills and hypothesis
GI - Map skills and hypothesisGI - Map skills and hypothesis
GI - Map skills and hypothesis
 

More from Vidya Kalaivani Rajkumar

Transgenic plants- Abiotic stress tolerance
Transgenic plants- Abiotic stress toleranceTransgenic plants- Abiotic stress tolerance
Transgenic plants- Abiotic stress toleranceVidya Kalaivani Rajkumar
 
Protein structure visualization tools-RASMOL
Protein structure visualization tools-RASMOLProtein structure visualization tools-RASMOL
Protein structure visualization tools-RASMOLVidya Kalaivani Rajkumar
 

More from Vidya Kalaivani Rajkumar (20)

Recombinant vaccines-Peptide Vaccines
Recombinant vaccines-Peptide Vaccines Recombinant vaccines-Peptide Vaccines
Recombinant vaccines-Peptide Vaccines
 
Transgenic plants- Abiotic stress tolerance
Transgenic plants- Abiotic stress toleranceTransgenic plants- Abiotic stress tolerance
Transgenic plants- Abiotic stress tolerance
 
Bioreactors in tissue engineering
Bioreactors in tissue engineeringBioreactors in tissue engineering
Bioreactors in tissue engineering
 
Tissue assembly in microgravity
Tissue assembly in microgravityTissue assembly in microgravity
Tissue assembly in microgravity
 
In vivo synthesis of tissues and organs
In vivo synthesis of tissues and organsIn vivo synthesis of tissues and organs
In vivo synthesis of tissues and organs
 
Bioartificial pancreas
Bioartificial pancreasBioartificial pancreas
Bioartificial pancreas
 
Biomaterials for tissue engineering
Biomaterials for tissue engineeringBiomaterials for tissue engineering
Biomaterials for tissue engineering
 
Haematopoietic system
Haematopoietic systemHaematopoietic system
Haematopoietic system
 
Fasta
FastaFasta
Fasta
 
Water vascular system of star fish
Water vascular system of star fishWater vascular system of star fish
Water vascular system of star fish
 
Cephalopodes are advance molluscs
Cephalopodes are advance molluscsCephalopodes are advance molluscs
Cephalopodes are advance molluscs
 
Beat air pollution
Beat air pollution Beat air pollution
Beat air pollution
 
Birth control methods
Birth control methodsBirth control methods
Birth control methods
 
Future of human evolution
Future of human evolutionFuture of human evolution
Future of human evolution
 
Sequence alignment
Sequence alignmentSequence alignment
Sequence alignment
 
Assignment on developmental zoology
Assignment on developmental zoologyAssignment on developmental zoology
Assignment on developmental zoology
 
Development of chick
Development of chickDevelopment of chick
Development of chick
 
Major biological nucleotide databases
Major biological nucleotide databasesMajor biological nucleotide databases
Major biological nucleotide databases
 
Protein structure visualization tools-RASMOL
Protein structure visualization tools-RASMOLProtein structure visualization tools-RASMOL
Protein structure visualization tools-RASMOL
 
Swiss pdb viewer
Swiss pdb viewerSwiss pdb viewer
Swiss pdb viewer
 

Recently uploaded

Planning a health career 4th Quarter.pptx
Planning a health career 4th Quarter.pptxPlanning a health career 4th Quarter.pptx
Planning a health career 4th Quarter.pptxLigayaBacuel1
 
Like-prefer-love -hate+verb+ing & silent letters & citizenship text.pdf
Like-prefer-love -hate+verb+ing & silent letters & citizenship text.pdfLike-prefer-love -hate+verb+ing & silent letters & citizenship text.pdf
Like-prefer-love -hate+verb+ing & silent letters & citizenship text.pdfMr Bounab Samir
 
Hierarchy of management that covers different levels of management
Hierarchy of management that covers different levels of managementHierarchy of management that covers different levels of management
Hierarchy of management that covers different levels of managementmkooblal
 
EPANDING THE CONTENT OF AN OUTLINE using notes.pptx
EPANDING THE CONTENT OF AN OUTLINE using notes.pptxEPANDING THE CONTENT OF AN OUTLINE using notes.pptx
EPANDING THE CONTENT OF AN OUTLINE using notes.pptxRaymartEstabillo3
 
ACC 2024 Chronicles. Cardiology. Exam.pdf
ACC 2024 Chronicles. Cardiology. Exam.pdfACC 2024 Chronicles. Cardiology. Exam.pdf
ACC 2024 Chronicles. Cardiology. Exam.pdfSpandanaRallapalli
 
ECONOMIC CONTEXT - PAPER 1 Q3: NEWSPAPERS.pptx
ECONOMIC CONTEXT - PAPER 1 Q3: NEWSPAPERS.pptxECONOMIC CONTEXT - PAPER 1 Q3: NEWSPAPERS.pptx
ECONOMIC CONTEXT - PAPER 1 Q3: NEWSPAPERS.pptxiammrhaywood
 
Atmosphere science 7 quarter 4 .........
Atmosphere science 7 quarter 4 .........Atmosphere science 7 quarter 4 .........
Atmosphere science 7 quarter 4 .........LeaCamillePacle
 
Earth Day Presentation wow hello nice great
Earth Day Presentation wow hello nice greatEarth Day Presentation wow hello nice great
Earth Day Presentation wow hello nice greatYousafMalik24
 
ECONOMIC CONTEXT - LONG FORM TV DRAMA - PPT
ECONOMIC CONTEXT - LONG FORM TV DRAMA - PPTECONOMIC CONTEXT - LONG FORM TV DRAMA - PPT
ECONOMIC CONTEXT - LONG FORM TV DRAMA - PPTiammrhaywood
 
Types of Journalistic Writing Grade 8.pptx
Types of Journalistic Writing Grade 8.pptxTypes of Journalistic Writing Grade 8.pptx
Types of Journalistic Writing Grade 8.pptxEyham Joco
 
Quarter 4 Peace-education.pptx Catch Up Friday
Quarter 4 Peace-education.pptx Catch Up FridayQuarter 4 Peace-education.pptx Catch Up Friday
Quarter 4 Peace-education.pptx Catch Up FridayMakMakNepo
 
Difference Between Search & Browse Methods in Odoo 17
Difference Between Search & Browse Methods in Odoo 17Difference Between Search & Browse Methods in Odoo 17
Difference Between Search & Browse Methods in Odoo 17Celine George
 
Keynote by Prof. Wurzer at Nordex about IP-design
Keynote by Prof. Wurzer at Nordex about IP-designKeynote by Prof. Wurzer at Nordex about IP-design
Keynote by Prof. Wurzer at Nordex about IP-designMIPLM
 
What is Model Inheritance in Odoo 17 ERP
What is Model Inheritance in Odoo 17 ERPWhat is Model Inheritance in Odoo 17 ERP
What is Model Inheritance in Odoo 17 ERPCeline George
 
Gas measurement O2,Co2,& ph) 04/2024.pptx
Gas measurement O2,Co2,& ph) 04/2024.pptxGas measurement O2,Co2,& ph) 04/2024.pptx
Gas measurement O2,Co2,& ph) 04/2024.pptxDr.Ibrahim Hassaan
 
Grade 9 Q4-MELC1-Active and Passive Voice.pptx
Grade 9 Q4-MELC1-Active and Passive Voice.pptxGrade 9 Q4-MELC1-Active and Passive Voice.pptx
Grade 9 Q4-MELC1-Active and Passive Voice.pptxChelloAnnAsuncion2
 
ROOT CAUSE ANALYSIS PowerPoint Presentation
ROOT CAUSE ANALYSIS PowerPoint PresentationROOT CAUSE ANALYSIS PowerPoint Presentation
ROOT CAUSE ANALYSIS PowerPoint PresentationAadityaSharma884161
 

Recently uploaded (20)

Planning a health career 4th Quarter.pptx
Planning a health career 4th Quarter.pptxPlanning a health career 4th Quarter.pptx
Planning a health career 4th Quarter.pptx
 
Like-prefer-love -hate+verb+ing & silent letters & citizenship text.pdf
Like-prefer-love -hate+verb+ing & silent letters & citizenship text.pdfLike-prefer-love -hate+verb+ing & silent letters & citizenship text.pdf
Like-prefer-love -hate+verb+ing & silent letters & citizenship text.pdf
 
Hierarchy of management that covers different levels of management
Hierarchy of management that covers different levels of managementHierarchy of management that covers different levels of management
Hierarchy of management that covers different levels of management
 
EPANDING THE CONTENT OF AN OUTLINE using notes.pptx
EPANDING THE CONTENT OF AN OUTLINE using notes.pptxEPANDING THE CONTENT OF AN OUTLINE using notes.pptx
EPANDING THE CONTENT OF AN OUTLINE using notes.pptx
 
ACC 2024 Chronicles. Cardiology. Exam.pdf
ACC 2024 Chronicles. Cardiology. Exam.pdfACC 2024 Chronicles. Cardiology. Exam.pdf
ACC 2024 Chronicles. Cardiology. Exam.pdf
 
ECONOMIC CONTEXT - PAPER 1 Q3: NEWSPAPERS.pptx
ECONOMIC CONTEXT - PAPER 1 Q3: NEWSPAPERS.pptxECONOMIC CONTEXT - PAPER 1 Q3: NEWSPAPERS.pptx
ECONOMIC CONTEXT - PAPER 1 Q3: NEWSPAPERS.pptx
 
Atmosphere science 7 quarter 4 .........
Atmosphere science 7 quarter 4 .........Atmosphere science 7 quarter 4 .........
Atmosphere science 7 quarter 4 .........
 
TataKelola dan KamSiber Kecerdasan Buatan v022.pdf
TataKelola dan KamSiber Kecerdasan Buatan v022.pdfTataKelola dan KamSiber Kecerdasan Buatan v022.pdf
TataKelola dan KamSiber Kecerdasan Buatan v022.pdf
 
Earth Day Presentation wow hello nice great
Earth Day Presentation wow hello nice greatEarth Day Presentation wow hello nice great
Earth Day Presentation wow hello nice great
 
ECONOMIC CONTEXT - LONG FORM TV DRAMA - PPT
ECONOMIC CONTEXT - LONG FORM TV DRAMA - PPTECONOMIC CONTEXT - LONG FORM TV DRAMA - PPT
ECONOMIC CONTEXT - LONG FORM TV DRAMA - PPT
 
9953330565 Low Rate Call Girls In Rohini Delhi NCR
9953330565 Low Rate Call Girls In Rohini  Delhi NCR9953330565 Low Rate Call Girls In Rohini  Delhi NCR
9953330565 Low Rate Call Girls In Rohini Delhi NCR
 
Types of Journalistic Writing Grade 8.pptx
Types of Journalistic Writing Grade 8.pptxTypes of Journalistic Writing Grade 8.pptx
Types of Journalistic Writing Grade 8.pptx
 
Quarter 4 Peace-education.pptx Catch Up Friday
Quarter 4 Peace-education.pptx Catch Up FridayQuarter 4 Peace-education.pptx Catch Up Friday
Quarter 4 Peace-education.pptx Catch Up Friday
 
Difference Between Search & Browse Methods in Odoo 17
Difference Between Search & Browse Methods in Odoo 17Difference Between Search & Browse Methods in Odoo 17
Difference Between Search & Browse Methods in Odoo 17
 
Keynote by Prof. Wurzer at Nordex about IP-design
Keynote by Prof. Wurzer at Nordex about IP-designKeynote by Prof. Wurzer at Nordex about IP-design
Keynote by Prof. Wurzer at Nordex about IP-design
 
What is Model Inheritance in Odoo 17 ERP
What is Model Inheritance in Odoo 17 ERPWhat is Model Inheritance in Odoo 17 ERP
What is Model Inheritance in Odoo 17 ERP
 
Gas measurement O2,Co2,& ph) 04/2024.pptx
Gas measurement O2,Co2,& ph) 04/2024.pptxGas measurement O2,Co2,& ph) 04/2024.pptx
Gas measurement O2,Co2,& ph) 04/2024.pptx
 
Grade 9 Q4-MELC1-Active and Passive Voice.pptx
Grade 9 Q4-MELC1-Active and Passive Voice.pptxGrade 9 Q4-MELC1-Active and Passive Voice.pptx
Grade 9 Q4-MELC1-Active and Passive Voice.pptx
 
ROOT CAUSE ANALYSIS PowerPoint Presentation
ROOT CAUSE ANALYSIS PowerPoint PresentationROOT CAUSE ANALYSIS PowerPoint Presentation
ROOT CAUSE ANALYSIS PowerPoint Presentation
 
Raw materials used in Herbal Cosmetics.pptx
Raw materials used in Herbal Cosmetics.pptxRaw materials used in Herbal Cosmetics.pptx
Raw materials used in Herbal Cosmetics.pptx
 

Histogram

  • 1. HISTOGRAM 1. Histogram is a graph containing frequencies in the form of vertical rectangles. 2. It is an area diagram. 3. It is a graphical presentation of frequency distribution. 4. The X – axis is marked with class intervals. 5. The Y – axis is marked with frequencies. 6. Vertical rectangles are drawn as per the height of the frequency of each class. The rectangles are drawn without any gap in between. 7. The width of the rectangle is equal to the range of the class. 8. The height of each rectangle is equal to the frequency of each class. 9. The histogram is a two dimensional diagram because the height and width of each rectangle are as per data. 10. The histogram is different from a bar diagram. The bar diagram is one dimensional because in a bar diagram the height alone is as per data and the width is not as per data. Uses of Histogram: 1. It gives a clear picture of the entire data. 2. It simplifies a complex data. 3. It is attractive and impressive. 4. It is easily memorized.
  • 2. 5. Median and mode can be located. 6. It facilitates comparison of two or more frequency distributions on the same graph. 7. It gives an idea of the pattern of distribution of variables in the population.