SlideShare a Scribd company logo
1 of 6
Download to read offline
Downloaded from: justpaste.it/9ecx5
Data Presentation and Reporting
This part of the Cognos TM1 tutorial will teach you about data presentation and
reporting, drilling through to get detailed data, worksheets, slicing a view, active forms
and special formatting, TM1 print report wizard, TM1 web and more.
Basic data browsing in TM1
Cube Viewer
The following steps can be followed to browse data in the Cube Viewer:
Open TM1 Server Explorer.
In the Tree pane, select the cube you want to browse
Click on the cube and select ..:
OnlineITGuru provides industry-leading online cognos tm1 online training for BI professionals.
The Cube Viewer window opens with the cube’s system default view.
Press F9 or click on Recalculate to display the cell values.
In-Spreadsheet Browser
To access data using this tool the following steps should be followed:
1. Open Server Explorer.
2. In the Tree pane, select the cube you want to browse.
3. Click on the cube and select Browse in Excel.
Modifying your view of data
To do this, the Cube Viewer allows a user to perform the following:
Stack dimensions to see more detail along the columns or rows of a view
Drill down on the consolidated elements displayed in the view to see the underlying detail
Change the title dimension elements in the view to access a completely different view of the cube data
Drill-through the view to detailed data
Stacking a title dimension as a row dimension
To stack a title dimension as a row dimension in Cube Viewer, you can click on the element name in the title
dimension and drag that element name to the right or left of a row dimension name.
Stacking a title dimension as a column dimension
To stack a title dimension as a column dimension in Cube Viewer, you can click on the element name in the title
dimension and drag that element name to the right or left of a column dimension name.
Drilling down through consolidations
In Cube Viewer, a plus sign (+), next to an element name, identifies the element as a consolidation. To view the
underlying detail, click on +, and to hide the underlying detail, click on the minus sign (–).
Changing title elements in Cube Viewer
To change title elements displayed in Cube Viewer, click on the element name arrow, select an element, and
press F9.
Drilling through to detailed data
To access detailed level data for a selected cell of data in Cube Viewer, a drill TI process and drill association rule
must be implemented.
Saving the view
To save a view from Cube Viewer, you can click on File and then select Save. TM1 will prompt you with the TM1
Save View dialog. This dialog allows you to:
Set this view as the cube’s default view (only one default view per cube is allowed)
Save the view as a private or public view
Provide a name for the view
Formatting view cells
The most common features provided by TM1 to format data displayed in a cube view are:
Zero suppression
Cell formatting
Column orientations
Zero suppression
You can turn off rows and/or columns that are zero.
For row suppression, click on Options | Suppress Zeroes On Rows:
For column suppression, click on Options | Suppress Zeroes On Columns:
Cell formatting
To customize the display of data within a cube view cell, the Format attribute can be used. The Format attribute is
a special type of element attribute that determines how data is displayed. The value of the format attribute can be
applied to column elements, row elements, or title elements
Column orientations
You may change it from right to left by clicking on the menu option Layout Right to Left (or Layout Left to Right,
depending upon the current view).
Worksheets
From TM1 Cube Viewer, data can be sliced into Microsoft Excel for analysis and further presentation.
Slicing a view
To slice a view from Cube Viewer to an Excel worksheet, you can click on File and then select Slice. TM1 will copy
the current view into a new MS Excel workbook. Sliced views are still connected to TM1, because TM1 adds the
appropriate TM1 functions to the worksheet to retrieve the data from the cube.
Snapshots
From TM1 Cube Viewer, data can be copied into Microsoft Excel for analysis and further presentation. In contrast
to the slice, the snapshot is a copy of the data at that moment in time. To create a snapshot from Cube Viewer, you
can click on File and then select Snapshot.
Active Forms
Active Forms let you view (and update) cube data directly in Excel whenever you are connected to the server on
which the cube data resides.
There are special groups of TM1 worksheet functions that are used for the support of Active Forms. These groups
include:
TM1RptView
TM1RptTitle
TM1RptRow
TM1RptFilter
TM1RptElLev
TM1RptElIsExpanded
TM1RptElIsConsolidated
Refreshing and recalculating
Once you have saved an Active Form, you can refresh the data displayed in it by pressing F9. Additionally, you
also have the option to rebuild the current worksheet or current workbook by clicking on Active Form and then
selecting Rebuild Current Sheet
Deleting an Active Form
To remove an Active Form from a worksheet, you must click in the data area of an Active Form and then click
on Active Form | Delete.
Active Forms and special formatting
Supressing zero values: You can selectively suppress or display rows containing only zero values in an
Active Form.
Spreading and holding data: All data spreading and holding operations are fully supported within Active
Forms.
Drill: The ability to drill-to related data displayed in an Active Form is supported (drill processes and rules
must first be set up).
Editing of the row subsets used: The row subset for an Active Form is defined by the TM1RptRow
function and can be changed.
Static lists: The row subset within an Active Form can be saved as a static list by clicking on Active
Form and then selecting Save Row Elements as Static List.
Changing the title element: You can access a completely different view of cube data in the Active Form by
double-clicking a title element in the Active Form, then selecting a new element and clicking on OK.
Inserting a dependent section: An Active Form can be split into multiple sections to access additional
data. An additional Active Section would use the same column and title dimensions as the parent Active
Form with which it is associated but has unique row elements.
Insertion of columns: You can insert a column within an Active Form directly within the Active Form, to the
left of the Active Form, or to the right of the Active Form.
Formatting Active Forms
Active Form formatting is defined via a format range which is hidden within the Active Form worksheet. This
hidden range is revealed by clicking on Active Form and then selecting Show Format Area.
Active Form default formatting
Active Forms must have the default formatting defined in rows 1 to 8 where row 1 will always have the Begin
Format Range label and row 8 will always have the End Format Range label:
Learn about tm1
planning analytics training by watching the OnlineITGuru Cognos video now.
Modifying default formatting
Even though the formatting range for an Active Form is initially defined in rows 2 through 7, you can create multiple
additional format definitions and insert them between the Begin Format Range and End Format Range labels of
the Active Form:
1. Click on the End Format Range label.
2. From the Excel Insert menu, click on Row.
3. Use the Excel Format Cells dialog box to apply formatting to the cells in the new formatting row.
4. In column A, assign a unique format definition label to the formatting row.
Active Form limitations
There are some limitations with using Active Forms:
Worksheet names cannot include a dash (-) character.
Merging cells in an Active Form always requires a rebuild of the worksheet or workbook.
Active Forms require at least one-row dimension.
TM1 reports
TM1 reports must be created from a TM1 slice (described earlier in this chapter). From there, TM1 reports utilize a
Report Generation Wizard to:
Select the worksheets to be included in the report
Select the title dimensions and subsets for the report
Select workbook print options
Select a print destination for the report (printer, Excel file, or PDF file)
Save the report settings
TM1 Print Report Wizard
To use the reporting wizard, from the menu bar, click on TM1, then select the Print Report option. From the Print
Report Wizard dialog, you can select the desired options and click on Next to step through and set up all of the
report options and then click on Finish.
Selecting the sheets
You can use TM1 Print Report Wizard to select any (or all) of the worksheets from the current Excel workbook to
include in your report. In the wizard, you can select the checkbox of the worksheet that you want to include in the
report or you can click on Select All to include all of the worksheets in the current workbook in the report.
Selecting the title dimensions
You can select the title dimensions to be included in the report by selecting and moving them from the Available
Title Dimensions list to the Selected Title Dimensions list.
Selecting workbook print options
Print a single workbook or print multiple workbooks: You can use TM1 Print Report Wizard to print a
single workbook or even multiple workbooks.
Selecting a print destination: The final step in using TM1 Print Report Wizard to create a report is to select
a print destination of a printer, Excel file, or PDF file. Printing options available include the printer name,
number of copies, print to file, and collate.
Saving the TM1 report as an Excel or PDF document: You can select the Save as Excel Files or Save
as PDF Files option on third screen of the TM1 Print Report Wizard to save the report in the desired format.
For these options you can provide the following:
1. Generate a new workbook for each title.
2. Generate a file name for Excel or PDF.
3. Generate a directory name or location in which to save the output file(s).
4. For Excel output files, specify if the generated report will include TM1 formulas to access TM1 data in the
future.
TM1 Web
TM1 Web allows access to the cube data, provides the ability to view and edit via Excel reports, drill, pivot, select,
and filter the TM1 data, cube data sourced charts, and even some TM1 Server Administrator tasks.
TM1 Websheets
It should be understood that the websheet version of the Excel sheet will have various visual differences but it
does support the following Excel features:
Hiding columns
Conditional formatting
Hyperlinking
Freeze panes
Cell protection
In this websheet a user can:
Enter data in cells to which they have write access
Use the data spreading feature of TM1
Drill to relational tables or other cubes
View Excel charts
Manipulate title element subsets in the Subset Editor
TM1 Web Cube Viewer
To utilize Cube Viewer within TM1 Web you can:
Log in to TM1 Web and open Views in the Navigation pane
Expand the cube views that you are interested in and click on the view that you wish to access
Creating a new TM1 Web cube view
To create a new TM1 Web cube view, you can use the TM1 Web View Builder Wizard.
TM1 Charts
To view cube data in TM1 Web in chart format, you can click on View Chart, View Chart and Grid, or View Grid
from the toolbar.
From the TM1 Web chart display, you can click on Chart Properties to change the chart type, colors, legend, and
3D view elements.
Custom display formats
We reviewed element attributes and the Format attribute. Again, to revisit, this attribute allows the definition of a
number of formats for numbers, dates, times, and strings If you right-click on a dimension, click on Edit Element
Attributes, and then click on the cell at the intersection of the Format column and the element for which you want
to define a display format, TM1 will allow you to select a standard format for that element or define your own.
These formats will be applied to all cells in the defined data intersection.
Get the cognos tm1 training course for great career growth.

More Related Content

What's hot

Lesson Four PowerPoint
Lesson Four PowerPointLesson Four PowerPoint
Lesson Four PowerPointmarkcoleman31
 
Customizing Forms
Customizing FormsCustomizing Forms
Customizing FormsEMAINT
 
Exp2003 exl ppt_01
Exp2003 exl ppt_01Exp2003 exl ppt_01
Exp2003 exl ppt_01lonetree
 
Mr20 enus 07-Report Design in Management Reporter 2.0 for Microsoft Dynamics®...
Mr20 enus 07-Report Design in Management Reporter 2.0 for Microsoft Dynamics®...Mr20 enus 07-Report Design in Management Reporter 2.0 for Microsoft Dynamics®...
Mr20 enus 07-Report Design in Management Reporter 2.0 for Microsoft Dynamics®...Sami JAMMALI
 
Lecture 10: introduction to computer
Lecture 10: introduction to computerLecture 10: introduction to computer
Lecture 10: introduction to computerSultan Omar Shige
 
Exp2003 exl ppt_03
Exp2003 exl ppt_03Exp2003 exl ppt_03
Exp2003 exl ppt_03lonetree
 
MS EXCEL PPT PRESENTATION
MS EXCEL PPT PRESENTATIONMS EXCEL PPT PRESENTATION
MS EXCEL PPT PRESENTATIONMridul Bansal
 
Libre Office Calc Lesson 4: Understanding Functions
Libre Office Calc Lesson 4: Understanding FunctionsLibre Office Calc Lesson 4: Understanding Functions
Libre Office Calc Lesson 4: Understanding FunctionsSmart Chicago Collaborative
 
Tips and Tricks
Tips and TricksTips and Tricks
Tips and TricksEMAINT
 
High score plus guide (3)
High score plus guide (3)High score plus guide (3)
High score plus guide (3)SUTAPA DEB
 
Detail Views
Detail ViewsDetail Views
Detail ViewsEMAINT
 
Coord transform 082014
Coord transform 082014Coord transform 082014
Coord transform 082014PramodPandit9
 
Access advanced tutorial
Access advanced tutorialAccess advanced tutorial
Access advanced tutorialcatacata1976
 
Pagelayout & data tab of ms excel 2010
Pagelayout & data tab of ms excel 2010Pagelayout & data tab of ms excel 2010
Pagelayout & data tab of ms excel 2010Nitish Kumar
 

What's hot (20)

MS Excel Tips & Tricks
MS Excel Tips & TricksMS Excel Tips & Tricks
MS Excel Tips & Tricks
 
Excel chapter-4
Excel chapter-4Excel chapter-4
Excel chapter-4
 
Lesson Four PowerPoint
Lesson Four PowerPointLesson Four PowerPoint
Lesson Four PowerPoint
 
Customizing Forms
Customizing FormsCustomizing Forms
Customizing Forms
 
Exp2003 exl ppt_01
Exp2003 exl ppt_01Exp2003 exl ppt_01
Exp2003 exl ppt_01
 
Mr20 enus 07-Report Design in Management Reporter 2.0 for Microsoft Dynamics®...
Mr20 enus 07-Report Design in Management Reporter 2.0 for Microsoft Dynamics®...Mr20 enus 07-Report Design in Management Reporter 2.0 for Microsoft Dynamics®...
Mr20 enus 07-Report Design in Management Reporter 2.0 for Microsoft Dynamics®...
 
Lecture 10: introduction to computer
Lecture 10: introduction to computerLecture 10: introduction to computer
Lecture 10: introduction to computer
 
Exp2003 exl ppt_03
Exp2003 exl ppt_03Exp2003 exl ppt_03
Exp2003 exl ppt_03
 
MS EXCEL PPT PRESENTATION
MS EXCEL PPT PRESENTATIONMS EXCEL PPT PRESENTATION
MS EXCEL PPT PRESENTATION
 
Libre Office Calc Lesson 4: Understanding Functions
Libre Office Calc Lesson 4: Understanding FunctionsLibre Office Calc Lesson 4: Understanding Functions
Libre Office Calc Lesson 4: Understanding Functions
 
Tips and Tricks
Tips and TricksTips and Tricks
Tips and Tricks
 
Access4
Access4Access4
Access4
 
Excel 2007 Unit C
Excel 2007 Unit CExcel 2007 Unit C
Excel 2007 Unit C
 
High score plus guide (3)
High score plus guide (3)High score plus guide (3)
High score plus guide (3)
 
Detail Views
Detail ViewsDetail Views
Detail Views
 
MSC Generator
MSC GeneratorMSC Generator
MSC Generator
 
Coord transform 082014
Coord transform 082014Coord transform 082014
Coord transform 082014
 
Access advanced tutorial
Access advanced tutorialAccess advanced tutorial
Access advanced tutorial
 
Dynamic Chart Switcher
Dynamic Chart SwitcherDynamic Chart Switcher
Dynamic Chart Switcher
 
Pagelayout & data tab of ms excel 2010
Pagelayout & data tab of ms excel 2010Pagelayout & data tab of ms excel 2010
Pagelayout & data tab of ms excel 2010
 

Similar to Data Presentation and Reporting in Cognos TM1

Libre Office Calc Lesson 2: Formatting and Charts
Libre Office Calc Lesson 2: Formatting and ChartsLibre Office Calc Lesson 2: Formatting and Charts
Libre Office Calc Lesson 2: Formatting and ChartsSmart Chicago Collaborative
 
Microsoft excel training
Microsoft excel trainingMicrosoft excel training
Microsoft excel trainingMohamed Hassan
 
Healthcare professionals face ethical questions every day. This is
Healthcare professionals face ethical questions every day. This isHealthcare professionals face ethical questions every day. This is
Healthcare professionals face ethical questions every day. This isSusanaFurman449
 
Management of database information system
Management of database information systemManagement of database information system
Management of database information systemKAZEMBETVOnline
 
Learn Advanced Excel Online
Learn Advanced Excel OnlineLearn Advanced Excel Online
Learn Advanced Excel Onlinebigspire
 
MS Excel 2013.pptx
MS Excel 2013.pptxMS Excel 2013.pptx
MS Excel 2013.pptxRobbia Rana
 
CREATING A DATASET FROM EXCEL IN POWER BI REPORT BUILDER
CREATING A DATASET FROM EXCEL IN POWER BI REPORT BUILDERCREATING A DATASET FROM EXCEL IN POWER BI REPORT BUILDER
CREATING A DATASET FROM EXCEL IN POWER BI REPORT BUILDERSagarDuttPhuloria
 
Create a PivotTable to analyze worksheet data.pdf
Create a PivotTable to analyze worksheet data.pdfCreate a PivotTable to analyze worksheet data.pdf
Create a PivotTable to analyze worksheet data.pdfAbubakar Bashir
 
Excel creating pivot table
Excel creating pivot tableExcel creating pivot table
Excel creating pivot tablesamikshaa sinha
 
Spreadsheets Introduction using RM Number Magic
Spreadsheets Introduction using RM Number MagicSpreadsheets Introduction using RM Number Magic
Spreadsheets Introduction using RM Number MagicMalcolm Wilson
 
MS Excel and Visual Basic Applications.pptx
MS Excel and Visual Basic Applications.pptxMS Excel and Visual Basic Applications.pptx
MS Excel and Visual Basic Applications.pptxsurekha1287
 
Report painter in SAP
Report painter in SAPReport painter in SAP
Report painter in SAPRajeev Kumar
 

Similar to Data Presentation and Reporting in Cognos TM1 (20)

MS Excel 2013
MS Excel 2013MS Excel 2013
MS Excel 2013
 
Libre Office Calc Lesson 2: Formatting and Charts
Libre Office Calc Lesson 2: Formatting and ChartsLibre Office Calc Lesson 2: Formatting and Charts
Libre Office Calc Lesson 2: Formatting and Charts
 
Microsoft excel training
Microsoft excel trainingMicrosoft excel training
Microsoft excel training
 
Microsoft Excel Tutorial
Microsoft Excel TutorialMicrosoft Excel Tutorial
Microsoft Excel Tutorial
 
Excel 2011-cheat-sheet
Excel 2011-cheat-sheetExcel 2011-cheat-sheet
Excel 2011-cheat-sheet
 
Healthcare professionals face ethical questions every day. This is
Healthcare professionals face ethical questions every day. This isHealthcare professionals face ethical questions every day. This is
Healthcare professionals face ethical questions every day. This is
 
Management of database information system
Management of database information systemManagement of database information system
Management of database information system
 
Learn Advanced Excel Online
Learn Advanced Excel OnlineLearn Advanced Excel Online
Learn Advanced Excel Online
 
Excel Intro Part2
Excel Intro Part2Excel Intro Part2
Excel Intro Part2
 
MS Excel 2013.pptx
MS Excel 2013.pptxMS Excel 2013.pptx
MS Excel 2013.pptx
 
CREATING A DATASET FROM EXCEL IN POWER BI REPORT BUILDER
CREATING A DATASET FROM EXCEL IN POWER BI REPORT BUILDERCREATING A DATASET FROM EXCEL IN POWER BI REPORT BUILDER
CREATING A DATASET FROM EXCEL IN POWER BI REPORT BUILDER
 
Microsoft Excel Training
Microsoft Excel TrainingMicrosoft Excel Training
Microsoft Excel Training
 
MS Excel 2010 tutorial 6
MS Excel 2010 tutorial 6MS Excel 2010 tutorial 6
MS Excel 2010 tutorial 6
 
Create a PivotTable to analyze worksheet data.pdf
Create a PivotTable to analyze worksheet data.pdfCreate a PivotTable to analyze worksheet data.pdf
Create a PivotTable to analyze worksheet data.pdf
 
Excel creating pivot table
Excel creating pivot tableExcel creating pivot table
Excel creating pivot table
 
Print18
Print18Print18
Print18
 
Spreadsheets Introduction using RM Number Magic
Spreadsheets Introduction using RM Number MagicSpreadsheets Introduction using RM Number Magic
Spreadsheets Introduction using RM Number Magic
 
MS Excel and Visual Basic Applications.pptx
MS Excel and Visual Basic Applications.pptxMS Excel and Visual Basic Applications.pptx
MS Excel and Visual Basic Applications.pptx
 
Report painter in SAP
Report painter in SAPReport painter in SAP
Report painter in SAP
 
05.formatting cells
05.formatting cells05.formatting cells
05.formatting cells
 

More from veeracynixit

Servicenow it management tools
Servicenow it management toolsServicenow it management tools
Servicenow it management toolsveeracynixit
 
Apache avro data serialization framework
Apache avro   data serialization frameworkApache avro   data serialization framework
Apache avro data serialization frameworkveeracynixit
 
Android memory and performance optimization
Android memory and performance optimizationAndroid memory and performance optimization
Android memory and performance optimizationveeracynixit
 
Android memory and performance optimization
Android memory and performance optimizationAndroid memory and performance optimization
Android memory and performance optimizationveeracynixit
 
Big data overview of apache hadoop
Big data overview of apache hadoopBig data overview of apache hadoop
Big data overview of apache hadoopveeracynixit
 
Ios actions and outlets
Ios actions and outletsIos actions and outlets
Ios actions and outletsveeracynixit
 
New in Hadoop: You should know the Various File Format in Hadoop.
New in Hadoop: You should know the Various File Format in Hadoop.New in Hadoop: You should know the Various File Format in Hadoop.
New in Hadoop: You should know the Various File Format in Hadoop.veeracynixit
 
Ios actions and outlets
Ios actions and outletsIos actions and outlets
Ios actions and outletsveeracynixit
 
Big data overview of apache hadoop
Big data overview of apache hadoopBig data overview of apache hadoop
Big data overview of apache hadoopveeracynixit
 
Android memory and performance optimization
Android memory and performance optimizationAndroid memory and performance optimization
Android memory and performance optimizationveeracynixit
 

More from veeracynixit (10)

Servicenow it management tools
Servicenow it management toolsServicenow it management tools
Servicenow it management tools
 
Apache avro data serialization framework
Apache avro   data serialization frameworkApache avro   data serialization framework
Apache avro data serialization framework
 
Android memory and performance optimization
Android memory and performance optimizationAndroid memory and performance optimization
Android memory and performance optimization
 
Android memory and performance optimization
Android memory and performance optimizationAndroid memory and performance optimization
Android memory and performance optimization
 
Big data overview of apache hadoop
Big data overview of apache hadoopBig data overview of apache hadoop
Big data overview of apache hadoop
 
Ios actions and outlets
Ios actions and outletsIos actions and outlets
Ios actions and outlets
 
New in Hadoop: You should know the Various File Format in Hadoop.
New in Hadoop: You should know the Various File Format in Hadoop.New in Hadoop: You should know the Various File Format in Hadoop.
New in Hadoop: You should know the Various File Format in Hadoop.
 
Ios actions and outlets
Ios actions and outletsIos actions and outlets
Ios actions and outlets
 
Big data overview of apache hadoop
Big data overview of apache hadoopBig data overview of apache hadoop
Big data overview of apache hadoop
 
Android memory and performance optimization
Android memory and performance optimizationAndroid memory and performance optimization
Android memory and performance optimization
 

Recently uploaded

Injustice - Developers Among Us (SciFiDevCon 2024)
Injustice - Developers Among Us (SciFiDevCon 2024)Injustice - Developers Among Us (SciFiDevCon 2024)
Injustice - Developers Among Us (SciFiDevCon 2024)Allon Mureinik
 
How to convert PDF to text with Nanonets
How to convert PDF to text with NanonetsHow to convert PDF to text with Nanonets
How to convert PDF to text with Nanonetsnaman860154
 
Connect Wave/ connectwave Pitch Deck Presentation
Connect Wave/ connectwave Pitch Deck PresentationConnect Wave/ connectwave Pitch Deck Presentation
Connect Wave/ connectwave Pitch Deck PresentationSlibray Presentation
 
Streamlining Python Development: A Guide to a Modern Project Setup
Streamlining Python Development: A Guide to a Modern Project SetupStreamlining Python Development: A Guide to a Modern Project Setup
Streamlining Python Development: A Guide to a Modern Project SetupFlorian Wilhelm
 
CloudStudio User manual (basic edition):
CloudStudio User manual (basic edition):CloudStudio User manual (basic edition):
CloudStudio User manual (basic edition):comworks
 
SQL Database Design For Developers at php[tek] 2024
SQL Database Design For Developers at php[tek] 2024SQL Database Design For Developers at php[tek] 2024
SQL Database Design For Developers at php[tek] 2024Scott Keck-Warren
 
Install Stable Diffusion in windows machine
Install Stable Diffusion in windows machineInstall Stable Diffusion in windows machine
Install Stable Diffusion in windows machinePadma Pradeep
 
Beyond Boundaries: Leveraging No-Code Solutions for Industry Innovation
Beyond Boundaries: Leveraging No-Code Solutions for Industry InnovationBeyond Boundaries: Leveraging No-Code Solutions for Industry Innovation
Beyond Boundaries: Leveraging No-Code Solutions for Industry InnovationSafe Software
 
Key Features Of Token Development (1).pptx
Key  Features Of Token  Development (1).pptxKey  Features Of Token  Development (1).pptx
Key Features Of Token Development (1).pptxLBM Solutions
 
Designing IA for AI - Information Architecture Conference 2024
Designing IA for AI - Information Architecture Conference 2024Designing IA for AI - Information Architecture Conference 2024
Designing IA for AI - Information Architecture Conference 2024Enterprise Knowledge
 
Unleash Your Potential - Namagunga Girls Coding Club
Unleash Your Potential - Namagunga Girls Coding ClubUnleash Your Potential - Namagunga Girls Coding Club
Unleash Your Potential - Namagunga Girls Coding ClubKalema Edgar
 
Enhancing Worker Digital Experience: A Hands-on Workshop for Partners
Enhancing Worker Digital Experience: A Hands-on Workshop for PartnersEnhancing Worker Digital Experience: A Hands-on Workshop for Partners
Enhancing Worker Digital Experience: A Hands-on Workshop for PartnersThousandEyes
 
Scanning the Internet for External Cloud Exposures via SSL Certs
Scanning the Internet for External Cloud Exposures via SSL CertsScanning the Internet for External Cloud Exposures via SSL Certs
Scanning the Internet for External Cloud Exposures via SSL CertsRizwan Syed
 
Are Multi-Cloud and Serverless Good or Bad?
Are Multi-Cloud and Serverless Good or Bad?Are Multi-Cloud and Serverless Good or Bad?
Are Multi-Cloud and Serverless Good or Bad?Mattias Andersson
 
Integration and Automation in Practice: CI/CD in Mule Integration and Automat...
Integration and Automation in Practice: CI/CD in Mule Integration and Automat...Integration and Automation in Practice: CI/CD in Mule Integration and Automat...
Integration and Automation in Practice: CI/CD in Mule Integration and Automat...Patryk Bandurski
 
SIEMENS: RAPUNZEL – A Tale About Knowledge Graph
SIEMENS: RAPUNZEL – A Tale About Knowledge GraphSIEMENS: RAPUNZEL – A Tale About Knowledge Graph
SIEMENS: RAPUNZEL – A Tale About Knowledge GraphNeo4j
 
Pigging Solutions in Pet Food Manufacturing
Pigging Solutions in Pet Food ManufacturingPigging Solutions in Pet Food Manufacturing
Pigging Solutions in Pet Food ManufacturingPigging Solutions
 
APIForce Zurich 5 April Automation LPDG
APIForce Zurich 5 April  Automation LPDGAPIForce Zurich 5 April  Automation LPDG
APIForce Zurich 5 April Automation LPDGMarianaLemus7
 
Unlocking the Potential of the Cloud for IBM Power Systems
Unlocking the Potential of the Cloud for IBM Power SystemsUnlocking the Potential of the Cloud for IBM Power Systems
Unlocking the Potential of the Cloud for IBM Power SystemsPrecisely
 
Transcript: New from BookNet Canada for 2024: BNC BiblioShare - Tech Forum 2024
Transcript: New from BookNet Canada for 2024: BNC BiblioShare - Tech Forum 2024Transcript: New from BookNet Canada for 2024: BNC BiblioShare - Tech Forum 2024
Transcript: New from BookNet Canada for 2024: BNC BiblioShare - Tech Forum 2024BookNet Canada
 

Recently uploaded (20)

Injustice - Developers Among Us (SciFiDevCon 2024)
Injustice - Developers Among Us (SciFiDevCon 2024)Injustice - Developers Among Us (SciFiDevCon 2024)
Injustice - Developers Among Us (SciFiDevCon 2024)
 
How to convert PDF to text with Nanonets
How to convert PDF to text with NanonetsHow to convert PDF to text with Nanonets
How to convert PDF to text with Nanonets
 
Connect Wave/ connectwave Pitch Deck Presentation
Connect Wave/ connectwave Pitch Deck PresentationConnect Wave/ connectwave Pitch Deck Presentation
Connect Wave/ connectwave Pitch Deck Presentation
 
Streamlining Python Development: A Guide to a Modern Project Setup
Streamlining Python Development: A Guide to a Modern Project SetupStreamlining Python Development: A Guide to a Modern Project Setup
Streamlining Python Development: A Guide to a Modern Project Setup
 
CloudStudio User manual (basic edition):
CloudStudio User manual (basic edition):CloudStudio User manual (basic edition):
CloudStudio User manual (basic edition):
 
SQL Database Design For Developers at php[tek] 2024
SQL Database Design For Developers at php[tek] 2024SQL Database Design For Developers at php[tek] 2024
SQL Database Design For Developers at php[tek] 2024
 
Install Stable Diffusion in windows machine
Install Stable Diffusion in windows machineInstall Stable Diffusion in windows machine
Install Stable Diffusion in windows machine
 
Beyond Boundaries: Leveraging No-Code Solutions for Industry Innovation
Beyond Boundaries: Leveraging No-Code Solutions for Industry InnovationBeyond Boundaries: Leveraging No-Code Solutions for Industry Innovation
Beyond Boundaries: Leveraging No-Code Solutions for Industry Innovation
 
Key Features Of Token Development (1).pptx
Key  Features Of Token  Development (1).pptxKey  Features Of Token  Development (1).pptx
Key Features Of Token Development (1).pptx
 
Designing IA for AI - Information Architecture Conference 2024
Designing IA for AI - Information Architecture Conference 2024Designing IA for AI - Information Architecture Conference 2024
Designing IA for AI - Information Architecture Conference 2024
 
Unleash Your Potential - Namagunga Girls Coding Club
Unleash Your Potential - Namagunga Girls Coding ClubUnleash Your Potential - Namagunga Girls Coding Club
Unleash Your Potential - Namagunga Girls Coding Club
 
Enhancing Worker Digital Experience: A Hands-on Workshop for Partners
Enhancing Worker Digital Experience: A Hands-on Workshop for PartnersEnhancing Worker Digital Experience: A Hands-on Workshop for Partners
Enhancing Worker Digital Experience: A Hands-on Workshop for Partners
 
Scanning the Internet for External Cloud Exposures via SSL Certs
Scanning the Internet for External Cloud Exposures via SSL CertsScanning the Internet for External Cloud Exposures via SSL Certs
Scanning the Internet for External Cloud Exposures via SSL Certs
 
Are Multi-Cloud and Serverless Good or Bad?
Are Multi-Cloud and Serverless Good or Bad?Are Multi-Cloud and Serverless Good or Bad?
Are Multi-Cloud and Serverless Good or Bad?
 
Integration and Automation in Practice: CI/CD in Mule Integration and Automat...
Integration and Automation in Practice: CI/CD in Mule Integration and Automat...Integration and Automation in Practice: CI/CD in Mule Integration and Automat...
Integration and Automation in Practice: CI/CD in Mule Integration and Automat...
 
SIEMENS: RAPUNZEL – A Tale About Knowledge Graph
SIEMENS: RAPUNZEL – A Tale About Knowledge GraphSIEMENS: RAPUNZEL – A Tale About Knowledge Graph
SIEMENS: RAPUNZEL – A Tale About Knowledge Graph
 
Pigging Solutions in Pet Food Manufacturing
Pigging Solutions in Pet Food ManufacturingPigging Solutions in Pet Food Manufacturing
Pigging Solutions in Pet Food Manufacturing
 
APIForce Zurich 5 April Automation LPDG
APIForce Zurich 5 April  Automation LPDGAPIForce Zurich 5 April  Automation LPDG
APIForce Zurich 5 April Automation LPDG
 
Unlocking the Potential of the Cloud for IBM Power Systems
Unlocking the Potential of the Cloud for IBM Power SystemsUnlocking the Potential of the Cloud for IBM Power Systems
Unlocking the Potential of the Cloud for IBM Power Systems
 
Transcript: New from BookNet Canada for 2024: BNC BiblioShare - Tech Forum 2024
Transcript: New from BookNet Canada for 2024: BNC BiblioShare - Tech Forum 2024Transcript: New from BookNet Canada for 2024: BNC BiblioShare - Tech Forum 2024
Transcript: New from BookNet Canada for 2024: BNC BiblioShare - Tech Forum 2024
 

Data Presentation and Reporting in Cognos TM1

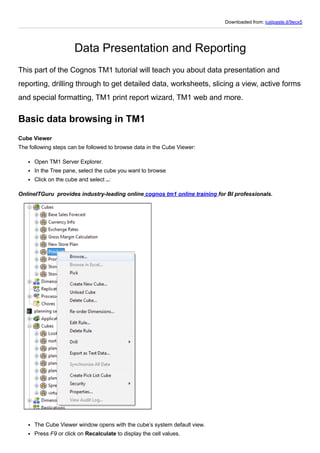
  • 1. Downloaded from: justpaste.it/9ecx5 Data Presentation and Reporting This part of the Cognos TM1 tutorial will teach you about data presentation and reporting, drilling through to get detailed data, worksheets, slicing a view, active forms and special formatting, TM1 print report wizard, TM1 web and more. Basic data browsing in TM1 Cube Viewer The following steps can be followed to browse data in the Cube Viewer: Open TM1 Server Explorer. In the Tree pane, select the cube you want to browse Click on the cube and select ..: OnlineITGuru provides industry-leading online cognos tm1 online training for BI professionals. The Cube Viewer window opens with the cube’s system default view. Press F9 or click on Recalculate to display the cell values.
  • 2. In-Spreadsheet Browser To access data using this tool the following steps should be followed: 1. Open Server Explorer. 2. In the Tree pane, select the cube you want to browse. 3. Click on the cube and select Browse in Excel. Modifying your view of data To do this, the Cube Viewer allows a user to perform the following: Stack dimensions to see more detail along the columns or rows of a view Drill down on the consolidated elements displayed in the view to see the underlying detail Change the title dimension elements in the view to access a completely different view of the cube data Drill-through the view to detailed data Stacking a title dimension as a row dimension To stack a title dimension as a row dimension in Cube Viewer, you can click on the element name in the title dimension and drag that element name to the right or left of a row dimension name. Stacking a title dimension as a column dimension To stack a title dimension as a column dimension in Cube Viewer, you can click on the element name in the title dimension and drag that element name to the right or left of a column dimension name. Drilling down through consolidations In Cube Viewer, a plus sign (+), next to an element name, identifies the element as a consolidation. To view the underlying detail, click on +, and to hide the underlying detail, click on the minus sign (–). Changing title elements in Cube Viewer To change title elements displayed in Cube Viewer, click on the element name arrow, select an element, and press F9. Drilling through to detailed data To access detailed level data for a selected cell of data in Cube Viewer, a drill TI process and drill association rule must be implemented. Saving the view To save a view from Cube Viewer, you can click on File and then select Save. TM1 will prompt you with the TM1 Save View dialog. This dialog allows you to: Set this view as the cube’s default view (only one default view per cube is allowed) Save the view as a private or public view Provide a name for the view Formatting view cells The most common features provided by TM1 to format data displayed in a cube view are: Zero suppression Cell formatting Column orientations Zero suppression You can turn off rows and/or columns that are zero. For row suppression, click on Options | Suppress Zeroes On Rows:
  • 3. For column suppression, click on Options | Suppress Zeroes On Columns: Cell formatting To customize the display of data within a cube view cell, the Format attribute can be used. The Format attribute is a special type of element attribute that determines how data is displayed. The value of the format attribute can be applied to column elements, row elements, or title elements Column orientations You may change it from right to left by clicking on the menu option Layout Right to Left (or Layout Left to Right, depending upon the current view). Worksheets From TM1 Cube Viewer, data can be sliced into Microsoft Excel for analysis and further presentation. Slicing a view To slice a view from Cube Viewer to an Excel worksheet, you can click on File and then select Slice. TM1 will copy the current view into a new MS Excel workbook. Sliced views are still connected to TM1, because TM1 adds the appropriate TM1 functions to the worksheet to retrieve the data from the cube. Snapshots From TM1 Cube Viewer, data can be copied into Microsoft Excel for analysis and further presentation. In contrast to the slice, the snapshot is a copy of the data at that moment in time. To create a snapshot from Cube Viewer, you can click on File and then select Snapshot. Active Forms Active Forms let you view (and update) cube data directly in Excel whenever you are connected to the server on which the cube data resides. There are special groups of TM1 worksheet functions that are used for the support of Active Forms. These groups include:
  • 4. TM1RptView TM1RptTitle TM1RptRow TM1RptFilter TM1RptElLev TM1RptElIsExpanded TM1RptElIsConsolidated Refreshing and recalculating Once you have saved an Active Form, you can refresh the data displayed in it by pressing F9. Additionally, you also have the option to rebuild the current worksheet or current workbook by clicking on Active Form and then selecting Rebuild Current Sheet Deleting an Active Form To remove an Active Form from a worksheet, you must click in the data area of an Active Form and then click on Active Form | Delete. Active Forms and special formatting Supressing zero values: You can selectively suppress or display rows containing only zero values in an Active Form. Spreading and holding data: All data spreading and holding operations are fully supported within Active Forms. Drill: The ability to drill-to related data displayed in an Active Form is supported (drill processes and rules must first be set up). Editing of the row subsets used: The row subset for an Active Form is defined by the TM1RptRow function and can be changed. Static lists: The row subset within an Active Form can be saved as a static list by clicking on Active Form and then selecting Save Row Elements as Static List. Changing the title element: You can access a completely different view of cube data in the Active Form by double-clicking a title element in the Active Form, then selecting a new element and clicking on OK. Inserting a dependent section: An Active Form can be split into multiple sections to access additional data. An additional Active Section would use the same column and title dimensions as the parent Active Form with which it is associated but has unique row elements. Insertion of columns: You can insert a column within an Active Form directly within the Active Form, to the left of the Active Form, or to the right of the Active Form. Formatting Active Forms Active Form formatting is defined via a format range which is hidden within the Active Form worksheet. This hidden range is revealed by clicking on Active Form and then selecting Show Format Area. Active Form default formatting Active Forms must have the default formatting defined in rows 1 to 8 where row 1 will always have the Begin Format Range label and row 8 will always have the End Format Range label: Learn about tm1 planning analytics training by watching the OnlineITGuru Cognos video now.
  • 5. Modifying default formatting Even though the formatting range for an Active Form is initially defined in rows 2 through 7, you can create multiple additional format definitions and insert them between the Begin Format Range and End Format Range labels of the Active Form: 1. Click on the End Format Range label. 2. From the Excel Insert menu, click on Row. 3. Use the Excel Format Cells dialog box to apply formatting to the cells in the new formatting row. 4. In column A, assign a unique format definition label to the formatting row. Active Form limitations There are some limitations with using Active Forms: Worksheet names cannot include a dash (-) character. Merging cells in an Active Form always requires a rebuild of the worksheet or workbook. Active Forms require at least one-row dimension. TM1 reports TM1 reports must be created from a TM1 slice (described earlier in this chapter). From there, TM1 reports utilize a Report Generation Wizard to: Select the worksheets to be included in the report Select the title dimensions and subsets for the report Select workbook print options Select a print destination for the report (printer, Excel file, or PDF file) Save the report settings TM1 Print Report Wizard To use the reporting wizard, from the menu bar, click on TM1, then select the Print Report option. From the Print Report Wizard dialog, you can select the desired options and click on Next to step through and set up all of the report options and then click on Finish. Selecting the sheets You can use TM1 Print Report Wizard to select any (or all) of the worksheets from the current Excel workbook to include in your report. In the wizard, you can select the checkbox of the worksheet that you want to include in the report or you can click on Select All to include all of the worksheets in the current workbook in the report. Selecting the title dimensions You can select the title dimensions to be included in the report by selecting and moving them from the Available Title Dimensions list to the Selected Title Dimensions list. Selecting workbook print options Print a single workbook or print multiple workbooks: You can use TM1 Print Report Wizard to print a single workbook or even multiple workbooks. Selecting a print destination: The final step in using TM1 Print Report Wizard to create a report is to select a print destination of a printer, Excel file, or PDF file. Printing options available include the printer name, number of copies, print to file, and collate. Saving the TM1 report as an Excel or PDF document: You can select the Save as Excel Files or Save as PDF Files option on third screen of the TM1 Print Report Wizard to save the report in the desired format. For these options you can provide the following:
  • 6. 1. Generate a new workbook for each title. 2. Generate a file name for Excel or PDF. 3. Generate a directory name or location in which to save the output file(s). 4. For Excel output files, specify if the generated report will include TM1 formulas to access TM1 data in the future. TM1 Web TM1 Web allows access to the cube data, provides the ability to view and edit via Excel reports, drill, pivot, select, and filter the TM1 data, cube data sourced charts, and even some TM1 Server Administrator tasks. TM1 Websheets It should be understood that the websheet version of the Excel sheet will have various visual differences but it does support the following Excel features: Hiding columns Conditional formatting Hyperlinking Freeze panes Cell protection In this websheet a user can: Enter data in cells to which they have write access Use the data spreading feature of TM1 Drill to relational tables or other cubes View Excel charts Manipulate title element subsets in the Subset Editor TM1 Web Cube Viewer To utilize Cube Viewer within TM1 Web you can: Log in to TM1 Web and open Views in the Navigation pane Expand the cube views that you are interested in and click on the view that you wish to access Creating a new TM1 Web cube view To create a new TM1 Web cube view, you can use the TM1 Web View Builder Wizard. TM1 Charts To view cube data in TM1 Web in chart format, you can click on View Chart, View Chart and Grid, or View Grid from the toolbar. From the TM1 Web chart display, you can click on Chart Properties to change the chart type, colors, legend, and 3D view elements. Custom display formats We reviewed element attributes and the Format attribute. Again, to revisit, this attribute allows the definition of a number of formats for numbers, dates, times, and strings If you right-click on a dimension, click on Edit Element Attributes, and then click on the cell at the intersection of the Format column and the element for which you want to define a display format, TM1 will allow you to select a standard format for that element or define your own. These formats will be applied to all cells in the defined data intersection. Get the cognos tm1 training course for great career growth.