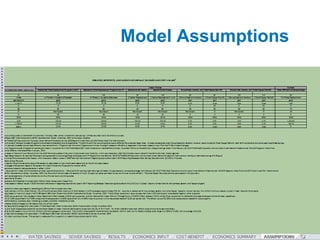
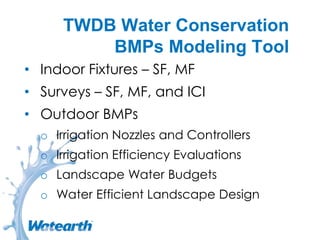
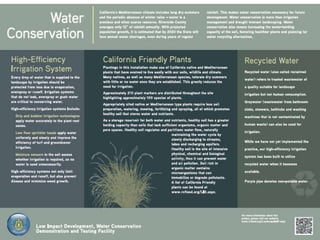
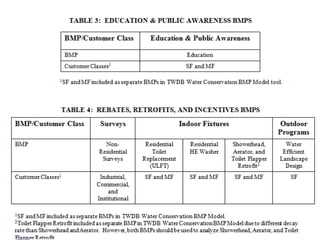
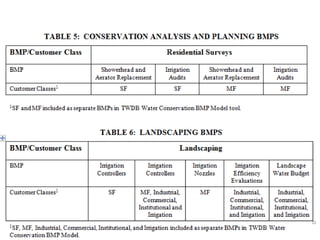
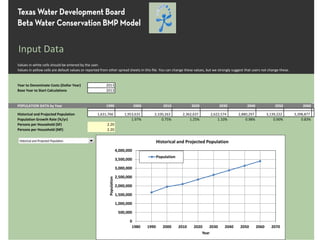
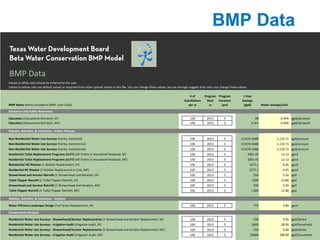
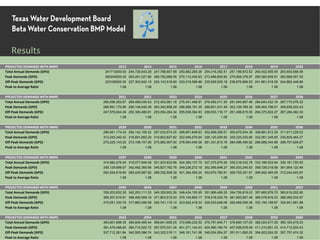
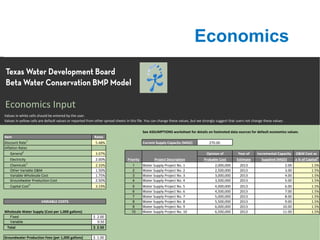
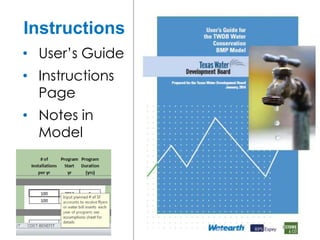
Watearth, Inc. Presents:
Texas Water Development Board
Water Conservation
Best Management Practices Model
Input Data
Invite to TWDB Webinar on
Model or Questions
• Jennifer J. Walker, P.E., D.WRE, CFM
o President, Watearth, Inc.
o jwalker@watearth.com
o 832.444.0663
o www.watearth.com
Project Team
• Texas Water Development Board
o John Sutton
• Watearth, Inc. – Prime
o Jennifer J. Walker, P.E., D.WRE, CFM
• NewGen Strategies & Solutions, LLC
(Formerly J. Stowe & Co.)
o Chris Ekrut
• RPS Espey
o Michael Pinckey, P.E.
0
1
2
3
4
5
6
1 2 3 4 5 6 7 8 9 10 11 12
Avg.MonthlyPrecipitation(in)
Month
Average Monthly Precipitation in Texas Cities
Austin
Dallas-Ft Worth
El Paso
Houston
San Antonio
0
10
20
30
40
50
60
70
80
1940 1950 1960 1970 1980 1990 2000 2010
Annual(in)
Month
Annual Houston Precipitation and Evaporation
Precipitation
Evaporation (lakes in full sun)
0
1
2
3
4
5
6
1 2 3 4 5 6 7 8 9 10 11 12
MedianMonthly(in)
Month
Median Houston Precipitation and Evaporation
Precipitation
Evaporation (lakes in full sun)
Research
Project
• Determining
Cost Benefit
and Demand
Savings of
Municipal
Water
Conservation
Efforts
Model Assumptions
TWDB Water Conservation
BMPs Modeling Tool
• Water Conservation Benefits of
BMP Implementation by Customer
Class
• 32 BMPs in Model
• Analyze 1 or Multiple BMPs
• Cost-Benefit Analysis
• Avoided Costs for
Water/Wastewater Facilities
TWDB Water Conservation
BMPs Modeling Tool
• Indoor Fixtures – SF, MF
• Surveys – SF, MF, and ICI
• Outdoor BMPs
o Irrigation Nozzles and Controllers
o Irrigation Efficiency Evaluations
o Landscape Water Budgets
o Water Efficient Landscape Design
Instructions
Overview
The INPUT DATA and BMP DATA worksheets are required to obtain water savings and results are
computed/reported on the WATER SAVINGS and RESULTS worksheets. Sewer savings are also
computed/reported on the SEWER SAVINGS worksheet; however, these results are used only in the
optional economics avoided costs calculations. If cost-benefit or avoided cost calculations are desired,
the optional ECONOMICS INPUT worksheet must be completed. Results are computed/reported on
the COST-BENEFIT and ECONOMICS SUMMARY worksheets.
Unless
labeled otherwise, all units are in gallons format (gal) or gallons per day (gpd). To facilitate Annual
Reporting, results are also reported in gallons per capita per day (gpcd).
Data entry is required in white-shaded cells. Yellow-shaded cells may be revised; however, default
data may be used if desired. Read instructions below on individual worksheets before revising cells
without white or yellow-shading. Note that other cells are locked for editing and a password is
required (TWDB-BMPS). Do not modify formulas contained in these worksheets. Consult the TWDB
Water Conservation BMP Model User's Guide for details on required data vs. optional data and
additional data sources if local data is not available.
This model does not account for required water efficiency improvements due to plumbing code. This
model is focused on utility savings and benefits and does not calculate participant (i.e., customer) costs
and benefits.
Year to Denominate Costs (Dollar Year) 2013
Base Year to Start Calculations 2013
POPULATION DATA by Year 1990 2000 2010 2020 2030 2040 2050 2060
Historical and Projected Population 1,631,766 1,953,631 2,100,263 2,362,637 2,622,574 2,880,297 3,139,222 3,398,877
Population Growth Rate (%/yr) 1.97% 0.75% 1.25% 1.10% 0.98% 0.90% 0.83%
Persons per Household (SF) 2.20
Persons per Household (MF) 2.20
Input Data
Values in white cells should be entered by the user.
Values in yellow cells are default values or reported from other spread sheets in this file. You can change these values, but we strongly suggest that users not change these.
0
500,000
1,000,000
1,500,000
2,000,000
2,500,000
3,000,000
3,500,000
4,000,000
1980 1990 2000 2010 2020 2030 2040 2050 2060 2070
Population
Year
Historical and Projected Population
Population
Input Data
• Population and Projections
• Year for Economic Calculations
• User Classes – Amount and #
Accounts
• Projected Demands
BMP Data
BMP Data
# of Program Program 1-Year
Installations Start Duration Savings
BMP Name (Items Included in BMP, User Class) per yr yr (yrs) (gpd) Water Savings/Unit
Education and Public Awareness
Education (Educational Outreach, SF) 100 2013 5 95 0.50% gpd/account
Education (Educational Outreach, MF) 100 2013 5 2,341 0.50% gpd/account
Rebates, Retrofits, & Incentives - Indoor Fixtures
Non-Residential Water Use Surveys (Varies, Industrial) 100 2013 5 113370.5688 1,133.71 gpd/account
Non-Residential Water Use Surveys (Varies, Commercial) 100 2013 5 113370.5688 1,133.71 gpd/account
Non-Residential Water Use Surveys (Varies, Institutional) 100 2013 5 113370.5688 1,133.71 gpd/account
Residential Toilet Replacement Programs (ULFT) (All Toilets in Household Replaced, SF) 100 2013 5 2001.45 12.13 gpcd
Residential Toilet Replacement Programs (ULFT) (All Toilets in Household Replaced, MF) 100 2013 5 2001.45 12.13 gpcd
Residential HE Washer (1 Washer Replacement, SF) 100 2013 5 1277.1 6.45 gpcd
Residential HE Washer (1 Washer Replacement in Unit, MF) 100 2013 5 1277.1 6.45 gpcd
Showerhead and Aerator Retrofit (1 Showerhead and Aerators, SF) 100 2013 5 550 5.50 gpd
Toilet Flapper Retrofit (1 Toilet Flapper Retrofit, SF) 100 2013 5 1280 12.80 gpd
Showerhead and Aerator Retrofit (1 Showerhead and Aerators, MF) 100 2013 5 550 5.50 gpd
Toilet Flapper Retrofit (1 Toilet Flapper Retrofit, MF) 100 2013 5 1,280 12.80 gpd
Rebates, Retrofits, & Incentives - Outdoor
Water Efficient Landscape Design (Turf Grass Replacement, SF) 100 2013 5 770 3.50 gpcd
Conservation Analysis
Residential Water Use Surveys - Showerhead/Aerator Replacements (1 Showerhead and Aerator Replacement, SF) 100 2013 5 550 5.50 gpd/device
Residential Water Use Surveys - Irrigation Audit (Irrigation Audit, SF) 100 2013 5 2600 26.00 gpd/household
Residential Water Use Surveys - Showerhead/Aerator Replacements (1 Showerhead and Aerator Replacement, MF) 100 2013 5 550 5.50 gpd/device
Residential Water Use Surveys - Irrigation Audit (Irrigation Audit, MF) 100 2013 5 20800 208.00 gpd/household
Values in white cells should be entered by the user.
Values in yellow cells are default values or reported from other spread sheets in this file. You can change these values, but we strongly suggest that users not change these values.
BMP Data
• # Installations/Year
• Start Year
• Duration of Program
Water Savings
Water Savings
BMP Name 2013 2014 2015 2016 2017 2018 2019 2020
Education (Educational Outreach, SF) 0 95 190 190 190 190 95 0
Education (Educational Outreach, MF) 0 2,341 4,683 4,683 4,683 4,683 2,341 0
Subtotal Education & Public Awareness 0 2,436 4,873 4,873 4,873 4,873 2,436 0
Non-Residential Water Use Surveys (Varies, Industrial) 0 113,371 226,741 340,112 453,482 566,853 453,482 340,112
Non-Residential Water Use Surveys (Varies, Commercial) 0 113,371 226,741 340,112 453,482 566,853 453,482 340,112
Non-Residential Water Use Surveys (Varies, Institutional) 0 113,371 226,741 340,112 453,482 566,853 453,482 340,112
Residential Toilet Replacement Programs (ULFT) (All Toilets in Household Replaced, SF) 0 2,001 4,003 6,004 8,006 10,007 10,007 10,007
Residential Toilet Replacement Programs (ULFT) (All Toilets in Household Replaced, MF) 0 2,001 4,003 6,004 8,006 10,007 10,007 10,007
Residential HE Washer (1 Washer Replacement, SF) 0 1,277 2,554 3,831 5,108 6,386 6,386 6,386
Residential HE Washer (1 Washer Replacement in Unit, MF) 0 1,277 2,554 3,831 5,108 6,386 6,386 6,386
Showerhead and Aerator Retrofit (1 Showerhead and Aerators, SF) 0 550 1,100 1,650 2,200 2,750 2,750 2,750
Toilet Flapper Retrofit (1 Toilet Flapper Retrofit, SF) 0 1,280 2,304 3,123 3,779 4,303 2,418 1,279
Showerhead and Aerator Retrofit (1 Showerhead and Aerators, MF) 0 550 1,100 1,650 2,200 2,750 2,750 2,750
Toilet Flapper Retrofit (1 Toilet Flapper Retrofit, MF) 0 1,280 2,304 3,123 3,779 4,303 2,418 1,279
Subtotal Rebates, Retrofits, & Incentives - Indoor Fixtures 0 350,329 700,146 1,049,553 1,398,632 1,747,450 1,403,569 1,061,179
Annual Water Savings (gpd)
Education and Public Awareness
Rebates, Retrofits, & Incentives - Indoor Fixtures
Sewer Savings
Sewer Savings
BMP Name 2013 2014 2015 2016 2017 2018 2019 2020
Education (Educational Outreach, SF) 0 47 95 95 95 95 47 0
Education (Educational Outreach, MF) 0 1,171 2,341 2,341 2,341 2,341 1,171 0
Subtotal Education & Public Awareness 0 1,218 2,436 2,436 2,436 2,436 1,218 0
Non-Residential Water Use Surveys (Varies, Industrial) 0 86,615 173,230 259,845 346,460 433,076 346,460 259,845
Non-Residential Water Use Surveys (Varies, Commercial) 0 86,615 173,230 259,845 346,460 433,076 346,460 259,845
Non-Residential Water Use Surveys (Varies, Institutional) 0 86,615 173,230 259,845 346,460 433,076 346,460 259,845
Residential Toilet Replacement Programs (ULFT) (All Toilets in Household Replaced, SF) 0 2,001 4,003 6,004 8,006 10,007 10,007 10,007
Residential Toilet Replacement Programs (ULFT) (All Toilets in Household Replaced, MF) 0 2,001 4,003 6,004 8,006 10,007 10,007 10,007
Residential HE Washer (1 Washer Replacement, SF) 0 1,277 2,554 3,831 5,108 6,386 6,386 6,386
Residential HE Washer (1 Washer Replacement in Unit, MF) 0 1,277 2,554 3,831 5,108 6,386 6,386 6,386
Showerhead and Aerator Retrofit (1 Showerhead and Aerators, SF) 0 550 1,100 1,650 2,200 2,750 2,750 2,750
Toilet Flapper Retrofit (1 Toilet Flapper Retrofit, SF) 0 1,280 2,304 3,123 3,779 4,303 2,418 1,279
Showerhead and Aerator Retrofit (1 Showerhead and Aerators, MF) 0 550 1,100 1,650 2,200 2,750 2,750 2,750
Toilet Flapper Retrofit (1 Toilet Flapper Retrofit, MF) 0 1,280 2,304 3,123 3,779 4,303 2,418 1,279
Subtotal Rebates, Retrofits, & Incentives - Indoor Fixtures 0 270,062 539,613 808,754 1,077,567 1,346,118 1,082,503 820,380
Annual Sewer Savings (gpd)
Education & Public Awareness
Rebates, Retrofits, & Incentives - Indoor Fixtures
Results
PROJECTED DEMANDS WITH BMPS 2013 2014 2015 2016 2017 2018 2019 2020
Total Annual Demands (GPD) 241710000.00 244,729,543.28 247,786,807.99 250,882,265.36 254,016,392.51 257,189,672.52 260,402,595.95 263,655,656.58
Peak Demands (GPD) 260240000.00 263,491,027.86 266,782,668.95 270,115,430.63 273,489,826.60 276,906,376.97 280,365,609.91 283,868,057.05
Off-Peak Demands (GPD) 223180000.00 227,303,942.15 230,143,518.90 233,018,568.86 235,929,535.18 238,876,866.53 241,861,018.55 244,882,449.86
Peak to Average Ratio 1.08 1.08 1.08 1.08 1.08 1.08 1.08 1.08
PROJECTED DEMANDS WITH BMPS 2021 2022 2023 2024 2025 2026 2027 2028
Total Annual Demands (GPD) 266,556,393.87 269,489,045.03 272,453,961.18 275,451,496.81 278,482,011.30 281,545,867.48 284,643,432.16 287,775,076.22
Peak Demands (GPD) 286,991,170.99 290,148,645.39 293,340,858.29 296,568,191.35 299,831,031.49 303,129,769.36 306,464,799.91 309,836,522.43
Off-Peak Demands (GPD) 247,576,644.49 250,300,480.61 253,054,284.34 255,838,384.93 258,653,116.17 261,498,815.05 264,375,822.27 267,284,482.30
Peak to Average Ratio 1.08 1.08 1.08 1.08 1.08 1.08 1.08 1.08
PROJECTED DEMANDS WITH BMPS 2029 2030 2031 2032 2033 2034 2035 2036
Total Annual Demands (GPD) 290,941,174.43 294,142,106.02 297,032,674.35 299,951,648.63 302,899,308.01 305,875,934.38 308,881,812.39 311,917,229.52
Peak Demands (GPD) 313,245,340.42 316,691,662.20 319,803,827.62 322,946,576.64 326,120,209.82 329,325,030.66 332,561,345.65 335,829,464.27
Off-Peak Demands (GPD) 270,225,143.22 273,198,157.26 275,882,907.00 278,594,040.08 281,331,815.78 284,096,495.92 286,888,344.89 289,707,629.67
Peak to Average Ratio 1.08 1.08 1.08 1.08 1.08 1.08 1.08 1.08
PROJECTED DEMANDS WITH BMPS 2037 2038 2039 2040 2041 2042 2043 2044
Total Annual Demands (GPD) 314,982,476.04 318,077,845.08 321,203,632.68 324,360,137.75 327,275,979.26 330,218,032.78 333,186,533.94 336,181,720.50
Peak Demands (GPD) 339,129,699.07 342,462,365.66 345,827,782.75 349,226,272.18 352,365,648.27 355,533,245.83 358,729,318.58 361,954,122.48
Off-Peak Demands (GPD) 292,554,619.90 295,429,587.82 298,332,808.39 301,264,559.24 303,972,782.61 306,705,351.61 309,462,485.09 312,244,403.87
Peak to Average Ratio 1.08 1.08 1.08 1.08 1.08 1.08 1.08 1.08
PROJECTED DEMANDS WITH BMPS 2045 2046 2047 2048 2049 2050 2051 2052
Total Annual Demands (GPD) 339,203,832.35 342,253,111.53 345,329,802.26 348,434,150.95 351,566,406.25 354,726,819.02 357,660,876.70 360,619,202.90
Peak Demands (GPD) 365,207,915.81 368,490,959.18 371,803,515.53 375,145,850.17 378,518,230.79 381,920,927.48 385,079,916.23 388,265,033.97
Off-Peak Demands (GPD) 315,051,330.76 317,883,490.58 320,741,110.14 323,624,418.33 326,533,646.08 329,469,026.38 332,194,168.87 334,941,851.88
Peak to Average Ratio 1.08 1.08 1.08 1.08 1.08 1.08 1.08 1.08
PROJECTED DEMANDS WITH BMPS 2053 2054 2055 2056 2057 2058 2059 2060
Total Annual Demands (GPD) 363,601,998.35 366,609,465.44 369,641,808.25 372,699,232.52 375,781,945.71 378,890,157.00 382,024,077.29 385,183,919.23
Peak Demands (GPD) 391,476,496.83 394,714,522.72 397,979,331.34 401,271,144.23 404,590,184.74 407,936,678.08 411,310,851.33 414,712,933.43
Off-Peak Demands (GPD) 337,712,261.84 340,505,586.74 343,322,016.11 346,161,741.06 349,024,954.27 351,911,850.02 354,822,624.20 357,757,474.32
Peak to Average Ratio 1.08 1.08 1.08 1.08 1.08 1.08 1.08 1.08
Economics
Economics Input
See ASSUMPTIONS worksheet for details on footnoted data sources for default economics values.
Item Rates
Discount Rate
1
5.48% Current Supply Capacity (MGD) 270.00
Inflation Rates
General2
3.07% Opinion of Year of Incremental Capacity O&M Cost as
Electricity 2.00% Priority Project Description Probable Cost Estimate Supplied (MGD) a % of Capital5
Chemicals
3
2.33% 1 Water Supply Project No. 1 2,000,000 2013 2.00 1.5%
Other Variable O&M 1.50% 2 Water Supply Project No. 2 2,500,000 2013 3.00 1.5%
Variable Wholesale Cost 1.75% 3 Water Supply Project No. 3 3,000,000 2013 4.00 1.5%
Groundwater Production Cost 2.50% 4 Water Supply Project No. 4 3,500,000 2013 5.00 1.5%
Capital Cost
4
3.19% 5 Water Supply Project No. 5 4,000,000 2013 6.00 1.5%
6 Water Supply Project No. 6 4,500,000 2013 7.00 1.5%
7 Water Supply Project No. 7 5,000,000 2013 8.00 1.5%
VARIABLE COSTS 8 Water Supply Project No. 8 5,500,000 2013 9.00 1.5%
9 Water Supply Project No. 9 6,000,000 2013 10.00 1.5%
Wholesale Water Supply (Cost per 1,000 gallons) 10 Water Supply Project No. 10 6,500,000 2013 11.00 1.5%
Fixed 2.00$
Variable 0.50
Total 2.50$
Groundwater Production Fees (per 1,000 gallons) 1.00$
Values in white cells should be entered by the user.
Values in yellow cells are default values or reported from other spread sheets in this file. You can change these values, but we strongly suggest that users not change these values .
Economic Calculations
• Economic calculations are optional and
not essential to overall model function
• Examples presented herein are samples
based on placeholder data and are not
reflective of a particular program or
experience
• The model’s quantitative results are
useful for decision-making, but other
non-economic qualitative factors may
direct ultimate course of action
Economic Calculations
• Model produces two key metrics
o Benefit-Cost Ratio (“BCR”)
― Designed to quantify economic efficiency of
BMPs
― Assists decision makers in program
implementation to achieve the “biggest bang
for your buck”
o Lost Water and Wastewater Revenue
― Reduced water use = less revenue
Benefit-Cost Ratio (BCR)
• Compares cost of implementation with
benefits of program
BCR > 1 = Benefits outweigh cost
(Economically Viable Alternative)
BCR < 1 = Costs outweigh benefits
(Not Economically Viable)
• BCR value can assist in ranking and making
decisions based on economic efficiency
However qualitative benefits may override
quantitative results
• Calculated in Real Dollars and Present Value
Benefits Considered
• Avoided Variable
Costs
― Wholesale Water Supply
(Variable Portion)
― Groundwater Production
Fees
― Variable Water Operations
and Maintenance (“O&M”)
― Wholesale Wastewater
Treatment (Variable Portion)
― Variable Wastewater O&M
• Costs adjusted annually
for inflationary impact
Benefits Considered
• Delayed Capital Investment and O&M
― Model allows for input of future water supply projects
including cost and capacity
― Using inputs as a baseline, model calculates annual
capital and O&M costs with and without
Conservation impact
― Calculations are then compared and variances due
to delayed investment are considered a benefit of
the program
• Model currently only considers benefits in
delayed water investment – future updates
could consider wastewater investment
Costs Considered
• Cost of BMP Implementation
― Direct Labor and Materials
― Indirect Administration and Overhead –
Includes Program Marketing and Outreach
― Cost of Customer Rebates
Sample BCR Result
BMP not economically
viable, Costs outweigh
Benefits
BMP is economically viable,
Benefits outweigh Costs
Higher BCR indicates
greater economic viability
Lost Revenue Calculations
• Model calculates reduction in water and
wastewater volumes
• Annual reductions are then multiplied by the
current effective rate for water and
wastewater service to determine lost revenue
o No adjustment made at this time for future rate increases
• Does not reflect fixed or variable cost
reductions at this time
o As cost reductions occur, needed revenue will decrease
o Future updates could consider revenue loss on a net basis
Sample Lost Revenue
Calculation
• Program will result in
estimated lost revenue
of over $37,000
• Utility’s variable costs
will be decreased by
approximately $12,000
• Rates will need to be
increased/fixed costs
decreased by $25,000
to account for the
utility’s remaining,
unrecovered fixed cost
Decision Support / Impact Planning
• Primary benefit of economic quantification
is decision support and assessment of
program impact
Overall Program is
economically viable
Assuming no reduction in
current Fixed Costs, revenue
impact of conservation is
significant
“It‟s tough to tell the consumer that „Yeah, well, you guys did a great job out there
conserving water, but lo and behold, we got hurt financially, so we‟ve got to raise your
rates,‟”
– Jim Dockery, Asst. CM, Wichita Falls – Texas Tribune; February 10, 2014
Instructions
• User’s Guide
• Instructions
Page
• Notes in
Model
Beta Testing
• Thank-you to Jennifer Nations with
the City of College Station and
Jessica Woods with the City of
Round Rock.
Acknowledgements
• Austin Water – Mark Jordan
• College Station – Jennifer Nations
• Dallas Water – Carol Davis and Dr. Nguyen
• El Paso - Anai Padilla
• Fort Worth - Mary Gugliuzza and Micah Reed
• Houston – Carol Haddock, P.E.
• Round Rock – Jessica Woods
• San Antonio Water System (SAWS) – Karen Guz & staff
• San Marcos – Jan Klein
• San Angelo – Toni Fox
Future Improvements
• Improved results as additional
research is performed and better
data becomes available
• Additional BMPs
• Customer cost-benefit analysis
2 – 8,000 gal.
2 – 6,000 gal.
28,000 Gallons
24” Supply Line
greywater
Mulch
Basins
Flat Bottom – No Island
Island to Prevent Root Rot
or For Heavy Clay Soils
Greywater
Line
Future Improvements
• It is our hope that statewide use of
the model leads to future
expansions and improvements to
the model by users and the TWDB.
Final Thoughts
• Water Conservation Important Role
• Knowledge of BMP Performance
Continues to Evolve
• Integrating Water Conservation +
Stormwater Increases Benefits
Invite to TWDB Webinar
on Model or Questions
• Jennifer J. Walker, P.E., D.WRE, CFM
o President, Watearth, Inc.
o jwalker@watearth.com
o 832.444.0663
o www.watearth.com

Texas Water Development Board water conservation best management practices model

  • 1.
    Watearth, Inc. Presents: TexasWater Development Board Water Conservation Best Management Practices Model Input Data
  • 2.
    Invite to TWDBWebinar on Model or Questions • Jennifer J. Walker, P.E., D.WRE, CFM o President, Watearth, Inc. o jwalker@watearth.com o 832.444.0663 o www.watearth.com
  • 3.
    Project Team • TexasWater Development Board o John Sutton • Watearth, Inc. – Prime o Jennifer J. Walker, P.E., D.WRE, CFM • NewGen Strategies & Solutions, LLC (Formerly J. Stowe & Co.) o Chris Ekrut • RPS Espey o Michael Pinckey, P.E.
  • 5.
    0 1 2 3 4 5 6 1 2 34 5 6 7 8 9 10 11 12 Avg.MonthlyPrecipitation(in) Month Average Monthly Precipitation in Texas Cities Austin Dallas-Ft Worth El Paso Houston San Antonio
  • 6.
    0 10 20 30 40 50 60 70 80 1940 1950 19601970 1980 1990 2000 2010 Annual(in) Month Annual Houston Precipitation and Evaporation Precipitation Evaporation (lakes in full sun)
  • 7.
    0 1 2 3 4 5 6 1 2 34 5 6 7 8 9 10 11 12 MedianMonthly(in) Month Median Houston Precipitation and Evaporation Precipitation Evaporation (lakes in full sun)
  • 8.
    Research Project • Determining Cost Benefit andDemand Savings of Municipal Water Conservation Efforts
  • 9.
  • 10.
    TWDB Water Conservation BMPsModeling Tool • Water Conservation Benefits of BMP Implementation by Customer Class • 32 BMPs in Model • Analyze 1 or Multiple BMPs • Cost-Benefit Analysis • Avoided Costs for Water/Wastewater Facilities
  • 11.
    TWDB Water Conservation BMPsModeling Tool • Indoor Fixtures – SF, MF • Surveys – SF, MF, and ICI • Outdoor BMPs o Irrigation Nozzles and Controllers o Irrigation Efficiency Evaluations o Landscape Water Budgets o Water Efficient Landscape Design
  • 15.
    Instructions Overview The INPUT DATAand BMP DATA worksheets are required to obtain water savings and results are computed/reported on the WATER SAVINGS and RESULTS worksheets. Sewer savings are also computed/reported on the SEWER SAVINGS worksheet; however, these results are used only in the optional economics avoided costs calculations. If cost-benefit or avoided cost calculations are desired, the optional ECONOMICS INPUT worksheet must be completed. Results are computed/reported on the COST-BENEFIT and ECONOMICS SUMMARY worksheets. Unless labeled otherwise, all units are in gallons format (gal) or gallons per day (gpd). To facilitate Annual Reporting, results are also reported in gallons per capita per day (gpcd). Data entry is required in white-shaded cells. Yellow-shaded cells may be revised; however, default data may be used if desired. Read instructions below on individual worksheets before revising cells without white or yellow-shading. Note that other cells are locked for editing and a password is required (TWDB-BMPS). Do not modify formulas contained in these worksheets. Consult the TWDB Water Conservation BMP Model User's Guide for details on required data vs. optional data and additional data sources if local data is not available. This model does not account for required water efficiency improvements due to plumbing code. This model is focused on utility savings and benefits and does not calculate participant (i.e., customer) costs and benefits.
  • 16.
    Year to DenominateCosts (Dollar Year) 2013 Base Year to Start Calculations 2013 POPULATION DATA by Year 1990 2000 2010 2020 2030 2040 2050 2060 Historical and Projected Population 1,631,766 1,953,631 2,100,263 2,362,637 2,622,574 2,880,297 3,139,222 3,398,877 Population Growth Rate (%/yr) 1.97% 0.75% 1.25% 1.10% 0.98% 0.90% 0.83% Persons per Household (SF) 2.20 Persons per Household (MF) 2.20 Input Data Values in white cells should be entered by the user. Values in yellow cells are default values or reported from other spread sheets in this file. You can change these values, but we strongly suggest that users not change these. 0 500,000 1,000,000 1,500,000 2,000,000 2,500,000 3,000,000 3,500,000 4,000,000 1980 1990 2000 2010 2020 2030 2040 2050 2060 2070 Population Year Historical and Projected Population Population
  • 17.
    Input Data • Populationand Projections • Year for Economic Calculations • User Classes – Amount and # Accounts • Projected Demands
  • 18.
    BMP Data BMP Data #of Program Program 1-Year Installations Start Duration Savings BMP Name (Items Included in BMP, User Class) per yr yr (yrs) (gpd) Water Savings/Unit Education and Public Awareness Education (Educational Outreach, SF) 100 2013 5 95 0.50% gpd/account Education (Educational Outreach, MF) 100 2013 5 2,341 0.50% gpd/account Rebates, Retrofits, & Incentives - Indoor Fixtures Non-Residential Water Use Surveys (Varies, Industrial) 100 2013 5 113370.5688 1,133.71 gpd/account Non-Residential Water Use Surveys (Varies, Commercial) 100 2013 5 113370.5688 1,133.71 gpd/account Non-Residential Water Use Surveys (Varies, Institutional) 100 2013 5 113370.5688 1,133.71 gpd/account Residential Toilet Replacement Programs (ULFT) (All Toilets in Household Replaced, SF) 100 2013 5 2001.45 12.13 gpcd Residential Toilet Replacement Programs (ULFT) (All Toilets in Household Replaced, MF) 100 2013 5 2001.45 12.13 gpcd Residential HE Washer (1 Washer Replacement, SF) 100 2013 5 1277.1 6.45 gpcd Residential HE Washer (1 Washer Replacement in Unit, MF) 100 2013 5 1277.1 6.45 gpcd Showerhead and Aerator Retrofit (1 Showerhead and Aerators, SF) 100 2013 5 550 5.50 gpd Toilet Flapper Retrofit (1 Toilet Flapper Retrofit, SF) 100 2013 5 1280 12.80 gpd Showerhead and Aerator Retrofit (1 Showerhead and Aerators, MF) 100 2013 5 550 5.50 gpd Toilet Flapper Retrofit (1 Toilet Flapper Retrofit, MF) 100 2013 5 1,280 12.80 gpd Rebates, Retrofits, & Incentives - Outdoor Water Efficient Landscape Design (Turf Grass Replacement, SF) 100 2013 5 770 3.50 gpcd Conservation Analysis Residential Water Use Surveys - Showerhead/Aerator Replacements (1 Showerhead and Aerator Replacement, SF) 100 2013 5 550 5.50 gpd/device Residential Water Use Surveys - Irrigation Audit (Irrigation Audit, SF) 100 2013 5 2600 26.00 gpd/household Residential Water Use Surveys - Showerhead/Aerator Replacements (1 Showerhead and Aerator Replacement, MF) 100 2013 5 550 5.50 gpd/device Residential Water Use Surveys - Irrigation Audit (Irrigation Audit, MF) 100 2013 5 20800 208.00 gpd/household Values in white cells should be entered by the user. Values in yellow cells are default values or reported from other spread sheets in this file. You can change these values, but we strongly suggest that users not change these values.
  • 19.
    BMP Data • #Installations/Year • Start Year • Duration of Program
  • 20.
    Water Savings Water Savings BMPName 2013 2014 2015 2016 2017 2018 2019 2020 Education (Educational Outreach, SF) 0 95 190 190 190 190 95 0 Education (Educational Outreach, MF) 0 2,341 4,683 4,683 4,683 4,683 2,341 0 Subtotal Education & Public Awareness 0 2,436 4,873 4,873 4,873 4,873 2,436 0 Non-Residential Water Use Surveys (Varies, Industrial) 0 113,371 226,741 340,112 453,482 566,853 453,482 340,112 Non-Residential Water Use Surveys (Varies, Commercial) 0 113,371 226,741 340,112 453,482 566,853 453,482 340,112 Non-Residential Water Use Surveys (Varies, Institutional) 0 113,371 226,741 340,112 453,482 566,853 453,482 340,112 Residential Toilet Replacement Programs (ULFT) (All Toilets in Household Replaced, SF) 0 2,001 4,003 6,004 8,006 10,007 10,007 10,007 Residential Toilet Replacement Programs (ULFT) (All Toilets in Household Replaced, MF) 0 2,001 4,003 6,004 8,006 10,007 10,007 10,007 Residential HE Washer (1 Washer Replacement, SF) 0 1,277 2,554 3,831 5,108 6,386 6,386 6,386 Residential HE Washer (1 Washer Replacement in Unit, MF) 0 1,277 2,554 3,831 5,108 6,386 6,386 6,386 Showerhead and Aerator Retrofit (1 Showerhead and Aerators, SF) 0 550 1,100 1,650 2,200 2,750 2,750 2,750 Toilet Flapper Retrofit (1 Toilet Flapper Retrofit, SF) 0 1,280 2,304 3,123 3,779 4,303 2,418 1,279 Showerhead and Aerator Retrofit (1 Showerhead and Aerators, MF) 0 550 1,100 1,650 2,200 2,750 2,750 2,750 Toilet Flapper Retrofit (1 Toilet Flapper Retrofit, MF) 0 1,280 2,304 3,123 3,779 4,303 2,418 1,279 Subtotal Rebates, Retrofits, & Incentives - Indoor Fixtures 0 350,329 700,146 1,049,553 1,398,632 1,747,450 1,403,569 1,061,179 Annual Water Savings (gpd) Education and Public Awareness Rebates, Retrofits, & Incentives - Indoor Fixtures
  • 21.
    Sewer Savings Sewer Savings BMPName 2013 2014 2015 2016 2017 2018 2019 2020 Education (Educational Outreach, SF) 0 47 95 95 95 95 47 0 Education (Educational Outreach, MF) 0 1,171 2,341 2,341 2,341 2,341 1,171 0 Subtotal Education & Public Awareness 0 1,218 2,436 2,436 2,436 2,436 1,218 0 Non-Residential Water Use Surveys (Varies, Industrial) 0 86,615 173,230 259,845 346,460 433,076 346,460 259,845 Non-Residential Water Use Surveys (Varies, Commercial) 0 86,615 173,230 259,845 346,460 433,076 346,460 259,845 Non-Residential Water Use Surveys (Varies, Institutional) 0 86,615 173,230 259,845 346,460 433,076 346,460 259,845 Residential Toilet Replacement Programs (ULFT) (All Toilets in Household Replaced, SF) 0 2,001 4,003 6,004 8,006 10,007 10,007 10,007 Residential Toilet Replacement Programs (ULFT) (All Toilets in Household Replaced, MF) 0 2,001 4,003 6,004 8,006 10,007 10,007 10,007 Residential HE Washer (1 Washer Replacement, SF) 0 1,277 2,554 3,831 5,108 6,386 6,386 6,386 Residential HE Washer (1 Washer Replacement in Unit, MF) 0 1,277 2,554 3,831 5,108 6,386 6,386 6,386 Showerhead and Aerator Retrofit (1 Showerhead and Aerators, SF) 0 550 1,100 1,650 2,200 2,750 2,750 2,750 Toilet Flapper Retrofit (1 Toilet Flapper Retrofit, SF) 0 1,280 2,304 3,123 3,779 4,303 2,418 1,279 Showerhead and Aerator Retrofit (1 Showerhead and Aerators, MF) 0 550 1,100 1,650 2,200 2,750 2,750 2,750 Toilet Flapper Retrofit (1 Toilet Flapper Retrofit, MF) 0 1,280 2,304 3,123 3,779 4,303 2,418 1,279 Subtotal Rebates, Retrofits, & Incentives - Indoor Fixtures 0 270,062 539,613 808,754 1,077,567 1,346,118 1,082,503 820,380 Annual Sewer Savings (gpd) Education & Public Awareness Rebates, Retrofits, & Incentives - Indoor Fixtures
  • 22.
    Results PROJECTED DEMANDS WITHBMPS 2013 2014 2015 2016 2017 2018 2019 2020 Total Annual Demands (GPD) 241710000.00 244,729,543.28 247,786,807.99 250,882,265.36 254,016,392.51 257,189,672.52 260,402,595.95 263,655,656.58 Peak Demands (GPD) 260240000.00 263,491,027.86 266,782,668.95 270,115,430.63 273,489,826.60 276,906,376.97 280,365,609.91 283,868,057.05 Off-Peak Demands (GPD) 223180000.00 227,303,942.15 230,143,518.90 233,018,568.86 235,929,535.18 238,876,866.53 241,861,018.55 244,882,449.86 Peak to Average Ratio 1.08 1.08 1.08 1.08 1.08 1.08 1.08 1.08 PROJECTED DEMANDS WITH BMPS 2021 2022 2023 2024 2025 2026 2027 2028 Total Annual Demands (GPD) 266,556,393.87 269,489,045.03 272,453,961.18 275,451,496.81 278,482,011.30 281,545,867.48 284,643,432.16 287,775,076.22 Peak Demands (GPD) 286,991,170.99 290,148,645.39 293,340,858.29 296,568,191.35 299,831,031.49 303,129,769.36 306,464,799.91 309,836,522.43 Off-Peak Demands (GPD) 247,576,644.49 250,300,480.61 253,054,284.34 255,838,384.93 258,653,116.17 261,498,815.05 264,375,822.27 267,284,482.30 Peak to Average Ratio 1.08 1.08 1.08 1.08 1.08 1.08 1.08 1.08 PROJECTED DEMANDS WITH BMPS 2029 2030 2031 2032 2033 2034 2035 2036 Total Annual Demands (GPD) 290,941,174.43 294,142,106.02 297,032,674.35 299,951,648.63 302,899,308.01 305,875,934.38 308,881,812.39 311,917,229.52 Peak Demands (GPD) 313,245,340.42 316,691,662.20 319,803,827.62 322,946,576.64 326,120,209.82 329,325,030.66 332,561,345.65 335,829,464.27 Off-Peak Demands (GPD) 270,225,143.22 273,198,157.26 275,882,907.00 278,594,040.08 281,331,815.78 284,096,495.92 286,888,344.89 289,707,629.67 Peak to Average Ratio 1.08 1.08 1.08 1.08 1.08 1.08 1.08 1.08 PROJECTED DEMANDS WITH BMPS 2037 2038 2039 2040 2041 2042 2043 2044 Total Annual Demands (GPD) 314,982,476.04 318,077,845.08 321,203,632.68 324,360,137.75 327,275,979.26 330,218,032.78 333,186,533.94 336,181,720.50 Peak Demands (GPD) 339,129,699.07 342,462,365.66 345,827,782.75 349,226,272.18 352,365,648.27 355,533,245.83 358,729,318.58 361,954,122.48 Off-Peak Demands (GPD) 292,554,619.90 295,429,587.82 298,332,808.39 301,264,559.24 303,972,782.61 306,705,351.61 309,462,485.09 312,244,403.87 Peak to Average Ratio 1.08 1.08 1.08 1.08 1.08 1.08 1.08 1.08 PROJECTED DEMANDS WITH BMPS 2045 2046 2047 2048 2049 2050 2051 2052 Total Annual Demands (GPD) 339,203,832.35 342,253,111.53 345,329,802.26 348,434,150.95 351,566,406.25 354,726,819.02 357,660,876.70 360,619,202.90 Peak Demands (GPD) 365,207,915.81 368,490,959.18 371,803,515.53 375,145,850.17 378,518,230.79 381,920,927.48 385,079,916.23 388,265,033.97 Off-Peak Demands (GPD) 315,051,330.76 317,883,490.58 320,741,110.14 323,624,418.33 326,533,646.08 329,469,026.38 332,194,168.87 334,941,851.88 Peak to Average Ratio 1.08 1.08 1.08 1.08 1.08 1.08 1.08 1.08 PROJECTED DEMANDS WITH BMPS 2053 2054 2055 2056 2057 2058 2059 2060 Total Annual Demands (GPD) 363,601,998.35 366,609,465.44 369,641,808.25 372,699,232.52 375,781,945.71 378,890,157.00 382,024,077.29 385,183,919.23 Peak Demands (GPD) 391,476,496.83 394,714,522.72 397,979,331.34 401,271,144.23 404,590,184.74 407,936,678.08 411,310,851.33 414,712,933.43 Off-Peak Demands (GPD) 337,712,261.84 340,505,586.74 343,322,016.11 346,161,741.06 349,024,954.27 351,911,850.02 354,822,624.20 357,757,474.32 Peak to Average Ratio 1.08 1.08 1.08 1.08 1.08 1.08 1.08 1.08
  • 23.
    Economics Economics Input See ASSUMPTIONSworksheet for details on footnoted data sources for default economics values. Item Rates Discount Rate 1 5.48% Current Supply Capacity (MGD) 270.00 Inflation Rates General2 3.07% Opinion of Year of Incremental Capacity O&M Cost as Electricity 2.00% Priority Project Description Probable Cost Estimate Supplied (MGD) a % of Capital5 Chemicals 3 2.33% 1 Water Supply Project No. 1 2,000,000 2013 2.00 1.5% Other Variable O&M 1.50% 2 Water Supply Project No. 2 2,500,000 2013 3.00 1.5% Variable Wholesale Cost 1.75% 3 Water Supply Project No. 3 3,000,000 2013 4.00 1.5% Groundwater Production Cost 2.50% 4 Water Supply Project No. 4 3,500,000 2013 5.00 1.5% Capital Cost 4 3.19% 5 Water Supply Project No. 5 4,000,000 2013 6.00 1.5% 6 Water Supply Project No. 6 4,500,000 2013 7.00 1.5% 7 Water Supply Project No. 7 5,000,000 2013 8.00 1.5% VARIABLE COSTS 8 Water Supply Project No. 8 5,500,000 2013 9.00 1.5% 9 Water Supply Project No. 9 6,000,000 2013 10.00 1.5% Wholesale Water Supply (Cost per 1,000 gallons) 10 Water Supply Project No. 10 6,500,000 2013 11.00 1.5% Fixed 2.00$ Variable 0.50 Total 2.50$ Groundwater Production Fees (per 1,000 gallons) 1.00$ Values in white cells should be entered by the user. Values in yellow cells are default values or reported from other spread sheets in this file. You can change these values, but we strongly suggest that users not change these values .
  • 24.
    Economic Calculations • Economiccalculations are optional and not essential to overall model function • Examples presented herein are samples based on placeholder data and are not reflective of a particular program or experience • The model’s quantitative results are useful for decision-making, but other non-economic qualitative factors may direct ultimate course of action
  • 25.
    Economic Calculations • Modelproduces two key metrics o Benefit-Cost Ratio (“BCR”) ― Designed to quantify economic efficiency of BMPs ― Assists decision makers in program implementation to achieve the “biggest bang for your buck” o Lost Water and Wastewater Revenue ― Reduced water use = less revenue
  • 26.
    Benefit-Cost Ratio (BCR) •Compares cost of implementation with benefits of program BCR > 1 = Benefits outweigh cost (Economically Viable Alternative) BCR < 1 = Costs outweigh benefits (Not Economically Viable) • BCR value can assist in ranking and making decisions based on economic efficiency However qualitative benefits may override quantitative results • Calculated in Real Dollars and Present Value
  • 27.
    Benefits Considered • AvoidedVariable Costs ― Wholesale Water Supply (Variable Portion) ― Groundwater Production Fees ― Variable Water Operations and Maintenance (“O&M”) ― Wholesale Wastewater Treatment (Variable Portion) ― Variable Wastewater O&M • Costs adjusted annually for inflationary impact
  • 28.
    Benefits Considered • DelayedCapital Investment and O&M ― Model allows for input of future water supply projects including cost and capacity ― Using inputs as a baseline, model calculates annual capital and O&M costs with and without Conservation impact ― Calculations are then compared and variances due to delayed investment are considered a benefit of the program • Model currently only considers benefits in delayed water investment – future updates could consider wastewater investment
  • 29.
    Costs Considered • Costof BMP Implementation ― Direct Labor and Materials ― Indirect Administration and Overhead – Includes Program Marketing and Outreach ― Cost of Customer Rebates
  • 30.
    Sample BCR Result BMPnot economically viable, Costs outweigh Benefits BMP is economically viable, Benefits outweigh Costs Higher BCR indicates greater economic viability
  • 31.
    Lost Revenue Calculations •Model calculates reduction in water and wastewater volumes • Annual reductions are then multiplied by the current effective rate for water and wastewater service to determine lost revenue o No adjustment made at this time for future rate increases • Does not reflect fixed or variable cost reductions at this time o As cost reductions occur, needed revenue will decrease o Future updates could consider revenue loss on a net basis
  • 32.
    Sample Lost Revenue Calculation •Program will result in estimated lost revenue of over $37,000 • Utility’s variable costs will be decreased by approximately $12,000 • Rates will need to be increased/fixed costs decreased by $25,000 to account for the utility’s remaining, unrecovered fixed cost
  • 33.
    Decision Support /Impact Planning • Primary benefit of economic quantification is decision support and assessment of program impact Overall Program is economically viable Assuming no reduction in current Fixed Costs, revenue impact of conservation is significant “It‟s tough to tell the consumer that „Yeah, well, you guys did a great job out there conserving water, but lo and behold, we got hurt financially, so we‟ve got to raise your rates,‟” – Jim Dockery, Asst. CM, Wichita Falls – Texas Tribune; February 10, 2014
  • 34.
    Instructions • User’s Guide •Instructions Page • Notes in Model
  • 35.
    Beta Testing • Thank-youto Jennifer Nations with the City of College Station and Jessica Woods with the City of Round Rock.
  • 36.
    Acknowledgements • Austin Water– Mark Jordan • College Station – Jennifer Nations • Dallas Water – Carol Davis and Dr. Nguyen • El Paso - Anai Padilla • Fort Worth - Mary Gugliuzza and Micah Reed • Houston – Carol Haddock, P.E. • Round Rock – Jessica Woods • San Antonio Water System (SAWS) – Karen Guz & staff • San Marcos – Jan Klein • San Angelo – Toni Fox
  • 37.
    Future Improvements • Improvedresults as additional research is performed and better data becomes available • Additional BMPs • Customer cost-benefit analysis
  • 38.
    2 – 8,000gal. 2 – 6,000 gal. 28,000 Gallons
  • 39.
  • 42.
  • 43.
    Mulch Basins Flat Bottom –No Island Island to Prevent Root Rot or For Heavy Clay Soils
  • 44.
  • 47.
    Future Improvements • Itis our hope that statewide use of the model leads to future expansions and improvements to the model by users and the TWDB.
  • 48.
    Final Thoughts • WaterConservation Important Role • Knowledge of BMP Performance Continues to Evolve • Integrating Water Conservation + Stormwater Increases Benefits
  • 49.
    Invite to TWDBWebinar on Model or Questions • Jennifer J. Walker, P.E., D.WRE, CFM o President, Watearth, Inc. o jwalker@watearth.com o 832.444.0663 o www.watearth.com