Download to read offline

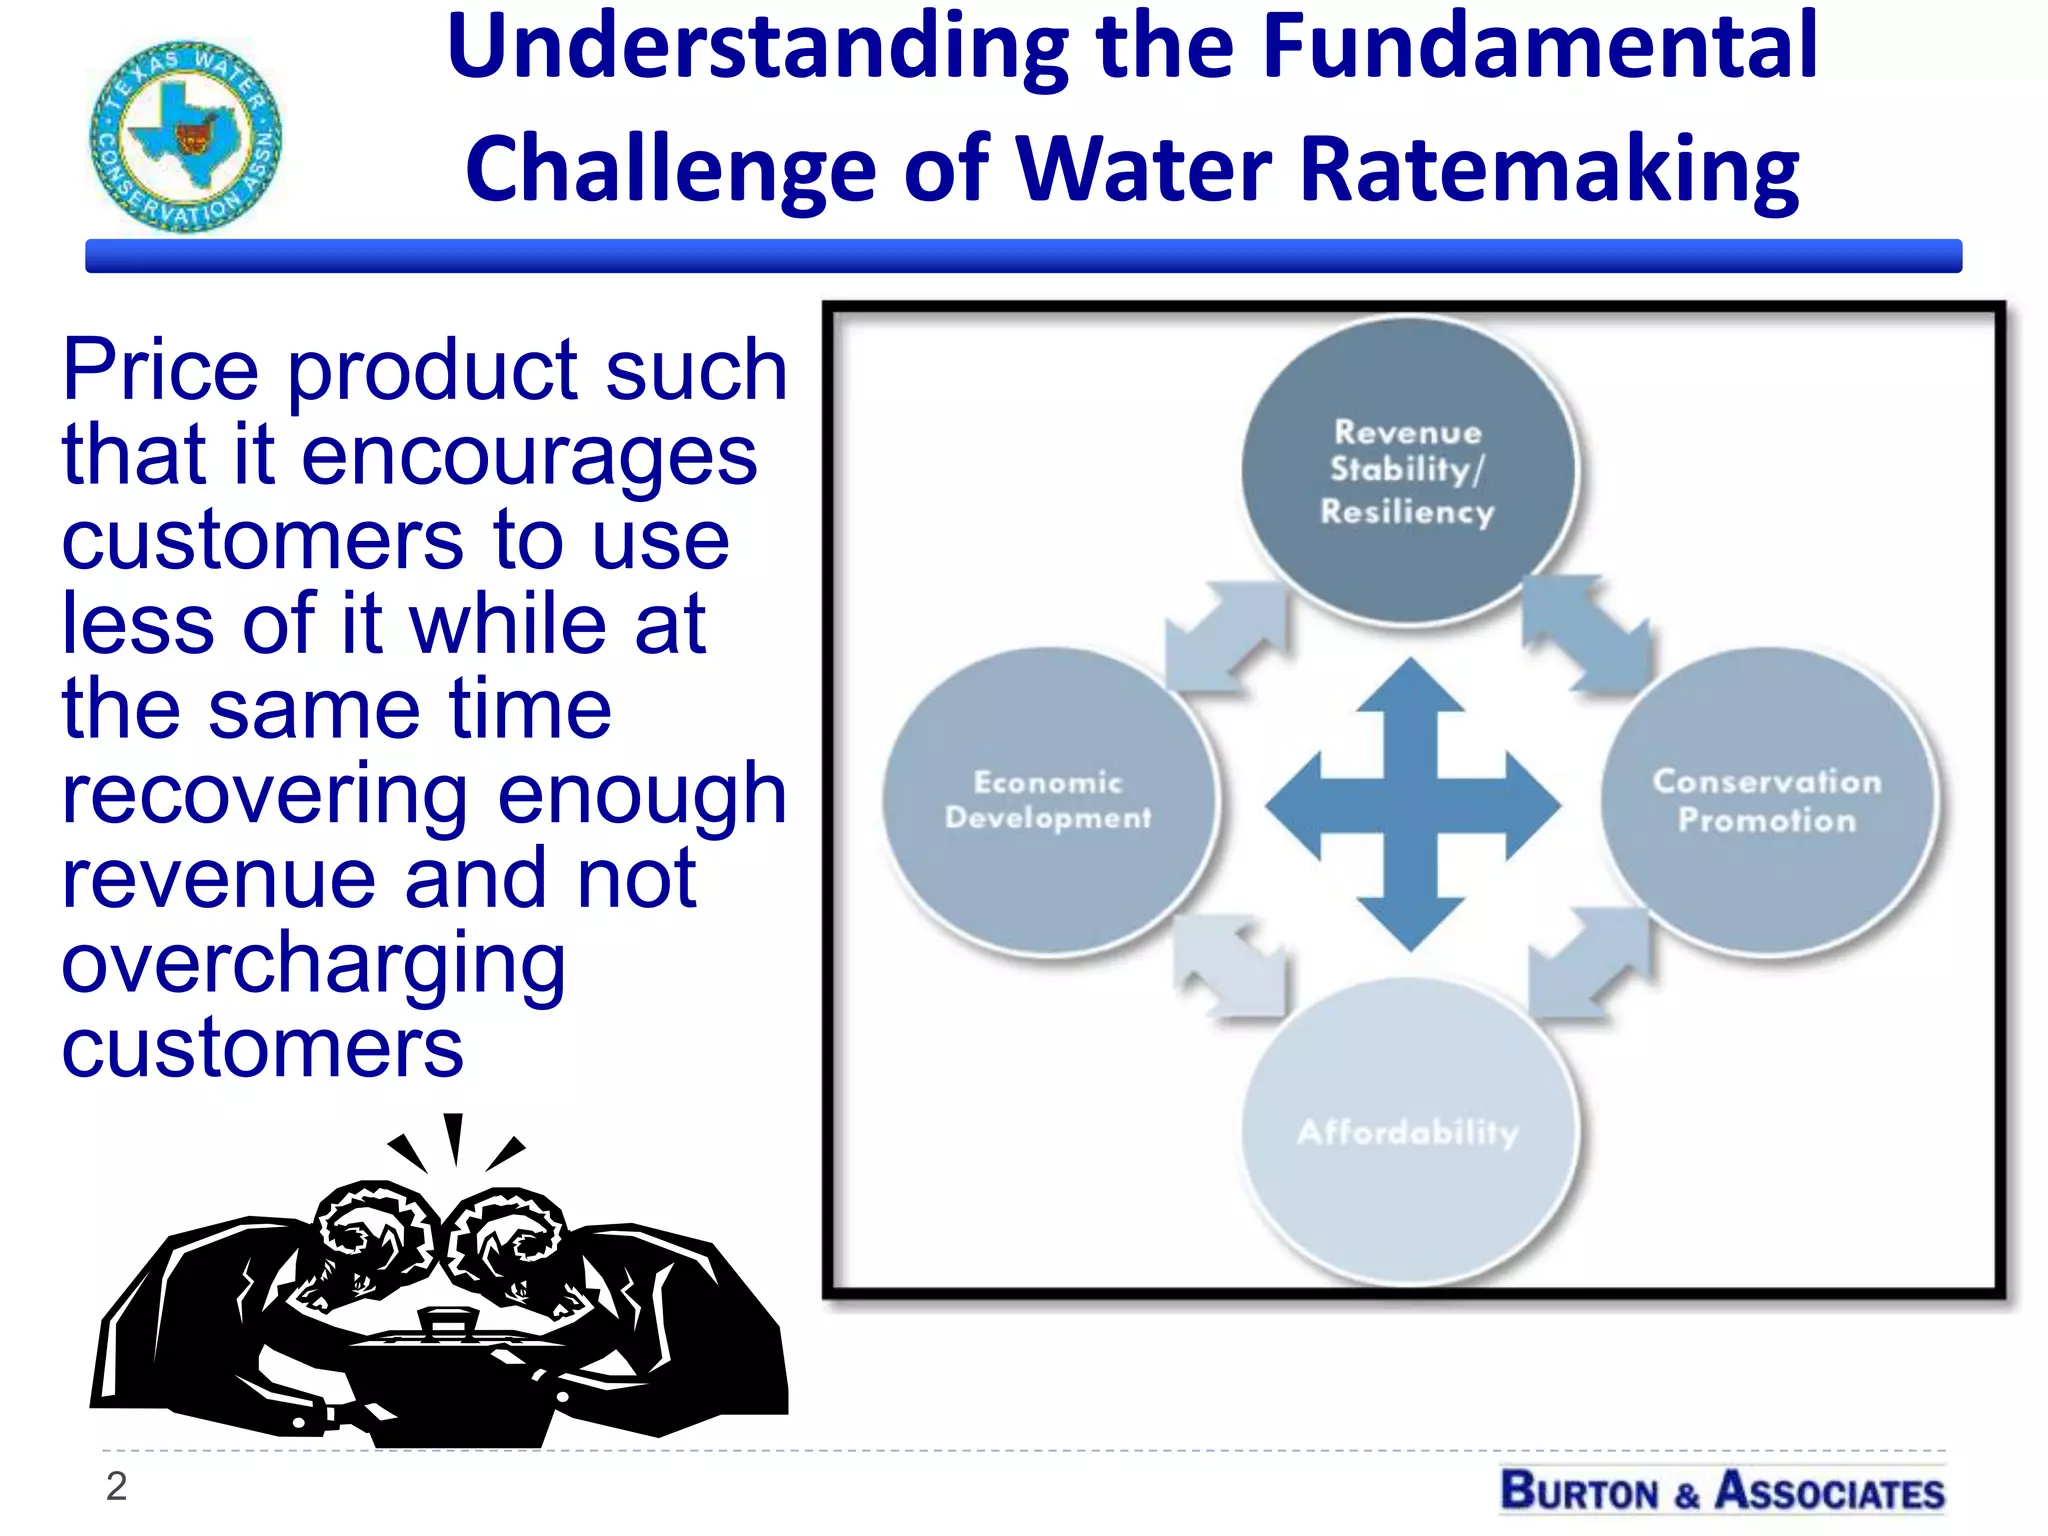
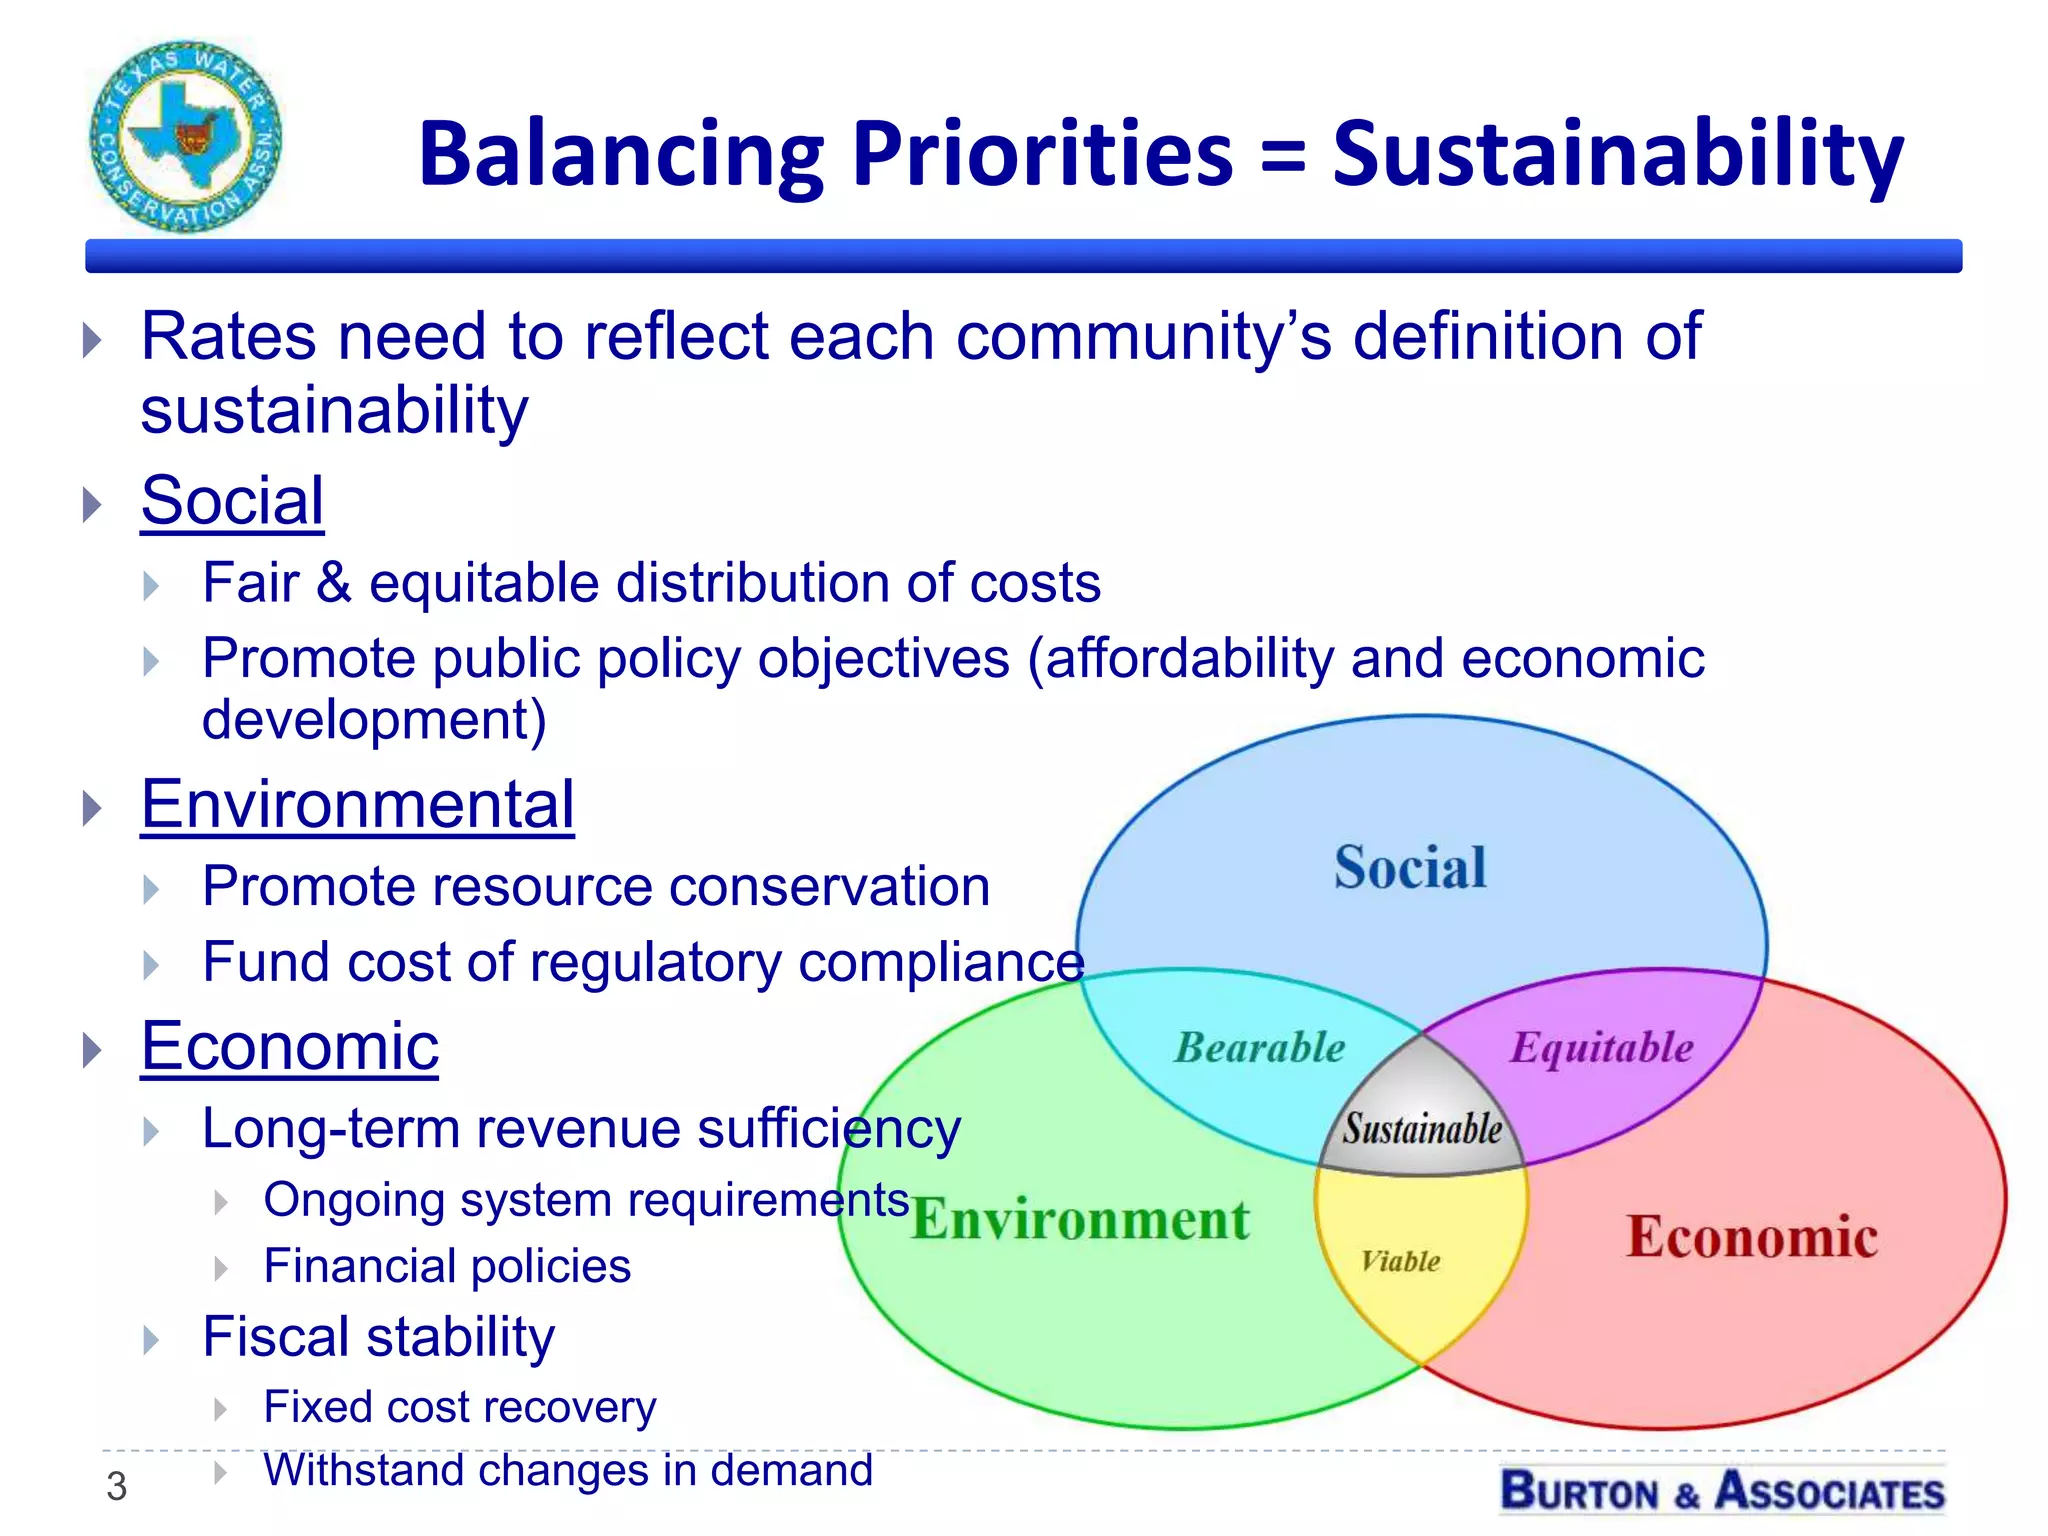
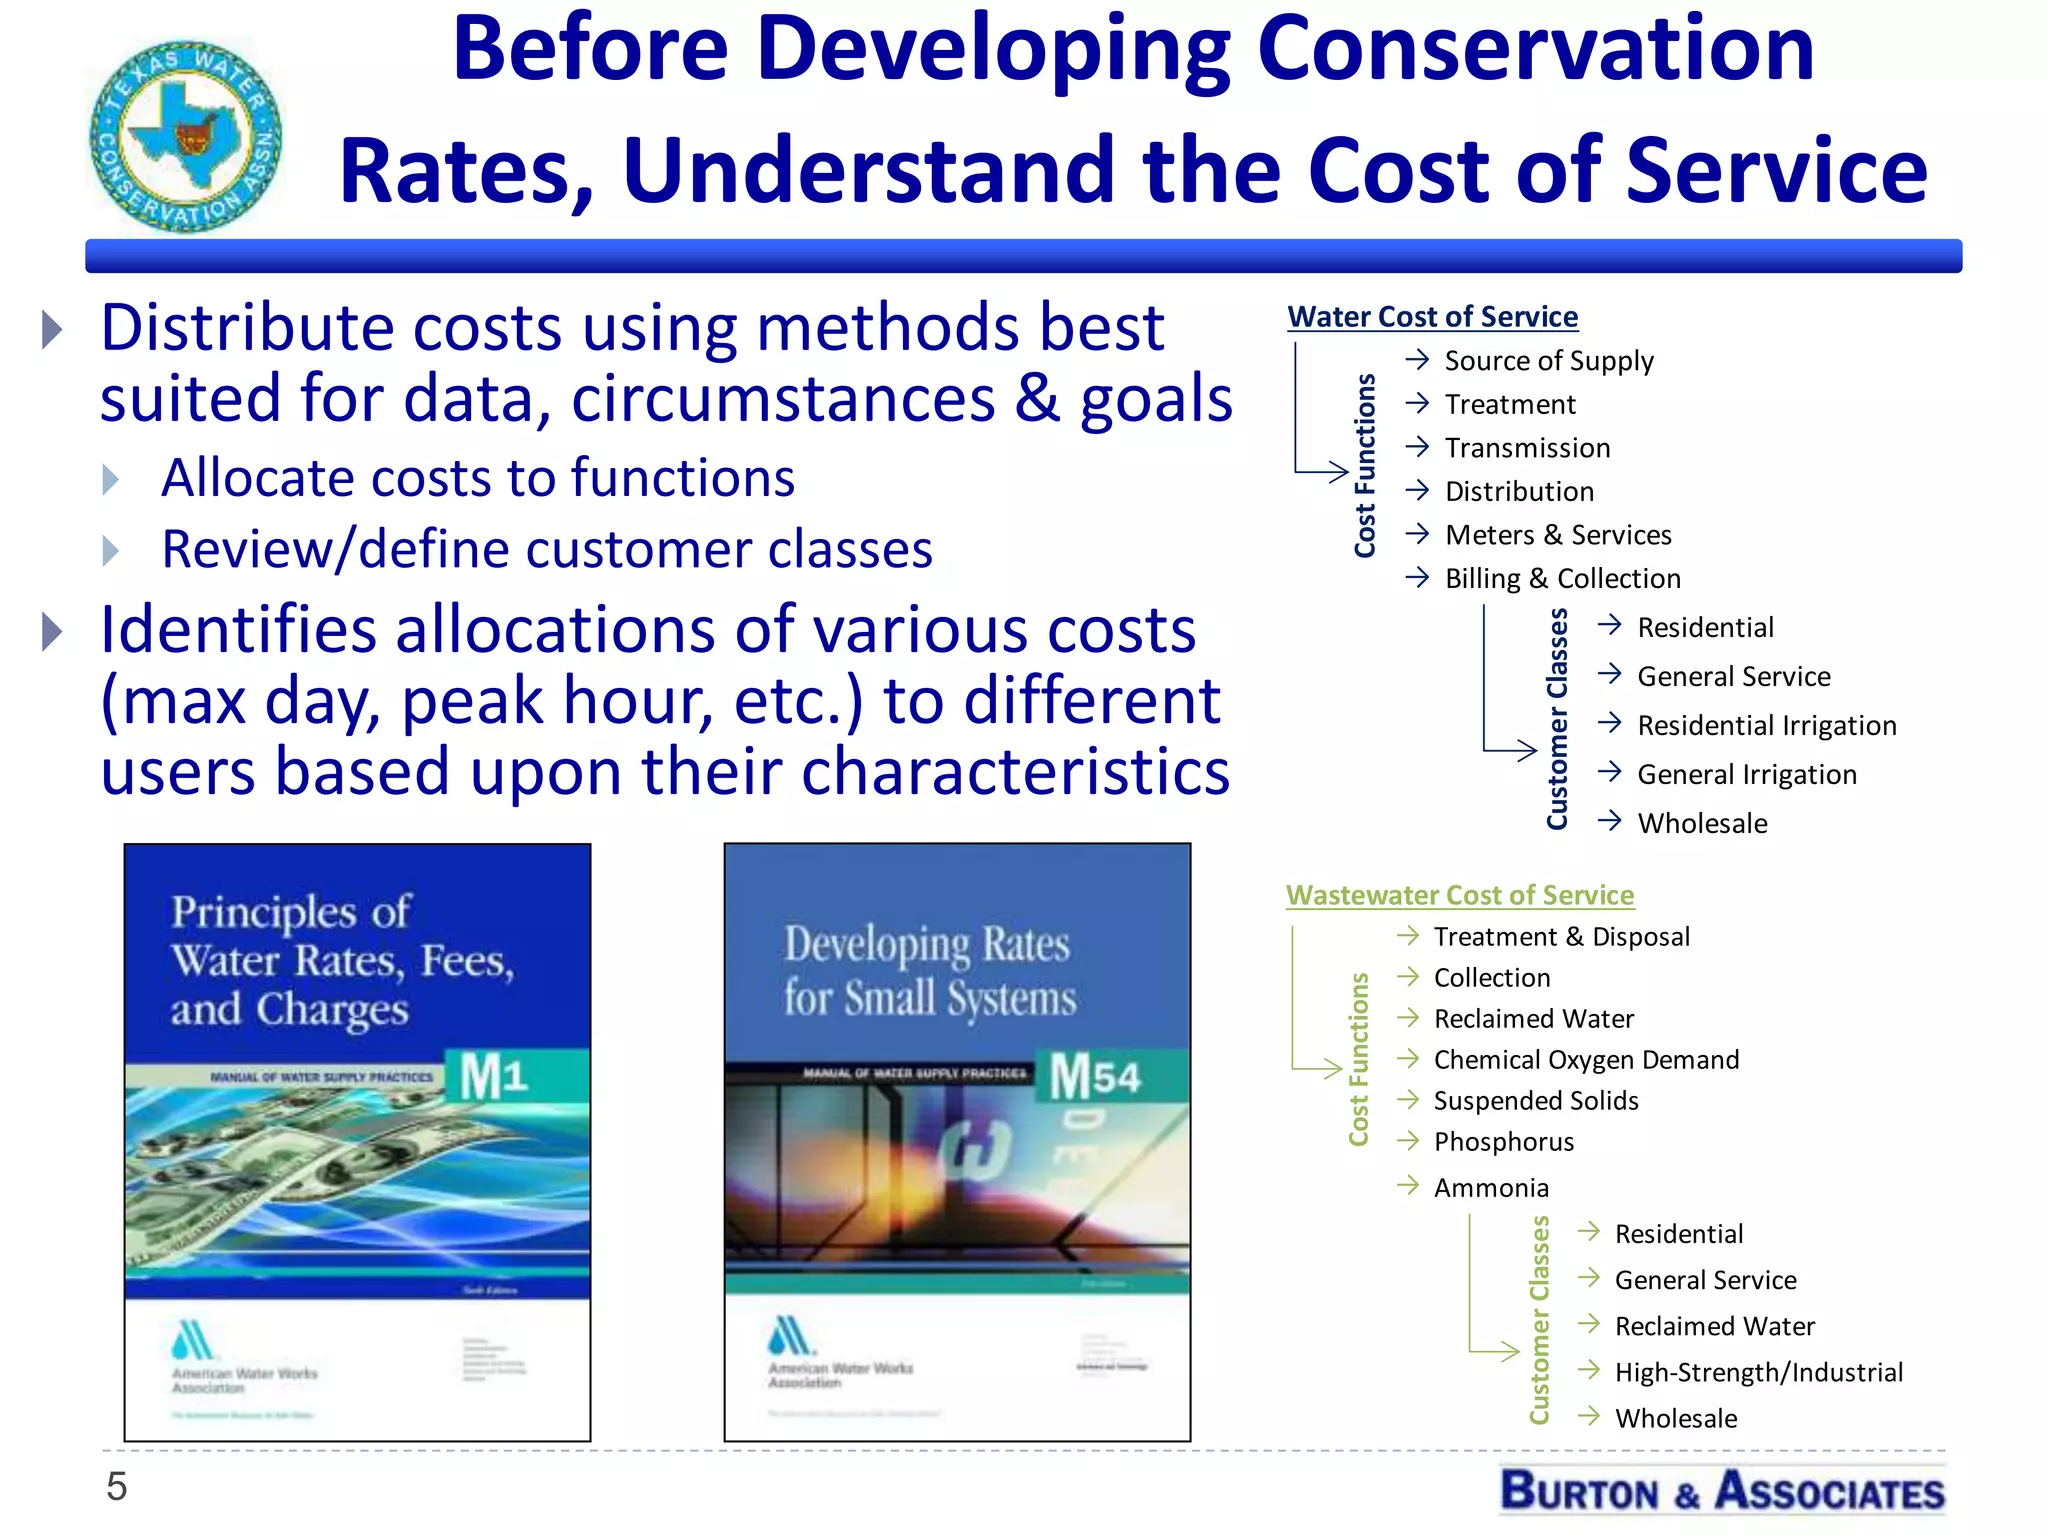
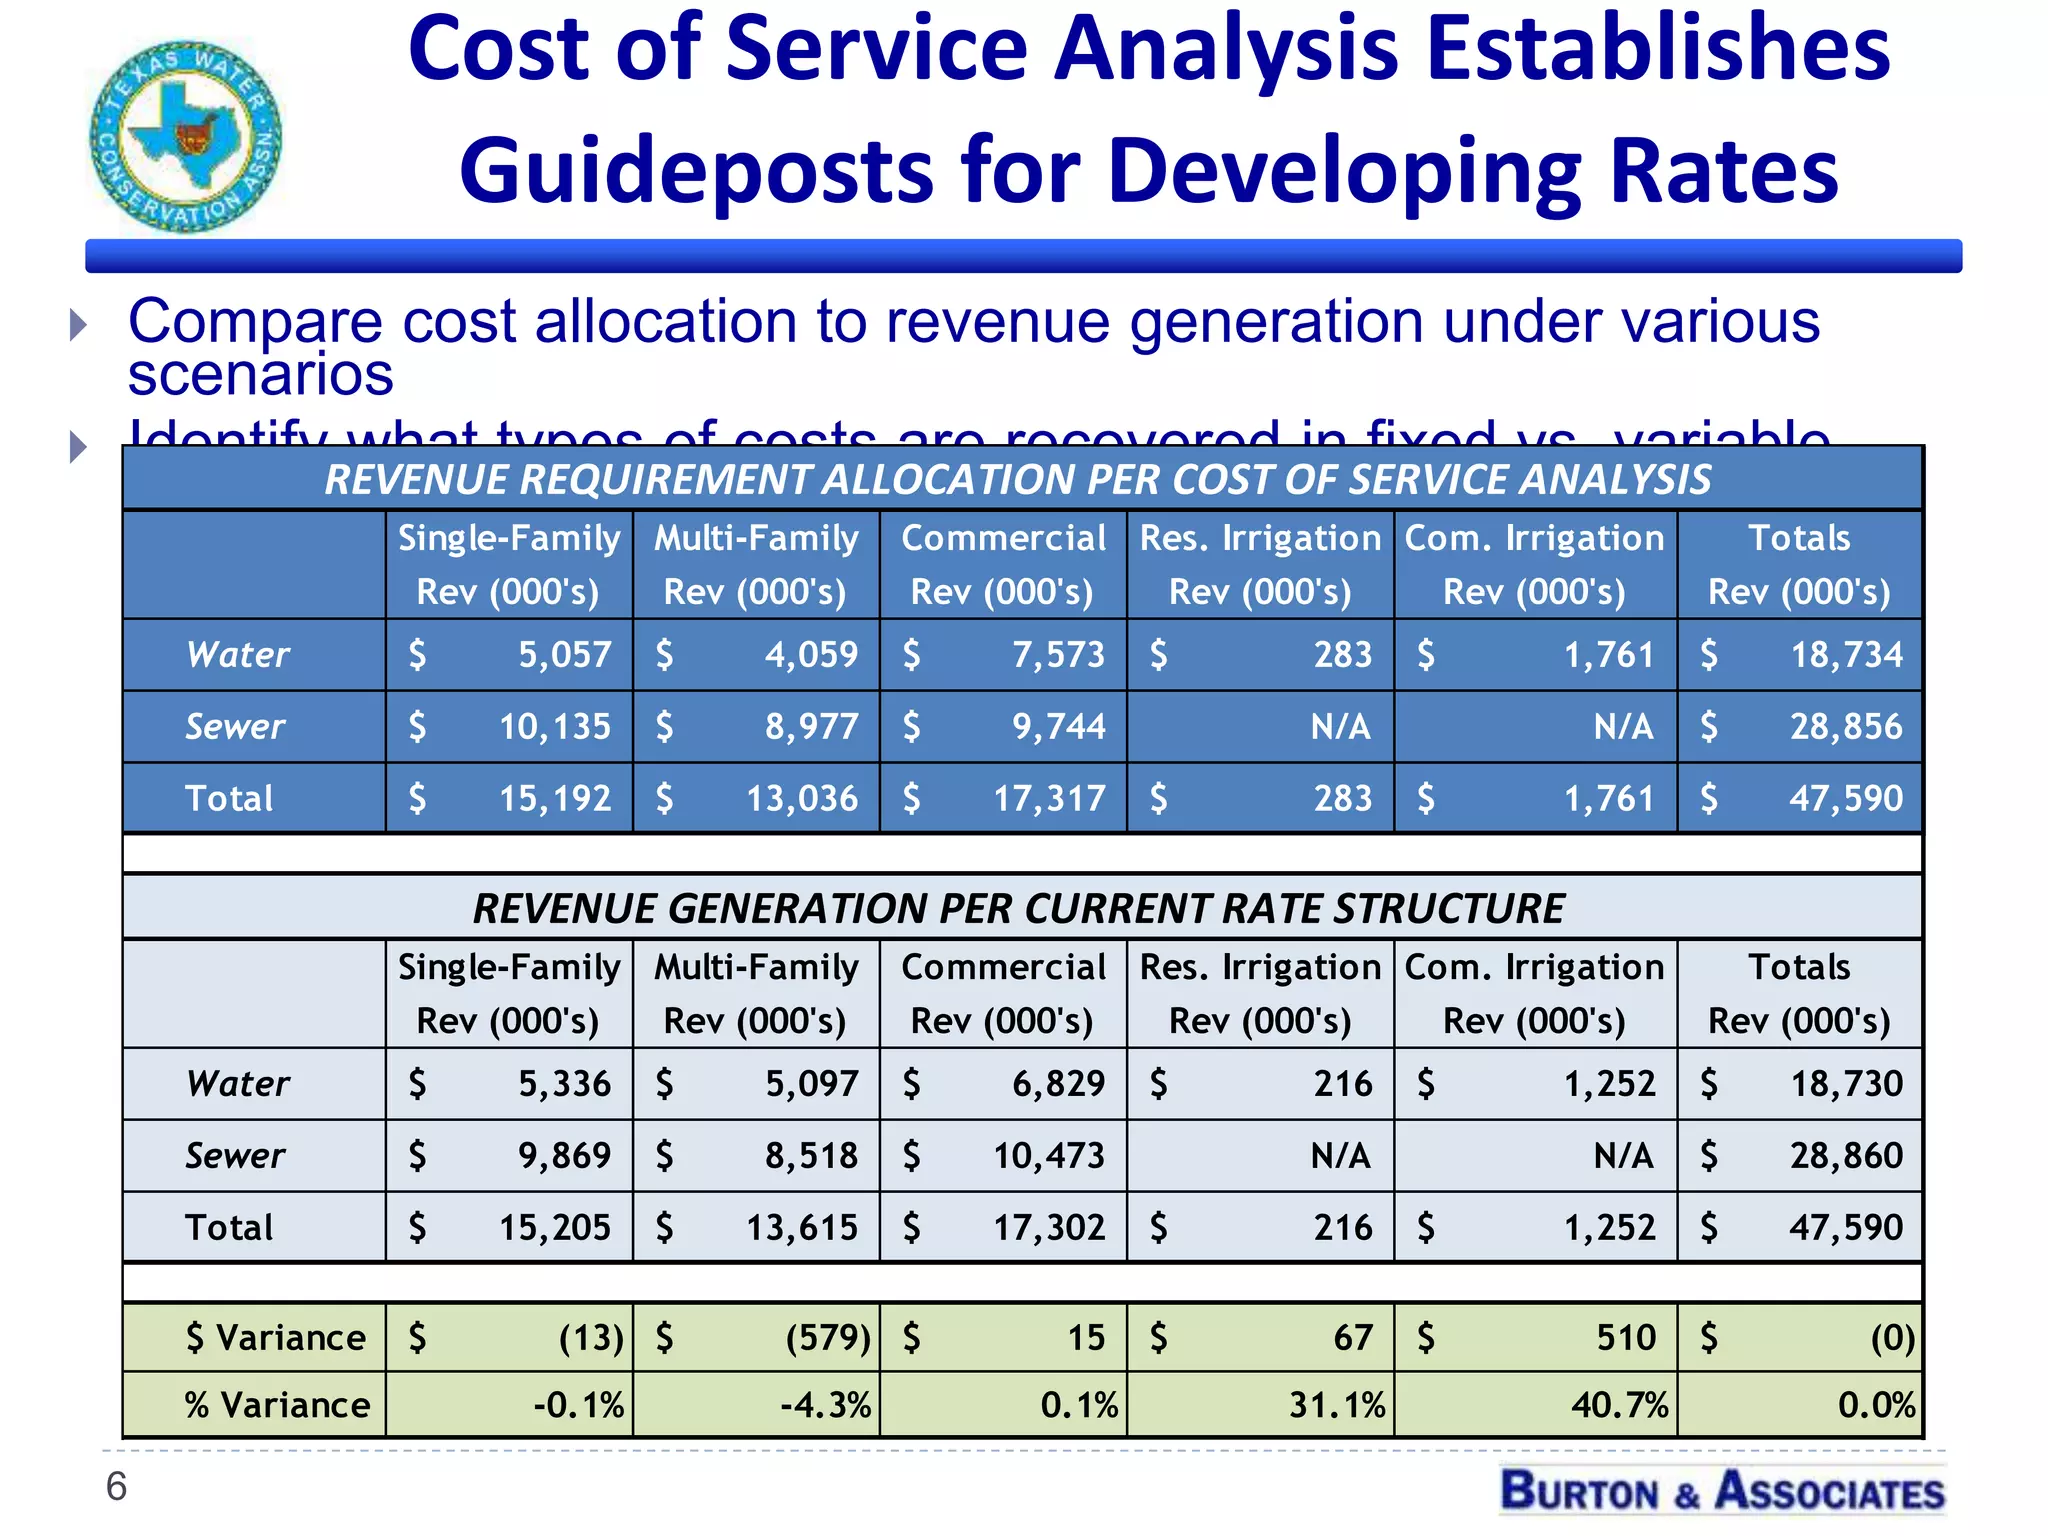


This document summarizes key features of successful inclining block water conservation rate structures. It discusses balancing priorities like sustainability, conducting a cost of service analysis, developing conservation rates, financial considerations like reserve policies and fixed cost recovery, examples of block sizing and pricing, and modeling changes in demand from price elasticity. The overall presentation provides guidance on effectively designing and implementing inclining block water rates to promote both conservation and financial sustainability.


