Download as PDF, PPTX


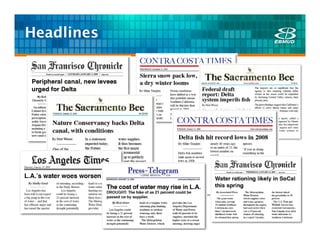
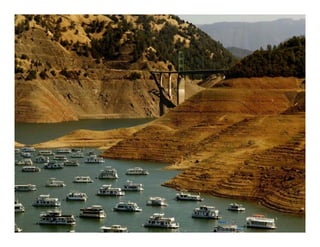

The document outlines EBMUD's water conservation strategies including the management of water supply reliability through 2040 amidst California's ongoing water challenges such as drought and climate change. It highlights the importance of integrated resource planning, customer engagement, conservation measures, and regulatory frameworks while providing a comprehensive evaluation of current and future water demand and supply trends. The presentation further emphasizes the need for innovative practices and community involvement to enhance water efficiency and sustainability.


