SlideShare a Scribd company logo
1 of 35
income statementsamsungFiscal year is January-December. All
values KRW
Millions.20202019201820172016Sales/Revenue236,806,988230,
400,881243,771,415239,575,376201,866,745Sales
Growth2.78%-5.48%1.75%18.68%-Cost of Goods Sold (COGS)
incl.
D&A148,612,196151,017,841135,277,299132,072,774122,682,8
33COGS excluding
D&A118,276,580121,420,203108,795,262109,955,382101,969,8
68Depreciation & Amortization
Expense30,335,61629,597,63826,482,03722,117,39220,712,965
Depreciation27,115,73526,573,81625,167,112 20,593,61619,312
,520Amortization of
Intangibles3,219,8813,023,8221,314,9251,523,7761,400,445CO
GS Growth-1.59%11.64%2.43%7.65%-Gross
Income88,194,79279,383,040108,494,116107,502,60279,183,91
2Gross Income Growth11.10%-26.83%0.92%35.76%-Gross
Profit Margin37.24%----SG&A
Expense52,200,91651,614,53149,607,44753,857,56449,943,240
Research &
Development19,073,26918,169,76116,918,88214,910,11912,708
,079Other
SG&A33,127,64733,444,77032,688,56538,947,44537,235,161S
GA Growth1.14%4.05%-7.89%7.84%-
EBIT35,993,87627,768,50958,886,66953,645,03829,240,672Un
usual Expense--1,575366,705872,985Non Operating
Income/Expense-
1,546,734277,052112,4971,757,3711,409,977Non-Operating
Interest
Income1,974,4582,660,0242,297,1391,614,2231,504,318Equity
in Affiliates (Pretax)--539,845201,44219,501Interest
Expense583,013692,687674,617655,402587,831Interest
Expense Growth-15.83%2.68%2.93%11.49%-Gross Interest
Expense586,910692,687696,721675,113605,475Interest
Capitalized3,897-22,10419,71117,644Pretax
Income35,838,58730,019,22961,159,95856,195,96730,713,652P
retax Income Growth19.39%-50.92%8.83%82.97%-Pretax
Margin15.13%----Income
Tax9,937,2858,693,32416,815,10114,009,2207,987,560Income
Tax - Current
Domestic7,700,7885,736,01913,520,33510,943,9335,916,818Inc
ome Tax - Deferred
Domestic2,236,4972,957,3053,294,7663,065,2872,070,742Equit
y in Affiliates506,530412,960---Consolidated Net
Income26,407,83221,738,86544,344,85742,186,74722,726,092
Minority Interest
Expense316,986233,811453,980842,178310,437Net
Income26,090,84621,505,05443,890,87741,344,56922,415,655N
et Income Growth21.32%-51.00%6.16%84.45%-Net
Margin11.02%----Net Income After
Extraordinaries26,090,84621,505,05443,890,87741,344,56922,4
15,655Net Income Available to
Common26,090,84621,505,05443,890,87741,344,56922,415,655
EPS (Basic)3841.033165.926460.735990.883155.64EPS (Basic)
Growth21.32%-51.00%7.84%89.85%-Basic Shares
Outstanding6,7936,7936,7936,9017,103EPS
(Diluted)3841.033165.926460.735990.883155.65EPS (Diluted)
Growth21.32%-51.00%7.84%89.85%-Diluted Shares
Outstanding6,7936,7936,7936,9017,103 EBITDA66,329,49257,3
66,14785,368,70675,762,43049,953,637EBITDA
Growth15.62%-32.80%12.68%51.67%-EBITDA Margin28.01%-
---
EBIT35,993,87627,768,50958,886,66953,645,03829,240,672113
.770176782.81683791126.543959115.596885684.97958937sour
cehttps://www.google.com/search?q=apple+company+wsj&oq=a
pple+&aqs=chrome.1.69i59l3j69i57j46i433j69i60l3.7083j0j7&s
ourceid=chrome&ie=UTF-8
balance sheetAssetsFiscal year is January-December. All values
KRW Millions.202020192018201720165-year trendCash &
Short Term
Investments124,652,843108,779,703100,939,94383,184,20188,1
82,313Cash
Only29,382,57826,885,99930,340,50530,545,13032,132,983Sho
rt-Term
Investments95,270,26581,893,70470,599,43852,639,07156,049,
330Cash & Short Term Investments Growth000-0-Cash & ST
Investments / Total
Assets32.96%30.85%29.74%27.57%33.63%Total Accounts
Receivable34,569,59739,310,46336,948,46631,804,95627,800,4
08Accounts Receivables,
Net3096505800.00%3513134300.00%3386773300.00%2769599
500.00%2427921100.00%Accounts Receivables,
Gross31,343,27635,530,41934,470,34228,362,52324,725,603Ba
d Debt/Doubtful Accounts-378,218-399,076-602,609-666,528-
446,392Other
Receivables3,604,5394,179,1203,080,7334,108,9613,521,197Ac
counts Receivable Growth-12.06%6.39%16.17%14.40%-
Accounts Receivable
Turnover685.00%586.00%660.00%753.00%7.26Inventories32,0
43,14526,766,46428,984,70424,983,35518,353,503Finished
Goods10,434,2899,132,7209,870,0547,304,4375,905,339Work
in
Progress11,818,0909,886,63411,066,5117,113,9015,017,384Ra
w
Materials9,790,7667,747,1108,048,13910,565,0177,430,780Oth
er Current
Assets9,789,0249,654,31710,594,5279,289,60310,160,057Prepa
id
Expenses2,266,1003,833,0535,497,9745,588,8924,942,021Misc
ellaneous Current
Assets7,522,9245,821,2645,096,5533,700,7115,218,036Total
Current
Assets201,054,609184,510,947177,467,640149,262,1151 44,496,
281Net Property, Plant &
Equipment128,952,892119,825,474115,416,724111,665,64891,4
73,041Property, Plant & Equipment -
Gross328,606,313304,075,769279,158,166256,528,604225,172,
654Buildings55,026,36948,839,43945,033,84341,639,04536,474
,462Land &
Improvements9,850,9429,828,3099,346,2859,409,2767,869,679
Machinery &
Equipment233,056,501211,416,021206,407,913184,392,999155,
285,378Construction in
Progress20,175,91723,930,0199,705,05613,910,74918,773,986O
ther Property, Plant &
Equipment10,496,58410,061,9818,665,0697,176,5356,769,149A
ccumulated
Depreciation199,653,421184,250,295163,741,442144,862,95613
3,699,613Buildings20,474,36518,369,81915,687,93313,580,889
12,098,636Land & Improvements78,78653,755---Machinery &
Equipment172,062,371159,266,085142,591,682126,477,201116,
983,323Other Property, Plant &
Equipment7,037,8996,560,6365,461,8274,804,8664,617,654Tot
al Investments and
Advances21,854,96417,561,32815,628,29314,661,28212,642,16
0LT Investment - Affiliate
Companies8,076,7797,591,6127,313,2066,802,3515,837,884O th
er Long-Term
Investments13,778,1859,969,7168,315,0877,858,9316,804,276I
ntangible
Assets18,468,50220,703,50414,891,59814,760,4835,344,020Net
Goodwill5,673,6426,250,4395,833,6785,703,1381,343,580Net
Other
Intangibles12,794,86014,453,0659,057,9209,057,3454,000,440
Other
Assets6,468,7818,583,88213,255,2038,620,5265,963,949Deferr
ed
Charges1,355,502589,8325,572,0354,260,2674,391,922Tangible
Other
Assets5,113,2797,994,0507,683,1684,360,2591,572,027Total
Assets378,235,718352,564,497339,357,244301,752,090262,174,
324Assets - Total - Growth0000-Asset Turnover1----Return On
Average Assets7.14%----Liabilities & Shareholders' EquityAll
values KRW Millions.202000.00%20192018201720165-year
trendST Debt & Current Portion LT
Debt17,269,52815,239,55813,620,04616,046,23813,979,606Sho
rt Term
Debt16,553,42914,393,46813,586,66015,767,61912,746,789Cur
rent Portion of Long Term
Debt716,099846,09033,386278,6191,232,817Accounts
Payable9,739,2228,718,2228,479,9169,083,9076,485,039Accou
nts Payable Growth11.71%2.81%-6.65%40.07%-Income Tax
Payable4,430,2721,387,7738,720,0507,408,3482,837,353Other
Current
Liabilities44,165,32938,437,21138,261,49834,636,62131,402,09
7Miscellaneous Current
Liabilities44,165,32938,437,21138,261,49834,636,62131,402,09
7Total Current
Liabilities75,604,35163,782,76469,081,51067,175,11454,704,09
5Current Ratio2.662.892.572.222.64Quick
Ratio2.242.472.151.852.31Cash
Ratio1.651.711.461.241.61Long-Term
Debt2,947,8533,172,4791,047,0572,767,8071,302,780Long-
Term Debt excl. Capitalized
Leases948,137975,298996,9352,710,2691,237,653Non-
Convertible
Debt948,137975,298996,9352,710,2691,237,653Capitalized
Lease Obligations--50,12257,53865,127Provision for Risks &
Charges1,515,8861,081,8801,167,683854,246531,782Deferred
Taxes17,374,87515,674,44612,464,7378,928,7455,038,641Defer
red Taxes -
Credit18,810,84517,053,80815,162,52311,710,7817,293,514Def
erred Taxes -
Debit1,435,9701,379,3622,697,7862,782,0362,254,873Other
Liabilities3,408,7674,593,1455,145,2944,752,7145,379,120Othe
r Liabilities (excl. Deferred
Income)3,408,7674,593,1455,145,2944,752,7145,379,120Total
Liabilities102,287,70289,684,07691,604,06787,260,66269,211,2
91Total Liabilities / Total
Assets27.04%25.44%26.99%28.92%26.40%Common Equity
(Total)267,670,331254,915,472240,068,993207,213,416186,424
,328Common Stock Par/Carry
Value897,514897,514897,514897,514897,514Additional Paid-In
Capital/Capital
Surplus4,403,8934,403,8934,403,8934,403,8934,403,893Retaine
d
Earnings96,328,64686,260,02691,179,30576,182,00550,079,125
Cumulative Translation Adjustment/Unrealized For. Exch.
Gain-10,989,715-5,645,769-8,612,742-9,192,002-
2,930,886Unrealized Gain/Loss Marketable
Securities4,975,7562,573,5301,462,2661,879,7741,390,624Othe
r Appropriated Reserves-2,712,054-1,957,019-840,775-
364,812142,195,663Unappropriated
Reserves174,766,291168,383,297151,579,532139,635,231138,7
21Treasury Stock----6,228,187-9,750,326Common Equity /
Total Assets70.77%72.30%70.74%68.67%71.11%Total
Shareholders'
Equity267,670,331254,915,472240,068,993207,213,416186,424,
328Total Shareholders' Equity / Total
Assets70.77%72.30%70.74% 68.67%71.11%Accumulated
Minority
Interest8,277,6857,964,9497,684,1847,278,0126,538,705Total
Equity275,948,016262,880,421247,753,177214,491,428192,963,
033Liabilities & Shareholders'
Equity378,235,718352,564,497339,357,244301,752,090262,174,
324Debt
ratio=0.27043374580.25437636730.26993402560.28917997550.
2639895850.38214060410.35181888060.38157392110.4211149
2430.371256754626090846215050544389087741344569224156
55roa0.068980386460.060996084920.12933531780.1370150212
0.085499047570.097473806310.084361509450.1828260970.199
52650650.1202399667ie583,013692,687674,617655,402587,831
tieFALSE113.7701767sourcehttps://www.google.com/search?q=
apple+company+wsj&oq=apple+&aqs=chrome.1.69i59l3j69i57j
46i433j69i60l3.7083j0j7&sourceid=chrome&ie=UTF-8
cashflow samsungOperating ActivitiesFiscal year is January-
December. All values KRW
Millions.20202019201820172016Net Income before
Extraordinaries26,407,83221,738,86544,344,85742,186,74722,7
26,092Net Income Growth21.48%-50.98%5.12%85.63%-
Depreciation, Depletion &
Amortization30,335,61629,597,63826,482,03722,117,39220,712
,965Depreciation and
Depletion27,115,73526,573,81625,167,11220,593,61619,312,52
0Amortization of Intangible
Assets3,219,8813,023,8221,314,9251,523,7761,400,445Other
Funds8,421,137-3,407,8326,129,3358,478,4495,127,540Funds
from
Operations65,164,58547,928,67176,956,22972,782,58848,566,5
97Changes in Working Capital122,424-2,545,756-9,924,366-
10,620,547-1,180,953Receivables1,741,0161,828,5914,513,604-
7,676,1751,313,276Inventories-7,540,6562,134,632-5,979,475-
8,444,506-2,830,602Accounts Payable3,885,742-1,269,177-
533,6094,006,410200,240Other Accruals5,332,676-
1,707,265501,5361,292,4201,136,440Other Assets/Liabilities-
3,296,354-3,532,537-8,426,422201,304-1,000,307Net Operating
Cash
Flow65,287,00945,382,91567,031,86362,162,04147,385,644Net
Operating Cash Flow Growth43.86%-32.30%7.83%31.18%-Net
Operating Cash Flow /
Sales27.57%19.70%27.50%25.95%23.47%Investing
ActivitiesAll values KRW
Millions.20202019201820172016Capital Expenditures-
40,271,813-28,617,670-30,576,923-43,775,974-
25,190,641Capital Expenditures (Fixed Assets)-37,592,034-
25,367,756-29,556,406-42,792,234-24,142,973Capital
Expenditures (Other Assets)-2,679,779-3,249,914-1,020,517-
983,740-1,047,668Capital Expenditures Growth-
40.72%6.41%30.15%-73.78%-Capital Expenditures / Sales-
17.01%-12.42%-12.54%-18.27%-12.48%Net Assets from
Acquisitions-49,420-1,021,105-99,108-8,754,268-622,050Sale
of Fixed Assets &
Businesses384,931513,265565,0441,562,858284,106Purchase/S
ale of Investments-13,633,932-10,877,650-
22,131,0411,615,560-4,143,738Purchase of Investments-
26,913,224-16,236,889-22,483,388-1,569,896-
12,234,162Sale/Maturity of
Investments13,279,2925,359,239352,3473,185,4568,090,424Oth
er Uses-57,197--2,289-28,455-Other
Sources7,02753,28911,93573326,880Net Investing Cash Flow -
53,620,404-39,949,871-52,232,382-49,379,546-29,645,443Net
Investing Cash Flow Growth-34.22%23.52%-5.78%-66.57%-Net
Investing Cash Flow / Sales-22.64%-17.34%-21.43%-20.61%-
14.69%Financing ActivitiesAll values KRW
Millions.20202019201820172016Cash Dividends Paid - Total-
9,676,760-9,639,202-10,193,695-6,804,297-3,114,742Common
Dividends-9,676,760-9,639,202-10,193,695-6,804,297-
3,114,742Change in Capital Stock---875,111-8,350,424-
7,707,938Repurchase of Common & Preferred Stk.---875,111-
8,350,424-7,707,938Issuance/Reduction of Debt,
Net1,340,730156,392-4,029,4902,588,1802,139,930Change in
Current Debt2,191,186865,792-
2,046,4702,730,6761,351,037Change in Long-Term Debt-
850,452-709,400-1,983,017-142,492788,897Issuance of Long-
Term Debt14,495-3,580998,3111,041,743Reduction in Long-
Term Debt-864,947-709,400-1,986,597-1,140,803-252,846Net
Financing Cash Flow-8,336,026-9,482,810-15,098,293-
12,566,537-8,682,746Net Financing Cash Flow
Growth12.09%37.19%-20.15%-44.73%-Net Financing Cash
Flow / Sales-3.52%-4.12%-6.19%-5.25%-4.30%Exchange Rate
Effect-833,861595,26094,187-1,782,270417,243Net Change in
Cash2,496,718-3,454,506-204,625-1,566,3129,474,698Free
Cash
Flow27,694,97520,015,15937,475,45719,369,80723,242,671Fre
e Cash Flow Growth38.37%-46.59%93.47%-16.66%-Free Cash
Flow Yield3.27%----
sourcehttps://www.google.com/search?q=apple+company+wsj&
oq=apple+&aqs=chrome.1.69i59l3j69i57j46i433j69i60l3.7083j0
j7&sourceid=chrome&ie=UTF-8
is-appleApple Inc.Consolidated Income StatementUS$ in
millions12 months ended:Sep 26, 2020Sep 28, 2019Sep 29,
2018Sep 30, 2017Sep 24,
2016Products220,747213,883225,847196,534—
Services53,76846,29139,74832,700—Net sales (legacy)———
—215,639Net
sales274,515260,174265,595229,234215,639Products(151,286)(
144,996)(148,164)(126,337)—
Services(18,273)(16,786)(15,592)(14,711)—Cost of sales
(legacy)————(131,376)Cost of
sales(169,559)(161,782)(163,756)(141,048)(131,376)Gross
margin104,95698,392101,83988,18684,263Research and
development(18,752)(16,217)(14,236)(11,581)(10,045)Selling,
general and
administrative(19,916)(18,245)(16,705)(15,261)(14,194)Operati
ng expenses(38,668)(34,462)(30,941)(26,842)(24,239)Operating
income66,28863,93070,89861,34460,024Interest and dividend
income3,7634,9615,6865,2013,999Interest
expense(2,873)(3,576)(3,240)(2,323)(1,456)Other income
(expense), net(87)422(441)(133)(1,195)Other income (expense),
net8031,8072,0052,7451,348Income before provision for
income taxes67,09165,73772,90364,08961,372Provision for
income taxes(9,680)(10,481)(13,372)(15,738)(15,685)Net
income57,41155,25659,53148,35145,687Based on:
10-K (filing date: 2020-10-30),
10-K (filing date: 2019-10-31),
10-K (filing date: 2018-11-05),
10-K (filing date: 2017-11-03),
10-K (filing date: 2016-10-26),
10-K (filing date: 2015-10-28).-23.35224504-18.38282998-
22.50092593-27.58889367-
42.1510989sourcehttps://www.google.com/search?q=apple+com
pany+wsj&oq=apple+&aqs=chrome.1.69i59l3j69i57j46i433j69i
60l3.7083j0j7&sourceid=chrome&ie=UTF-8
bs-appleAssetsFiscal year is October-September. All values
USD Millions.202020192018201720165-year trendCash & Short
Term Investments90,979100,58066,30174,18167,155Cash
Only19,98028,12419,65814,51612,267Short-Term
Investments70,99972,45646,64359,66554,888Cash & Short
Term Investments Growth-9.55%51.70%-10.62%10.46%-Cash &
ST Investments / Total
Assets28.09%29.71%18.13%19.76%20.88%Total Accounts
Receivable37,44545,80448,99535,67329,299Accounts
Receivables, Net16,12022,92623,18617,87415,754Accounts
Receivables, Gross16,12022,92623,18617,93215,807Bad
Debt/Doubtful Accounts----58-53Other
Receivables21,32522,87825,80917,79913,545Accounts
Receivable Growth-18.25%-6.51%37.34%21.76%-Accounts
Receivable
Turnover7.325.685.436.417.31Inventories4,0614,1063,9564,855
2,132Finished Goods4,0614,1063,9564,8552,132Other Current
Assets11,22812,32912,08713,9368,283Miscellaneous Current
Assets11,22812,32912,08713,9368,283Total Current
Assets143,713162,819131,339128,645106,869Net Property,
Plant & Equipment45,33637,37841,30433,78327,010Property,
Plant & Equipment -
Gross112,09695,95790,40375,07661,245Buildings17,95217,085
16,21613,58710,185Machinery &
Equipment75,29169,79765,98254,21044,543Other Property,
Plant & Equipment10,2839,0758,2057,2796,517Accumulated
Depreciation66,76058,57949,09941,29334,235Total Investments
and Advances102,624106,698170,799194,714170,430Other
Long-Term
Investments102,624106,698170,799194,714170,430Intangible
Assets---8,0158,620Net Goodwill---5,7175,414Net Other
Intangibles---2,2983,206Other
Assets32,21531,62122,28310,1628,757Tangible Other
Assets32,21531,62122,28310,1628,757Total
Assets323,888338,516365,725375,319321,686Assets - Total -
Growth-4.32%-7.44%-2.56%16.67%-Asset Turnover0.83----
Return On Average Assets17.33%----Liabilities & Shareholders'
EquityAll values USD Millions.202020192018201720165-year
trendST Debt & Current Portion LT
Debt15,22916,24020,74818,47311,605Short Term
Debt6,4325,98011,96411,9778,105Current Portion of Long
Term Debt8,79710,2608,7846,4963,500Accounts
Payable42,29646,23655,88849,04937,294Accounts Payable
Growth-8.52%-17.27%13.94%31.52%-Other Current
Liabilities47,86743,24240,23033,29230,107Miscellaneous
Current Liabilities47,86743,24240,23033,29230,107Total
Current
Liabilities105,392105,718116,866100,81479,006Current
Ratio1.361.541.121.281.35Quick Ratio1.331.51.091.231.33Cash
Ratio0.860.950.570.740.85Long-Term
Debt107,04991,80793,73597,20775,427Long-Term Debt excl.
Capitalized Leases98,66791,80793,73597,20775,427Non-
Convertible Debt98,66791,80793,73597,20775,427Capitalized
Lease Obligations637----Provision for Risks &
Charges28,17029,54533,589--Deferred Taxes-
16,91911,52039,91134,719Deferred Taxes - Credit-
16,91911,52039,91134,719Other
Liabilities17,9384,0392,8683,3404,285Other Liabilities (excl.
Deferred Income)17,9384,039715041,355Deferred Income--
2,7972,8362,930Total
Liabilities258,549248,028258,578241,272193,437Total
Liabilities / Total
Assets79.83%73.27%70.70%64.28%60.13%Common Equity
(Total)65,33990,488107,147134,047128,249Common Stock
Par/Carry Value50,77945,17440,20135,86731,251Retained
Earnings14,96645,89870,40098,33096,364Cumulative
Translation Adjustment/Unrealized For. Exch. Gain-1,375-
1,463-1,055-354-578Unrealized Gain/Loss Marketable
Securities1,846707-3,2093281,174Other Appropriated Reserves-
877172810-12438Common Equity / Total
Assets20.17%26.73%29.30%35.72%39.87%Total Shareholders'
Equity65,33990,488107,147134,047128,249Total Shareholders'
Equity / Total Assets20.17%26.73%29.30%35.72%39.87%Total
Equity65,33990,488107,147134,047128,249Liabilities &
Shareholders'
Equity323,888338,516365,725375,319321,686sourcehttps://ww
w.google.com/search?q=apple+company+wsj&oq=apple+&aqs=
chrome.1.69i59l3j69i57j46i433j69i60l3.7083j0j7&sourceid=chr
ome&ie=UTF-8
cs-appleOperating ActivitiesFiscal year is October-September.
All values USD Millions.202020192018201720165-year
trendNet Income before
Extraordinaries57,41155,25659,53148,35145,687Net Income
Growth3.90%-7.18%23.12%5.83%-Depreciation, Depletion &
Amortization11,05612,54710,90310,15710,505Depreciation and
Depletion11,05612,54710,903--Deferred Taxes & Investment
Tax Credit-215-340-32,5905,9664,938Deferred Taxes-215-340-
32,5905,9664,938Other Funds6,7325,4164,8964,6744,210Funds
from Operations74,98472,87942,74069,14865,340Changes in
Working Capital5,690-3,48834,694-
5,550484Receivables8,4703,176-13,332-6,3471,044Inventories-
127-289828-2,723217Accounts Payable-4,062-
1,9239,1759,6181,791Other Assets/Liabilities 1,409-
4,45238,023-6,098-2,568Net Operating Cash
Flow80,67469,39177,43463,59865,824Net Operating Cash Flow
Growth16.26%-10.39%21.76%-3.38%-Net Operating Cash Flow
/ Sales29.43%26.69%29.13%27.82%30.73%Investing
ActivitiesAll values USD Millions.202020192018201720165-
year trendCapital Expenditures-7,309-10,495-13,313-12,795-
13,548Capital Expenditures (Fixed Assets)-7,309-10,495-
13,313-12,451-12,734Capital Expenditures (Other Assets)----
344-814Capital Expenditures Growth30.36%21.17%-
4.05%5.56%-Capital Expenditures / Sales-2.67%-4.04%-5.01%-
5.60%-6.32%Net Assets from Acquisitions-1,524-624-721-329-
297Purchase/Sale of Investments5,33558,09330,845-33,147-
30,634Purchase of Investments-115,148-40,631-73,227-
159,486-142,428Sale/Maturity of
Investments120,48398,724104,072126,339111,794Other Uses-
791-1,078-745-395-1,498Other Sources---220-Net Investing
Cash Flow-4,28945,89616,066-46,446-45,977Net Investing
Cash Flow Growth-109.35%185.67%134.59%-1.02%-Net
Investing Cash Flow / Sales-1.56%17.65%6.04%-20.32%-
21.46%Financing ActivitiesAll values USD
Millions.202020192018201720165-year trendCash Dividends
Paid - Total-14,081-14,119-13,712-12,769-12,150Common
Dividends-14,081-14,119-13,712-12,769-12,150Change in
Capital Stock-71,478-66,116-72,069-32,345-29,227Repurchase
of Common & Preferred Stk.-72,358-66,897-72,738-32,900-
29,722Sale of Common & Preferred
Stock880781669555495Proceeds from Stock
Options880781669555495Issuance/Reduction of Debt,
Net2,499-7,81943229,01422,057Change in Current Debt-963-
5,977-373,852-397Change in Long-Term Debt3,462-
1,84246925,16222,454Issuance of Long-Term
Debt16,0916,9636,96928,66224,954Reduction in Long-Term
Debt-12,629-8,805-6,500-3,500-2,500Other Funds-3,760-2,922-
2,527-1,247-1,163Other Uses-3,760-2,922-2,527-1,874-
1,570Other Sources---627407Net Financing Cash Flow-86,820-
90,976-87,876-17,347-20,483Net Financing Cash Flow
Growth4.57%-3.53%-406.58%15.31%-Net Financing Cash Flow
/ Sales-31.67%-35.00%-33.06%-7.59%-9.56%Net Change in
Cash-10,43524,3115,624-195-636Free Cash
Flow73,36558,89664,12151,14753,090Free Cash Flow
Growth24.57%-8.15%25.37%-3.66%-Free Cash Flow
Yield3.01%----
sourcehttps://www.google.com/search?q=apple+company+wsj&
oq=apple+&aqs=chrome.1.69i59l3j69i57j46i433j69i60l3.7083j0
j7&sourceid=chrome&ie=UTF-8
ratiosFinancial diagnostic categoriesyrSamsungApple1.)
Liquidity of short-term assets-Current
ratio20162.641.352720172.221.276120182.571.132920192.891.
540120202.661.3636-Cash
ratio20161.610.8520171.240.7420181.460.5720191.710.952020
1.650.86-Quick
ratio20162.311.3320171.851.2320182.151.0920192.471.520202.
241.332.) Long-term debt-paying ability-Debt
ratio201626.460.13201728.9264.28201826.9970.7201925.4473.
27202027.0479.83-Debt-equity
ratio20160.370.678620170.420.86320180.381.068520190.351.1
9420200.381.7208-Times interest earned201685-422017116-
282018127-23201983-182020114-233.) Profitability-Net
income/sales (profit
margin)2016021.18682017021.09242018022.41422019021.2381
202011.0220.9136-Net income/assets
(ROA)20160.08514.202420170.13712.882620180.12916.277520
190.06116.32320200.06917.7256-Net income/shareholder
equity
(ROE)20160.1238.190620170.236.070220180.18355.560120190
.08461.064520200.09787.86644.) Asset utilization/
management efficiency-Total asset
turnover201600.6703201700.6108201800.7262201900.7686202
00.650.8476-Inventory turnover
measures201661.62161.621201729.052129.0521201841.394341.
3943201939.401439.4014202041.75341.753-Accounts
receivable
turnover20167.267.359920177.536.42620186.65.420920195.865
.680220206.857.33125.) Market measures-Price/earnings
ratio20160.560.1520170.260.5920180.150.8720190.250.562020
0.470.25-Earnings per common
share201600201789.8510.8420187.8429.322019-51-
0.17202021.3210.23-Dividend
payout20160.7634.620170.82.3320180.60.2320190.2331.420200
.20.5
Business Research Methods, 14e/Schindler
1
>cases
State Farm, the nation’s largest auto insurer, distributed a list of
the 10 most
dangerous intersections in the United States based on crashes
resulting in claims
by its policyholders. What started as a study to reduce risk
turned into an ongoing
study that directs a major public relations effort: State Farm
provides funds for
communities to further research their dangerous intersections
and initiate improve-
ments based on the research. This case tells you how the State
Farm Dangerous
Intersections initiative got started and how it is done.
www.statefarm.com
>Abstract
>The Scenario
State Farm Insurance has a rich history of proactive safety
involvement in auto and
appliance design to reduce injury and property loss. In June
2001, State Farm
Insurance, Inc., released the second report in its Dangerous
Intersection reporting
series. State Farm modeled its program after an initiative by the
Insurance Corporation
of British Columbia, Canada (ICBC), and the American
Automobile Association of
Michigan (AAA) to help position the nation’s largest auto
insurer as the most safety-
conscious insurer. ICBC had patterned its program on an earlier
effort in Victoria,
Australia. AAA, in turn, benchmarked its program on the ICBC
program. AAA
invited State Farm to help fund one of its intersection studies.
State Farm saw this as
an opportunity to expand its effort into a nationwide campaign
in 1999. “The 2001
study is part of a larger effort focused on loss prevention and
improving the safety of
intersections around the U.S.A.,” shared State Farm research
engineer John
Nepomuceno. State Farm has allocated significant resources as
well as funds to the
initiative. Since its inception, every city with an intersection on
the overall list of
dangerous intersections is eligible to apply for a $20,000 grant
to defray the cost of
a comprehensive traffic engineering study of the intersection.
Additionally, each city
named to the national top 10 dangerous intersection list is
eligible for a grant of
$100,000 per intersection to defray some of the cost of making
improvements. All
totaled, State Farm offered $4.44 million to the safety initiative
in its first year.
Due to its large market share, State Farm is the only U.S.
insurer in a position to
mine its databases for the requisite information on accidents to
come up with a
viable U.S. list. But it found that although it had the interest to
do so, its data warehouse
did not have sufficient information to tally accident rates for
intersections. To rectify
this, in 1998 State Farm included a location field as part of the
data that its claims
adjusters regularly complete. This location information, in
open-text format, indicates
whether the accident took place in an intersection or as part of
an incident related to
an intersection accident, and identifies the intersection.
Following the 1999 study,
the fields for identifying intersections were further refined.
In the first study using 1998 data (reported in June 1999) as
well as the 2001
State Farm:
Dangerous Intersections
Used with permission of
Pamela S. Schindler
©2001.
Business Research Methods, 14e/Schindler
2
study, State Farm looked at accidents involving only
intersecting roads. They
excluded any accident that occurred at the intersection of a road
and a highway
access or egress ramp. State Farm also looked only at accidents
where the State
Farm–insured driver was at fault.
Because of the study’s focus on road safety engineering, the
first study ignored
accident severity and made no attempt to isolate demographic
(age or gender of
driver, driving record, etc.) or geographic (weather conditions,
population of area,
etc.) factors related to the accident. It also looked only at State
Farm’s own internal
incident reports, not at any public records involving traffic
patterns or volume or
police incident reports. Based on industry market share
information, State Farm
was able to estimate the total number of crashes at a given
intersection. “There was
good reason to exclude police reports and traffic counts,”
explained Nepomuceno.
“The reporting threshold for police filing reports on accidents
differs widely from
jurisdiction to jurisdiction. Some will only fill out reports when
personal injury or
criminal behavior is involved. Others will fill them out only
when a vehicle is damaged
to the degree that it needs to be towed from the scene. Still
others fill out such
reports on every incident. Traffic volume reports are often
prepared infrequently
and often by independent sources. Not only may the data quality
be questionable,
but the time period in which the data was collected may not
match our 1998 incident
reports in every city involved. Also, when traffic volumes are
factored in, low volume
roads with relatively few crashes are often deprioritized. Now
that we’re through
with the 2001 study, we are asking ourselves if intersection
volume should be factored
in, and if so, how it can be included without significantly
increasing our effort in data
processing.”
In the 1998 study, State Farm identified 172 dangerous
intersections. The top
10 most dangerous intersections in the United States were
released publicly
(www.statefarm. com). Public affairs staff for each state could
request that up to 10
intersections be identified for their state. “This was usually
determined by the resources
that our local public affairs staff were willing to put toward the
program,” shared
Nepomuceno. “Each state had to recognize a top 10 national
intersection, but they
could request that no more be released or that up to 10
intersections within their
state be released.” As of August 2001, 97 cities (56.4 percent)
had applied for
State Farm grants.
“While some in the media claimed we had ‘hit a home run’ with
the program, we
quickly learned that there was a lot more at stake than we had
anticipated in generating
goodwill with transportation engineers,” indicated Nepomuceno.
“This is, after all, a
traffic safety program and we would not achieve that goal
without having the
cooperation of the traffic and transportation engineering
community. First, while
initially they lauded us for the attention our listing brought to
traffic concerns, we and
they soon discovered that the spotlight generated demand for
immediate solutions,
solutions that they often didn’t have budgets to implement.
Also, from their
perspective, not all accidents are the same; locations with
accidents that result in
injuries and death should be given more attention. Some
jurisdictions were upset
that we didn’t consider intersection volume and we didn’t
include accident rate
data.1 The fact that the State Farm grants were intended to
study the intersection
State Farm: Dangerous Intersections
Business Research Methods, 14e/Schindler
3
more completely wasn’t always seen as a solution to their
immediate problems.”
To include accident severity, State Farm needed a measurement
system for
classifying accidents. For the 2001 study, which used 1999 and
2000 accident data,
State Farm calculated a median property damage accident
payout (approximately
$1,700). Incidents requiring payout of more than the median
amount were classified
as “high severity”; those requiring less, “low severity.”
Additionally, State Farm chose
to classify each accident using a multipoint scale. Zero was
assigned to “no property
damage, no personal injury” incidents and a higher number was
assigned to “High
property damage, personal injury” incidents, with numbers in
between assigned to
levels of property damage and personal injury (see Exhibit SF
1–1). Accident scores
were summed to create an aggregate danger index for each
intersection. Each
intersection was then weighted by dividing the danger index by
State Farm’s market
share in the area. Of the 224 intersections identified, the top 10
were released to the
national media. Each of those 224 is now eligible for the
$20,000 grant to study the
intersection to identify specific improvements; the top 10 are
also eligible for $100,000
grants for improvements. In this second round, State Farm has
committed $5.48
million to the safety program.
State Farm is making plans to track the success of the
Dangerous Intersection
program. Once cities notify them of the completion of an
intersection’s improvements,
State Farm will start tracking accidents for that intersection for
a period of one year.
The first post-improvement evaluation study is expected in
2002. Additionally, State
Farm is taking steps to learn from the characteristics of the
dangerous intersections.
Each grant application for an affected city’s study of a
dangerous intersection must
include:
• Collection and analysis of police report data.
• An engineer’s “geometric review”2of the intersection.
• A capacity profile of the intersection.
• A traffic conflict study.3
• A benefit-cost analysis.
• A schedule of improvements (short-term, intermediate-term,
and long-term).4
State Farm plans to use the new data to identify patterns of
problems. This may
lead to a model of desired intersection traits against which
improvement plans can
be assessed, further increasing the effectiveness of the loss
prevention program and
making life a little easier for the transportation engineers with
whom they must partner
to achieve safety success.
Exhibit SF 1–1 Danger Codes
No Personal Injury With Personal Injury
No property damage 0 Y
Low property damage 1 1 + Y
High property damage X X + Y
State Farm: Dangerous Intersections
Business Research Methods, 14e/Schindler
4
1 Identify the various constructs and concepts involved in the
study.
2 What hypothesis might drive the research of one of the cities
on the top 10
dangerous intersection list?
3 Evaluate the methodology for State Farm’s research.
4 If you were State Farm, how would you address the concerns
of transpor-
tation engineers?
5 If you were State Farm, would you use traffic volume counts
as part of the
2003 study? What concerns, other than those expressed by
Nepomuceno,
do you have?
>>>>>Discussion
>>>>>Sources
>Notes
1 Accident rate is calculated by dividing the number of
accidents in a given period by the total
traffic volume over the same period.
2 The intersection geometry or physical layout of the
intersection can play an important role
in influencing driver behavior at intersections. For example, a
curve on the approach to an
intersection may impede the sight distance to a traffic signal,
preventing drivers from
stopping in time. Or, a driver approaching two signalized
intersections very closely spaced
may see the traffic signals at both intersections and become
confused about which traffic
signal to obey.
3 A traffic conflict study is an observation study of traffic
conflicts that do not necessarily
end in an accident but have the potential to do so. Recording
and studying observations of
driver behavior is expected to help traffic engineers understand
the same problems that
result in collisions. Some examples of conflicts are the sound of
sharply applied breaks;
sudden, unsignaled lane changes; or drivers hitting their horns.
4 Short-term improvements might include sign changes, changes
in lane markings, or signal-
timing changes. Most short-term improvements can be
implemented in less than two years.
Intermediate-term improvements might involve lane widening,
the addition of turn lanes,
etc., and be accomplished within 2–5 years. Examples of long-
term improvements include
grade separation of the intersecting roads and can take 5–10
years to implement.
This case is based on information provided by John
Nepomuceno in interviews that took
place on August 9, 2001, and September 13, 2001. Other
sources include: “Miami Area Intersection
Tops State Farm List of Most Dangerous in the United States,”
State Farm press release, June
27, 2001 (http://www.statefarm.
com/media/release/danger00.htm); “Research” (http://
www.statefarm.com/media/methods.htm); and “State Farm 1999
Dangerous Intersection National
Status List” (http://www.statefarm.com/media/statustop.htm);
and “State Farm’s Dangerous
Intersection Initiative,” Institute of Transportation Engineers
press release, June 27, 2001
(http://www.ite.org/press_release.htm).
State Farm: Dangerous Intersections
Criteria Ratings Points
Content -
Part I -
Initial Post
9 to >8.0 pts
Advanced
Author responded to all
case study questions by
posted deadlines.
Insightful throughout.
Completely developed all
relevant information.
Critical issues and key
areas that supported
each question were
clearly identified,
analyzed, and supported.
8 to >7.0 pts
Proficient
Author responded to all
case study questions by
posted deadlines.
Specific, solid. Less
carefully developed.
Some insights. Critical
issues and key areas
that supported each
question were partially
identified, analyzed, and
supported.
7 to >0.0 pts
Developing
Author responded to at least 4
questions by posted deadlines.
Vague, obvious,
underdeveloped, or too broad.
One or more main issues not
identified. Limited evidence of
critical thinking. Critical issues
and key areas that supported
each question were not clearly
identified, analyzed, and
supported.
0 pts
Not
Present
9 pts
Content -
Part I -
Direct
Application
of
Scholarly
Research
&
Integration
of Biblical
Principles
9 to >8.0 pts
Advanced
Author accurately applied
5 or more scholarly (peer
reviewed) sources to the
discussion. Author
accurately applied at
least 1 scholarly
(peer-reviewed) source to
each question. Author
accurately applied at
least 1 scriptural/Biblical
principles in each
question response.
8 to >7.0 pts
Proficient
Author accurately
applied at least 4
scholarly (peer
reviewed) sources to the
discussion. Author
accurately applied at
least 1 scholarly
(peer-reviewed) source
to each question. Author
accurately applied at
least 1 scriptural/Biblical
principle in each
question response.
7 to >0.0 pts
Developing
Author accurately applied 1 -3
scholarly (peer reviewed)
sources to the discussion.
Author accurately applied at
least 1 scholarly
(peer-reviewed) source to
some questions. Author
accurately applied at least 1
scriptural/Biblical principle in
each question response.
0 pts
Not
Present
9 pts
Content -
Part I -
Mechanics,
APA Style
& Word
Count
7 to >6.0 pts
Advanced
Correct spelling and
grammar are used
throughout the essay.
There are 0–1 errors in
grammar or spelling that
distract the reader from
the content. There are
0–1 minor errors in APA
format in the required
items: citations and
references. The word
count of 800-1000 words
is met.
6 to >5.0 pts
Proficient
There are 2-3 errors in
grammar or spelling that
distract the reader from
the content. There are
2–3 minor errors in APA
format in the required
items. The word count
of at least 750 words is
met.
5 to >0.0 pts
Developing
There are 4-5 errors in
grammar or spelling that
distract the reader from the
content. There are more than
3 errors in APA format in the
required items. The word
count of 500–749 words.
0 pts
Not
Present
7 pts
Discussion Grading Rubric | BUSI600_C01_202140
Criteria Ratings Points
Content -
Part II -
Two
Individual
Response
Posts
9 to >8.0 pts
Advanced
Author responded to at
least 2 different peers by
posted deadlines.
Insightful throughout.
Completely developed all
relevant information.
Critical issues and key
areas that supported
each question were
clearly identified,
analyzed, and supported.
Offer at least 1 strength
and 1 weakness for each
reply.
8 to >7.0 pts
Proficient
Author responded to at
least 2 different peers by
posted deadlines.
Specific, solid. Less
carefully developed.
Some insights. Critical
issues and key areas
that supported each
question were partially
identified, analyzed, and
supported. Offer at least
1 strength and 1
weakness for each reply.
7 to >0.0 pts
Developing
Author responded to at least 1
different peer by posted
deadlines. Vague, obvious,
underdeveloped, or too broad.
One or more main issues not
identified. Limited evidence of
critical thinking. Critical issues
and key areas that supported
each question were not clearly
identified, analyzed, and
supported. Offer at least 1
strength and 1 weakness for
one reply.
0 pts
Not
Present
9 pts
Content -
Part II -
Direct
Application
of
Scholarly
Research
&
Integration
of Biblical
Principles
9 to >8.0 pts
Advanced
Author accurately applied
2 or more scholarly (peer
reviewed) sources to
each peer response.
Author accurately applied
at least 1
scriptural/Biblical
principles in each
question response (no
more than 10% of the
total response).
8 to >7.0 pts
Proficient
Author accurately
applied at least 2
scholarly (peer
reviewed) sources to
each peer response.
Author accurately
applied at least 1
scriptural/Biblical
principle in each
question response (no
more than 10% of the
total response).
7 to >0.0 pts
Developing
Author accurately applied 1 or
2 scholarly (peer reviewed)
sources to some peer
response. Author accurately
applied at least 1
scriptural/Biblical principle in
each question response (no
more than 10% of the total
response).
0 pts
Not
Present
9 pts
Content -
Part II -
Mechanics,
APA Style
& Word
Count
7 to >6.0 pts
Advanced
Correct spelling and
grammar are used
throughout the essay.
There are 0–1 errors in
grammar or spelling that
distract the reader from
the content. There are
0–1 minor errors in APA
format in the required
items: citations and
references. The word
count of 450–600 words
is met for each response.
6 to >5.0 pts
Proficient
There are 2-3 errors in
grammar or spelling that
distract the reader from
the content. There are
2–3 minor errors in APA
format in the required
items. The word count
of at least 400 words is
met for each response.
5 to >0.0 pts
Developing
There are 4-5 errors in
grammar or spelling that
distract the reader from the
content. There are more than
3 errors in APA format in the
required items. The word
count of 300 - 399 words is
met for each response.
0 pts
Not
Present
7 pts
Total Points: 50
Discussion Grading Rubric | BUSI600_C01_202140

More Related Content

What's hot

Rr q4 2016_presentation_final
Rr q4 2016_presentation_finalRr q4 2016_presentation_final
Rr q4 2016_presentation_finalRamirent Group
 
Second Quarter of Fiscal Year Ending March 2016 Briefing on Financial Results
Second Quarter of Fiscal Year Ending March 2016 Briefing on Financial ResultsSecond Quarter of Fiscal Year Ending March 2016 Briefing on Financial Results
Second Quarter of Fiscal Year Ending March 2016 Briefing on Financial ResultsRicohLease
 
QNBFS Daily Market Report November 01, 2020
QNBFS Daily Market Report November 01, 2020QNBFS Daily Market Report November 01, 2020
QNBFS Daily Market Report November 01, 2020QNB Group
 
Presentations
PresentationsPresentations
PresentationsEucatexRI
 
Fiscal Year-ending March 2015 Briefing on the Results for the Second Quarter
Fiscal Year-ending March 2015 Briefing on the Results for the Second  QuarterFiscal Year-ending March 2015 Briefing on the Results for the Second  Quarter
Fiscal Year-ending March 2015 Briefing on the Results for the Second QuarterRicohLease
 
GuessBox Financial Model 2017
GuessBox Financial Model 2017GuessBox Financial Model 2017
GuessBox Financial Model 2017GuessBox
 
2 q13 investor presentation
2 q13 investor presentation2 q13 investor presentation
2 q13 investor presentationBancoABCRI
 
Webcast 2Q17
Webcast 2Q17Webcast 2Q17
Webcast 2Q17Localiza
 
Financial Statement Analysis - 2009 presentation
Financial Statement Analysis - 2009 presentationFinancial Statement Analysis - 2009 presentation
Financial Statement Analysis - 2009 presentationFelix Yamasato
 
JLL Cincinnati Industrial Outlook Q3 2020
JLL Cincinnati Industrial Outlook Q3 2020JLL Cincinnati Industrial Outlook Q3 2020
JLL Cincinnati Industrial Outlook Q3 2020Abby Armbruster
 
Colgate ru2 qfy2011-281010
Colgate  ru2 qfy2011-281010Colgate  ru2 qfy2011-281010
Colgate ru2 qfy2011-281010Angel Broking
 
Fiscal Year Ended March 2016 Briefing on Financial Results
Fiscal Year Ended March 2016 Briefing on Financial ResultsFiscal Year Ended March 2016 Briefing on Financial Results
Fiscal Year Ended March 2016 Briefing on Financial ResultsRicohLease
 
dover Q206_Slides
dover Q206_Slidesdover Q206_Slides
dover Q206_Slidesfinance30
 
Analyst presentation: business plan to 2020
Analyst presentation: business plan to 2020Analyst presentation: business plan to 2020
Analyst presentation: business plan to 2020Hera Group
 
Bank of india ru2 qfy2011-221010
Bank of india ru2 qfy2011-221010Bank of india ru2 qfy2011-221010
Bank of india ru2 qfy2011-221010Angel Broking
 
ACC Q1FY15: Earnings mildly below expectation; outlook remains strong
 ACC Q1FY15: Earnings mildly below expectation; outlook remains strong ACC Q1FY15: Earnings mildly below expectation; outlook remains strong
ACC Q1FY15: Earnings mildly below expectation; outlook remains strongIndiaNotes.com
 
Earnings Release Presentation - Third Quarter 2010 (3Q10).
Earnings Release Presentation - Third Quarter 2010 (3Q10).Earnings Release Presentation - Third Quarter 2010 (3Q10).
Earnings Release Presentation - Third Quarter 2010 (3Q10).MRVRI
 

What's hot (19)

Rr q4 2016_presentation_final
Rr q4 2016_presentation_finalRr q4 2016_presentation_final
Rr q4 2016_presentation_final
 
Second Quarter of Fiscal Year Ending March 2016 Briefing on Financial Results
Second Quarter of Fiscal Year Ending March 2016 Briefing on Financial ResultsSecond Quarter of Fiscal Year Ending March 2016 Briefing on Financial Results
Second Quarter of Fiscal Year Ending March 2016 Briefing on Financial Results
 
QNBFS Daily Market Report November 01, 2020
QNBFS Daily Market Report November 01, 2020QNBFS Daily Market Report November 01, 2020
QNBFS Daily Market Report November 01, 2020
 
Presentations
PresentationsPresentations
Presentations
 
Fiscal Year-ending March 2015 Briefing on the Results for the Second Quarter
Fiscal Year-ending March 2015 Briefing on the Results for the Second  QuarterFiscal Year-ending March 2015 Briefing on the Results for the Second  Quarter
Fiscal Year-ending March 2015 Briefing on the Results for the Second Quarter
 
GuessBox Financial Model 2017
GuessBox Financial Model 2017GuessBox Financial Model 2017
GuessBox Financial Model 2017
 
Q2 results overview 2014
Q2 results overview 2014Q2 results overview 2014
Q2 results overview 2014
 
2 q13 investor presentation
2 q13 investor presentation2 q13 investor presentation
2 q13 investor presentation
 
Webcast 2Q17
Webcast 2Q17Webcast 2Q17
Webcast 2Q17
 
Financial Statement Analysis - 2009 presentation
Financial Statement Analysis - 2009 presentationFinancial Statement Analysis - 2009 presentation
Financial Statement Analysis - 2009 presentation
 
Usl ktk
Usl ktkUsl ktk
Usl ktk
 
JLL Cincinnati Industrial Outlook Q3 2020
JLL Cincinnati Industrial Outlook Q3 2020JLL Cincinnati Industrial Outlook Q3 2020
JLL Cincinnati Industrial Outlook Q3 2020
 
Colgate ru2 qfy2011-281010
Colgate  ru2 qfy2011-281010Colgate  ru2 qfy2011-281010
Colgate ru2 qfy2011-281010
 
Fiscal Year Ended March 2016 Briefing on Financial Results
Fiscal Year Ended March 2016 Briefing on Financial ResultsFiscal Year Ended March 2016 Briefing on Financial Results
Fiscal Year Ended March 2016 Briefing on Financial Results
 
dover Q206_Slides
dover Q206_Slidesdover Q206_Slides
dover Q206_Slides
 
Analyst presentation: business plan to 2020
Analyst presentation: business plan to 2020Analyst presentation: business plan to 2020
Analyst presentation: business plan to 2020
 
Bank of india ru2 qfy2011-221010
Bank of india ru2 qfy2011-221010Bank of india ru2 qfy2011-221010
Bank of india ru2 qfy2011-221010
 
ACC Q1FY15: Earnings mildly below expectation; outlook remains strong
 ACC Q1FY15: Earnings mildly below expectation; outlook remains strong ACC Q1FY15: Earnings mildly below expectation; outlook remains strong
ACC Q1FY15: Earnings mildly below expectation; outlook remains strong
 
Earnings Release Presentation - Third Quarter 2010 (3Q10).
Earnings Release Presentation - Third Quarter 2010 (3Q10).Earnings Release Presentation - Third Quarter 2010 (3Q10).
Earnings Release Presentation - Third Quarter 2010 (3Q10).
 

Similar to Income statementsamsung fiscal year is january december. all values

Financial InformationMicrosoftMicrosoftIncome StatementBalance She
Financial InformationMicrosoftMicrosoftIncome StatementBalance SheFinancial InformationMicrosoftMicrosoftIncome StatementBalance She
Financial InformationMicrosoftMicrosoftIncome StatementBalance SheChereCheek752
 
Investment Audit PowerPoint Presentation Slides
Investment Audit PowerPoint Presentation SlidesInvestment Audit PowerPoint Presentation Slides
Investment Audit PowerPoint Presentation SlidesSlideTeam
 
Third Quarter of Fiscal Year Ending March 2021 (FY2020) Financial Highlights
Third Quarter of Fiscal Year Ending March 2021 (FY2020) Financial HighlightsThird Quarter of Fiscal Year Ending March 2021 (FY2020) Financial Highlights
Third Quarter of Fiscal Year Ending March 2021 (FY2020) Financial HighlightsRicohLease
 
Results presentation 4 q12
Results presentation 4 q12Results presentation 4 q12
Results presentation 4 q12comgasri
 
Results presentation 2 q12
Results presentation 2 q12Results presentation 2 q12
Results presentation 2 q12comgasri
 
1Q22_EN.pdf
1Q22_EN.pdf1Q22_EN.pdf
1Q22_EN.pdfirhcs
 
Abc brasil investor_presentation2q13_eng
Abc brasil investor_presentation2q13_engAbc brasil investor_presentation2q13_eng
Abc brasil investor_presentation2q13_engBancoABCRI
 
Financial Ratio Analysis PowerPoint Presentation Slides
Financial Ratio Analysis PowerPoint Presentation SlidesFinancial Ratio Analysis PowerPoint Presentation Slides
Financial Ratio Analysis PowerPoint Presentation SlidesSlideTeam
 
Company 1Company #1Income StatementBalance SheetAll numbers in tho.docx
Company 1Company #1Income StatementBalance SheetAll numbers in tho.docxCompany 1Company #1Income StatementBalance SheetAll numbers in tho.docx
Company 1Company #1Income StatementBalance SheetAll numbers in tho.docxmccormicknadine86
 
Financial InformationIn this worksheet, you will recreate both the
Financial InformationIn this worksheet, you will recreate both theFinancial InformationIn this worksheet, you will recreate both the
Financial InformationIn this worksheet, you will recreate both theChereCheek752
 
210521-Analyst PPT Q4FY21.pdf
210521-Analyst PPT Q4FY21.pdf210521-Analyst PPT Q4FY21.pdf
210521-Analyst PPT Q4FY21.pdfVanshLatiyan3
 
Financing Forecasting Process And Methods PowerPoint Presentation Slides
Financing Forecasting Process And Methods PowerPoint Presentation SlidesFinancing Forecasting Process And Methods PowerPoint Presentation Slides
Financing Forecasting Process And Methods PowerPoint Presentation SlidesSlideTeam
 
Budgeting And Forecasting In Accounting PowerPoint Presentation Slides
Budgeting And Forecasting In Accounting PowerPoint Presentation SlidesBudgeting And Forecasting In Accounting PowerPoint Presentation Slides
Budgeting And Forecasting In Accounting PowerPoint Presentation SlidesSlideTeam
 
Operating AssumptionsMatch Valuation Model - Operating Assumptions.docx
Operating AssumptionsMatch Valuation Model - Operating Assumptions.docxOperating AssumptionsMatch Valuation Model - Operating Assumptions.docx
Operating AssumptionsMatch Valuation Model - Operating Assumptions.docxhopeaustin33688
 
Legal Investigation PowerPoint Presentation Slides
Legal Investigation PowerPoint Presentation SlidesLegal Investigation PowerPoint Presentation Slides
Legal Investigation PowerPoint Presentation SlidesSlideTeam
 
Uniliver's financial modeling
Uniliver's financial modeling Uniliver's financial modeling
Uniliver's financial modeling Tooba Shafique
 
Due Diligence PowerPoint Presentation Slides
Due Diligence PowerPoint Presentation Slides Due Diligence PowerPoint Presentation Slides
Due Diligence PowerPoint Presentation Slides SlideTeam
 

Similar to Income statementsamsung fiscal year is january december. all values (20)

Financial InformationMicrosoftMicrosoftIncome StatementBalance She
Financial InformationMicrosoftMicrosoftIncome StatementBalance SheFinancial InformationMicrosoftMicrosoftIncome StatementBalance She
Financial InformationMicrosoftMicrosoftIncome StatementBalance She
 
Investment Audit PowerPoint Presentation Slides
Investment Audit PowerPoint Presentation SlidesInvestment Audit PowerPoint Presentation Slides
Investment Audit PowerPoint Presentation Slides
 
Third Quarter of Fiscal Year Ending March 2021 (FY2020) Financial Highlights
Third Quarter of Fiscal Year Ending March 2021 (FY2020) Financial HighlightsThird Quarter of Fiscal Year Ending March 2021 (FY2020) Financial Highlights
Third Quarter of Fiscal Year Ending March 2021 (FY2020) Financial Highlights
 
Results presentation 4 q12
Results presentation 4 q12Results presentation 4 q12
Results presentation 4 q12
 
Results presentation 2 q12
Results presentation 2 q12Results presentation 2 q12
Results presentation 2 q12
 
1Q22_EN.pdf
1Q22_EN.pdf1Q22_EN.pdf
1Q22_EN.pdf
 
Abc brasil investor_presentation2q13_eng
Abc brasil investor_presentation2q13_engAbc brasil investor_presentation2q13_eng
Abc brasil investor_presentation2q13_eng
 
Financial Ratio Analysis PowerPoint Presentation Slides
Financial Ratio Analysis PowerPoint Presentation SlidesFinancial Ratio Analysis PowerPoint Presentation Slides
Financial Ratio Analysis PowerPoint Presentation Slides
 
Company 1Company #1Income StatementBalance SheetAll numbers in tho.docx
Company 1Company #1Income StatementBalance SheetAll numbers in tho.docxCompany 1Company #1Income StatementBalance SheetAll numbers in tho.docx
Company 1Company #1Income StatementBalance SheetAll numbers in tho.docx
 
Financial InformationIn this worksheet, you will recreate both the
Financial InformationIn this worksheet, you will recreate both theFinancial InformationIn this worksheet, you will recreate both the
Financial InformationIn this worksheet, you will recreate both the
 
210521-Analyst PPT Q4FY21.pdf
210521-Analyst PPT Q4FY21.pdf210521-Analyst PPT Q4FY21.pdf
210521-Analyst PPT Q4FY21.pdf
 
INVESTAURA_Business-Planning-Template.pdf
INVESTAURA_Business-Planning-Template.pdfINVESTAURA_Business-Planning-Template.pdf
INVESTAURA_Business-Planning-Template.pdf
 
Financing Forecasting Process And Methods PowerPoint Presentation Slides
Financing Forecasting Process And Methods PowerPoint Presentation SlidesFinancing Forecasting Process And Methods PowerPoint Presentation Slides
Financing Forecasting Process And Methods PowerPoint Presentation Slides
 
Budgeting And Forecasting In Accounting PowerPoint Presentation Slides
Budgeting And Forecasting In Accounting PowerPoint Presentation SlidesBudgeting And Forecasting In Accounting PowerPoint Presentation Slides
Budgeting And Forecasting In Accounting PowerPoint Presentation Slides
 
Operating AssumptionsMatch Valuation Model - Operating Assumptions.docx
Operating AssumptionsMatch Valuation Model - Operating Assumptions.docxOperating AssumptionsMatch Valuation Model - Operating Assumptions.docx
Operating AssumptionsMatch Valuation Model - Operating Assumptions.docx
 
Legal Investigation PowerPoint Presentation Slides
Legal Investigation PowerPoint Presentation SlidesLegal Investigation PowerPoint Presentation Slides
Legal Investigation PowerPoint Presentation Slides
 
gs 078930 Algorithm Investment Report
gs 078930 Algorithm Investment Reportgs 078930 Algorithm Investment Report
gs 078930 Algorithm Investment Report
 
Uniliver's financial modeling
Uniliver's financial modeling Uniliver's financial modeling
Uniliver's financial modeling
 
Due Diligence PowerPoint Presentation Slides
Due Diligence PowerPoint Presentation Slides Due Diligence PowerPoint Presentation Slides
Due Diligence PowerPoint Presentation Slides
 
Presentation 2013
Presentation 2013Presentation 2013
Presentation 2013
 

More from ssuser337fce

Isbn 978 1-4665-6631-69 781466 56631690000 busines
Isbn 978 1-4665-6631-69 781466 56631690000 businesIsbn 978 1-4665-6631-69 781466 56631690000 busines
Isbn 978 1-4665-6631-69 781466 56631690000 businesssuser337fce
 
Is socialism the answer socialism is defined as a way of organi
Is socialism the answer socialism is defined as a way of organiIs socialism the answer socialism is defined as a way of organi
Is socialism the answer socialism is defined as a way of organissuser337fce
 
Is our system of criminal justice just while the u.s. constituti
Is our system of criminal justice just while the u.s. constitutiIs our system of criminal justice just while the u.s. constituti
Is our system of criminal justice just while the u.s. constitutissuser337fce
 
Introduction waste management id acknowledged as a challenging is
Introduction waste management id acknowledged as a challenging isIntroduction waste management id acknowledged as a challenging is
Introduction waste management id acknowledged as a challenging isssuser337fce
 
Introduction this proposal presents a comprehensive analysis and
Introduction this proposal presents a comprehensive analysis and Introduction this proposal presents a comprehensive analysis and
Introduction this proposal presents a comprehensive analysis and ssuser337fce
 
Introduction this journal assignment will help you reflect on you
Introduction this journal assignment will help you reflect on youIntroduction this journal assignment will help you reflect on you
Introduction this journal assignment will help you reflect on youssuser337fce
 
Introduction an online profile is a necessity to nowadays job see
Introduction an online profile is a necessity to nowadays job seeIntroduction an online profile is a necessity to nowadays job see
Introduction an online profile is a necessity to nowadays job seessuser337fce
 
Introduction. unrelieved postoperative pain remains a common probl
Introduction. unrelieved postoperative pain remains a common problIntroduction. unrelieved postoperative pain remains a common probl
Introduction. unrelieved postoperative pain remains a common problssuser337fce
 
Introduction to law ethics writing assignment introductionacc
Introduction to law ethics writing assignment introductionaccIntroduction to law ethics writing assignment introductionacc
Introduction to law ethics writing assignment introductionaccssuser337fce
 
Introduction and defining the msitm capstone course requirements
Introduction and defining the msitm capstone course requirements Introduction and defining the msitm capstone course requirements
Introduction and defining the msitm capstone course requirements ssuser337fce
 
Introduction amazon and the case study current state of th
Introduction amazon and the case study current state of thIntroduction amazon and the case study current state of th
Introduction amazon and the case study current state of thssuser337fce
 
Introduce the topic history and background information - 2 - citat
Introduce the topic   history and background information - 2 - citatIntroduce the topic   history and background information - 2 - citat
Introduce the topic history and background information - 2 - citatssuser337fce
 
International management managing across borders and cultu
International management managing across borders and cultuInternational management managing across borders and cultu
International management managing across borders and cultussuser337fce
 
International journal of environmental researchand pu
International  journal  of environmental researchand puInternational  journal  of environmental researchand pu
International journal of environmental researchand pussuser337fce
 
Interdisciplinary care plan7 class nur3400
Interdisciplinary care plan7 class nur3400Interdisciplinary care plan7 class nur3400
Interdisciplinary care plan7 class nur3400ssuser337fce
 
Int 463 international relations part ii dr. osman sabri k
Int 463 international relations part ii dr. osman sabri kInt 463 international relations part ii dr. osman sabri k
Int 463 international relations part ii dr. osman sabri kssuser337fce
 
Int 220 module six assignment conference call invitation templat
Int 220 module six assignment conference call invitation templatInt 220 module six assignment conference call invitation templat
Int 220 module six assignment conference call invitation templatssuser337fce
 
Instructions you will post one thread of at least 500 words. fo
Instructions you will post one thread of at least 500 words.  foInstructions you will post one thread of at least 500 words.  fo
Instructions you will post one thread of at least 500 words. fossuser337fce
 
Instructions review the writing assignment instructions (unde
Instructions review the writing assignment instructions (undeInstructions review the writing assignment instructions (unde
Instructions review the writing assignment instructions (undessuser337fce
 
Instructions milestone 3 purpose statementwork with your cha
Instructions milestone 3 purpose statementwork with your chaInstructions milestone 3 purpose statementwork with your cha
Instructions milestone 3 purpose statementwork with your chassuser337fce
 

More from ssuser337fce (20)

Isbn 978 1-4665-6631-69 781466 56631690000 busines
Isbn 978 1-4665-6631-69 781466 56631690000 businesIsbn 978 1-4665-6631-69 781466 56631690000 busines
Isbn 978 1-4665-6631-69 781466 56631690000 busines
 
Is socialism the answer socialism is defined as a way of organi
Is socialism the answer socialism is defined as a way of organiIs socialism the answer socialism is defined as a way of organi
Is socialism the answer socialism is defined as a way of organi
 
Is our system of criminal justice just while the u.s. constituti
Is our system of criminal justice just while the u.s. constitutiIs our system of criminal justice just while the u.s. constituti
Is our system of criminal justice just while the u.s. constituti
 
Introduction waste management id acknowledged as a challenging is
Introduction waste management id acknowledged as a challenging isIntroduction waste management id acknowledged as a challenging is
Introduction waste management id acknowledged as a challenging is
 
Introduction this proposal presents a comprehensive analysis and
Introduction this proposal presents a comprehensive analysis and Introduction this proposal presents a comprehensive analysis and
Introduction this proposal presents a comprehensive analysis and
 
Introduction this journal assignment will help you reflect on you
Introduction this journal assignment will help you reflect on youIntroduction this journal assignment will help you reflect on you
Introduction this journal assignment will help you reflect on you
 
Introduction an online profile is a necessity to nowadays job see
Introduction an online profile is a necessity to nowadays job seeIntroduction an online profile is a necessity to nowadays job see
Introduction an online profile is a necessity to nowadays job see
 
Introduction. unrelieved postoperative pain remains a common probl
Introduction. unrelieved postoperative pain remains a common problIntroduction. unrelieved postoperative pain remains a common probl
Introduction. unrelieved postoperative pain remains a common probl
 
Introduction to law ethics writing assignment introductionacc
Introduction to law ethics writing assignment introductionaccIntroduction to law ethics writing assignment introductionacc
Introduction to law ethics writing assignment introductionacc
 
Introduction and defining the msitm capstone course requirements
Introduction and defining the msitm capstone course requirements Introduction and defining the msitm capstone course requirements
Introduction and defining the msitm capstone course requirements
 
Introduction amazon and the case study current state of th
Introduction amazon and the case study current state of thIntroduction amazon and the case study current state of th
Introduction amazon and the case study current state of th
 
Introduce the topic history and background information - 2 - citat
Introduce the topic   history and background information - 2 - citatIntroduce the topic   history and background information - 2 - citat
Introduce the topic history and background information - 2 - citat
 
International management managing across borders and cultu
International management managing across borders and cultuInternational management managing across borders and cultu
International management managing across borders and cultu
 
International journal of environmental researchand pu
International  journal  of environmental researchand puInternational  journal  of environmental researchand pu
International journal of environmental researchand pu
 
Interdisciplinary care plan7 class nur3400
Interdisciplinary care plan7 class nur3400Interdisciplinary care plan7 class nur3400
Interdisciplinary care plan7 class nur3400
 
Int 463 international relations part ii dr. osman sabri k
Int 463 international relations part ii dr. osman sabri kInt 463 international relations part ii dr. osman sabri k
Int 463 international relations part ii dr. osman sabri k
 
Int 220 module six assignment conference call invitation templat
Int 220 module six assignment conference call invitation templatInt 220 module six assignment conference call invitation templat
Int 220 module six assignment conference call invitation templat
 
Instructions you will post one thread of at least 500 words. fo
Instructions you will post one thread of at least 500 words.  foInstructions you will post one thread of at least 500 words.  fo
Instructions you will post one thread of at least 500 words. fo
 
Instructions review the writing assignment instructions (unde
Instructions review the writing assignment instructions (undeInstructions review the writing assignment instructions (unde
Instructions review the writing assignment instructions (unde
 
Instructions milestone 3 purpose statementwork with your cha
Instructions milestone 3 purpose statementwork with your chaInstructions milestone 3 purpose statementwork with your cha
Instructions milestone 3 purpose statementwork with your cha
 

Recently uploaded

Unit-IV; Professional Sales Representative (PSR).pptx
Unit-IV; Professional Sales Representative (PSR).pptxUnit-IV; Professional Sales Representative (PSR).pptx
Unit-IV; Professional Sales Representative (PSR).pptxVishalSingh1417
 
ComPTIA Overview | Comptia Security+ Book SY0-701
ComPTIA Overview | Comptia Security+ Book SY0-701ComPTIA Overview | Comptia Security+ Book SY0-701
ComPTIA Overview | Comptia Security+ Book SY0-701bronxfugly43
 
Python Notes for mca i year students osmania university.docx
Python Notes for mca i year students osmania university.docxPython Notes for mca i year students osmania university.docx
Python Notes for mca i year students osmania university.docxRamakrishna Reddy Bijjam
 
Holdier Curriculum Vitae (April 2024).pdf
Holdier Curriculum Vitae (April 2024).pdfHoldier Curriculum Vitae (April 2024).pdf
Holdier Curriculum Vitae (April 2024).pdfagholdier
 
Magic bus Group work1and 2 (Team 3).pptx
Magic bus Group work1and 2 (Team 3).pptxMagic bus Group work1and 2 (Team 3).pptx
Magic bus Group work1and 2 (Team 3).pptxdhanalakshmis0310
 
Third Battle of Panipat detailed notes.pptx
Third Battle of Panipat detailed notes.pptxThird Battle of Panipat detailed notes.pptx
Third Battle of Panipat detailed notes.pptxAmita Gupta
 
2024-NATIONAL-LEARNING-CAMP-AND-OTHER.pptx
2024-NATIONAL-LEARNING-CAMP-AND-OTHER.pptx2024-NATIONAL-LEARNING-CAMP-AND-OTHER.pptx
2024-NATIONAL-LEARNING-CAMP-AND-OTHER.pptxMaritesTamaniVerdade
 
Introduction to Nonprofit Accounting: The Basics
Introduction to Nonprofit Accounting: The BasicsIntroduction to Nonprofit Accounting: The Basics
Introduction to Nonprofit Accounting: The BasicsTechSoup
 
Making communications land - Are they received and understood as intended? we...
Making communications land - Are they received and understood as intended? we...Making communications land - Are they received and understood as intended? we...
Making communications land - Are they received and understood as intended? we...Association for Project Management
 
Basic Civil Engineering first year Notes- Chapter 4 Building.pptx
Basic Civil Engineering first year Notes- Chapter 4 Building.pptxBasic Civil Engineering first year Notes- Chapter 4 Building.pptx
Basic Civil Engineering first year Notes- Chapter 4 Building.pptxDenish Jangid
 
How to Give a Domain for a Field in Odoo 17
How to Give a Domain for a Field in Odoo 17How to Give a Domain for a Field in Odoo 17
How to Give a Domain for a Field in Odoo 17Celine George
 
UGC NET Paper 1 Mathematical Reasoning & Aptitude.pdf
UGC NET Paper 1 Mathematical Reasoning & Aptitude.pdfUGC NET Paper 1 Mathematical Reasoning & Aptitude.pdf
UGC NET Paper 1 Mathematical Reasoning & Aptitude.pdfNirmal Dwivedi
 
1029 - Danh muc Sach Giao Khoa 10 . pdf
1029 -  Danh muc Sach Giao Khoa 10 . pdf1029 -  Danh muc Sach Giao Khoa 10 . pdf
1029 - Danh muc Sach Giao Khoa 10 . pdfQucHHunhnh
 
ICT role in 21st century education and it's challenges.
ICT role in 21st century education and it's challenges.ICT role in 21st century education and it's challenges.
ICT role in 21st century education and it's challenges.MaryamAhmad92
 
Jual Obat Aborsi Hongkong ( Asli No.1 ) 085657271886 Obat Penggugur Kandungan...
Jual Obat Aborsi Hongkong ( Asli No.1 ) 085657271886 Obat Penggugur Kandungan...Jual Obat Aborsi Hongkong ( Asli No.1 ) 085657271886 Obat Penggugur Kandungan...
Jual Obat Aborsi Hongkong ( Asli No.1 ) 085657271886 Obat Penggugur Kandungan...ZurliaSoop
 
Sociology 101 Demonstration of Learning Exhibit
Sociology 101 Demonstration of Learning ExhibitSociology 101 Demonstration of Learning Exhibit
Sociology 101 Demonstration of Learning Exhibitjbellavia9
 
psychiatric nursing HISTORY COLLECTION .docx
psychiatric  nursing HISTORY  COLLECTION  .docxpsychiatric  nursing HISTORY  COLLECTION  .docx
psychiatric nursing HISTORY COLLECTION .docxPoojaSen20
 
Understanding Accommodations and Modifications
Understanding  Accommodations and ModificationsUnderstanding  Accommodations and Modifications
Understanding Accommodations and ModificationsMJDuyan
 

Recently uploaded (20)

Unit-IV; Professional Sales Representative (PSR).pptx
Unit-IV; Professional Sales Representative (PSR).pptxUnit-IV; Professional Sales Representative (PSR).pptx
Unit-IV; Professional Sales Representative (PSR).pptx
 
ComPTIA Overview | Comptia Security+ Book SY0-701
ComPTIA Overview | Comptia Security+ Book SY0-701ComPTIA Overview | Comptia Security+ Book SY0-701
ComPTIA Overview | Comptia Security+ Book SY0-701
 
Python Notes for mca i year students osmania university.docx
Python Notes for mca i year students osmania university.docxPython Notes for mca i year students osmania university.docx
Python Notes for mca i year students osmania university.docx
 
Holdier Curriculum Vitae (April 2024).pdf
Holdier Curriculum Vitae (April 2024).pdfHoldier Curriculum Vitae (April 2024).pdf
Holdier Curriculum Vitae (April 2024).pdf
 
Magic bus Group work1and 2 (Team 3).pptx
Magic bus Group work1and 2 (Team 3).pptxMagic bus Group work1and 2 (Team 3).pptx
Magic bus Group work1and 2 (Team 3).pptx
 
Third Battle of Panipat detailed notes.pptx
Third Battle of Panipat detailed notes.pptxThird Battle of Panipat detailed notes.pptx
Third Battle of Panipat detailed notes.pptx
 
2024-NATIONAL-LEARNING-CAMP-AND-OTHER.pptx
2024-NATIONAL-LEARNING-CAMP-AND-OTHER.pptx2024-NATIONAL-LEARNING-CAMP-AND-OTHER.pptx
2024-NATIONAL-LEARNING-CAMP-AND-OTHER.pptx
 
Introduction to Nonprofit Accounting: The Basics
Introduction to Nonprofit Accounting: The BasicsIntroduction to Nonprofit Accounting: The Basics
Introduction to Nonprofit Accounting: The Basics
 
Making communications land - Are they received and understood as intended? we...
Making communications land - Are they received and understood as intended? we...Making communications land - Are they received and understood as intended? we...
Making communications land - Are they received and understood as intended? we...
 
Basic Civil Engineering first year Notes- Chapter 4 Building.pptx
Basic Civil Engineering first year Notes- Chapter 4 Building.pptxBasic Civil Engineering first year Notes- Chapter 4 Building.pptx
Basic Civil Engineering first year Notes- Chapter 4 Building.pptx
 
How to Give a Domain for a Field in Odoo 17
How to Give a Domain for a Field in Odoo 17How to Give a Domain for a Field in Odoo 17
How to Give a Domain for a Field in Odoo 17
 
UGC NET Paper 1 Mathematical Reasoning & Aptitude.pdf
UGC NET Paper 1 Mathematical Reasoning & Aptitude.pdfUGC NET Paper 1 Mathematical Reasoning & Aptitude.pdf
UGC NET Paper 1 Mathematical Reasoning & Aptitude.pdf
 
1029 - Danh muc Sach Giao Khoa 10 . pdf
1029 -  Danh muc Sach Giao Khoa 10 . pdf1029 -  Danh muc Sach Giao Khoa 10 . pdf
1029 - Danh muc Sach Giao Khoa 10 . pdf
 
ICT role in 21st century education and it's challenges.
ICT role in 21st century education and it's challenges.ICT role in 21st century education and it's challenges.
ICT role in 21st century education and it's challenges.
 
Jual Obat Aborsi Hongkong ( Asli No.1 ) 085657271886 Obat Penggugur Kandungan...
Jual Obat Aborsi Hongkong ( Asli No.1 ) 085657271886 Obat Penggugur Kandungan...Jual Obat Aborsi Hongkong ( Asli No.1 ) 085657271886 Obat Penggugur Kandungan...
Jual Obat Aborsi Hongkong ( Asli No.1 ) 085657271886 Obat Penggugur Kandungan...
 
Sociology 101 Demonstration of Learning Exhibit
Sociology 101 Demonstration of Learning ExhibitSociology 101 Demonstration of Learning Exhibit
Sociology 101 Demonstration of Learning Exhibit
 
Asian American Pacific Islander Month DDSD 2024.pptx
Asian American Pacific Islander Month DDSD 2024.pptxAsian American Pacific Islander Month DDSD 2024.pptx
Asian American Pacific Islander Month DDSD 2024.pptx
 
Spatium Project Simulation student brief
Spatium Project Simulation student briefSpatium Project Simulation student brief
Spatium Project Simulation student brief
 
psychiatric nursing HISTORY COLLECTION .docx
psychiatric  nursing HISTORY  COLLECTION  .docxpsychiatric  nursing HISTORY  COLLECTION  .docx
psychiatric nursing HISTORY COLLECTION .docx
 
Understanding Accommodations and Modifications
Understanding  Accommodations and ModificationsUnderstanding  Accommodations and Modifications
Understanding Accommodations and Modifications
 

Income statementsamsung fiscal year is january december. all values

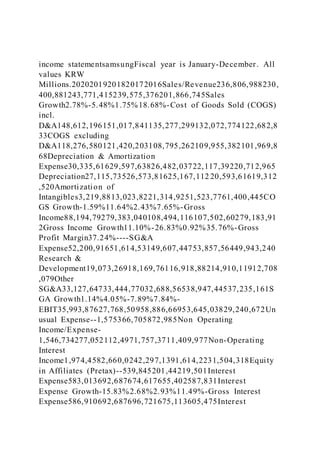
  • 1. income statementsamsungFiscal year is January-December. All values KRW Millions.20202019201820172016Sales/Revenue236,806,988230, 400,881243,771,415239,575,376201,866,745Sales Growth2.78%-5.48%1.75%18.68%-Cost of Goods Sold (COGS) incl. D&A148,612,196151,017,841135,277,299132,072,774122,682,8 33COGS excluding D&A118,276,580121,420,203108,795,262109,955,382101,969,8 68Depreciation & Amortization Expense30,335,61629,597,63826,482,03722,117,39220,712,965 Depreciation27,115,73526,573,81625,167,112 20,593,61619,312 ,520Amortization of Intangibles3,219,8813,023,8221,314,9251,523,7761,400,445CO GS Growth-1.59%11.64%2.43%7.65%-Gross Income88,194,79279,383,040108,494,116107,502,60279,183,91 2Gross Income Growth11.10%-26.83%0.92%35.76%-Gross Profit Margin37.24%----SG&A Expense52,200,91651,614,53149,607,44753,857,56449,943,240 Research & Development19,073,26918,169,76116,918,88214,910,11912,708 ,079Other SG&A33,127,64733,444,77032,688,56538,947,44537,235,161S GA Growth1.14%4.05%-7.89%7.84%- EBIT35,993,87627,768,50958,886,66953,645,03829,240,672Un usual Expense--1,575366,705872,985Non Operating Income/Expense- 1,546,734277,052112,4971,757,3711,409,977Non-Operating Interest Income1,974,4582,660,0242,297,1391,614,2231,504,318Equity in Affiliates (Pretax)--539,845201,44219,501Interest Expense583,013692,687674,617655,402587,831Interest Expense Growth-15.83%2.68%2.93%11.49%-Gross Interest Expense586,910692,687696,721675,113605,475Interest
  • 2. Capitalized3,897-22,10419,71117,644Pretax Income35,838,58730,019,22961,159,95856,195,96730,713,652P retax Income Growth19.39%-50.92%8.83%82.97%-Pretax Margin15.13%----Income Tax9,937,2858,693,32416,815,10114,009,2207,987,560Income Tax - Current Domestic7,700,7885,736,01913,520,33510,943,9335,916,818Inc ome Tax - Deferred Domestic2,236,4972,957,3053,294,7663,065,2872,070,742Equit y in Affiliates506,530412,960---Consolidated Net Income26,407,83221,738,86544,344,85742,186,74722,726,092 Minority Interest Expense316,986233,811453,980842,178310,437Net Income26,090,84621,505,05443,890,87741,344,56922,415,655N et Income Growth21.32%-51.00%6.16%84.45%-Net Margin11.02%----Net Income After Extraordinaries26,090,84621,505,05443,890,87741,344,56922,4 15,655Net Income Available to Common26,090,84621,505,05443,890,87741,344,56922,415,655 EPS (Basic)3841.033165.926460.735990.883155.64EPS (Basic) Growth21.32%-51.00%7.84%89.85%-Basic Shares Outstanding6,7936,7936,7936,9017,103EPS (Diluted)3841.033165.926460.735990.883155.65EPS (Diluted) Growth21.32%-51.00%7.84%89.85%-Diluted Shares Outstanding6,7936,7936,7936,9017,103 EBITDA66,329,49257,3 66,14785,368,70675,762,43049,953,637EBITDA Growth15.62%-32.80%12.68%51.67%-EBITDA Margin28.01%- --- EBIT35,993,87627,768,50958,886,66953,645,03829,240,672113 .770176782.81683791126.543959115.596885684.97958937sour cehttps://www.google.com/search?q=apple+company+wsj&oq=a pple+&aqs=chrome.1.69i59l3j69i57j46i433j69i60l3.7083j0j7&s ourceid=chrome&ie=UTF-8 balance sheetAssetsFiscal year is January-December. All values KRW Millions.202020192018201720165-year trendCash & Short Term
  • 3. Investments124,652,843108,779,703100,939,94383,184,20188,1 82,313Cash Only29,382,57826,885,99930,340,50530,545,13032,132,983Sho rt-Term Investments95,270,26581,893,70470,599,43852,639,07156,049, 330Cash & Short Term Investments Growth000-0-Cash & ST Investments / Total Assets32.96%30.85%29.74%27.57%33.63%Total Accounts Receivable34,569,59739,310,46336,948,46631,804,95627,800,4 08Accounts Receivables, Net3096505800.00%3513134300.00%3386773300.00%2769599 500.00%2427921100.00%Accounts Receivables, Gross31,343,27635,530,41934,470,34228,362,52324,725,603Ba d Debt/Doubtful Accounts-378,218-399,076-602,609-666,528- 446,392Other Receivables3,604,5394,179,1203,080,7334,108,9613,521,197Ac counts Receivable Growth-12.06%6.39%16.17%14.40%- Accounts Receivable Turnover685.00%586.00%660.00%753.00%7.26Inventories32,0 43,14526,766,46428,984,70424,983,35518,353,503Finished Goods10,434,2899,132,7209,870,0547,304,4375,905,339Work in Progress11,818,0909,886,63411,066,5117,113,9015,017,384Ra w Materials9,790,7667,747,1108,048,13910,565,0177,430,780Oth er Current Assets9,789,0249,654,31710,594,5279,289,60310,160,057Prepa id Expenses2,266,1003,833,0535,497,9745,588,8924,942,021Misc ellaneous Current Assets7,522,9245,821,2645,096,5533,700,7115,218,036Total Current Assets201,054,609184,510,947177,467,640149,262,1151 44,496, 281Net Property, Plant & Equipment128,952,892119,825,474115,416,724111,665,64891,4 73,041Property, Plant & Equipment -
  • 4. Gross328,606,313304,075,769279,158,166256,528,604225,172, 654Buildings55,026,36948,839,43945,033,84341,639,04536,474 ,462Land & Improvements9,850,9429,828,3099,346,2859,409,2767,869,679 Machinery & Equipment233,056,501211,416,021206,407,913184,392,999155, 285,378Construction in Progress20,175,91723,930,0199,705,05613,910,74918,773,986O ther Property, Plant & Equipment10,496,58410,061,9818,665,0697,176,5356,769,149A ccumulated Depreciation199,653,421184,250,295163,741,442144,862,95613 3,699,613Buildings20,474,36518,369,81915,687,93313,580,889 12,098,636Land & Improvements78,78653,755---Machinery & Equipment172,062,371159,266,085142,591,682126,477,201116, 983,323Other Property, Plant & Equipment7,037,8996,560,6365,461,8274,804,8664,617,654Tot al Investments and Advances21,854,96417,561,32815,628,29314,661,28212,642,16 0LT Investment - Affiliate Companies8,076,7797,591,6127,313,2066,802,3515,837,884O th er Long-Term Investments13,778,1859,969,7168,315,0877,858,9316,804,276I ntangible Assets18,468,50220,703,50414,891,59814,760,4835,344,020Net Goodwill5,673,6426,250,4395,833,6785,703,1381,343,580Net Other Intangibles12,794,86014,453,0659,057,9209,057,3454,000,440 Other Assets6,468,7818,583,88213,255,2038,620,5265,963,949Deferr ed Charges1,355,502589,8325,572,0354,260,2674,391,922Tangible Other Assets5,113,2797,994,0507,683,1684,360,2591,572,027Total Assets378,235,718352,564,497339,357,244301,752,090262,174, 324Assets - Total - Growth0000-Asset Turnover1----Return On
  • 5. Average Assets7.14%----Liabilities & Shareholders' EquityAll values KRW Millions.202000.00%20192018201720165-year trendST Debt & Current Portion LT Debt17,269,52815,239,55813,620,04616,046,23813,979,606Sho rt Term Debt16,553,42914,393,46813,586,66015,767,61912,746,789Cur rent Portion of Long Term Debt716,099846,09033,386278,6191,232,817Accounts Payable9,739,2228,718,2228,479,9169,083,9076,485,039Accou nts Payable Growth11.71%2.81%-6.65%40.07%-Income Tax Payable4,430,2721,387,7738,720,0507,408,3482,837,353Other Current Liabilities44,165,32938,437,21138,261,49834,636,62131,402,09 7Miscellaneous Current Liabilities44,165,32938,437,21138,261,49834,636,62131,402,09 7Total Current Liabilities75,604,35163,782,76469,081,51067,175,11454,704,09 5Current Ratio2.662.892.572.222.64Quick Ratio2.242.472.151.852.31Cash Ratio1.651.711.461.241.61Long-Term Debt2,947,8533,172,4791,047,0572,767,8071,302,780Long- Term Debt excl. Capitalized Leases948,137975,298996,9352,710,2691,237,653Non- Convertible Debt948,137975,298996,9352,710,2691,237,653Capitalized Lease Obligations--50,12257,53865,127Provision for Risks & Charges1,515,8861,081,8801,167,683854,246531,782Deferred Taxes17,374,87515,674,44612,464,7378,928,7455,038,641Defer red Taxes - Credit18,810,84517,053,80815,162,52311,710,7817,293,514Def erred Taxes - Debit1,435,9701,379,3622,697,7862,782,0362,254,873Other Liabilities3,408,7674,593,1455,145,2944,752,7145,379,120Othe r Liabilities (excl. Deferred Income)3,408,7674,593,1455,145,2944,752,7145,379,120Total Liabilities102,287,70289,684,07691,604,06787,260,66269,211,2
  • 6. 91Total Liabilities / Total Assets27.04%25.44%26.99%28.92%26.40%Common Equity (Total)267,670,331254,915,472240,068,993207,213,416186,424 ,328Common Stock Par/Carry Value897,514897,514897,514897,514897,514Additional Paid-In Capital/Capital Surplus4,403,8934,403,8934,403,8934,403,8934,403,893Retaine d Earnings96,328,64686,260,02691,179,30576,182,00550,079,125 Cumulative Translation Adjustment/Unrealized For. Exch. Gain-10,989,715-5,645,769-8,612,742-9,192,002- 2,930,886Unrealized Gain/Loss Marketable Securities4,975,7562,573,5301,462,2661,879,7741,390,624Othe r Appropriated Reserves-2,712,054-1,957,019-840,775- 364,812142,195,663Unappropriated Reserves174,766,291168,383,297151,579,532139,635,231138,7 21Treasury Stock----6,228,187-9,750,326Common Equity / Total Assets70.77%72.30%70.74%68.67%71.11%Total Shareholders' Equity267,670,331254,915,472240,068,993207,213,416186,424, 328Total Shareholders' Equity / Total Assets70.77%72.30%70.74% 68.67%71.11%Accumulated Minority Interest8,277,6857,964,9497,684,1847,278,0126,538,705Total Equity275,948,016262,880,421247,753,177214,491,428192,963, 033Liabilities & Shareholders' Equity378,235,718352,564,497339,357,244301,752,090262,174, 324Debt ratio=0.27043374580.25437636730.26993402560.28917997550. 2639895850.38214060410.35181888060.38157392110.4211149 2430.371256754626090846215050544389087741344569224156 55roa0.068980386460.060996084920.12933531780.1370150212 0.085499047570.097473806310.084361509450.1828260970.199 52650650.1202399667ie583,013692,687674,617655,402587,831 tieFALSE113.7701767sourcehttps://www.google.com/search?q= apple+company+wsj&oq=apple+&aqs=chrome.1.69i59l3j69i57j
  • 7. 46i433j69i60l3.7083j0j7&sourceid=chrome&ie=UTF-8 cashflow samsungOperating ActivitiesFiscal year is January- December. All values KRW Millions.20202019201820172016Net Income before Extraordinaries26,407,83221,738,86544,344,85742,186,74722,7 26,092Net Income Growth21.48%-50.98%5.12%85.63%- Depreciation, Depletion & Amortization30,335,61629,597,63826,482,03722,117,39220,712 ,965Depreciation and Depletion27,115,73526,573,81625,167,11220,593,61619,312,52 0Amortization of Intangible Assets3,219,8813,023,8221,314,9251,523,7761,400,445Other Funds8,421,137-3,407,8326,129,3358,478,4495,127,540Funds from Operations65,164,58547,928,67176,956,22972,782,58848,566,5 97Changes in Working Capital122,424-2,545,756-9,924,366- 10,620,547-1,180,953Receivables1,741,0161,828,5914,513,604- 7,676,1751,313,276Inventories-7,540,6562,134,632-5,979,475- 8,444,506-2,830,602Accounts Payable3,885,742-1,269,177- 533,6094,006,410200,240Other Accruals5,332,676- 1,707,265501,5361,292,4201,136,440Other Assets/Liabilities- 3,296,354-3,532,537-8,426,422201,304-1,000,307Net Operating Cash Flow65,287,00945,382,91567,031,86362,162,04147,385,644Net Operating Cash Flow Growth43.86%-32.30%7.83%31.18%-Net Operating Cash Flow / Sales27.57%19.70%27.50%25.95%23.47%Investing ActivitiesAll values KRW Millions.20202019201820172016Capital Expenditures- 40,271,813-28,617,670-30,576,923-43,775,974- 25,190,641Capital Expenditures (Fixed Assets)-37,592,034- 25,367,756-29,556,406-42,792,234-24,142,973Capital Expenditures (Other Assets)-2,679,779-3,249,914-1,020,517- 983,740-1,047,668Capital Expenditures Growth- 40.72%6.41%30.15%-73.78%-Capital Expenditures / Sales- 17.01%-12.42%-12.54%-18.27%-12.48%Net Assets from
  • 8. Acquisitions-49,420-1,021,105-99,108-8,754,268-622,050Sale of Fixed Assets & Businesses384,931513,265565,0441,562,858284,106Purchase/S ale of Investments-13,633,932-10,877,650- 22,131,0411,615,560-4,143,738Purchase of Investments- 26,913,224-16,236,889-22,483,388-1,569,896- 12,234,162Sale/Maturity of Investments13,279,2925,359,239352,3473,185,4568,090,424Oth er Uses-57,197--2,289-28,455-Other Sources7,02753,28911,93573326,880Net Investing Cash Flow - 53,620,404-39,949,871-52,232,382-49,379,546-29,645,443Net Investing Cash Flow Growth-34.22%23.52%-5.78%-66.57%-Net Investing Cash Flow / Sales-22.64%-17.34%-21.43%-20.61%- 14.69%Financing ActivitiesAll values KRW Millions.20202019201820172016Cash Dividends Paid - Total- 9,676,760-9,639,202-10,193,695-6,804,297-3,114,742Common Dividends-9,676,760-9,639,202-10,193,695-6,804,297- 3,114,742Change in Capital Stock---875,111-8,350,424- 7,707,938Repurchase of Common & Preferred Stk.---875,111- 8,350,424-7,707,938Issuance/Reduction of Debt, Net1,340,730156,392-4,029,4902,588,1802,139,930Change in Current Debt2,191,186865,792- 2,046,4702,730,6761,351,037Change in Long-Term Debt- 850,452-709,400-1,983,017-142,492788,897Issuance of Long- Term Debt14,495-3,580998,3111,041,743Reduction in Long- Term Debt-864,947-709,400-1,986,597-1,140,803-252,846Net Financing Cash Flow-8,336,026-9,482,810-15,098,293- 12,566,537-8,682,746Net Financing Cash Flow Growth12.09%37.19%-20.15%-44.73%-Net Financing Cash Flow / Sales-3.52%-4.12%-6.19%-5.25%-4.30%Exchange Rate Effect-833,861595,26094,187-1,782,270417,243Net Change in Cash2,496,718-3,454,506-204,625-1,566,3129,474,698Free Cash Flow27,694,97520,015,15937,475,45719,369,80723,242,671Fre e Cash Flow Growth38.37%-46.59%93.47%-16.66%-Free Cash Flow Yield3.27%----
  • 9. sourcehttps://www.google.com/search?q=apple+company+wsj& oq=apple+&aqs=chrome.1.69i59l3j69i57j46i433j69i60l3.7083j0 j7&sourceid=chrome&ie=UTF-8 is-appleApple Inc.Consolidated Income StatementUS$ in millions12 months ended:Sep 26, 2020Sep 28, 2019Sep 29, 2018Sep 30, 2017Sep 24, 2016Products220,747213,883225,847196,534— Services53,76846,29139,74832,700—Net sales (legacy)——— —215,639Net sales274,515260,174265,595229,234215,639Products(151,286)( 144,996)(148,164)(126,337)— Services(18,273)(16,786)(15,592)(14,711)—Cost of sales (legacy)————(131,376)Cost of sales(169,559)(161,782)(163,756)(141,048)(131,376)Gross margin104,95698,392101,83988,18684,263Research and development(18,752)(16,217)(14,236)(11,581)(10,045)Selling, general and administrative(19,916)(18,245)(16,705)(15,261)(14,194)Operati ng expenses(38,668)(34,462)(30,941)(26,842)(24,239)Operating income66,28863,93070,89861,34460,024Interest and dividend income3,7634,9615,6865,2013,999Interest expense(2,873)(3,576)(3,240)(2,323)(1,456)Other income (expense), net(87)422(441)(133)(1,195)Other income (expense), net8031,8072,0052,7451,348Income before provision for income taxes67,09165,73772,90364,08961,372Provision for income taxes(9,680)(10,481)(13,372)(15,738)(15,685)Net income57,41155,25659,53148,35145,687Based on: 10-K (filing date: 2020-10-30), 10-K (filing date: 2019-10-31), 10-K (filing date: 2018-11-05), 10-K (filing date: 2017-11-03), 10-K (filing date: 2016-10-26), 10-K (filing date: 2015-10-28).-23.35224504-18.38282998- 22.50092593-27.58889367- 42.1510989sourcehttps://www.google.com/search?q=apple+com pany+wsj&oq=apple+&aqs=chrome.1.69i59l3j69i57j46i433j69i
  • 10. 60l3.7083j0j7&sourceid=chrome&ie=UTF-8 bs-appleAssetsFiscal year is October-September. All values USD Millions.202020192018201720165-year trendCash & Short Term Investments90,979100,58066,30174,18167,155Cash Only19,98028,12419,65814,51612,267Short-Term Investments70,99972,45646,64359,66554,888Cash & Short Term Investments Growth-9.55%51.70%-10.62%10.46%-Cash & ST Investments / Total Assets28.09%29.71%18.13%19.76%20.88%Total Accounts Receivable37,44545,80448,99535,67329,299Accounts Receivables, Net16,12022,92623,18617,87415,754Accounts Receivables, Gross16,12022,92623,18617,93215,807Bad Debt/Doubtful Accounts----58-53Other Receivables21,32522,87825,80917,79913,545Accounts Receivable Growth-18.25%-6.51%37.34%21.76%-Accounts Receivable Turnover7.325.685.436.417.31Inventories4,0614,1063,9564,855 2,132Finished Goods4,0614,1063,9564,8552,132Other Current Assets11,22812,32912,08713,9368,283Miscellaneous Current Assets11,22812,32912,08713,9368,283Total Current Assets143,713162,819131,339128,645106,869Net Property, Plant & Equipment45,33637,37841,30433,78327,010Property, Plant & Equipment - Gross112,09695,95790,40375,07661,245Buildings17,95217,085 16,21613,58710,185Machinery & Equipment75,29169,79765,98254,21044,543Other Property, Plant & Equipment10,2839,0758,2057,2796,517Accumulated Depreciation66,76058,57949,09941,29334,235Total Investments and Advances102,624106,698170,799194,714170,430Other Long-Term Investments102,624106,698170,799194,714170,430Intangible Assets---8,0158,620Net Goodwill---5,7175,414Net Other Intangibles---2,2983,206Other Assets32,21531,62122,28310,1628,757Tangible Other Assets32,21531,62122,28310,1628,757Total Assets323,888338,516365,725375,319321,686Assets - Total -
  • 11. Growth-4.32%-7.44%-2.56%16.67%-Asset Turnover0.83---- Return On Average Assets17.33%----Liabilities & Shareholders' EquityAll values USD Millions.202020192018201720165-year trendST Debt & Current Portion LT Debt15,22916,24020,74818,47311,605Short Term Debt6,4325,98011,96411,9778,105Current Portion of Long Term Debt8,79710,2608,7846,4963,500Accounts Payable42,29646,23655,88849,04937,294Accounts Payable Growth-8.52%-17.27%13.94%31.52%-Other Current Liabilities47,86743,24240,23033,29230,107Miscellaneous Current Liabilities47,86743,24240,23033,29230,107Total Current Liabilities105,392105,718116,866100,81479,006Current Ratio1.361.541.121.281.35Quick Ratio1.331.51.091.231.33Cash Ratio0.860.950.570.740.85Long-Term Debt107,04991,80793,73597,20775,427Long-Term Debt excl. Capitalized Leases98,66791,80793,73597,20775,427Non- Convertible Debt98,66791,80793,73597,20775,427Capitalized Lease Obligations637----Provision for Risks & Charges28,17029,54533,589--Deferred Taxes- 16,91911,52039,91134,719Deferred Taxes - Credit- 16,91911,52039,91134,719Other Liabilities17,9384,0392,8683,3404,285Other Liabilities (excl. Deferred Income)17,9384,039715041,355Deferred Income-- 2,7972,8362,930Total Liabilities258,549248,028258,578241,272193,437Total Liabilities / Total Assets79.83%73.27%70.70%64.28%60.13%Common Equity (Total)65,33990,488107,147134,047128,249Common Stock Par/Carry Value50,77945,17440,20135,86731,251Retained Earnings14,96645,89870,40098,33096,364Cumulative Translation Adjustment/Unrealized For. Exch. Gain-1,375- 1,463-1,055-354-578Unrealized Gain/Loss Marketable Securities1,846707-3,2093281,174Other Appropriated Reserves- 877172810-12438Common Equity / Total Assets20.17%26.73%29.30%35.72%39.87%Total Shareholders'
  • 12. Equity65,33990,488107,147134,047128,249Total Shareholders' Equity / Total Assets20.17%26.73%29.30%35.72%39.87%Total Equity65,33990,488107,147134,047128,249Liabilities & Shareholders' Equity323,888338,516365,725375,319321,686sourcehttps://ww w.google.com/search?q=apple+company+wsj&oq=apple+&aqs= chrome.1.69i59l3j69i57j46i433j69i60l3.7083j0j7&sourceid=chr ome&ie=UTF-8 cs-appleOperating ActivitiesFiscal year is October-September. All values USD Millions.202020192018201720165-year trendNet Income before Extraordinaries57,41155,25659,53148,35145,687Net Income Growth3.90%-7.18%23.12%5.83%-Depreciation, Depletion & Amortization11,05612,54710,90310,15710,505Depreciation and Depletion11,05612,54710,903--Deferred Taxes & Investment Tax Credit-215-340-32,5905,9664,938Deferred Taxes-215-340- 32,5905,9664,938Other Funds6,7325,4164,8964,6744,210Funds from Operations74,98472,87942,74069,14865,340Changes in Working Capital5,690-3,48834,694- 5,550484Receivables8,4703,176-13,332-6,3471,044Inventories- 127-289828-2,723217Accounts Payable-4,062- 1,9239,1759,6181,791Other Assets/Liabilities 1,409- 4,45238,023-6,098-2,568Net Operating Cash Flow80,67469,39177,43463,59865,824Net Operating Cash Flow Growth16.26%-10.39%21.76%-3.38%-Net Operating Cash Flow / Sales29.43%26.69%29.13%27.82%30.73%Investing ActivitiesAll values USD Millions.202020192018201720165- year trendCapital Expenditures-7,309-10,495-13,313-12,795- 13,548Capital Expenditures (Fixed Assets)-7,309-10,495- 13,313-12,451-12,734Capital Expenditures (Other Assets)---- 344-814Capital Expenditures Growth30.36%21.17%- 4.05%5.56%-Capital Expenditures / Sales-2.67%-4.04%-5.01%- 5.60%-6.32%Net Assets from Acquisitions-1,524-624-721-329- 297Purchase/Sale of Investments5,33558,09330,845-33,147- 30,634Purchase of Investments-115,148-40,631-73,227- 159,486-142,428Sale/Maturity of
  • 13. Investments120,48398,724104,072126,339111,794Other Uses- 791-1,078-745-395-1,498Other Sources---220-Net Investing Cash Flow-4,28945,89616,066-46,446-45,977Net Investing Cash Flow Growth-109.35%185.67%134.59%-1.02%-Net Investing Cash Flow / Sales-1.56%17.65%6.04%-20.32%- 21.46%Financing ActivitiesAll values USD Millions.202020192018201720165-year trendCash Dividends Paid - Total-14,081-14,119-13,712-12,769-12,150Common Dividends-14,081-14,119-13,712-12,769-12,150Change in Capital Stock-71,478-66,116-72,069-32,345-29,227Repurchase of Common & Preferred Stk.-72,358-66,897-72,738-32,900- 29,722Sale of Common & Preferred Stock880781669555495Proceeds from Stock Options880781669555495Issuance/Reduction of Debt, Net2,499-7,81943229,01422,057Change in Current Debt-963- 5,977-373,852-397Change in Long-Term Debt3,462- 1,84246925,16222,454Issuance of Long-Term Debt16,0916,9636,96928,66224,954Reduction in Long-Term Debt-12,629-8,805-6,500-3,500-2,500Other Funds-3,760-2,922- 2,527-1,247-1,163Other Uses-3,760-2,922-2,527-1,874- 1,570Other Sources---627407Net Financing Cash Flow-86,820- 90,976-87,876-17,347-20,483Net Financing Cash Flow Growth4.57%-3.53%-406.58%15.31%-Net Financing Cash Flow / Sales-31.67%-35.00%-33.06%-7.59%-9.56%Net Change in Cash-10,43524,3115,624-195-636Free Cash Flow73,36558,89664,12151,14753,090Free Cash Flow Growth24.57%-8.15%25.37%-3.66%-Free Cash Flow Yield3.01%---- sourcehttps://www.google.com/search?q=apple+company+wsj& oq=apple+&aqs=chrome.1.69i59l3j69i57j46i433j69i60l3.7083j0 j7&sourceid=chrome&ie=UTF-8 ratiosFinancial diagnostic categoriesyrSamsungApple1.) Liquidity of short-term assets-Current ratio20162.641.352720172.221.276120182.571.132920192.891. 540120202.661.3636-Cash ratio20161.610.8520171.240.7420181.460.5720191.710.952020
  • 14. 1.650.86-Quick ratio20162.311.3320171.851.2320182.151.0920192.471.520202. 241.332.) Long-term debt-paying ability-Debt ratio201626.460.13201728.9264.28201826.9970.7201925.4473. 27202027.0479.83-Debt-equity ratio20160.370.678620170.420.86320180.381.068520190.351.1 9420200.381.7208-Times interest earned201685-422017116- 282018127-23201983-182020114-233.) Profitability-Net income/sales (profit margin)2016021.18682017021.09242018022.41422019021.2381 202011.0220.9136-Net income/assets (ROA)20160.08514.202420170.13712.882620180.12916.277520 190.06116.32320200.06917.7256-Net income/shareholder equity (ROE)20160.1238.190620170.236.070220180.18355.560120190 .08461.064520200.09787.86644.) Asset utilization/ management efficiency-Total asset turnover201600.6703201700.6108201800.7262201900.7686202 00.650.8476-Inventory turnover measures201661.62161.621201729.052129.0521201841.394341. 3943201939.401439.4014202041.75341.753-Accounts receivable turnover20167.267.359920177.536.42620186.65.420920195.865 .680220206.857.33125.) Market measures-Price/earnings ratio20160.560.1520170.260.5920180.150.8720190.250.562020 0.470.25-Earnings per common share201600201789.8510.8420187.8429.322019-51- 0.17202021.3210.23-Dividend payout20160.7634.620170.82.3320180.60.2320190.2331.420200 .20.5 Business Research Methods, 14e/Schindler 1
  • 15. >cases State Farm, the nation’s largest auto insurer, distributed a list of the 10 most dangerous intersections in the United States based on crashes resulting in claims by its policyholders. What started as a study to reduce risk turned into an ongoing study that directs a major public relations effort: State Farm provides funds for communities to further research their dangerous intersections and initiate improve- ments based on the research. This case tells you how the State Farm Dangerous Intersections initiative got started and how it is done. www.statefarm.com >Abstract >The Scenario State Farm Insurance has a rich history of proactive safety involvement in auto and appliance design to reduce injury and property loss. In June 2001, State Farm Insurance, Inc., released the second report in its Dangerous Intersection reporting series. State Farm modeled its program after an initiative by the Insurance Corporation of British Columbia, Canada (ICBC), and the American Automobile Association of Michigan (AAA) to help position the nation’s largest auto insurer as the most safety- conscious insurer. ICBC had patterned its program on an earlier effort in Victoria, Australia. AAA, in turn, benchmarked its program on the ICBC program. AAA
  • 16. invited State Farm to help fund one of its intersection studies. State Farm saw this as an opportunity to expand its effort into a nationwide campaign in 1999. “The 2001 study is part of a larger effort focused on loss prevention and improving the safety of intersections around the U.S.A.,” shared State Farm research engineer John Nepomuceno. State Farm has allocated significant resources as well as funds to the initiative. Since its inception, every city with an intersection on the overall list of dangerous intersections is eligible to apply for a $20,000 grant to defray the cost of a comprehensive traffic engineering study of the intersection. Additionally, each city named to the national top 10 dangerous intersection list is eligible for a grant of $100,000 per intersection to defray some of the cost of making improvements. All totaled, State Farm offered $4.44 million to the safety initiative in its first year. Due to its large market share, State Farm is the only U.S. insurer in a position to mine its databases for the requisite information on accidents to come up with a viable U.S. list. But it found that although it had the interest to do so, its data warehouse did not have sufficient information to tally accident rates for intersections. To rectify this, in 1998 State Farm included a location field as part of the data that its claims adjusters regularly complete. This location information, in open-text format, indicates whether the accident took place in an intersection or as part of
  • 17. an incident related to an intersection accident, and identifies the intersection. Following the 1999 study, the fields for identifying intersections were further refined. In the first study using 1998 data (reported in June 1999) as well as the 2001 State Farm: Dangerous Intersections Used with permission of Pamela S. Schindler ©2001. Business Research Methods, 14e/Schindler 2 study, State Farm looked at accidents involving only intersecting roads. They excluded any accident that occurred at the intersection of a road and a highway access or egress ramp. State Farm also looked only at accidents where the State Farm–insured driver was at fault. Because of the study’s focus on road safety engineering, the first study ignored accident severity and made no attempt to isolate demographic (age or gender of driver, driving record, etc.) or geographic (weather conditions, population of area, etc.) factors related to the accident. It also looked only at State Farm’s own internal
  • 18. incident reports, not at any public records involving traffic patterns or volume or police incident reports. Based on industry market share information, State Farm was able to estimate the total number of crashes at a given intersection. “There was good reason to exclude police reports and traffic counts,” explained Nepomuceno. “The reporting threshold for police filing reports on accidents differs widely from jurisdiction to jurisdiction. Some will only fill out reports when personal injury or criminal behavior is involved. Others will fill them out only when a vehicle is damaged to the degree that it needs to be towed from the scene. Still others fill out such reports on every incident. Traffic volume reports are often prepared infrequently and often by independent sources. Not only may the data quality be questionable, but the time period in which the data was collected may not match our 1998 incident reports in every city involved. Also, when traffic volumes are factored in, low volume roads with relatively few crashes are often deprioritized. Now that we’re through with the 2001 study, we are asking ourselves if intersection volume should be factored in, and if so, how it can be included without significantly increasing our effort in data processing.” In the 1998 study, State Farm identified 172 dangerous intersections. The top 10 most dangerous intersections in the United States were released publicly
  • 19. (www.statefarm. com). Public affairs staff for each state could request that up to 10 intersections be identified for their state. “This was usually determined by the resources that our local public affairs staff were willing to put toward the program,” shared Nepomuceno. “Each state had to recognize a top 10 national intersection, but they could request that no more be released or that up to 10 intersections within their state be released.” As of August 2001, 97 cities (56.4 percent) had applied for State Farm grants. “While some in the media claimed we had ‘hit a home run’ with the program, we quickly learned that there was a lot more at stake than we had anticipated in generating goodwill with transportation engineers,” indicated Nepomuceno. “This is, after all, a traffic safety program and we would not achieve that goal without having the cooperation of the traffic and transportation engineering community. First, while initially they lauded us for the attention our listing brought to traffic concerns, we and they soon discovered that the spotlight generated demand for immediate solutions, solutions that they often didn’t have budgets to implement. Also, from their perspective, not all accidents are the same; locations with accidents that result in injuries and death should be given more attention. Some jurisdictions were upset that we didn’t consider intersection volume and we didn’t include accident rate
  • 20. data.1 The fact that the State Farm grants were intended to study the intersection State Farm: Dangerous Intersections Business Research Methods, 14e/Schindler 3 more completely wasn’t always seen as a solution to their immediate problems.” To include accident severity, State Farm needed a measurement system for classifying accidents. For the 2001 study, which used 1999 and 2000 accident data, State Farm calculated a median property damage accident payout (approximately $1,700). Incidents requiring payout of more than the median amount were classified as “high severity”; those requiring less, “low severity.” Additionally, State Farm chose to classify each accident using a multipoint scale. Zero was assigned to “no property damage, no personal injury” incidents and a higher number was assigned to “High property damage, personal injury” incidents, with numbers in between assigned to levels of property damage and personal injury (see Exhibit SF 1–1). Accident scores were summed to create an aggregate danger index for each intersection. Each intersection was then weighted by dividing the danger index by State Farm’s market
  • 21. share in the area. Of the 224 intersections identified, the top 10 were released to the national media. Each of those 224 is now eligible for the $20,000 grant to study the intersection to identify specific improvements; the top 10 are also eligible for $100,000 grants for improvements. In this second round, State Farm has committed $5.48 million to the safety program. State Farm is making plans to track the success of the Dangerous Intersection program. Once cities notify them of the completion of an intersection’s improvements, State Farm will start tracking accidents for that intersection for a period of one year. The first post-improvement evaluation study is expected in 2002. Additionally, State Farm is taking steps to learn from the characteristics of the dangerous intersections. Each grant application for an affected city’s study of a dangerous intersection must include: • Collection and analysis of police report data. • An engineer’s “geometric review”2of the intersection. • A capacity profile of the intersection. • A traffic conflict study.3 • A benefit-cost analysis. • A schedule of improvements (short-term, intermediate-term, and long-term).4 State Farm plans to use the new data to identify patterns of problems. This may lead to a model of desired intersection traits against which improvement plans can
  • 22. be assessed, further increasing the effectiveness of the loss prevention program and making life a little easier for the transportation engineers with whom they must partner to achieve safety success. Exhibit SF 1–1 Danger Codes No Personal Injury With Personal Injury No property damage 0 Y Low property damage 1 1 + Y High property damage X X + Y State Farm: Dangerous Intersections Business Research Methods, 14e/Schindler 4 1 Identify the various constructs and concepts involved in the study. 2 What hypothesis might drive the research of one of the cities on the top 10 dangerous intersection list? 3 Evaluate the methodology for State Farm’s research. 4 If you were State Farm, how would you address the concerns of transpor- tation engineers? 5 If you were State Farm, would you use traffic volume counts as part of the
  • 23. 2003 study? What concerns, other than those expressed by Nepomuceno, do you have? >>>>>Discussion >>>>>Sources >Notes 1 Accident rate is calculated by dividing the number of accidents in a given period by the total traffic volume over the same period. 2 The intersection geometry or physical layout of the intersection can play an important role in influencing driver behavior at intersections. For example, a curve on the approach to an intersection may impede the sight distance to a traffic signal, preventing drivers from stopping in time. Or, a driver approaching two signalized intersections very closely spaced may see the traffic signals at both intersections and become confused about which traffic signal to obey. 3 A traffic conflict study is an observation study of traffic conflicts that do not necessarily end in an accident but have the potential to do so. Recording and studying observations of driver behavior is expected to help traffic engineers understand the same problems that result in collisions. Some examples of conflicts are the sound of sharply applied breaks; sudden, unsignaled lane changes; or drivers hitting their horns.
  • 24. 4 Short-term improvements might include sign changes, changes in lane markings, or signal- timing changes. Most short-term improvements can be implemented in less than two years. Intermediate-term improvements might involve lane widening, the addition of turn lanes, etc., and be accomplished within 2–5 years. Examples of long- term improvements include grade separation of the intersecting roads and can take 5–10 years to implement. This case is based on information provided by John Nepomuceno in interviews that took place on August 9, 2001, and September 13, 2001. Other sources include: “Miami Area Intersection Tops State Farm List of Most Dangerous in the United States,” State Farm press release, June 27, 2001 (http://www.statefarm. com/media/release/danger00.htm); “Research” (http:// www.statefarm.com/media/methods.htm); and “State Farm 1999 Dangerous Intersection National Status List” (http://www.statefarm.com/media/statustop.htm); and “State Farm’s Dangerous Intersection Initiative,” Institute of Transportation Engineers press release, June 27, 2001 (http://www.ite.org/press_release.htm). State Farm: Dangerous Intersections Criteria Ratings Points Content -
  • 25. Part I - Initial Post 9 to >8.0 pts Advanced Author responded to all case study questions by posted deadlines. Insightful throughout. Completely developed all relevant information. Critical issues and key areas that supported each question were clearly identified, analyzed, and supported. 8 to >7.0 pts Proficient Author responded to all case study questions by posted deadlines. Specific, solid. Less carefully developed. Some insights. Critical issues and key areas that supported each question were partially identified, analyzed, and supported. 7 to >0.0 pts
  • 26. Developing Author responded to at least 4 questions by posted deadlines. Vague, obvious, underdeveloped, or too broad. One or more main issues not identified. Limited evidence of critical thinking. Critical issues and key areas that supported each question were not clearly identified, analyzed, and supported. 0 pts Not Present 9 pts Content - Part I - Direct Application of Scholarly Research & Integration of Biblical Principles 9 to >8.0 pts
  • 27. Advanced Author accurately applied 5 or more scholarly (peer reviewed) sources to the discussion. Author accurately applied at least 1 scholarly (peer-reviewed) source to each question. Author accurately applied at least 1 scriptural/Biblical principles in each question response. 8 to >7.0 pts Proficient Author accurately applied at least 4 scholarly (peer reviewed) sources to the discussion. Author accurately applied at least 1 scholarly (peer-reviewed) source to each question. Author accurately applied at least 1 scriptural/Biblical principle in each question response. 7 to >0.0 pts Developing
  • 28. Author accurately applied 1 -3 scholarly (peer reviewed) sources to the discussion. Author accurately applied at least 1 scholarly (peer-reviewed) source to some questions. Author accurately applied at least 1 scriptural/Biblical principle in each question response. 0 pts Not Present 9 pts Content - Part I - Mechanics, APA Style & Word Count 7 to >6.0 pts Advanced Correct spelling and grammar are used throughout the essay. There are 0–1 errors in grammar or spelling that distract the reader from
  • 29. the content. There are 0–1 minor errors in APA format in the required items: citations and references. The word count of 800-1000 words is met. 6 to >5.0 pts Proficient There are 2-3 errors in grammar or spelling that distract the reader from the content. There are 2–3 minor errors in APA format in the required items. The word count of at least 750 words is met. 5 to >0.0 pts Developing There are 4-5 errors in grammar or spelling that distract the reader from the content. There are more than 3 errors in APA format in the required items. The word count of 500–749 words. 0 pts
  • 30. Not Present 7 pts Discussion Grading Rubric | BUSI600_C01_202140 Criteria Ratings Points Content - Part II - Two Individual Response Posts 9 to >8.0 pts Advanced Author responded to at least 2 different peers by posted deadlines. Insightful throughout. Completely developed all relevant information. Critical issues and key areas that supported each question were clearly identified, analyzed, and supported. Offer at least 1 strength and 1 weakness for each reply.
  • 31. 8 to >7.0 pts Proficient Author responded to at least 2 different peers by posted deadlines. Specific, solid. Less carefully developed. Some insights. Critical issues and key areas that supported each question were partially identified, analyzed, and supported. Offer at least 1 strength and 1 weakness for each reply. 7 to >0.0 pts Developing Author responded to at least 1 different peer by posted deadlines. Vague, obvious, underdeveloped, or too broad. One or more main issues not identified. Limited evidence of critical thinking. Critical issues and key areas that supported each question were not clearly identified, analyzed, and supported. Offer at least 1 strength and 1 weakness for one reply.
  • 32. 0 pts Not Present 9 pts Content - Part II - Direct Application of Scholarly Research & Integration of Biblical Principles 9 to >8.0 pts Advanced Author accurately applied 2 or more scholarly (peer reviewed) sources to each peer response. Author accurately applied at least 1 scriptural/Biblical principles in each question response (no more than 10% of the total response).
  • 33. 8 to >7.0 pts Proficient Author accurately applied at least 2 scholarly (peer reviewed) sources to each peer response. Author accurately applied at least 1 scriptural/Biblical principle in each question response (no more than 10% of the total response). 7 to >0.0 pts Developing Author accurately applied 1 or 2 scholarly (peer reviewed) sources to some peer response. Author accurately applied at least 1 scriptural/Biblical principle in each question response (no more than 10% of the total response). 0 pts Not Present
  • 34. 9 pts Content - Part II - Mechanics, APA Style & Word Count 7 to >6.0 pts Advanced Correct spelling and grammar are used throughout the essay. There are 0–1 errors in grammar or spelling that distract the reader from the content. There are 0–1 minor errors in APA format in the required items: citations and references. The word count of 450–600 words is met for each response. 6 to >5.0 pts Proficient There are 2-3 errors in grammar or spelling that distract the reader from the content. There are 2–3 minor errors in APA
  • 35. format in the required items. The word count of at least 400 words is met for each response. 5 to >0.0 pts Developing There are 4-5 errors in grammar or spelling that distract the reader from the content. There are more than 3 errors in APA format in the required items. The word count of 300 - 399 words is met for each response. 0 pts Not Present 7 pts Total Points: 50 Discussion Grading Rubric | BUSI600_C01_202140