SlideShare a Scribd company logo
1 of 17
Main ComputationExpectedStandardRisk
PremiumReturn/MonDeviationE(ri)siEi=E(ri)-rfRiskfree Rate
(rf)0.23%0%Risky Asset 12.10%13%1.87%Risky Asset
21.30%8%1.07%Correlation (1,2)20%Risk
Aversion2OutputsRisky
AssetCapitalUtilityOptimalProportionOpp
SetAllocationIndifferenceCompletein Risky(x-
axis)CurveLineCurvePortfolioAsset 1
orStandardExpectedExpectedExpectedExpectedOpt
RiskyDeviationRet / MonRet / MonRet / MonRet / MonOpp Set
Curve-500.0%72.7%-2.7%Opp Set Curve-
150.0%25.0%0.1%Opp Set Curve-80.0%16.0%0.7%Opp Set
Curve-70.0%14.8%0.7%Opp Set Curve-60.0%13.6%0.8%Opp
Set Curve-50.0%12.5%0.9%Opp Set Curve-
40.0%11.4%1.0%Opp Set Curve-30.0%10.4%1.1%Opp Set
Curve-20.0%9.4%1.1%Opp Set Curve-10.0%8.6%1.2%Opp Set
Curve0.0%8.0%1.3%Opp Set Curve10.0%7.6%1.4%Opp Set
Curve20.0%7.4%1.5%Opp Set Curve30.0%7.4%1.5%Opp Set
Curve40.0%7.8%1.6%Opp Set Curve50.0%8.3%1.7%Opp Set
Curve60.0%9.0%1.8%Opp Set Curve70.0%9.9%1.9%Opp Set
Curve80.0%10.8%1.9%Opp Set Curve90.0%11.9%2.0%Opp Set
Curve100.0%13.0%2.1%Opp Set Curve110.0%14.2%2.2%Opp
Set Curve120.0%15.4%2.3%Opp Set
Curve250.0%32.3%3.3%Opp Set Curve750.0%100.9%7.3%Opt
Risky Port40.7%7.8%1.6%Cap Alloc Line0.0%0.0%0.2%Cap
Alloc Line1000.0%77.8%14.2%Indifference
Curve0.0%0.63%Indifference Curve1.0%0.65%Indifference
Curve2.0%0.71%Indifference Curve3.0%0.81%Indifference
Curve4.0%0.95%Indifference Curve5.0%1.13%Indifference
Curve6.0%1.35%Indifference Curve7.0%1.61%Indifference
Curve8.0%1.91%Indifference Curve9.0%2.25%Indifference
Curve10.0%2.63%Indifference Curve11.0%3.05%Indifference
Curve12.0%3.51%Indifference Curve13.0%4.01%Indifference
Curve14.0%4.55%Indifference Curve15.0%5.13%Opt Comp
Port4.5%1.0%Constant Utility Value0.0063Risk aversionWeight
TPWeight RFExp. ReturnStd.
dev.Utility2.00.57630.42370.01030.04480.0063
Sheet1Risky Asset 1Risky Asset 2MonthBarrickIBMTreasury
BillsDec 2009-7.75%3.60%1.137860.158Nov
200919.37%5.22%1.202270.148Oct 2009-
5.20%0.84%1.282780.148Sep
20099.22%1.32%1.121760.178Aug 2009-
0.57%0.57%0.944640.178Jul
20094.02%12.94%0.971480.202Jun 2009-11.90%-
1.75%1.073460.311May 200931.55%3.51%1.014420.316Apr
2009-10.24%6.52%0.976160.38Mar
20097.35%5.28%0.993190.602Feb 2009-
19.45%0.96%0.936430.587Jan
20091.96%8.90%1.03660.612Dec
200824.81%3.14%0.944450.671Nov 200830.43%-
11.69%0.898390.706Oct 2008-38.11%-20.51%1.013560.706Sep
20085.79%-3.92%0.950210.805Aug 2008-17.99%-
4.49%0.921410.795Jul 2008-6.92%7.97%0.852310.735Jun
200812.93%-8.42%0.722740.665May
20084.84%7.65%0.573010.575Apr 2008-
11.12%4.83%0.48950.525Mar 2008-
16.36%1.12%0.564360.565Feb
20080.99%6.68%0.498140.465Jan 200822.33%-
0.92%0.483750.44Dec 20073.80%2.78%0.604680.53Nov 2007-
7.86%-9.08%0.719860.475Oct 20079.56%-
1.43%0.662270.39Sep 200723.86%0.95%0.581650.34Aug 2007-
1.16%5.82%0.547090.28Jul 200713.18%5.13%0.613320.345Jun
2007-0.21%-1.27%0.570130.31May
20074.16%4.69%0.619080.3Apr 2007-
1.54%8.43%0.702580.35Mar 2007-4.42%1.42%0.642110.36Feb
20070.84%-5.96%0.613320.425Jan 2007-
3.52%2.06%0.656510.435Dec 2006-2.35%5.69%0.68530.51Nov
20061.77%-0.12%0.650750.435Oct
20060.91%12.68%0.665150.405Sep 2006-
8.24%1.20%0.549970.44Aug 20068.70%4.99%0.561490.46Jul
20064.05%0.77%0.538450.435Jun 2006-3.30%-
3.85%0.498140.445May 20060.79%-2.60%0.477990.405Apr
200611.89%-0.16%0.659390.415Mar 2006-
0.48%2.78%0.771690.435Feb 2006-13.00%-
1.06%0.757290.44Jan 200612.88%-1.09%0.791840.425Dec
20054.74%-7.54%0.555730.64Nov
20055.82%8.82%0.618950.69Oct 2005-
13.08%2.07%0.633480.605Sep 200510.79%-
0.50%0.610240.48Aug 20057.02%-3.16%0.630580.555Jul 2005-
2.12%12.48%0.645110.485Jun 20058.87%-
1.79%0.682880.51May 20053.49%-0.82%0.650920.54Apr 2005-
6.84%-16.42%0.569550.575Mar 2005-3.78%-
1.30%0.473660.58Feb 200513.91%-0.71%0.386480.505Jan
2005-9.74%-5.23%0.317320.48Dec 2004-
1.50%4.61%0.317320.48Nov 20049.73%5.20%Oct
20046.99%4.68%Sep 20045.20%1.24%Aug 20044.60%-
2.53%Jul 2004-3.19%-1.23%Jun 2004-4.45%-0.50%May
20048.06%0.68%Apr 2004-19.13%-4.00%Mar 200416.28%-
4.83%Feb 20043.81%-2.59%Jan 2004-13.25%7.07%Dec
20031.66%2.36%Nov 200315.31%1.36%Oct
20033.40%1.30%Sep 2003-6.83%7.71%Aug
200318.05%1.13%Jul 2003-4.36%-1.52%Jun 20032.40%-
6.29%May 200317.66%3.89%Apr 2003-3.92%8.25%Mar 2003-
3.47%0.62%Feb 2003-2.01%-0.13%Jan 20036.75%0.90%Dec
20025.79%-10.84%Nov 2002-2.65%10.30%Oct 2002-
3.09%35.38%Sep 2002-3.24%-22.65%Aug 20024.90%7.29%Jul
2002-19.33%-2.22%Jun 2002-12.89%-10.50%May 20029.17%-
3.77%Apr 20028.14%-19.46%Mar 20022.83%5.99%Feb
20025.56%-8.93%Jan 20027.21%-10.81%Dec
20015.42%4.65%Nov 2001-2.25%7.09%Oct 2001-
10.14%17.83%Sep 20018.30%-8.23%Aug 20017.59%-4.87%Jul
2001-1.72%-6.89%Jun 2001-8.18%1.07%May 20011.03%-
2.78%Apr 200115.05%19.71%Mar 2001-11.79%-3.72%Feb
20014.72%-10.69%Jan 2001-5.56%31.76%Dec 20009.20%-
9.09%Nov 200012.97%-4.94%Oct 2000-12.30%-12.44%Sep
2000-4.31%-14.77%Aug 20000.00%17.51%Jul 2000-
12.37%2.62%Jun 20000.34%2.04%May 20008.46%-3.58%Apr
20007.17%-5.51%Mar 2000-3.83%14.84%Feb 2000-0.38%-
8.36%Jan 2000-7.42%4.06%Average ReturnStandard Deviation
Chart 1
Risky Opportunity Set, Capital Allocation Line, and
Indifference Curve
Risk Free
0 2.3E-3 Risky Asset 1
0.13 2.1000000000000001E-2 Risky Asset 2
0.08 1.2999999999999999E-2 Complete Portfolio
4.4841306731903098E-2 1.0342971157698472E-2 Optimum
Portfolio
7.7808710077419324E-2 1.6256176939981118E-2 Portfolio
Frontier 0.72670489196096655 0.24984995497297974
0.15987995496621835 0.14773828210724529
0.13592056503708333 0.12451907484397723
0.11365913953571882 0.10351135203445079
9.4305885288246918E-2 8.6344658201882932E-2
7.9999999999999946E-2 7.5679587736720635E-2
7.3740084079149254E-2 7.4368003872633287E-2
7.7500967735893461E-2 8.2855295545909438E-2
9.0035548535009224E-2 9.8643803657401621E-2
0.10834020491027328 0.11885873968707561 0.13
0.14161708936424308 0.15360208331920502
0.3231485726411305 1.0090713552569015 -
2.700000000000001E-2 1.0000000000000009E-3
6.5999999999999982E-3 7.3999999999999986E-3
8.199999999999999E-3 8.9999999999999993E-3
9.7999999999999962E-3 1.0599999999999998E-2
1.1400000000000007E-2 1.2200000000000009E-2
1.3000000000000008E-2 1.3800000000000007E-2 1.46E-2
1.5399999999999999E-2 1.6199999999999999E-2
1.7000000000000001E-2 1.78E-2
1.8599999999999998E-2 1.9400000000000001E-2
2.0199999999999999E-2 2.1000000000000001E-2 2.18E-2
2.2600000000000002E-2 3.3000000000000002E-2
7.3000000000000009E-2 CML0 0.77808710077419319
2.3E-3 0.14186176939981118 Indifference Curve 0
0.01 0.02 0.03 0.04 0.05 0.06 7.0000000000000007E-2
0.08 0.09 0.1 0.11 0.12 0.13 0.14000000000000001
0.15 6.3214855788492359E-3 6.5214855788492355E-3
7.1214855788492362E-3 8.1214855788492354E-3
9.5214855788492356E-3 1.1321485578849237E-2
1.3521485578849236E-2 1.6121485578849237E-2
1.9121485578849236E-2 2.2521485578849233E-2
2.6321485578849238E-2 3.0521485578849233E-2
3.5121485578849233E-2 4.0121485578849238E-2
4.552148557884924E-2 5.1321485578849232E-2 The
Risky Asset 1 and 2
0 0.13 0.08 2.3E-3 2.1000000000000001E-2
1.2999999999999999E-2
Standard Deviation (s)
Expected Return / Month
(1)
BUS329 (Investment Analysis)
Assignment: How to download data from Yahoo Finance
This guidelines show you how to download stock price data
from Yahoo Finance. The first
part is related to data you need to construct optimal complete
portfolio and the second
part is related to data you need to calculate systematic risks.
First part: Constructing optimal complete portfolio
(1) This part of the assignment is about constructing optimal
complete portfolio with
two risky assets and one risk-free asset.
(2) For risk-free rate use 1 month Bank Accepted Bill (BAB)
rate available on Reserve
Bank of Australia (RBA) website as follow:
(http://www.rba.gov.au/statistics/tables/#interest-rates) (Take
the average of BAB rate
during your sample period). You will need to click “Interest
Rates and Yield –
Money Market – Monthly – F1.1” to get this data. After clicking
an excel file will be
downloaded, where you will find 1-moth BAB rate.
(3) For risky assets choose two stocks from Australia Stock
Exchange (ASX)
(4) Download stock price data from Yahoo Finance for free
(website:
https://au.finance.yahoo.com/q/hp?s=ASX.AX)
(5) How to download data from Yahoo Finance website:
You need to enter stock symbol here to download the price of
your selected stock.
(6) Stock symbols are available in ASX website
(http://www.asx.com.au/asx/research/listedCompanies.do).
Clicking this link will
give you the following web page:
http://www.rba.gov.au/statistics/tables/#interest-rates
https://au.finance.yahoo.com/q/hp?s=ASX.AX
http://www.asx.com.au/asx/research/listedCompanies.do
(2)
(7) You need to use these ASX codes (this is what we call
symbol above) to download
stock price. For example, suppose you want to download stock
price of ABACUS
PROPERTY GROUP. Code for this stock is ABP. So you type
ABP in the box and click
„Look Up‟ as follows:
(8) This will return the following page:
(9) Now click „Historical Prices‟. This will return the following
page:
(3)
(10) Now select your start and end date here. Download
monthly data by clicking
„Monthly‟. I strongly recommend using monthly data to avoid
the complexities of
handling public holidays, non-trading day etc. Once you have
selected start and
end date and checked „Monthly‟, click „Get Prices‟ to
download the data. When
data download is complete, go to the bottom of the page and
click „Download to
SpreadSheet‟ to get data in CSV format. Finally save the data
as per your
convenience. For analysis purpose use the stock price along the
„Adj Close‟ column
(11) Repeat the same process to download your second stock
price data.
(12) Use monthly data from July 2008 to December 2016.
(13) Next you will need to calculate stock return from stock
prices. Use the
following formula to calculate the return series:
(4)
100
1
t
tt
t
P
PP
r (1)
For example, in the screenshot below „Adj Close‟ price on 1
June 2016 is AU$3.07 and that
on 1 July 2016 is AU$3.10. Therefore return on 1 July 2016 is
calculated as follows:
%98.0
100
07.3$
07.3$10.3$
20161
AU
AUAU
r
July
Using stock price data the return series can easily be generated
in excel.
(14) If the data are downloaded from ‘New’ to ‘Old’, then you
need to convert them from ‘Old’ to
‘New’. For example, in the screenshot above 1 July, 2016 data
come first and then 1 June
2016 – this is ‘New’ to ‘Old’ pattern. You will need to convert
them to ‘Old’ to ‘New’ form.
This can easily be done by using ‘Sort’ under ‘Data’ in Excel
(15) For your analysis you will need to calculate variance,
covariance, standard
deviation etc. for the stock return series. You can calculate
these by using
formulas in excel. Please visit the following YouTube website
to see how excel can
be used to calculate those statistics:
https://www.youtube.com/results?search_query=how+to+calcula
te+variance%2C+covarian
ce+in+excel
(16) Calculate optimum weights of two risky assets (say, asset S
and Asset B) by
using the following formula [this is similar to the formula given
in Equation 7.13
(page 217) of your text]
https://www.youtube.com/results?search_query=how+to+calcula
te+variance%2C+covariance+in+excel
https://www.youtube.com/results?search_query=how+to+calcula
te+variance%2C+covariance+in+excel
(5)
Use average of stock returns calculated using formula (1) above
as a proxy for expected
return, E(r), in the above equation. Similarly use the average of
risk-free rate as a proxy
for rf in the above equation.
(17) You will also be required a value for risk aversion
coefficient, A. It is not
available anywhere. It is a subjective value. Use any one of the
following three risk
aversion coefficients:
(a) Highly risk-averse investor: if you think you are highly risk
averse, then use 5 as
your risk-aversion coefficient (i.e., A = 5)
(b) Moderate risk-averse investor: if you think you are
moderately risk averse, then use
4 as your risk-aversion coefficient (i.e., A = 4)
(c) Low risk-averse investor: if you think you are low risk-
averse investor, then use 3 as
your risk-aversion coefficient (i.e., A = 3)
(18) Split the whole sample into two sub-periods:
(a) From July 2008 to December 2011 (this period is a proxy for
Global Financial
Crisis (GFC).
(b) From January 2012 to December 2016 (this period is a proxy
for post Global
Financial Crisis (post-GFC).
(6)
Second part: Systematic risk of the risky assets
(1) In this part of the assignment you will be required to
calculate the systematic risk
of the risky assets, that is, two stocks used in Part A of the
assignment. In other
words, you are required to calculate β (beta) of each stock.
(2) Split the whole sample into two sub-periods:
(3) From July 2008 to December 2011 (this period is a proxy for
Global Financial Crisis
(GFC) and hence is expected to capture the effect of GFC on
stocks‟ systematic
risk)
(4) From January 2012 to December 2016 (this period is a proxy
for post Global
Fnancial Crisis (post-GFC) and hence is expected to capture the
stocks‟ systematic
risk during post-GFC period)
(5) You can calculate beta by using the following formula:
M
Mi
i
rVar
rrCov ,
here rM is return on market portfolio. You can use ASX All
Ordinary index as a proxy
for market portfolio.
(6) To download ASX All Ordinary index data type „^AORD‟
in the box as below:
(7) Now click „Look Up‟, which will return the following page.
(7)
(8) Now click „Historical Prices‟ and download ASX All
Ordinary index following steps
described in above.
(9) Calculate ASX All Ordinary index return using formula
given in eq (1) above.
(10) Calculate covariance between stock return and index return
(you will need
to calculate two co-variances for two stock returns.
(11) Calculate variance of index return
(12) Finally calculate beta using formula in equation (2) above.
(13) Compare the betas (GFC beta vs post-GFC beta)
Important Note: This is a group assignment. Each group will
work on two firms‟ stock price
data; however, each group has to work on different pair of
firms‟ stock prices. For
example, if Group 1 is works on Firm A and Firm B, no other
group can work on Firm A and
Firm B data; another group can work on Firm A and Firm C data
or Firm B and Firm C data.
Remember exactly same two forms‟ data cannot be used by
multiple groups. If two groups
work on exactly same two firms’ data, they will arrive at
exactly same result, which
will be treated as serious type of plagiarism. So using exactly
same two firms‟ data by
more than one group is strictly prohibited.

More Related Content

Similar to Main ComputationExpectedStandardRisk PremiumReturnMonDeviationE(r.docx

Similar to Main ComputationExpectedStandardRisk PremiumReturnMonDeviationE(r.docx (9)

Financial_Management_Class_Notes.pdf
Financial_Management_Class_Notes.pdfFinancial_Management_Class_Notes.pdf
Financial_Management_Class_Notes.pdf
 
Activity-Based Costing
Activity-Based CostingActivity-Based Costing
Activity-Based Costing
 
Financial Data Mining Talk
Financial Data Mining TalkFinancial Data Mining Talk
Financial Data Mining Talk
 
samsung electronics 005930 Algorithm Investment Report
samsung electronics 005930 Algorithm Investment Reportsamsung electronics 005930 Algorithm Investment Report
samsung electronics 005930 Algorithm Investment Report
 
korea airport service 005430 Algoritm Investment Report
korea airport service 005430 Algoritm Investment Reportkorea airport service 005430 Algoritm Investment Report
korea airport service 005430 Algoritm Investment Report
 
samsung cnt 028260 Algorithm Investment Report
samsung cnt 028260 Algorithm Investment Reportsamsung cnt 028260 Algorithm Investment Report
samsung cnt 028260 Algorithm Investment Report
 
PV Factor Value
PV Factor ValuePV Factor Value
PV Factor Value
 
Hyundai 33 d 7e forklift truck service repair manual
Hyundai 33 d 7e forklift truck service repair manualHyundai 33 d 7e forklift truck service repair manual
Hyundai 33 d 7e forklift truck service repair manual
 
Hyundai 20 d 7e forklift truck service repair manual
Hyundai 20 d 7e forklift truck service repair manualHyundai 20 d 7e forklift truck service repair manual
Hyundai 20 d 7e forklift truck service repair manual
 

More from smile790243

PART B Please response to these two original posts below. Wh.docx
PART B Please response to these two original posts below. Wh.docxPART B Please response to these two original posts below. Wh.docx
PART B Please response to these two original posts below. Wh.docxsmile790243
 
Part C Developing Your Design SolutionThe Production Cycle.docx
Part C Developing Your Design SolutionThe Production Cycle.docxPart C Developing Your Design SolutionThe Production Cycle.docx
Part C Developing Your Design SolutionThe Production Cycle.docxsmile790243
 
PART A You will create a media piece based around the theme of a.docx
PART A You will create a media piece based around the theme of a.docxPART A You will create a media piece based around the theme of a.docx
PART A You will create a media piece based around the theme of a.docxsmile790243
 
Part 4. Implications to Nursing Practice & Implication to Patien.docx
Part 4. Implications to Nursing Practice & Implication to Patien.docxPart 4. Implications to Nursing Practice & Implication to Patien.docx
Part 4. Implications to Nursing Practice & Implication to Patien.docxsmile790243
 
PART AHepatitis C is a chronic liver infection that can be e.docx
PART AHepatitis C is a chronic liver infection that can be e.docxPART AHepatitis C is a chronic liver infection that can be e.docx
PART AHepatitis C is a chronic liver infection that can be e.docxsmile790243
 
Part A post your answer to the following question1. How m.docx
Part A post your answer to the following question1. How m.docxPart A post your answer to the following question1. How m.docx
Part A post your answer to the following question1. How m.docxsmile790243
 
PART BPlease response to these two original posts below..docx
PART BPlease response to these two original posts below..docxPART BPlease response to these two original posts below..docx
PART BPlease response to these two original posts below..docxsmile790243
 
Part A (50 Points)Various men and women throughout history .docx
Part A (50 Points)Various men and women throughout history .docxPart A (50 Points)Various men and women throughout history .docx
Part A (50 Points)Various men and women throughout history .docxsmile790243
 
Part A1. K2. D3. N4. C5. A6. O7. F8. Q9. H10..docx
Part A1. K2. D3. N4. C5. A6. O7. F8. Q9. H10..docxPart A1. K2. D3. N4. C5. A6. O7. F8. Q9. H10..docx
Part A1. K2. D3. N4. C5. A6. O7. F8. Q9. H10..docxsmile790243
 
Part A Develop an original age-appropriate activity for your .docx
Part A Develop an original age-appropriate activity for your .docxPart A Develop an original age-appropriate activity for your .docx
Part A Develop an original age-appropriate activity for your .docxsmile790243
 
Part 3 Social Situations2. Identify multicultural challenges th.docx
Part 3 Social Situations2. Identify multicultural challenges th.docxPart 3 Social Situations2. Identify multicultural challenges th.docx
Part 3 Social Situations2. Identify multicultural challenges th.docxsmile790243
 
Part A (1000 words) Annotated Bibliography - Create an annota.docx
Part A (1000 words) Annotated Bibliography - Create an annota.docxPart A (1000 words) Annotated Bibliography - Create an annota.docx
Part A (1000 words) Annotated Bibliography - Create an annota.docxsmile790243
 
Part 6 Disseminating Results Create a 5-minute, 5- to 6-sli.docx
Part 6 Disseminating Results Create a 5-minute, 5- to 6-sli.docxPart 6 Disseminating Results Create a 5-minute, 5- to 6-sli.docx
Part 6 Disseminating Results Create a 5-minute, 5- to 6-sli.docxsmile790243
 
Part 3 Social Situations • Proposal paper which identifies multicul.docx
Part 3 Social Situations • Proposal paper which identifies multicul.docxPart 3 Social Situations • Proposal paper which identifies multicul.docx
Part 3 Social Situations • Proposal paper which identifies multicul.docxsmile790243
 
Part 3 Social Situations 2. Identify multicultural challenges that .docx
Part 3 Social Situations 2. Identify multicultural challenges that .docxPart 3 Social Situations 2. Identify multicultural challenges that .docx
Part 3 Social Situations 2. Identify multicultural challenges that .docxsmile790243
 
Part 2The client is a 32-year-old Hispanic American male who c.docx
Part 2The client is a 32-year-old Hispanic American male who c.docxPart 2The client is a 32-year-old Hispanic American male who c.docx
Part 2The client is a 32-year-old Hispanic American male who c.docxsmile790243
 
Part 2For this section of the template, focus on gathering deta.docx
Part 2For this section of the template, focus on gathering deta.docxPart 2For this section of the template, focus on gathering deta.docx
Part 2For this section of the template, focus on gathering deta.docxsmile790243
 
Part 2 Observation Summary and Analysis • Summary paper of observat.docx
Part 2 Observation Summary and Analysis • Summary paper of observat.docxPart 2 Observation Summary and Analysis • Summary paper of observat.docx
Part 2 Observation Summary and Analysis • Summary paper of observat.docxsmile790243
 
Part 2 Observation Summary and Analysis 1. Review and implement any.docx
Part 2 Observation Summary and Analysis 1. Review and implement any.docxPart 2 Observation Summary and Analysis 1. Review and implement any.docx
Part 2 Observation Summary and Analysis 1. Review and implement any.docxsmile790243
 
Part 2Data collectionfrom your change study initiative,.docx
Part 2Data collectionfrom your change study initiative,.docxPart 2Data collectionfrom your change study initiative,.docx
Part 2Data collectionfrom your change study initiative,.docxsmile790243
 

More from smile790243 (20)

PART B Please response to these two original posts below. Wh.docx
PART B Please response to these two original posts below. Wh.docxPART B Please response to these two original posts below. Wh.docx
PART B Please response to these two original posts below. Wh.docx
 
Part C Developing Your Design SolutionThe Production Cycle.docx
Part C Developing Your Design SolutionThe Production Cycle.docxPart C Developing Your Design SolutionThe Production Cycle.docx
Part C Developing Your Design SolutionThe Production Cycle.docx
 
PART A You will create a media piece based around the theme of a.docx
PART A You will create a media piece based around the theme of a.docxPART A You will create a media piece based around the theme of a.docx
PART A You will create a media piece based around the theme of a.docx
 
Part 4. Implications to Nursing Practice & Implication to Patien.docx
Part 4. Implications to Nursing Practice & Implication to Patien.docxPart 4. Implications to Nursing Practice & Implication to Patien.docx
Part 4. Implications to Nursing Practice & Implication to Patien.docx
 
PART AHepatitis C is a chronic liver infection that can be e.docx
PART AHepatitis C is a chronic liver infection that can be e.docxPART AHepatitis C is a chronic liver infection that can be e.docx
PART AHepatitis C is a chronic liver infection that can be e.docx
 
Part A post your answer to the following question1. How m.docx
Part A post your answer to the following question1. How m.docxPart A post your answer to the following question1. How m.docx
Part A post your answer to the following question1. How m.docx
 
PART BPlease response to these two original posts below..docx
PART BPlease response to these two original posts below..docxPART BPlease response to these two original posts below..docx
PART BPlease response to these two original posts below..docx
 
Part A (50 Points)Various men and women throughout history .docx
Part A (50 Points)Various men and women throughout history .docxPart A (50 Points)Various men and women throughout history .docx
Part A (50 Points)Various men and women throughout history .docx
 
Part A1. K2. D3. N4. C5. A6. O7. F8. Q9. H10..docx
Part A1. K2. D3. N4. C5. A6. O7. F8. Q9. H10..docxPart A1. K2. D3. N4. C5. A6. O7. F8. Q9. H10..docx
Part A1. K2. D3. N4. C5. A6. O7. F8. Q9. H10..docx
 
Part A Develop an original age-appropriate activity for your .docx
Part A Develop an original age-appropriate activity for your .docxPart A Develop an original age-appropriate activity for your .docx
Part A Develop an original age-appropriate activity for your .docx
 
Part 3 Social Situations2. Identify multicultural challenges th.docx
Part 3 Social Situations2. Identify multicultural challenges th.docxPart 3 Social Situations2. Identify multicultural challenges th.docx
Part 3 Social Situations2. Identify multicultural challenges th.docx
 
Part A (1000 words) Annotated Bibliography - Create an annota.docx
Part A (1000 words) Annotated Bibliography - Create an annota.docxPart A (1000 words) Annotated Bibliography - Create an annota.docx
Part A (1000 words) Annotated Bibliography - Create an annota.docx
 
Part 6 Disseminating Results Create a 5-minute, 5- to 6-sli.docx
Part 6 Disseminating Results Create a 5-minute, 5- to 6-sli.docxPart 6 Disseminating Results Create a 5-minute, 5- to 6-sli.docx
Part 6 Disseminating Results Create a 5-minute, 5- to 6-sli.docx
 
Part 3 Social Situations • Proposal paper which identifies multicul.docx
Part 3 Social Situations • Proposal paper which identifies multicul.docxPart 3 Social Situations • Proposal paper which identifies multicul.docx
Part 3 Social Situations • Proposal paper which identifies multicul.docx
 
Part 3 Social Situations 2. Identify multicultural challenges that .docx
Part 3 Social Situations 2. Identify multicultural challenges that .docxPart 3 Social Situations 2. Identify multicultural challenges that .docx
Part 3 Social Situations 2. Identify multicultural challenges that .docx
 
Part 2The client is a 32-year-old Hispanic American male who c.docx
Part 2The client is a 32-year-old Hispanic American male who c.docxPart 2The client is a 32-year-old Hispanic American male who c.docx
Part 2The client is a 32-year-old Hispanic American male who c.docx
 
Part 2For this section of the template, focus on gathering deta.docx
Part 2For this section of the template, focus on gathering deta.docxPart 2For this section of the template, focus on gathering deta.docx
Part 2For this section of the template, focus on gathering deta.docx
 
Part 2 Observation Summary and Analysis • Summary paper of observat.docx
Part 2 Observation Summary and Analysis • Summary paper of observat.docxPart 2 Observation Summary and Analysis • Summary paper of observat.docx
Part 2 Observation Summary and Analysis • Summary paper of observat.docx
 
Part 2 Observation Summary and Analysis 1. Review and implement any.docx
Part 2 Observation Summary and Analysis 1. Review and implement any.docxPart 2 Observation Summary and Analysis 1. Review and implement any.docx
Part 2 Observation Summary and Analysis 1. Review and implement any.docx
 
Part 2Data collectionfrom your change study initiative,.docx
Part 2Data collectionfrom your change study initiative,.docxPart 2Data collectionfrom your change study initiative,.docx
Part 2Data collectionfrom your change study initiative,.docx
 

Recently uploaded

Basic Civil Engineering notes on Transportation Engineering & Modes of Transport
Basic Civil Engineering notes on Transportation Engineering & Modes of TransportBasic Civil Engineering notes on Transportation Engineering & Modes of Transport
Basic Civil Engineering notes on Transportation Engineering & Modes of TransportDenish Jangid
 
Andreas Schleicher presents at the launch of What does child empowerment mean...
Andreas Schleicher presents at the launch of What does child empowerment mean...Andreas Schleicher presents at the launch of What does child empowerment mean...
Andreas Schleicher presents at the launch of What does child empowerment mean...EduSkills OECD
 
Observing-Correct-Grammar-in-Making-Definitions.pptx
Observing-Correct-Grammar-in-Making-Definitions.pptxObserving-Correct-Grammar-in-Making-Definitions.pptx
Observing-Correct-Grammar-in-Making-Definitions.pptxAdelaideRefugio
 
AIM of Education-Teachers Training-2024.ppt
AIM of Education-Teachers Training-2024.pptAIM of Education-Teachers Training-2024.ppt
AIM of Education-Teachers Training-2024.pptNishitharanjan Rout
 
24 ĐỀ THAM KHẢO KÌ THI TUYỂN SINH VÀO LỚP 10 MÔN TIẾNG ANH SỞ GIÁO DỤC HẢI DƯ...
24 ĐỀ THAM KHẢO KÌ THI TUYỂN SINH VÀO LỚP 10 MÔN TIẾNG ANH SỞ GIÁO DỤC HẢI DƯ...24 ĐỀ THAM KHẢO KÌ THI TUYỂN SINH VÀO LỚP 10 MÔN TIẾNG ANH SỞ GIÁO DỤC HẢI DƯ...
24 ĐỀ THAM KHẢO KÌ THI TUYỂN SINH VÀO LỚP 10 MÔN TIẾNG ANH SỞ GIÁO DỤC HẢI DƯ...Nguyen Thanh Tu Collection
 
OSCM Unit 2_Operations Processes & Systems
OSCM Unit 2_Operations Processes & SystemsOSCM Unit 2_Operations Processes & Systems
OSCM Unit 2_Operations Processes & SystemsSandeep D Chaudhary
 
The Liver & Gallbladder (Anatomy & Physiology).pptx
The Liver &  Gallbladder (Anatomy & Physiology).pptxThe Liver &  Gallbladder (Anatomy & Physiology).pptx
The Liver & Gallbladder (Anatomy & Physiology).pptxVishal Singh
 
Improved Approval Flow in Odoo 17 Studio App
Improved Approval Flow in Odoo 17 Studio AppImproved Approval Flow in Odoo 17 Studio App
Improved Approval Flow in Odoo 17 Studio AppCeline George
 
Contoh Aksi Nyata Refleksi Diri ( NUR ).pdf
Contoh Aksi Nyata Refleksi Diri ( NUR ).pdfContoh Aksi Nyata Refleksi Diri ( NUR ).pdf
Contoh Aksi Nyata Refleksi Diri ( NUR ).pdfcupulin
 
UChicago CMSC 23320 - The Best Commit Messages of 2024
UChicago CMSC 23320 - The Best Commit Messages of 2024UChicago CMSC 23320 - The Best Commit Messages of 2024
UChicago CMSC 23320 - The Best Commit Messages of 2024Borja Sotomayor
 
How To Create Editable Tree View in Odoo 17
How To Create Editable Tree View in Odoo 17How To Create Editable Tree View in Odoo 17
How To Create Editable Tree View in Odoo 17Celine George
 
e-Sealing at EADTU by Kamakshi Rajagopal
e-Sealing at EADTU by Kamakshi Rajagopale-Sealing at EADTU by Kamakshi Rajagopal
e-Sealing at EADTU by Kamakshi RajagopalEADTU
 
8 Tips for Effective Working Capital Management
8 Tips for Effective Working Capital Management8 Tips for Effective Working Capital Management
8 Tips for Effective Working Capital ManagementMBA Assignment Experts
 
SPLICE Working Group: Reusable Code Examples
SPLICE Working Group:Reusable Code ExamplesSPLICE Working Group:Reusable Code Examples
SPLICE Working Group: Reusable Code ExamplesPeter Brusilovsky
 
Stl Algorithms in C++ jjjjjjjjjjjjjjjjjj
Stl Algorithms in C++ jjjjjjjjjjjjjjjjjjStl Algorithms in C++ jjjjjjjjjjjjjjjjjj
Stl Algorithms in C++ jjjjjjjjjjjjjjjjjjMohammed Sikander
 
Major project report on Tata Motors and its marketing strategies
Major project report on Tata Motors and its marketing strategiesMajor project report on Tata Motors and its marketing strategies
Major project report on Tata Motors and its marketing strategiesAmanpreetKaur157993
 

Recently uploaded (20)

Basic Civil Engineering notes on Transportation Engineering & Modes of Transport
Basic Civil Engineering notes on Transportation Engineering & Modes of TransportBasic Civil Engineering notes on Transportation Engineering & Modes of Transport
Basic Civil Engineering notes on Transportation Engineering & Modes of Transport
 
Andreas Schleicher presents at the launch of What does child empowerment mean...
Andreas Schleicher presents at the launch of What does child empowerment mean...Andreas Schleicher presents at the launch of What does child empowerment mean...
Andreas Schleicher presents at the launch of What does child empowerment mean...
 
Mattingly "AI and Prompt Design: LLMs with NER"
Mattingly "AI and Prompt Design: LLMs with NER"Mattingly "AI and Prompt Design: LLMs with NER"
Mattingly "AI and Prompt Design: LLMs with NER"
 
Observing-Correct-Grammar-in-Making-Definitions.pptx
Observing-Correct-Grammar-in-Making-Definitions.pptxObserving-Correct-Grammar-in-Making-Definitions.pptx
Observing-Correct-Grammar-in-Making-Definitions.pptx
 
AIM of Education-Teachers Training-2024.ppt
AIM of Education-Teachers Training-2024.pptAIM of Education-Teachers Training-2024.ppt
AIM of Education-Teachers Training-2024.ppt
 
24 ĐỀ THAM KHẢO KÌ THI TUYỂN SINH VÀO LỚP 10 MÔN TIẾNG ANH SỞ GIÁO DỤC HẢI DƯ...
24 ĐỀ THAM KHẢO KÌ THI TUYỂN SINH VÀO LỚP 10 MÔN TIẾNG ANH SỞ GIÁO DỤC HẢI DƯ...24 ĐỀ THAM KHẢO KÌ THI TUYỂN SINH VÀO LỚP 10 MÔN TIẾNG ANH SỞ GIÁO DỤC HẢI DƯ...
24 ĐỀ THAM KHẢO KÌ THI TUYỂN SINH VÀO LỚP 10 MÔN TIẾNG ANH SỞ GIÁO DỤC HẢI DƯ...
 
OSCM Unit 2_Operations Processes & Systems
OSCM Unit 2_Operations Processes & SystemsOSCM Unit 2_Operations Processes & Systems
OSCM Unit 2_Operations Processes & Systems
 
Supporting Newcomer Multilingual Learners
Supporting Newcomer  Multilingual LearnersSupporting Newcomer  Multilingual Learners
Supporting Newcomer Multilingual Learners
 
The Liver & Gallbladder (Anatomy & Physiology).pptx
The Liver &  Gallbladder (Anatomy & Physiology).pptxThe Liver &  Gallbladder (Anatomy & Physiology).pptx
The Liver & Gallbladder (Anatomy & Physiology).pptx
 
Improved Approval Flow in Odoo 17 Studio App
Improved Approval Flow in Odoo 17 Studio AppImproved Approval Flow in Odoo 17 Studio App
Improved Approval Flow in Odoo 17 Studio App
 
Contoh Aksi Nyata Refleksi Diri ( NUR ).pdf
Contoh Aksi Nyata Refleksi Diri ( NUR ).pdfContoh Aksi Nyata Refleksi Diri ( NUR ).pdf
Contoh Aksi Nyata Refleksi Diri ( NUR ).pdf
 
UChicago CMSC 23320 - The Best Commit Messages of 2024
UChicago CMSC 23320 - The Best Commit Messages of 2024UChicago CMSC 23320 - The Best Commit Messages of 2024
UChicago CMSC 23320 - The Best Commit Messages of 2024
 
Mattingly "AI & Prompt Design: Named Entity Recognition"
Mattingly "AI & Prompt Design: Named Entity Recognition"Mattingly "AI & Prompt Design: Named Entity Recognition"
Mattingly "AI & Prompt Design: Named Entity Recognition"
 
How To Create Editable Tree View in Odoo 17
How To Create Editable Tree View in Odoo 17How To Create Editable Tree View in Odoo 17
How To Create Editable Tree View in Odoo 17
 
OS-operating systems- ch05 (CPU Scheduling) ...
OS-operating systems- ch05 (CPU Scheduling) ...OS-operating systems- ch05 (CPU Scheduling) ...
OS-operating systems- ch05 (CPU Scheduling) ...
 
e-Sealing at EADTU by Kamakshi Rajagopal
e-Sealing at EADTU by Kamakshi Rajagopale-Sealing at EADTU by Kamakshi Rajagopal
e-Sealing at EADTU by Kamakshi Rajagopal
 
8 Tips for Effective Working Capital Management
8 Tips for Effective Working Capital Management8 Tips for Effective Working Capital Management
8 Tips for Effective Working Capital Management
 
SPLICE Working Group: Reusable Code Examples
SPLICE Working Group:Reusable Code ExamplesSPLICE Working Group:Reusable Code Examples
SPLICE Working Group: Reusable Code Examples
 
Stl Algorithms in C++ jjjjjjjjjjjjjjjjjj
Stl Algorithms in C++ jjjjjjjjjjjjjjjjjjStl Algorithms in C++ jjjjjjjjjjjjjjjjjj
Stl Algorithms in C++ jjjjjjjjjjjjjjjjjj
 
Major project report on Tata Motors and its marketing strategies
Major project report on Tata Motors and its marketing strategiesMajor project report on Tata Motors and its marketing strategies
Major project report on Tata Motors and its marketing strategies
 

Main ComputationExpectedStandardRisk PremiumReturnMonDeviationE(r.docx

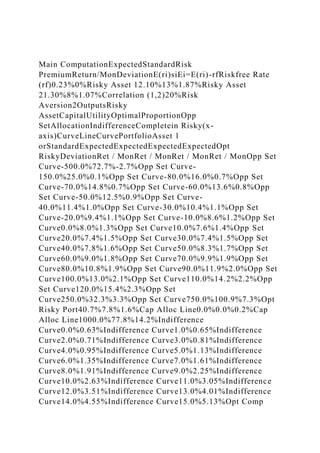
  • 1. Main ComputationExpectedStandardRisk PremiumReturn/MonDeviationE(ri)siEi=E(ri)-rfRiskfree Rate (rf)0.23%0%Risky Asset 12.10%13%1.87%Risky Asset 21.30%8%1.07%Correlation (1,2)20%Risk Aversion2OutputsRisky AssetCapitalUtilityOptimalProportionOpp SetAllocationIndifferenceCompletein Risky(x- axis)CurveLineCurvePortfolioAsset 1 orStandardExpectedExpectedExpectedExpectedOpt RiskyDeviationRet / MonRet / MonRet / MonRet / MonOpp Set Curve-500.0%72.7%-2.7%Opp Set Curve- 150.0%25.0%0.1%Opp Set Curve-80.0%16.0%0.7%Opp Set Curve-70.0%14.8%0.7%Opp Set Curve-60.0%13.6%0.8%Opp Set Curve-50.0%12.5%0.9%Opp Set Curve- 40.0%11.4%1.0%Opp Set Curve-30.0%10.4%1.1%Opp Set Curve-20.0%9.4%1.1%Opp Set Curve-10.0%8.6%1.2%Opp Set Curve0.0%8.0%1.3%Opp Set Curve10.0%7.6%1.4%Opp Set Curve20.0%7.4%1.5%Opp Set Curve30.0%7.4%1.5%Opp Set Curve40.0%7.8%1.6%Opp Set Curve50.0%8.3%1.7%Opp Set Curve60.0%9.0%1.8%Opp Set Curve70.0%9.9%1.9%Opp Set Curve80.0%10.8%1.9%Opp Set Curve90.0%11.9%2.0%Opp Set Curve100.0%13.0%2.1%Opp Set Curve110.0%14.2%2.2%Opp Set Curve120.0%15.4%2.3%Opp Set Curve250.0%32.3%3.3%Opp Set Curve750.0%100.9%7.3%Opt Risky Port40.7%7.8%1.6%Cap Alloc Line0.0%0.0%0.2%Cap Alloc Line1000.0%77.8%14.2%Indifference Curve0.0%0.63%Indifference Curve1.0%0.65%Indifference Curve2.0%0.71%Indifference Curve3.0%0.81%Indifference Curve4.0%0.95%Indifference Curve5.0%1.13%Indifference Curve6.0%1.35%Indifference Curve7.0%1.61%Indifference Curve8.0%1.91%Indifference Curve9.0%2.25%Indifference Curve10.0%2.63%Indifference Curve11.0%3.05%Indifference Curve12.0%3.51%Indifference Curve13.0%4.01%Indifference Curve14.0%4.55%Indifference Curve15.0%5.13%Opt Comp
  • 2. Port4.5%1.0%Constant Utility Value0.0063Risk aversionWeight TPWeight RFExp. ReturnStd. dev.Utility2.00.57630.42370.01030.04480.0063 Sheet1Risky Asset 1Risky Asset 2MonthBarrickIBMTreasury BillsDec 2009-7.75%3.60%1.137860.158Nov 200919.37%5.22%1.202270.148Oct 2009- 5.20%0.84%1.282780.148Sep 20099.22%1.32%1.121760.178Aug 2009- 0.57%0.57%0.944640.178Jul 20094.02%12.94%0.971480.202Jun 2009-11.90%- 1.75%1.073460.311May 200931.55%3.51%1.014420.316Apr 2009-10.24%6.52%0.976160.38Mar 20097.35%5.28%0.993190.602Feb 2009- 19.45%0.96%0.936430.587Jan 20091.96%8.90%1.03660.612Dec 200824.81%3.14%0.944450.671Nov 200830.43%- 11.69%0.898390.706Oct 2008-38.11%-20.51%1.013560.706Sep 20085.79%-3.92%0.950210.805Aug 2008-17.99%- 4.49%0.921410.795Jul 2008-6.92%7.97%0.852310.735Jun 200812.93%-8.42%0.722740.665May 20084.84%7.65%0.573010.575Apr 2008- 11.12%4.83%0.48950.525Mar 2008- 16.36%1.12%0.564360.565Feb 20080.99%6.68%0.498140.465Jan 200822.33%- 0.92%0.483750.44Dec 20073.80%2.78%0.604680.53Nov 2007- 7.86%-9.08%0.719860.475Oct 20079.56%- 1.43%0.662270.39Sep 200723.86%0.95%0.581650.34Aug 2007- 1.16%5.82%0.547090.28Jul 200713.18%5.13%0.613320.345Jun 2007-0.21%-1.27%0.570130.31May 20074.16%4.69%0.619080.3Apr 2007- 1.54%8.43%0.702580.35Mar 2007-4.42%1.42%0.642110.36Feb 20070.84%-5.96%0.613320.425Jan 2007- 3.52%2.06%0.656510.435Dec 2006-2.35%5.69%0.68530.51Nov 20061.77%-0.12%0.650750.435Oct 20060.91%12.68%0.665150.405Sep 2006- 8.24%1.20%0.549970.44Aug 20068.70%4.99%0.561490.46Jul
  • 3. 20064.05%0.77%0.538450.435Jun 2006-3.30%- 3.85%0.498140.445May 20060.79%-2.60%0.477990.405Apr 200611.89%-0.16%0.659390.415Mar 2006- 0.48%2.78%0.771690.435Feb 2006-13.00%- 1.06%0.757290.44Jan 200612.88%-1.09%0.791840.425Dec 20054.74%-7.54%0.555730.64Nov 20055.82%8.82%0.618950.69Oct 2005- 13.08%2.07%0.633480.605Sep 200510.79%- 0.50%0.610240.48Aug 20057.02%-3.16%0.630580.555Jul 2005- 2.12%12.48%0.645110.485Jun 20058.87%- 1.79%0.682880.51May 20053.49%-0.82%0.650920.54Apr 2005- 6.84%-16.42%0.569550.575Mar 2005-3.78%- 1.30%0.473660.58Feb 200513.91%-0.71%0.386480.505Jan 2005-9.74%-5.23%0.317320.48Dec 2004- 1.50%4.61%0.317320.48Nov 20049.73%5.20%Oct 20046.99%4.68%Sep 20045.20%1.24%Aug 20044.60%- 2.53%Jul 2004-3.19%-1.23%Jun 2004-4.45%-0.50%May 20048.06%0.68%Apr 2004-19.13%-4.00%Mar 200416.28%- 4.83%Feb 20043.81%-2.59%Jan 2004-13.25%7.07%Dec 20031.66%2.36%Nov 200315.31%1.36%Oct 20033.40%1.30%Sep 2003-6.83%7.71%Aug 200318.05%1.13%Jul 2003-4.36%-1.52%Jun 20032.40%- 6.29%May 200317.66%3.89%Apr 2003-3.92%8.25%Mar 2003- 3.47%0.62%Feb 2003-2.01%-0.13%Jan 20036.75%0.90%Dec 20025.79%-10.84%Nov 2002-2.65%10.30%Oct 2002- 3.09%35.38%Sep 2002-3.24%-22.65%Aug 20024.90%7.29%Jul 2002-19.33%-2.22%Jun 2002-12.89%-10.50%May 20029.17%- 3.77%Apr 20028.14%-19.46%Mar 20022.83%5.99%Feb 20025.56%-8.93%Jan 20027.21%-10.81%Dec 20015.42%4.65%Nov 2001-2.25%7.09%Oct 2001- 10.14%17.83%Sep 20018.30%-8.23%Aug 20017.59%-4.87%Jul 2001-1.72%-6.89%Jun 2001-8.18%1.07%May 20011.03%- 2.78%Apr 200115.05%19.71%Mar 2001-11.79%-3.72%Feb 20014.72%-10.69%Jan 2001-5.56%31.76%Dec 20009.20%- 9.09%Nov 200012.97%-4.94%Oct 2000-12.30%-12.44%Sep 2000-4.31%-14.77%Aug 20000.00%17.51%Jul 2000-
  • 4. 12.37%2.62%Jun 20000.34%2.04%May 20008.46%-3.58%Apr 20007.17%-5.51%Mar 2000-3.83%14.84%Feb 2000-0.38%- 8.36%Jan 2000-7.42%4.06%Average ReturnStandard Deviation Chart 1 Risky Opportunity Set, Capital Allocation Line, and Indifference Curve Risk Free 0 2.3E-3 Risky Asset 1 0.13 2.1000000000000001E-2 Risky Asset 2 0.08 1.2999999999999999E-2 Complete Portfolio 4.4841306731903098E-2 1.0342971157698472E-2 Optimum Portfolio 7.7808710077419324E-2 1.6256176939981118E-2 Portfolio Frontier 0.72670489196096655 0.24984995497297974 0.15987995496621835 0.14773828210724529 0.13592056503708333 0.12451907484397723 0.11365913953571882 0.10351135203445079 9.4305885288246918E-2 8.6344658201882932E-2 7.9999999999999946E-2 7.5679587736720635E-2 7.3740084079149254E-2 7.4368003872633287E-2 7.7500967735893461E-2 8.2855295545909438E-2 9.0035548535009224E-2 9.8643803657401621E-2 0.10834020491027328 0.11885873968707561 0.13 0.14161708936424308 0.15360208331920502 0.3231485726411305 1.0090713552569015 - 2.700000000000001E-2 1.0000000000000009E-3 6.5999999999999982E-3 7.3999999999999986E-3 8.199999999999999E-3 8.9999999999999993E-3 9.7999999999999962E-3 1.0599999999999998E-2 1.1400000000000007E-2 1.2200000000000009E-2
  • 5. 1.3000000000000008E-2 1.3800000000000007E-2 1.46E-2 1.5399999999999999E-2 1.6199999999999999E-2 1.7000000000000001E-2 1.78E-2 1.8599999999999998E-2 1.9400000000000001E-2 2.0199999999999999E-2 2.1000000000000001E-2 2.18E-2 2.2600000000000002E-2 3.3000000000000002E-2 7.3000000000000009E-2 CML0 0.77808710077419319 2.3E-3 0.14186176939981118 Indifference Curve 0 0.01 0.02 0.03 0.04 0.05 0.06 7.0000000000000007E-2 0.08 0.09 0.1 0.11 0.12 0.13 0.14000000000000001 0.15 6.3214855788492359E-3 6.5214855788492355E-3 7.1214855788492362E-3 8.1214855788492354E-3 9.5214855788492356E-3 1.1321485578849237E-2 1.3521485578849236E-2 1.6121485578849237E-2 1.9121485578849236E-2 2.2521485578849233E-2 2.6321485578849238E-2 3.0521485578849233E-2 3.5121485578849233E-2 4.0121485578849238E-2 4.552148557884924E-2 5.1321485578849232E-2 The Risky Asset 1 and 2 0 0.13 0.08 2.3E-3 2.1000000000000001E-2 1.2999999999999999E-2 Standard Deviation (s) Expected Return / Month (1)
  • 6. BUS329 (Investment Analysis) Assignment: How to download data from Yahoo Finance This guidelines show you how to download stock price data from Yahoo Finance. The first part is related to data you need to construct optimal complete portfolio and the second part is related to data you need to calculate systematic risks. First part: Constructing optimal complete portfolio (1) This part of the assignment is about constructing optimal complete portfolio with two risky assets and one risk-free asset. (2) For risk-free rate use 1 month Bank Accepted Bill (BAB) rate available on Reserve Bank of Australia (RBA) website as follow: (http://www.rba.gov.au/statistics/tables/#interest-rates) (Take the average of BAB rate during your sample period). You will need to click “Interest Rates and Yield – Money Market – Monthly – F1.1” to get this data. After clicking an excel file will be
  • 7. downloaded, where you will find 1-moth BAB rate. (3) For risky assets choose two stocks from Australia Stock Exchange (ASX) (4) Download stock price data from Yahoo Finance for free (website: https://au.finance.yahoo.com/q/hp?s=ASX.AX) (5) How to download data from Yahoo Finance website: You need to enter stock symbol here to download the price of your selected stock. (6) Stock symbols are available in ASX website (http://www.asx.com.au/asx/research/listedCompanies.do). Clicking this link will give you the following web page: http://www.rba.gov.au/statistics/tables/#interest-rates https://au.finance.yahoo.com/q/hp?s=ASX.AX http://www.asx.com.au/asx/research/listedCompanies.do (2)
  • 8. (7) You need to use these ASX codes (this is what we call symbol above) to download stock price. For example, suppose you want to download stock price of ABACUS PROPERTY GROUP. Code for this stock is ABP. So you type ABP in the box and click „Look Up‟ as follows: (8) This will return the following page: (9) Now click „Historical Prices‟. This will return the following page: (3) (10) Now select your start and end date here. Download monthly data by clicking „Monthly‟. I strongly recommend using monthly data to avoid the complexities of handling public holidays, non-trading day etc. Once you have selected start and end date and checked „Monthly‟, click „Get Prices‟ to download the data. When
  • 9. data download is complete, go to the bottom of the page and click „Download to SpreadSheet‟ to get data in CSV format. Finally save the data as per your convenience. For analysis purpose use the stock price along the „Adj Close‟ column (11) Repeat the same process to download your second stock price data. (12) Use monthly data from July 2008 to December 2016. (13) Next you will need to calculate stock return from stock prices. Use the following formula to calculate the return series: (4) 100 1
  • 10. t tt t P PP r (1) For example, in the screenshot below „Adj Close‟ price on 1 June 2016 is AU$3.07 and that on 1 July 2016 is AU$3.10. Therefore return on 1 July 2016 is calculated as follows: %98.0 100 07.3$ 07.3$10.3$ 20161
  • 11. AU AUAU r July Using stock price data the return series can easily be generated in excel. (14) If the data are downloaded from ‘New’ to ‘Old’, then you need to convert them from ‘Old’ to ‘New’. For example, in the screenshot above 1 July, 2016 data come first and then 1 June 2016 – this is ‘New’ to ‘Old’ pattern. You will need to convert them to ‘Old’ to ‘New’ form. This can easily be done by using ‘Sort’ under ‘Data’ in Excel (15) For your analysis you will need to calculate variance, covariance, standard deviation etc. for the stock return series. You can calculate these by using
  • 12. formulas in excel. Please visit the following YouTube website to see how excel can be used to calculate those statistics: https://www.youtube.com/results?search_query=how+to+calcula te+variance%2C+covarian ce+in+excel (16) Calculate optimum weights of two risky assets (say, asset S and Asset B) by using the following formula [this is similar to the formula given in Equation 7.13 (page 217) of your text] https://www.youtube.com/results?search_query=how+to+calcula te+variance%2C+covariance+in+excel https://www.youtube.com/results?search_query=how+to+calcula te+variance%2C+covariance+in+excel (5) Use average of stock returns calculated using formula (1) above as a proxy for expected return, E(r), in the above equation. Similarly use the average of risk-free rate as a proxy
  • 13. for rf in the above equation. (17) You will also be required a value for risk aversion coefficient, A. It is not available anywhere. It is a subjective value. Use any one of the following three risk aversion coefficients: (a) Highly risk-averse investor: if you think you are highly risk averse, then use 5 as your risk-aversion coefficient (i.e., A = 5) (b) Moderate risk-averse investor: if you think you are moderately risk averse, then use 4 as your risk-aversion coefficient (i.e., A = 4) (c) Low risk-averse investor: if you think you are low risk- averse investor, then use 3 as your risk-aversion coefficient (i.e., A = 3) (18) Split the whole sample into two sub-periods: (a) From July 2008 to December 2011 (this period is a proxy for Global Financial Crisis (GFC). (b) From January 2012 to December 2016 (this period is a proxy for post Global Financial Crisis (post-GFC).
  • 14. (6) Second part: Systematic risk of the risky assets (1) In this part of the assignment you will be required to calculate the systematic risk of the risky assets, that is, two stocks used in Part A of the assignment. In other words, you are required to calculate β (beta) of each stock. (2) Split the whole sample into two sub-periods: (3) From July 2008 to December 2011 (this period is a proxy for Global Financial Crisis (GFC) and hence is expected to capture the effect of GFC on stocks‟ systematic risk) (4) From January 2012 to December 2016 (this period is a proxy for post Global Fnancial Crisis (post-GFC) and hence is expected to capture the stocks‟ systematic
  • 15. risk during post-GFC period) (5) You can calculate beta by using the following formula: M Mi i rVar rrCov , here rM is return on market portfolio. You can use ASX All Ordinary index as a proxy for market portfolio. (6) To download ASX All Ordinary index data type „^AORD‟ in the box as below: (7) Now click „Look Up‟, which will return the following page. (7)
  • 16. (8) Now click „Historical Prices‟ and download ASX All Ordinary index following steps described in above. (9) Calculate ASX All Ordinary index return using formula given in eq (1) above. (10) Calculate covariance between stock return and index return (you will need to calculate two co-variances for two stock returns. (11) Calculate variance of index return (12) Finally calculate beta using formula in equation (2) above. (13) Compare the betas (GFC beta vs post-GFC beta) Important Note: This is a group assignment. Each group will work on two firms‟ stock price data; however, each group has to work on different pair of firms‟ stock prices. For example, if Group 1 is works on Firm A and Firm B, no other group can work on Firm A and Firm B data; another group can work on Firm A and Firm C data or Firm B and Firm C data.
  • 17. Remember exactly same two forms‟ data cannot be used by multiple groups. If two groups work on exactly same two firms’ data, they will arrive at exactly same result, which will be treated as serious type of plagiarism. So using exactly same two firms‟ data by more than one group is strictly prohibited.