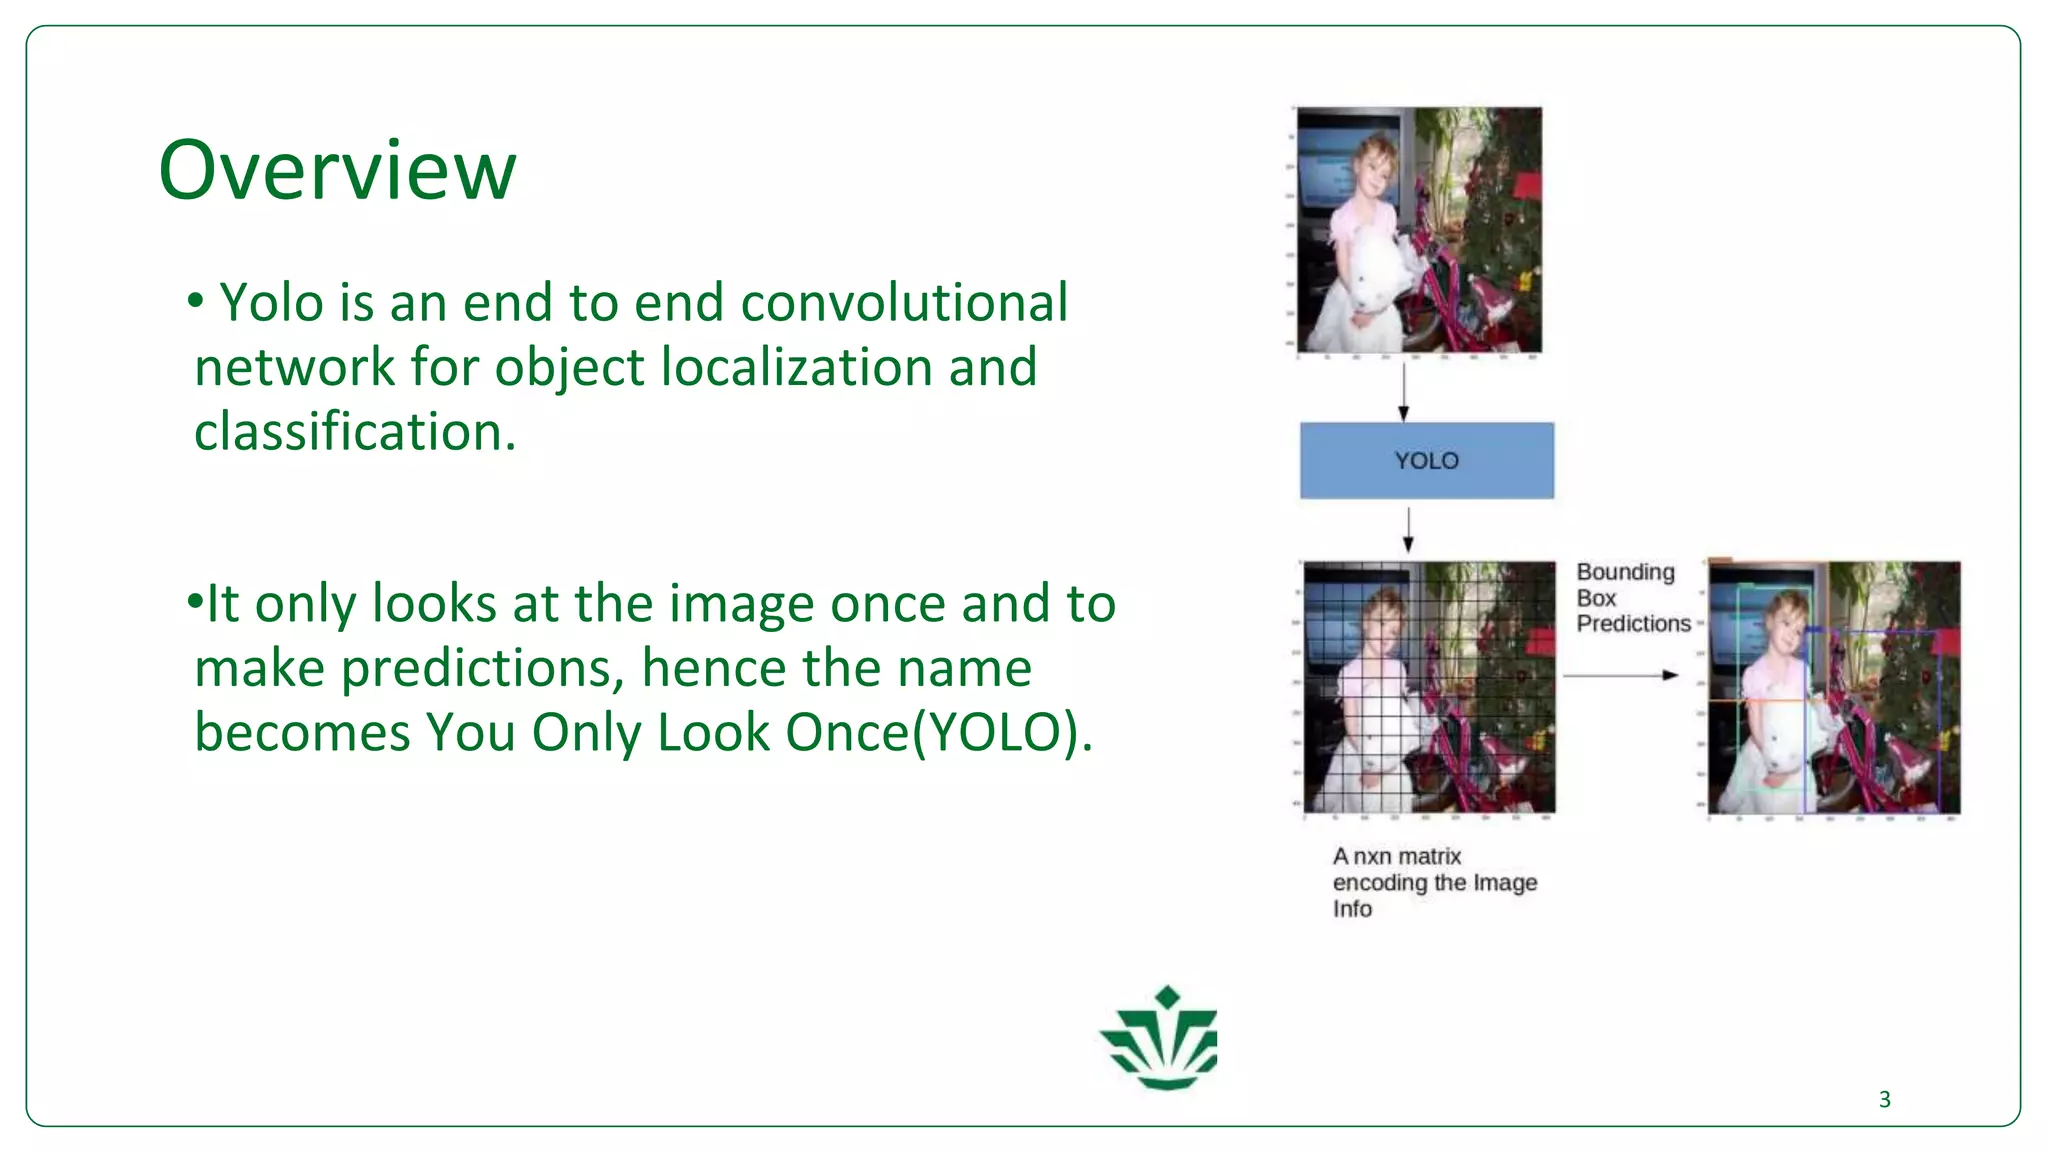
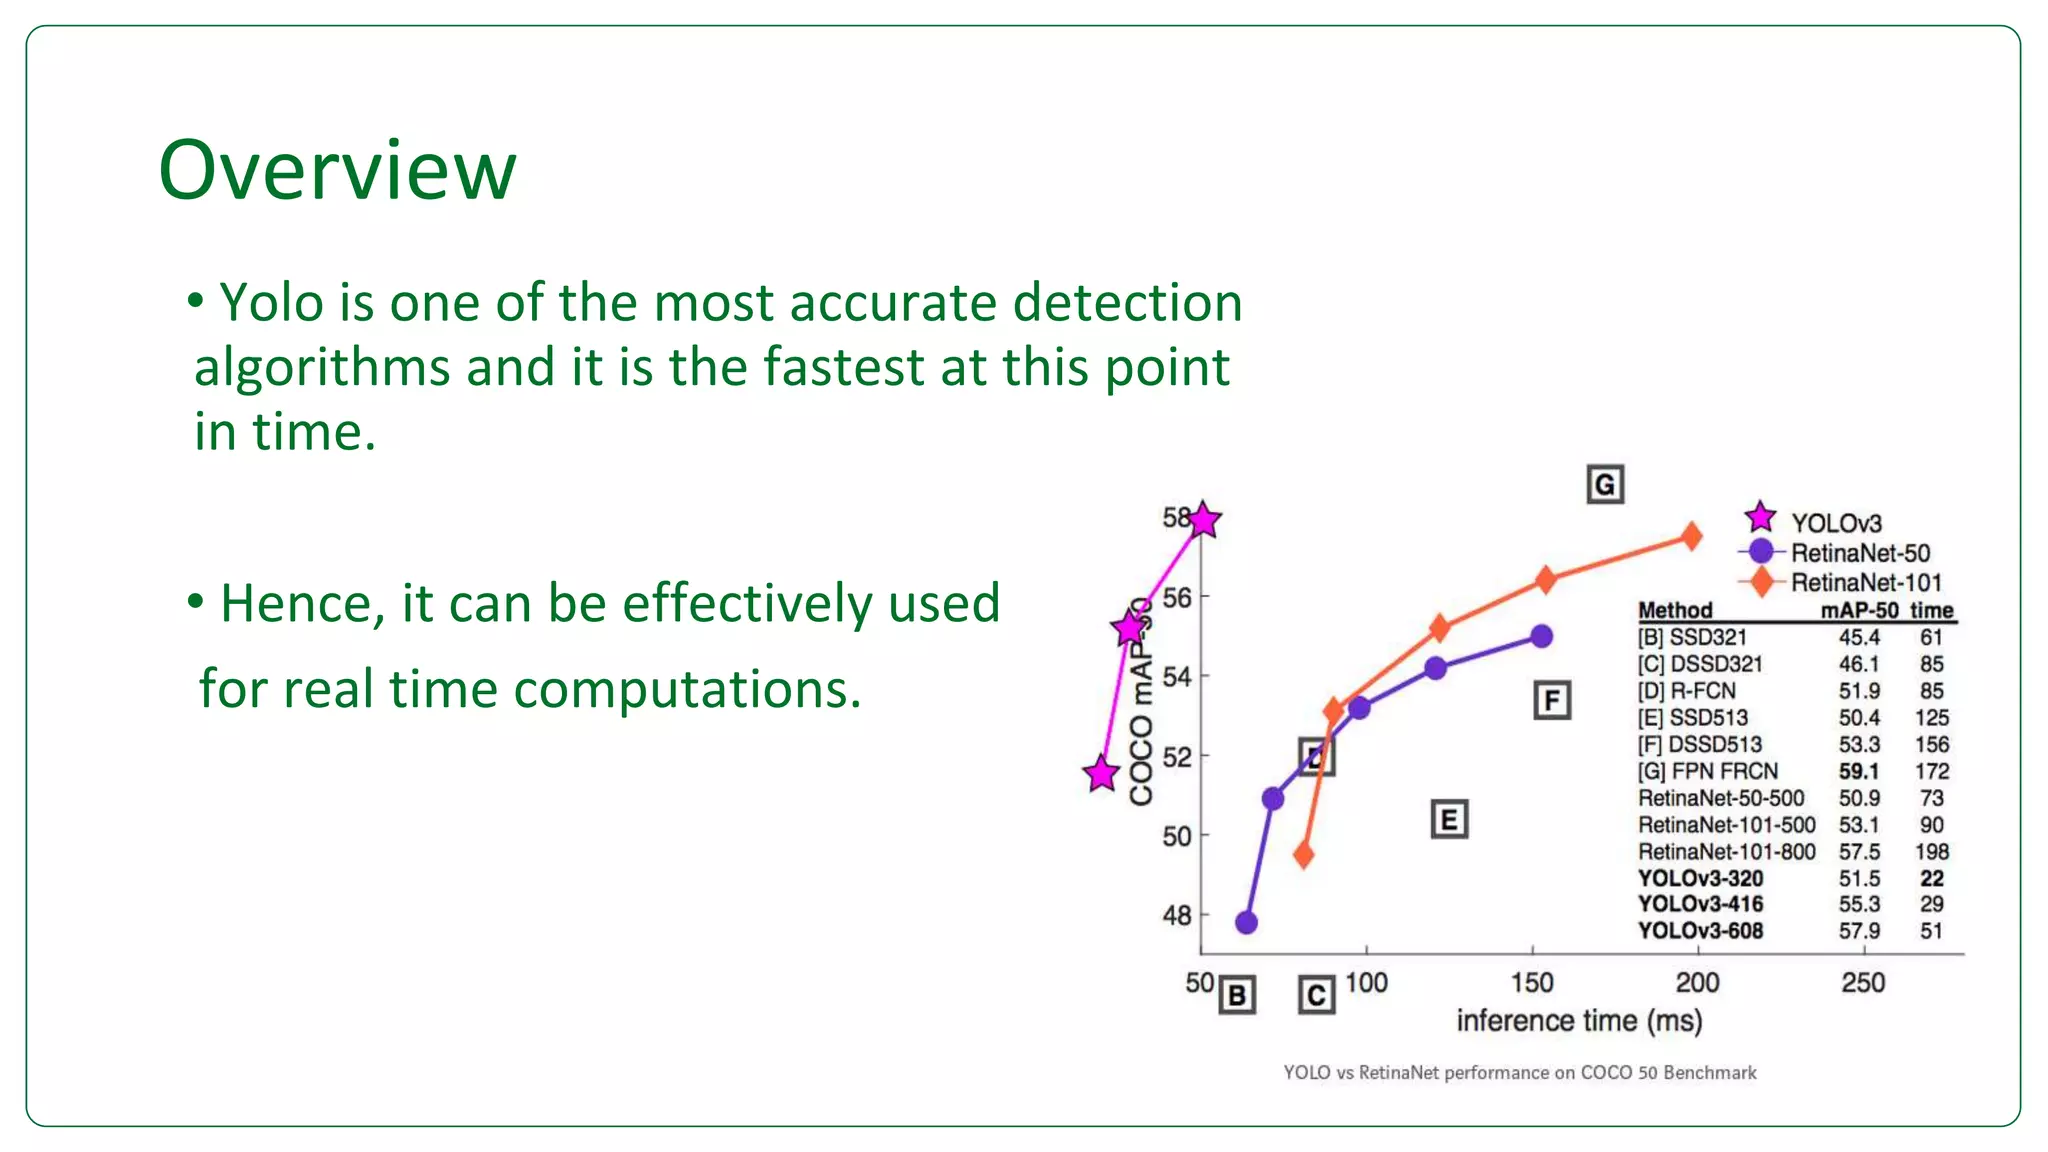
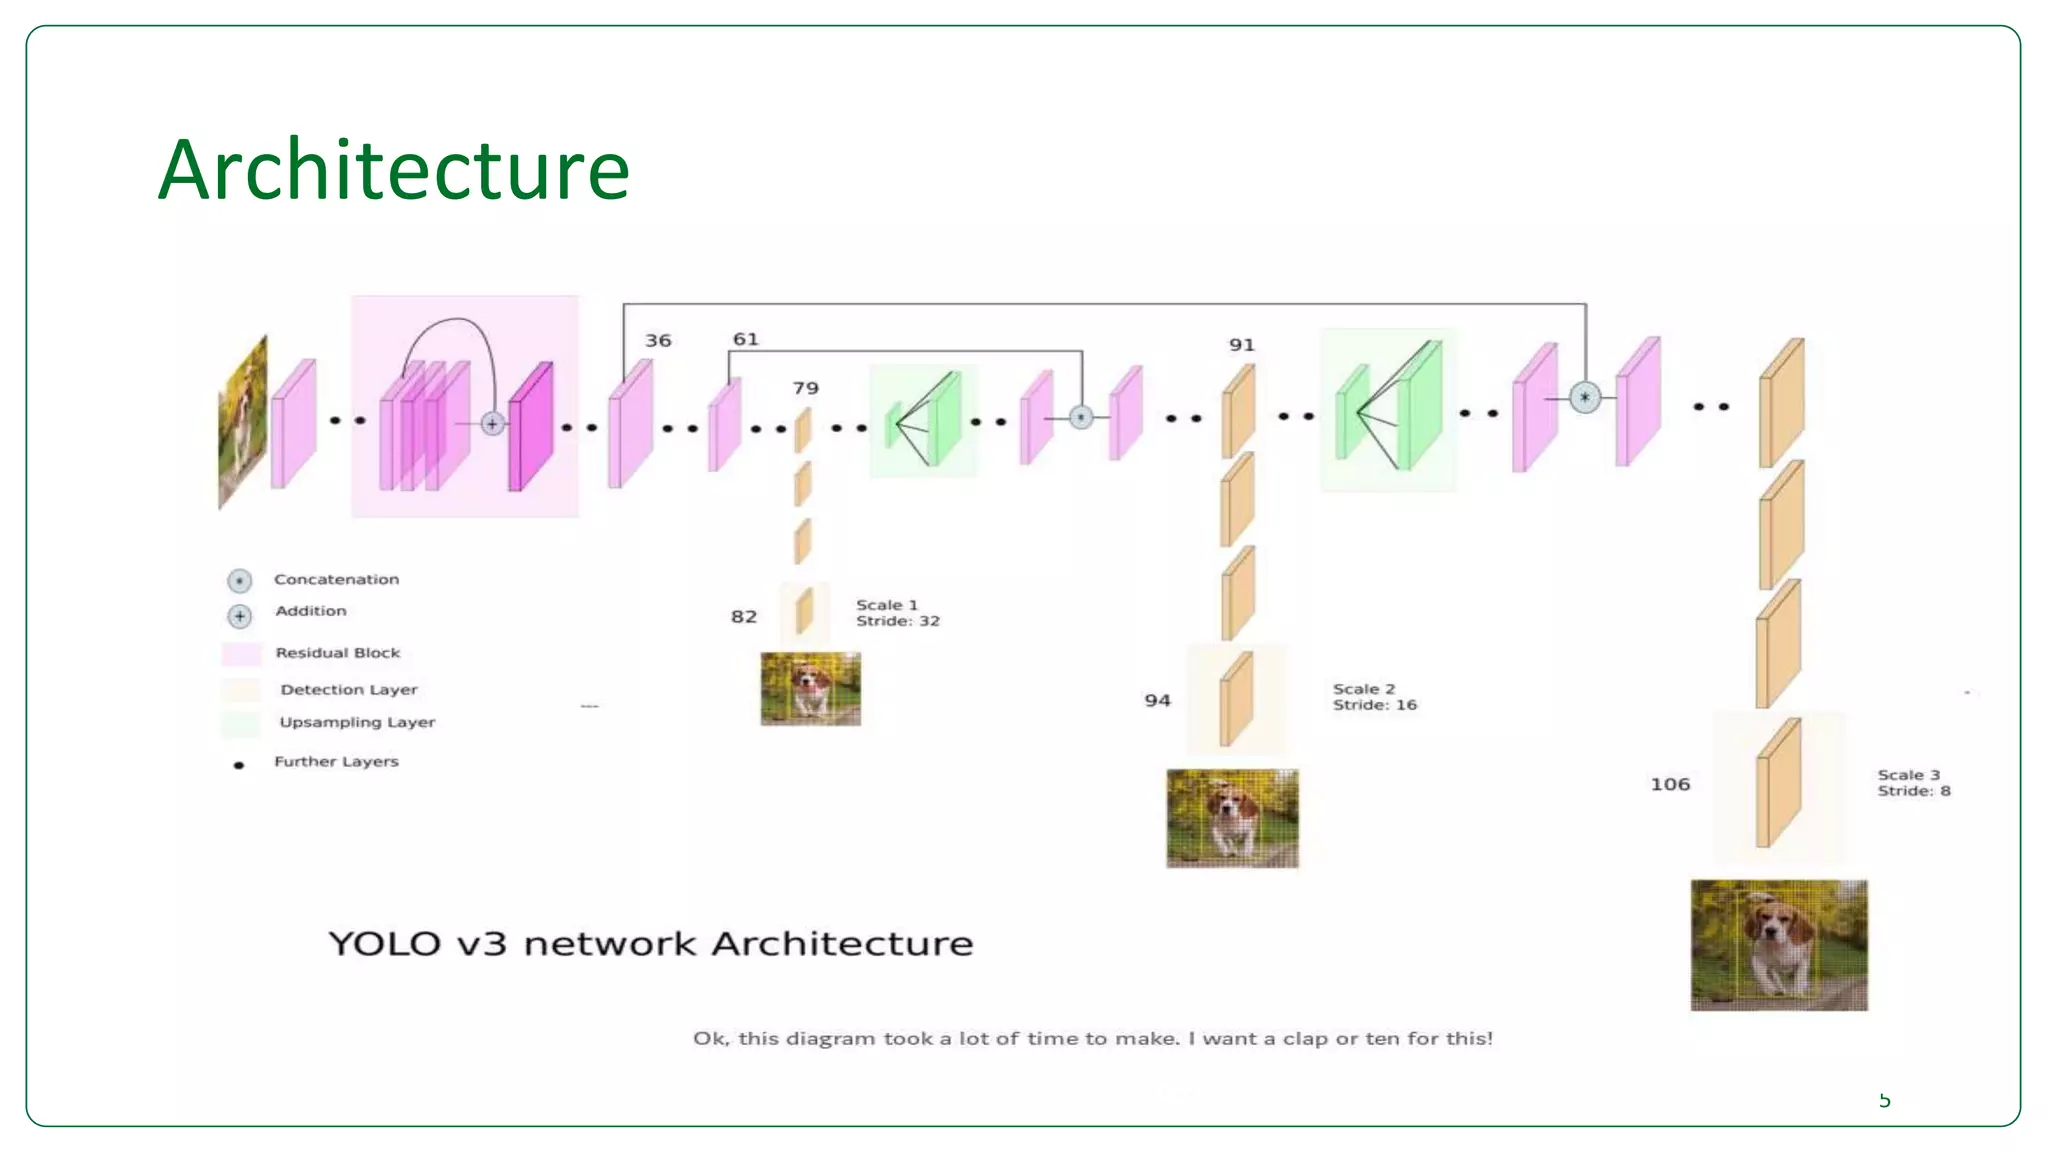
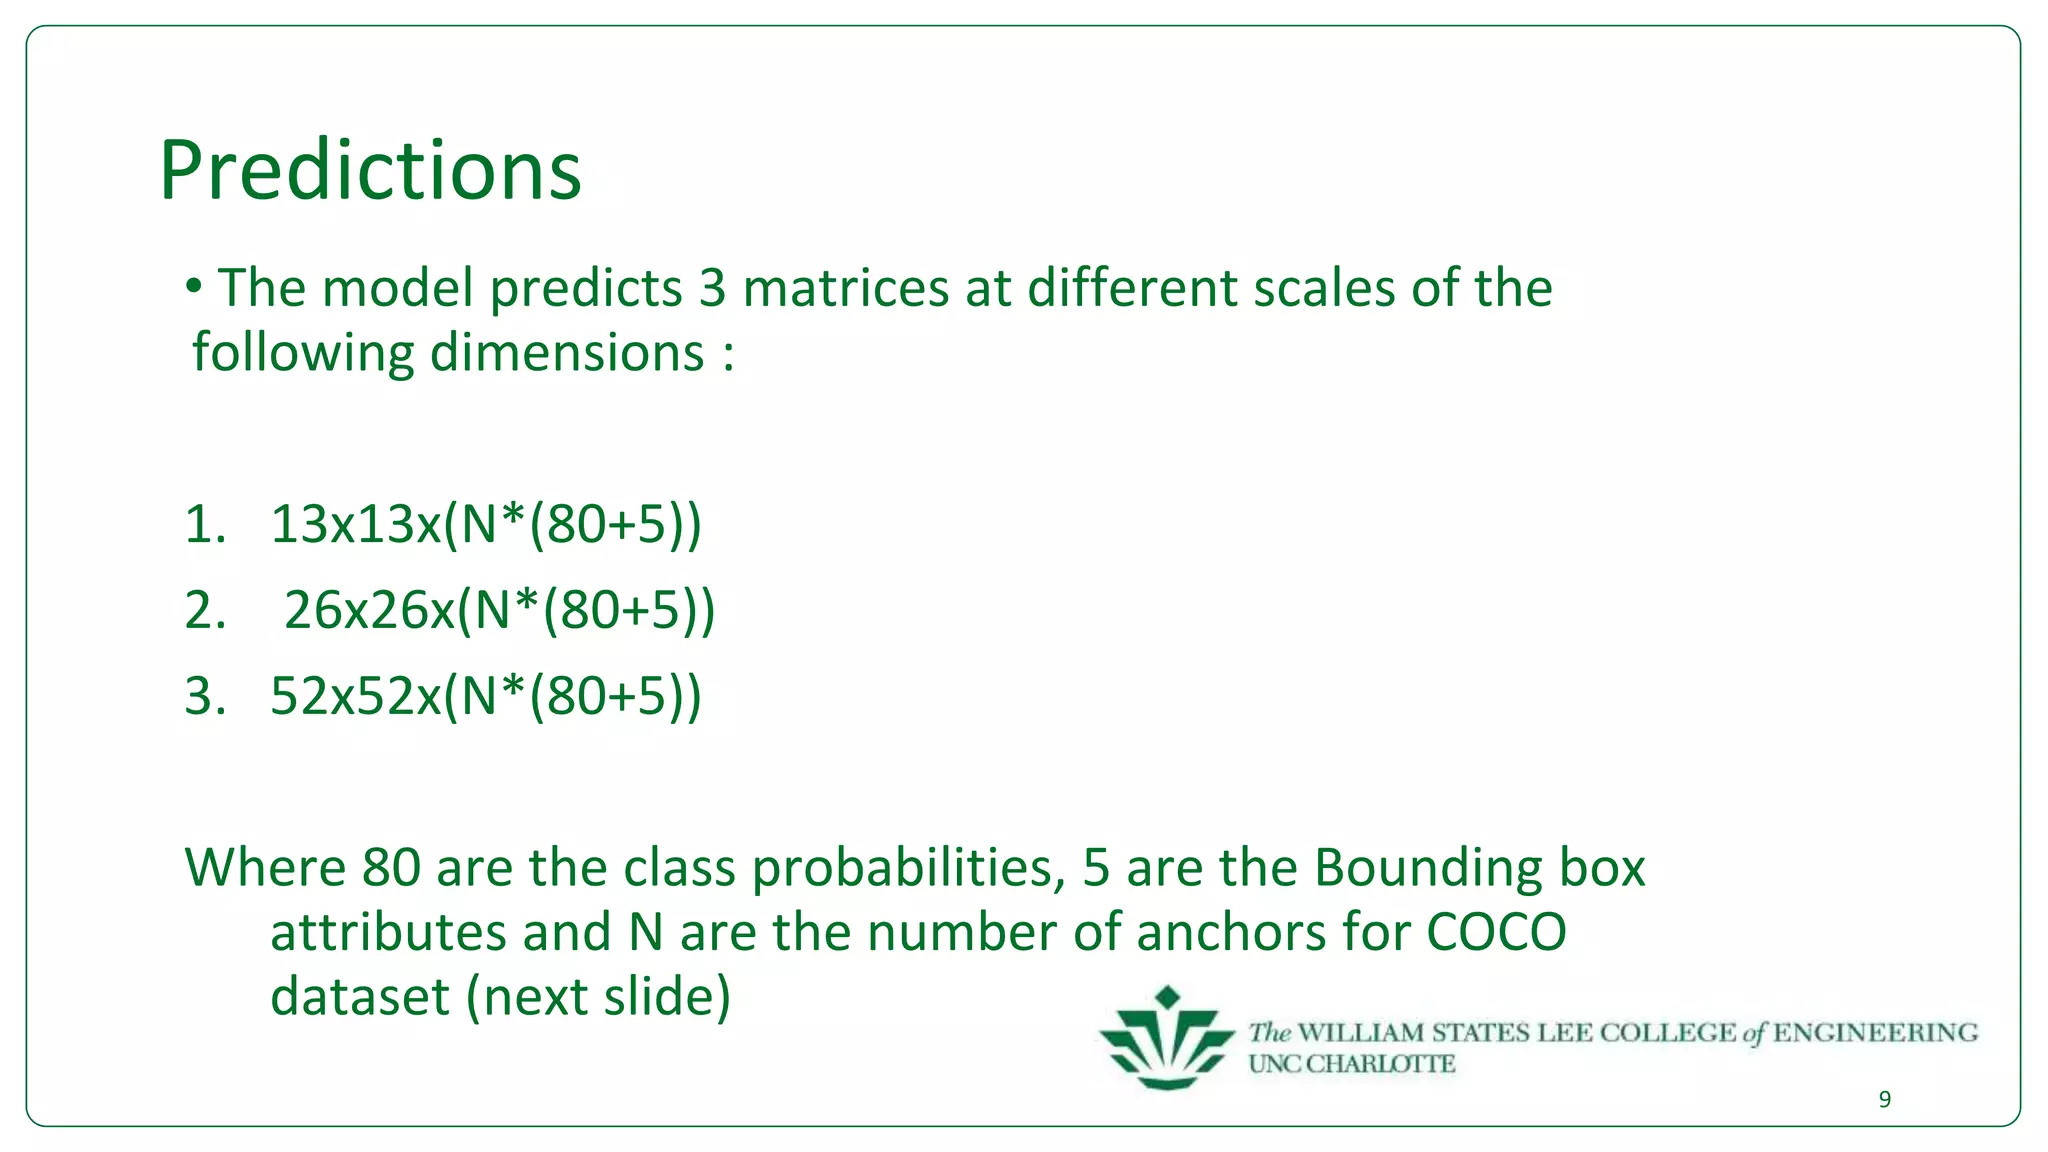
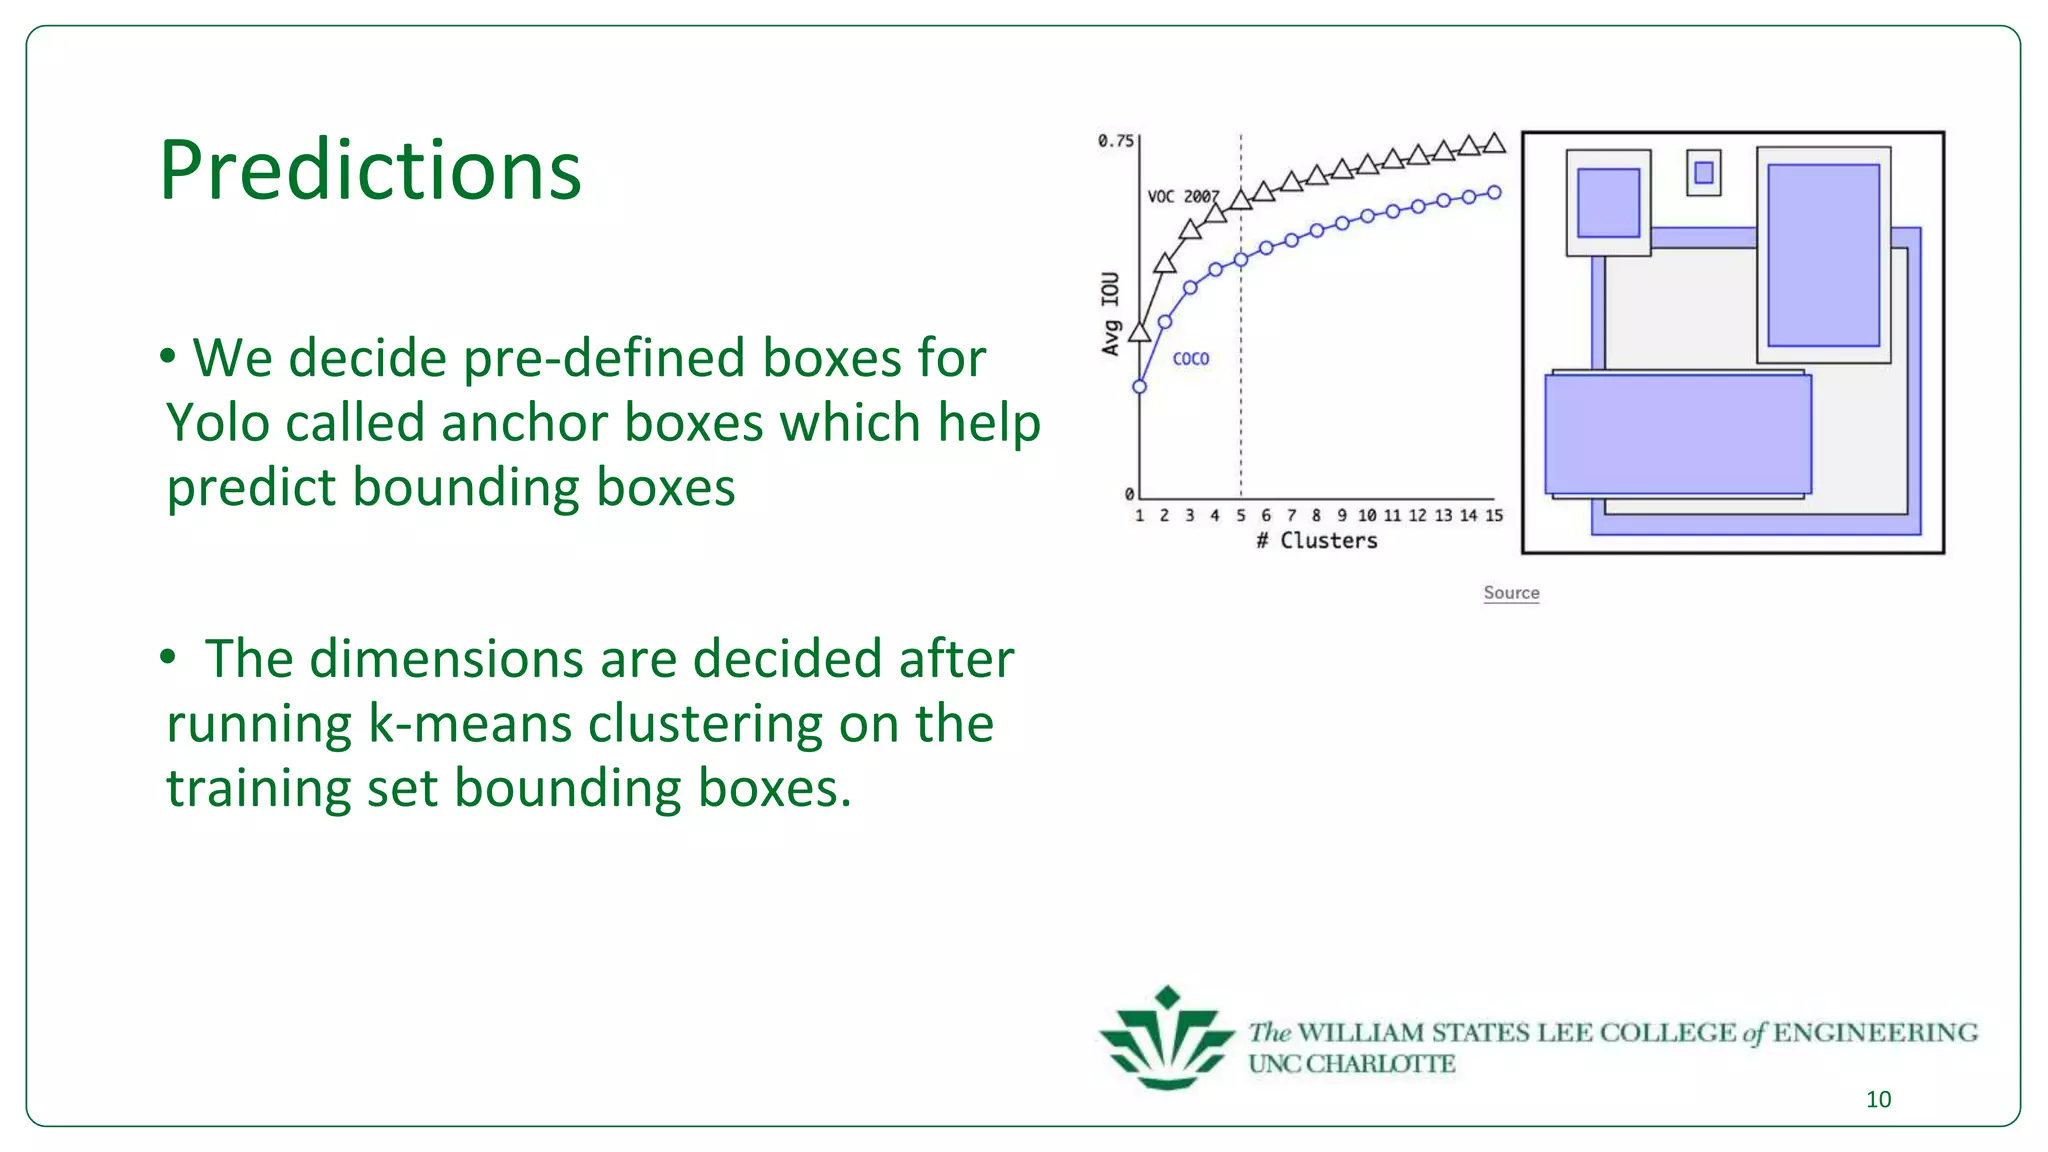
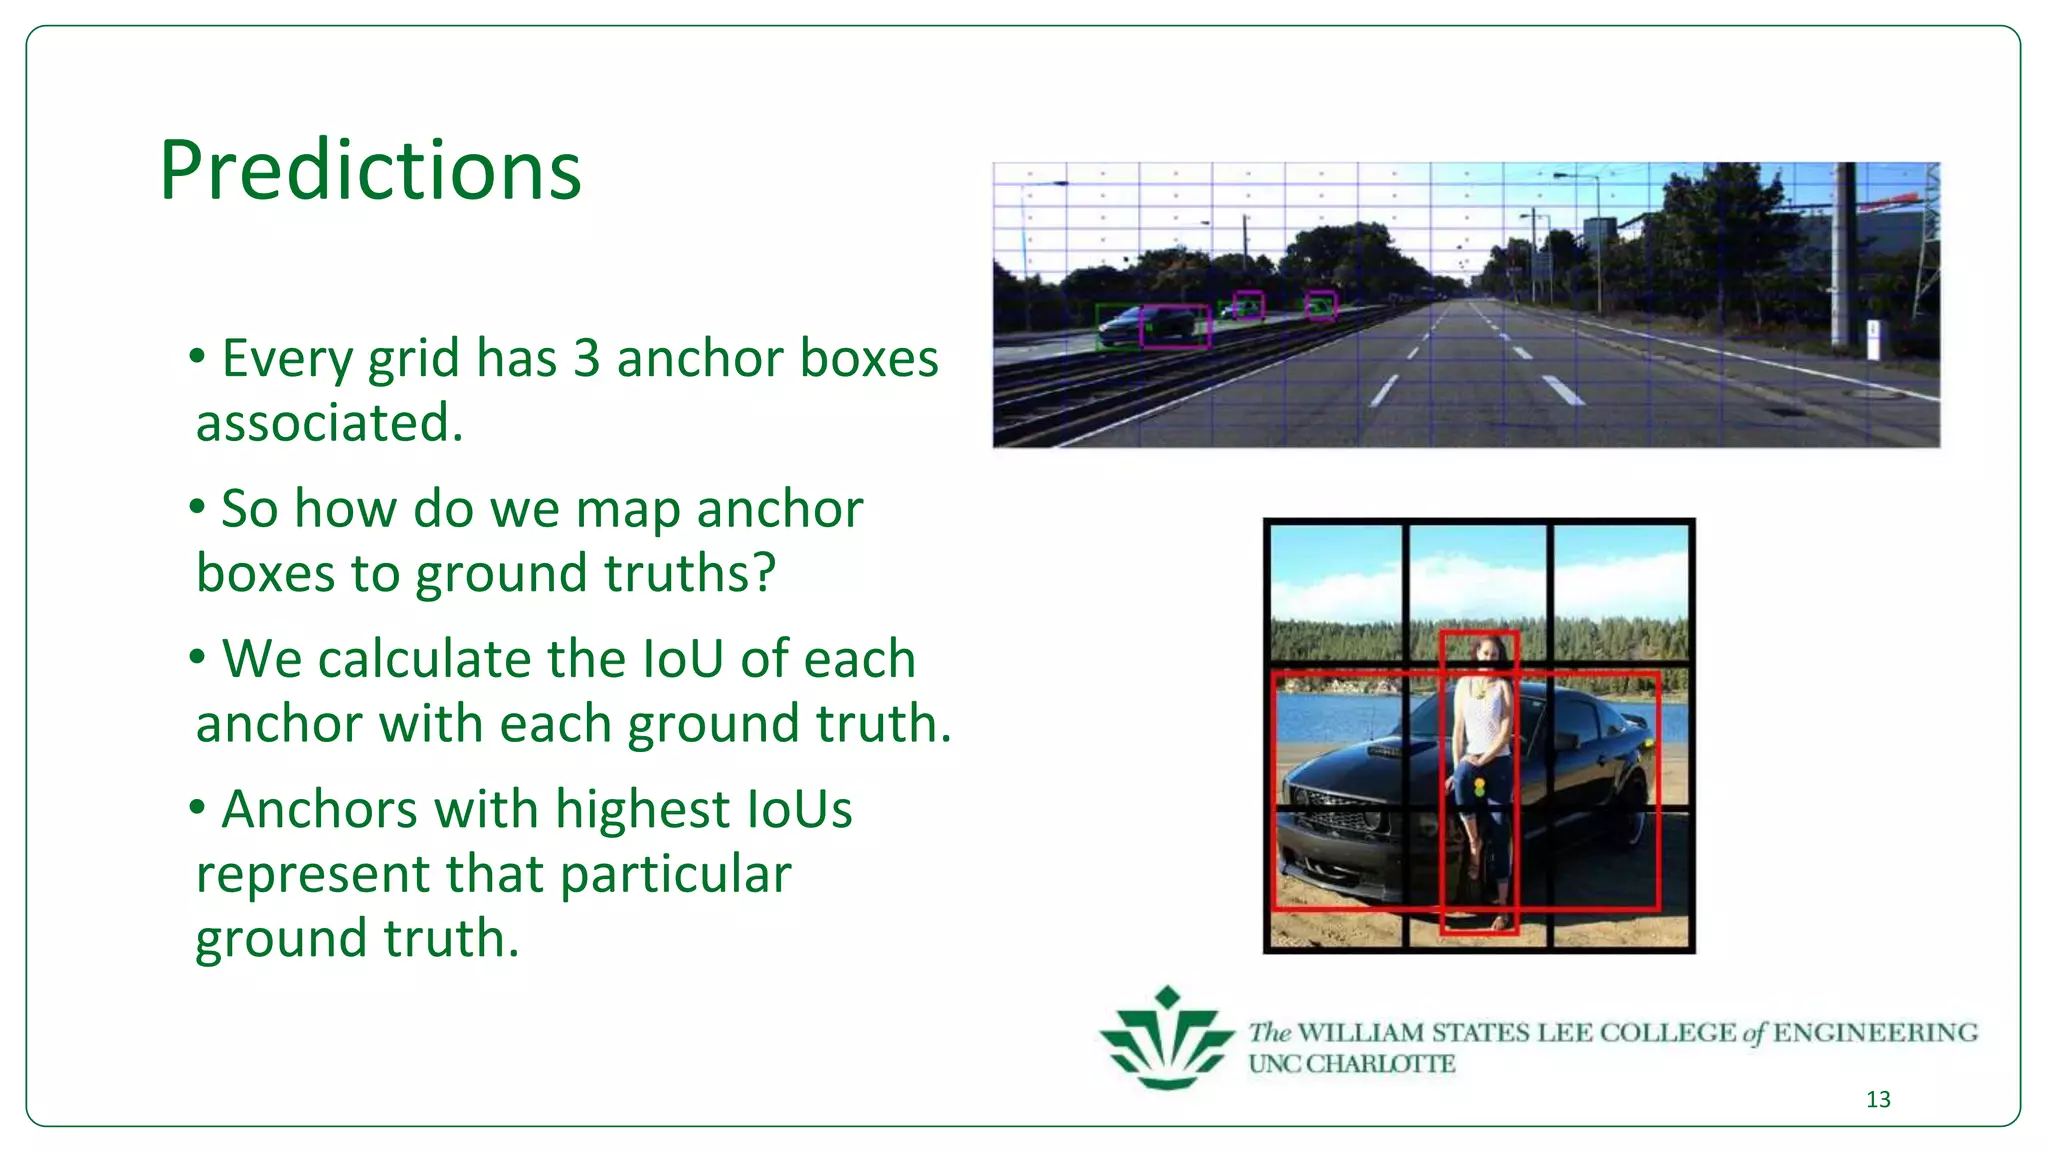
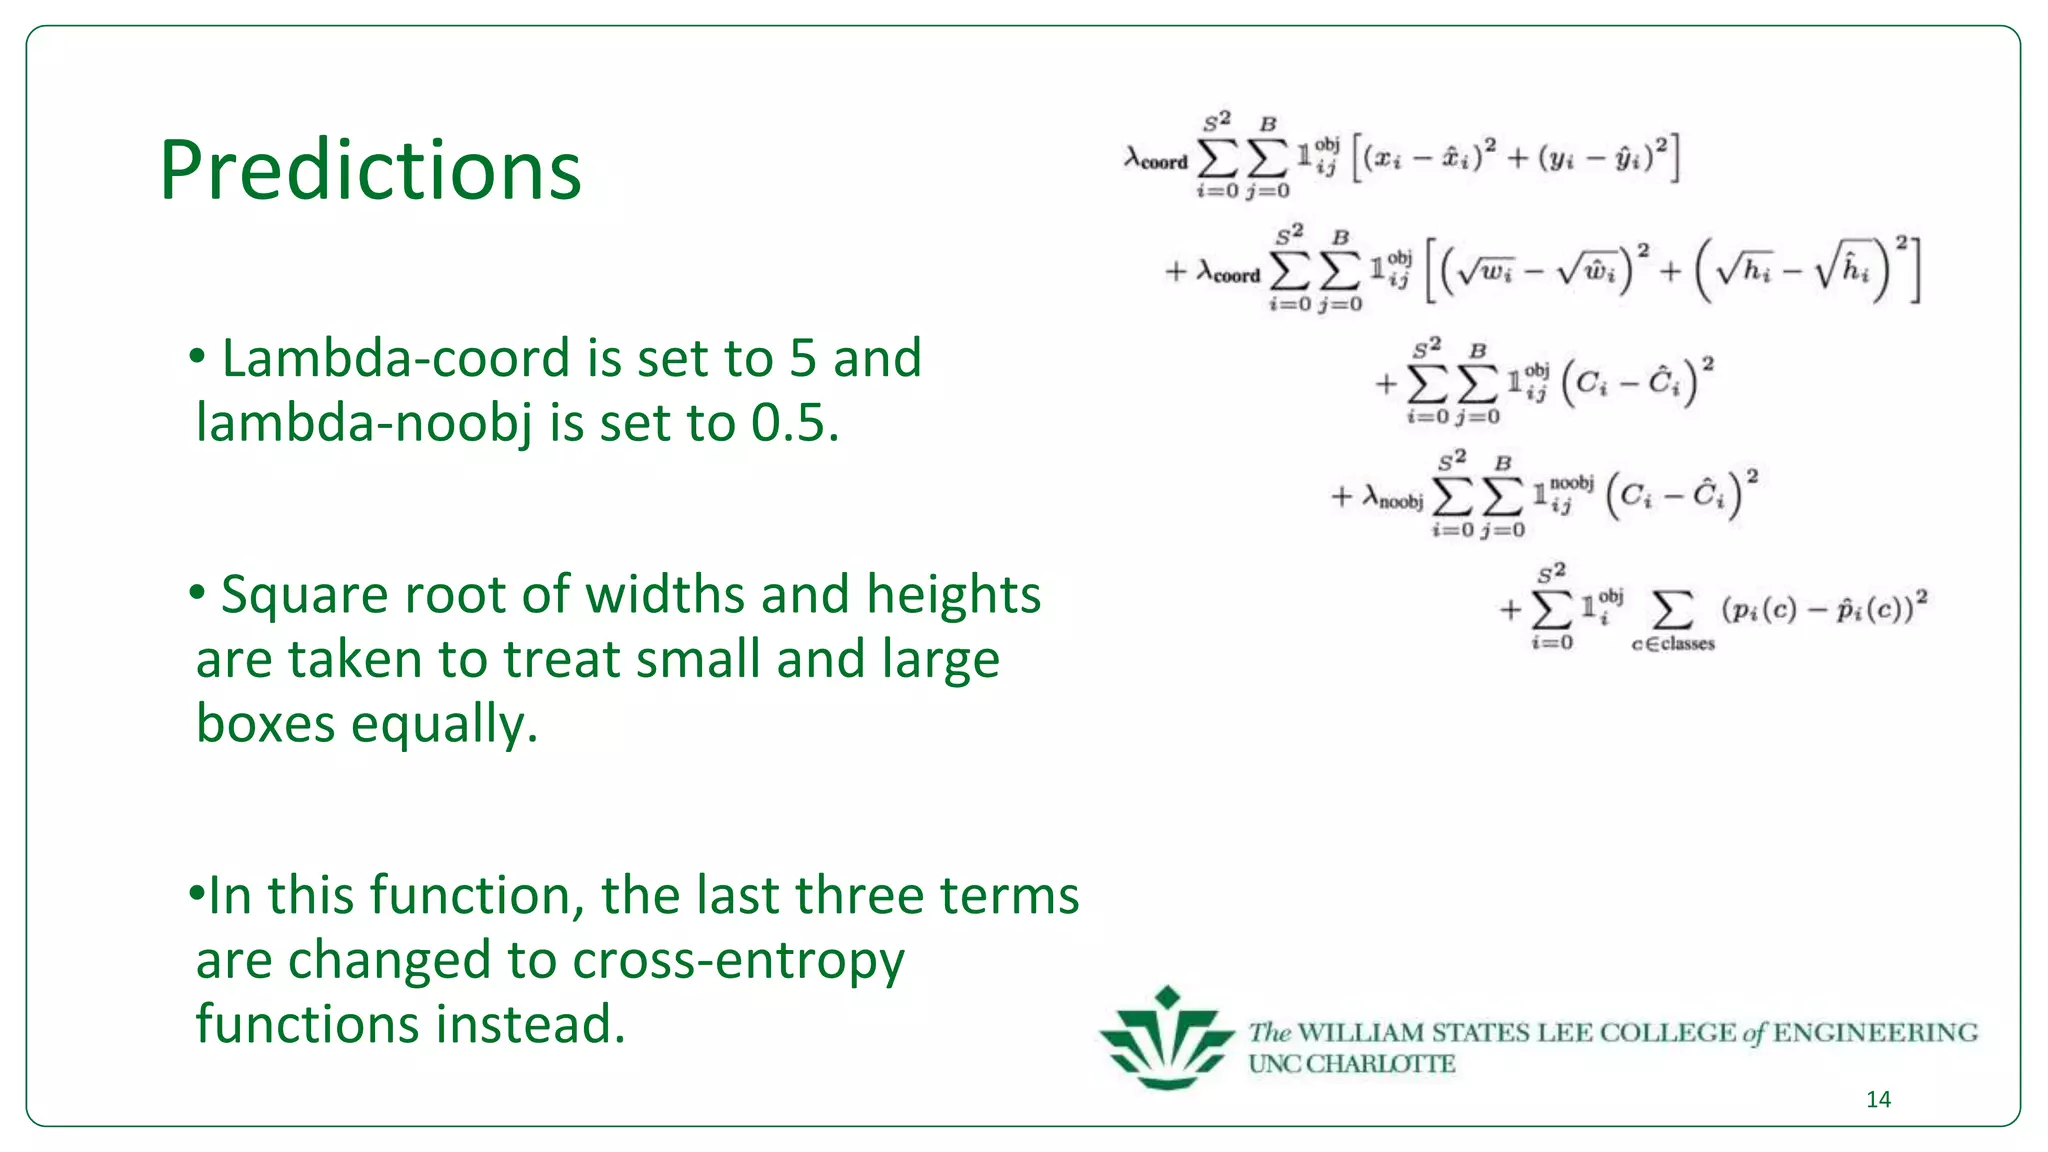
TECSAR
Transformative Computer Systems
and Architecture Research
YOLO
Wednesday, October 10, 2018
Shrey Mohan
1
Points to be discussed
• Overview
• Architecture
• Training
• Predictions
• Performance
• Current work
2
Overview
• Yolo is an end to end convolutional
network for object localization and
classification.
•It only looks at the image once and to
make predictions, hence the name
becomes You Only Look Once(YOLO).
3
Overview
• Yolo is one of the most accurate detection
algorithms and it is the fastest at this point
in time.
• Hence, it can be effectively used
for real time computations.
4
Architecture
5
Architecture
• Yolo uses Darknet-53 which has
53 Convolution layers.
• This deeper backbone network
thus gives a better mAP.
• Furthering detections to 3
scales also improves the mAP.
6
Training Yolo
• Various techniques were used :
1. Different resolutions were used, 320, 352,….,608.
2. Batch normalization was used after convolving.
3. Unified datasets were used for training (next slide).
7
Training Yolo
• ImageNet and COCO datasets are
merged.
• This helps the model to detect
more specialized objects.
• The model may also detect
objects it has never seen before.
8
Predictions
• The model predicts 3 matrices at different scales of the
following dimensions :
1. 13x13x(N*(80+5))
2. 26x26x(N*(80+5))
3. 52x52x(N*(80+5))
Where 80 are the class probabilities, 5 are the Bounding box
attributes and N are the number of anchors for COCO
dataset (next slide)
9
Predictions
• We decide pre-defined boxes for
Yolo called anchor boxes which help
predict bounding boxes
• The dimensions are decided after
running k-means clustering on the
training set bounding boxes.
10
Predictions
• 3 anchor boxes are defined for
Yolo (v3) per grid cell.
• For each anchor box, model
gives tx, ty, tw, th, po and 80 class
probabilities.
• These parameters help predict
locations of bounding boxes
(next slide).
11
Predictions
• As seen in the equations tx, ty,
tw and th are the offsets to the
anchor boxes.
• This is done for each of the
anchor boxes defined (3 here).
12
Predictions
• Every grid has 3 anchor boxes
associated.
• So how do we map anchor
boxes to ground truths?
• We calculate the IoU of each
anchor with each ground truth.
• Anchors with highest IoUs
represent that particular
ground truth.
13
Predictions
• Lambda-coord is set to 5 and
lambda-noobj is set to 0.5.
• Square root of widths and heights
are taken to treat small and large
boxes equally.
•In this function, the last three terms
are changed to cross-entropy
functions instead.
14
Performance
• There is always a trade-off
between accuracy and speed.
• While yolov2 ran on 45 fps on a
titan X, yolov3 runs about 30
fps.
15
Results
• This video
shows
detections by
Yolo on the
MOT-16
benchmark.
16

Yolov3

  • 1.
    TECSAR Transformative Computer Systems andArchitecture Research YOLO Wednesday, October 10, 2018 Shrey Mohan 1
  • 2.
    Points to bediscussed • Overview • Architecture • Training • Predictions • Performance • Current work 2
  • 3.
    Overview • Yolo isan end to end convolutional network for object localization and classification. •It only looks at the image once and to make predictions, hence the name becomes You Only Look Once(YOLO). 3
  • 4.
    Overview • Yolo isone of the most accurate detection algorithms and it is the fastest at this point in time. • Hence, it can be effectively used for real time computations. 4
  • 5.
  • 6.
    Architecture • Yolo usesDarknet-53 which has 53 Convolution layers. • This deeper backbone network thus gives a better mAP. • Furthering detections to 3 scales also improves the mAP. 6
  • 7.
    Training Yolo • Varioustechniques were used : 1. Different resolutions were used, 320, 352,….,608. 2. Batch normalization was used after convolving. 3. Unified datasets were used for training (next slide). 7
  • 8.
    Training Yolo • ImageNetand COCO datasets are merged. • This helps the model to detect more specialized objects. • The model may also detect objects it has never seen before. 8
  • 9.
    Predictions • The modelpredicts 3 matrices at different scales of the following dimensions : 1. 13x13x(N*(80+5)) 2. 26x26x(N*(80+5)) 3. 52x52x(N*(80+5)) Where 80 are the class probabilities, 5 are the Bounding box attributes and N are the number of anchors for COCO dataset (next slide) 9
  • 10.
    Predictions • We decidepre-defined boxes for Yolo called anchor boxes which help predict bounding boxes • The dimensions are decided after running k-means clustering on the training set bounding boxes. 10
  • 11.
    Predictions • 3 anchorboxes are defined for Yolo (v3) per grid cell. • For each anchor box, model gives tx, ty, tw, th, po and 80 class probabilities. • These parameters help predict locations of bounding boxes (next slide). 11
  • 12.
    Predictions • As seenin the equations tx, ty, tw and th are the offsets to the anchor boxes. • This is done for each of the anchor boxes defined (3 here). 12
  • 13.
    Predictions • Every gridhas 3 anchor boxes associated. • So how do we map anchor boxes to ground truths? • We calculate the IoU of each anchor with each ground truth. • Anchors with highest IoUs represent that particular ground truth. 13
  • 14.
    Predictions • Lambda-coord isset to 5 and lambda-noobj is set to 0.5. • Square root of widths and heights are taken to treat small and large boxes equally. •In this function, the last three terms are changed to cross-entropy functions instead. 14
  • 15.
    Performance • There isalways a trade-off between accuracy and speed. • While yolov2 ran on 45 fps on a titan X, yolov3 runs about 30 fps. 15
  • 16.
    Results • This video shows detectionsby Yolo on the MOT-16 benchmark. 16