Download to read offline
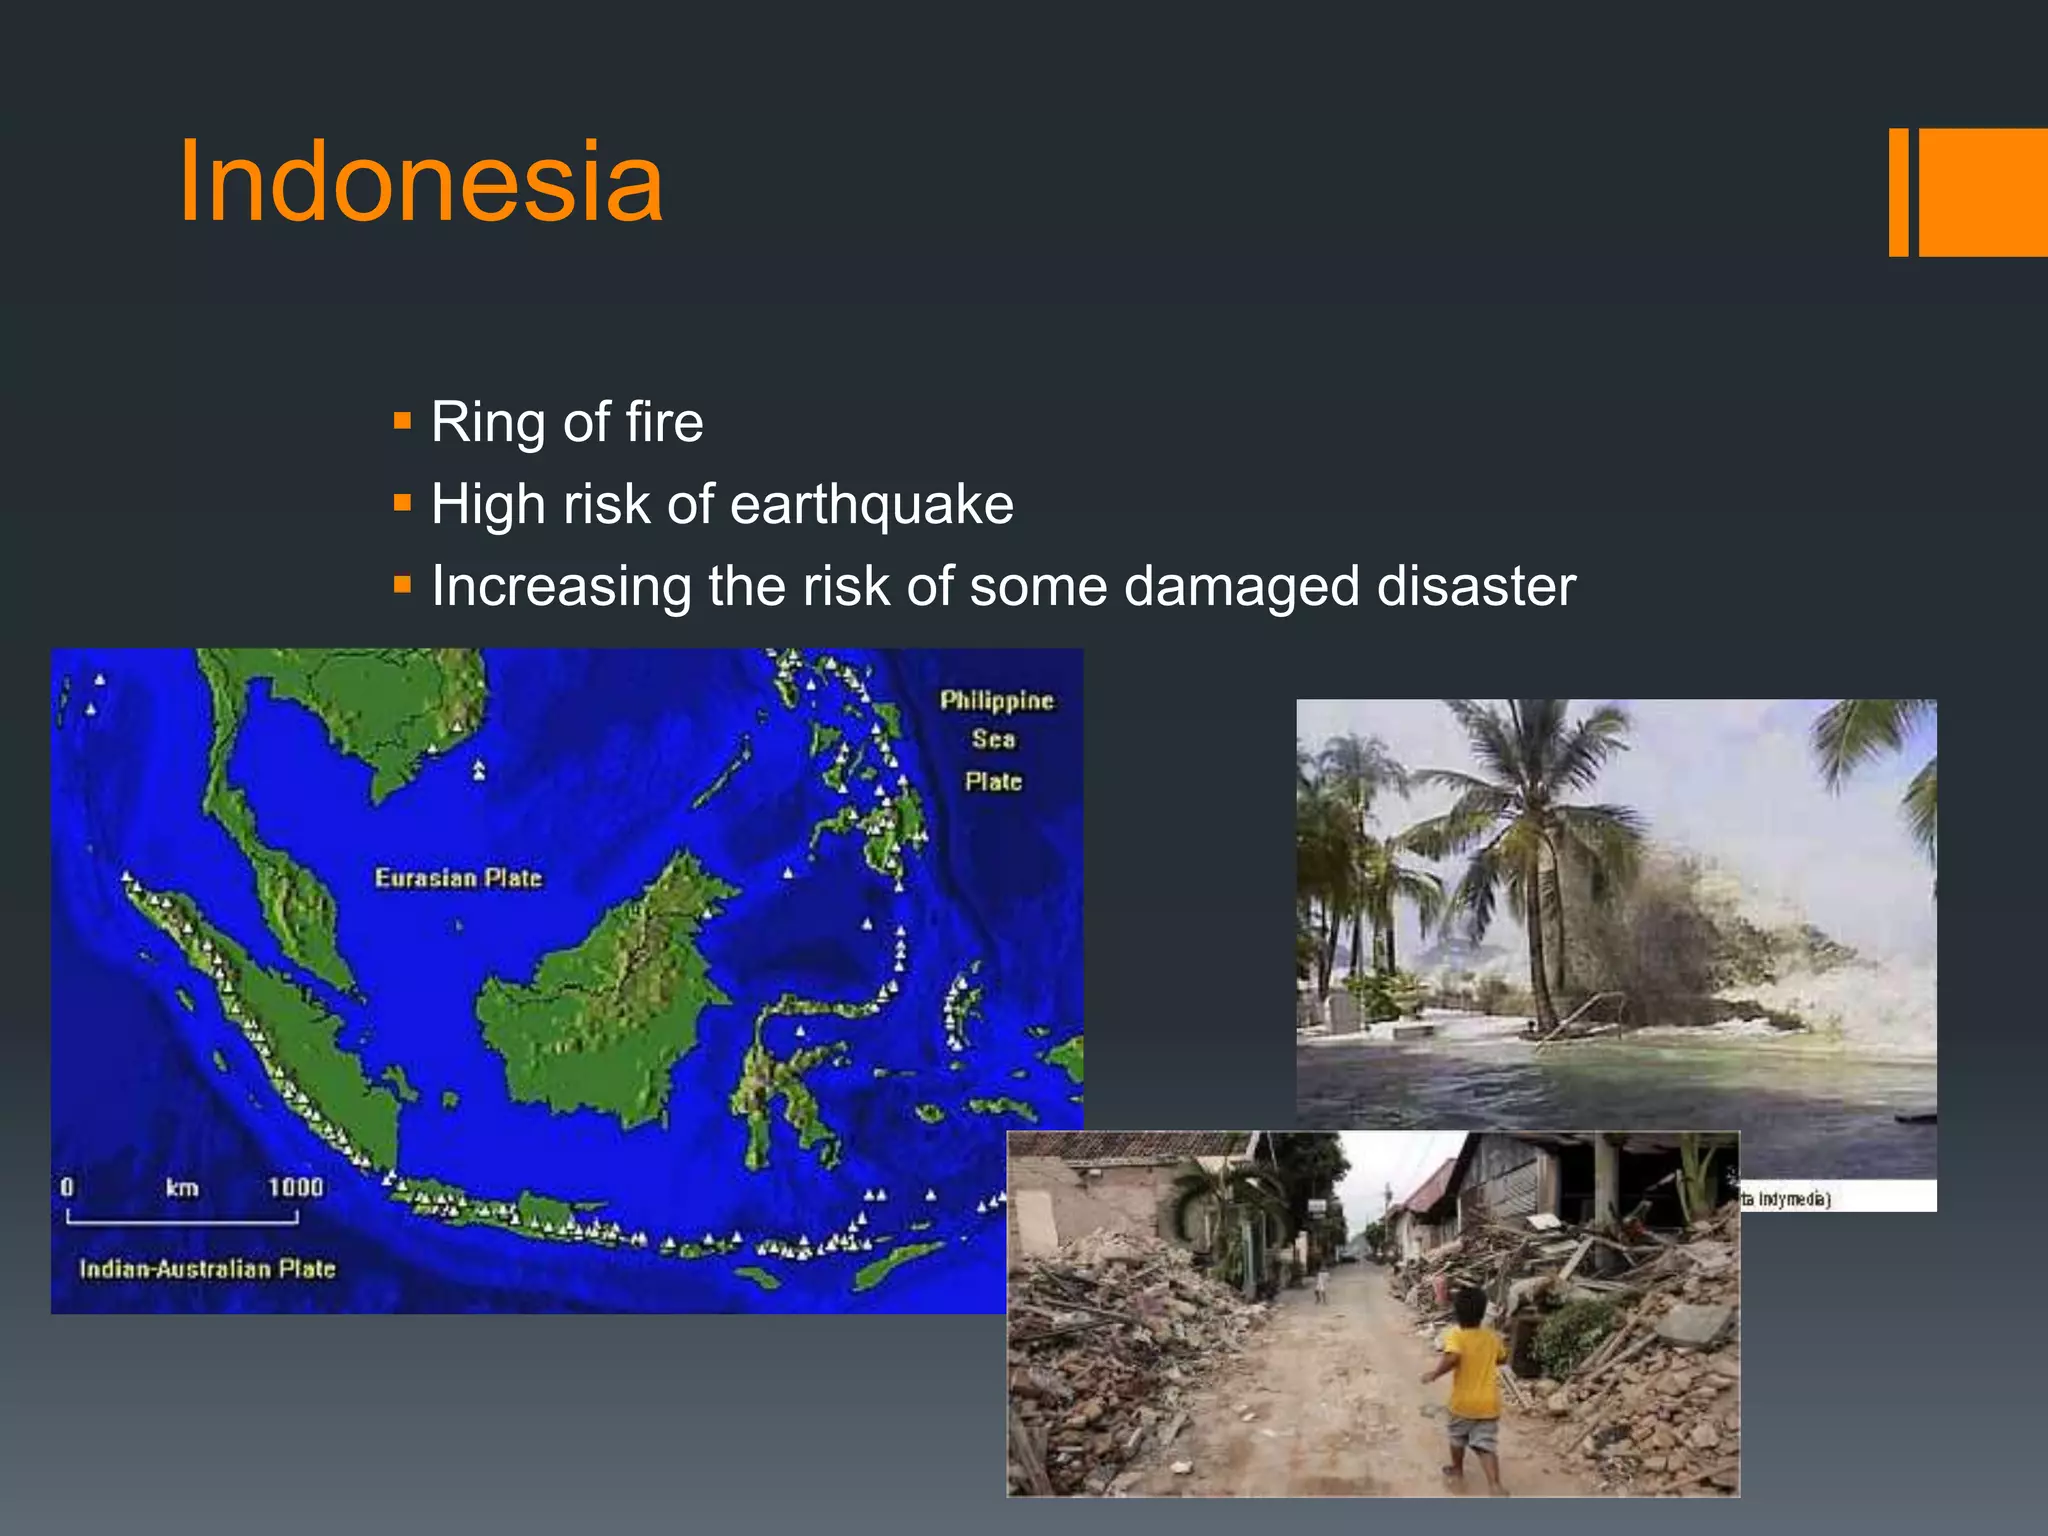
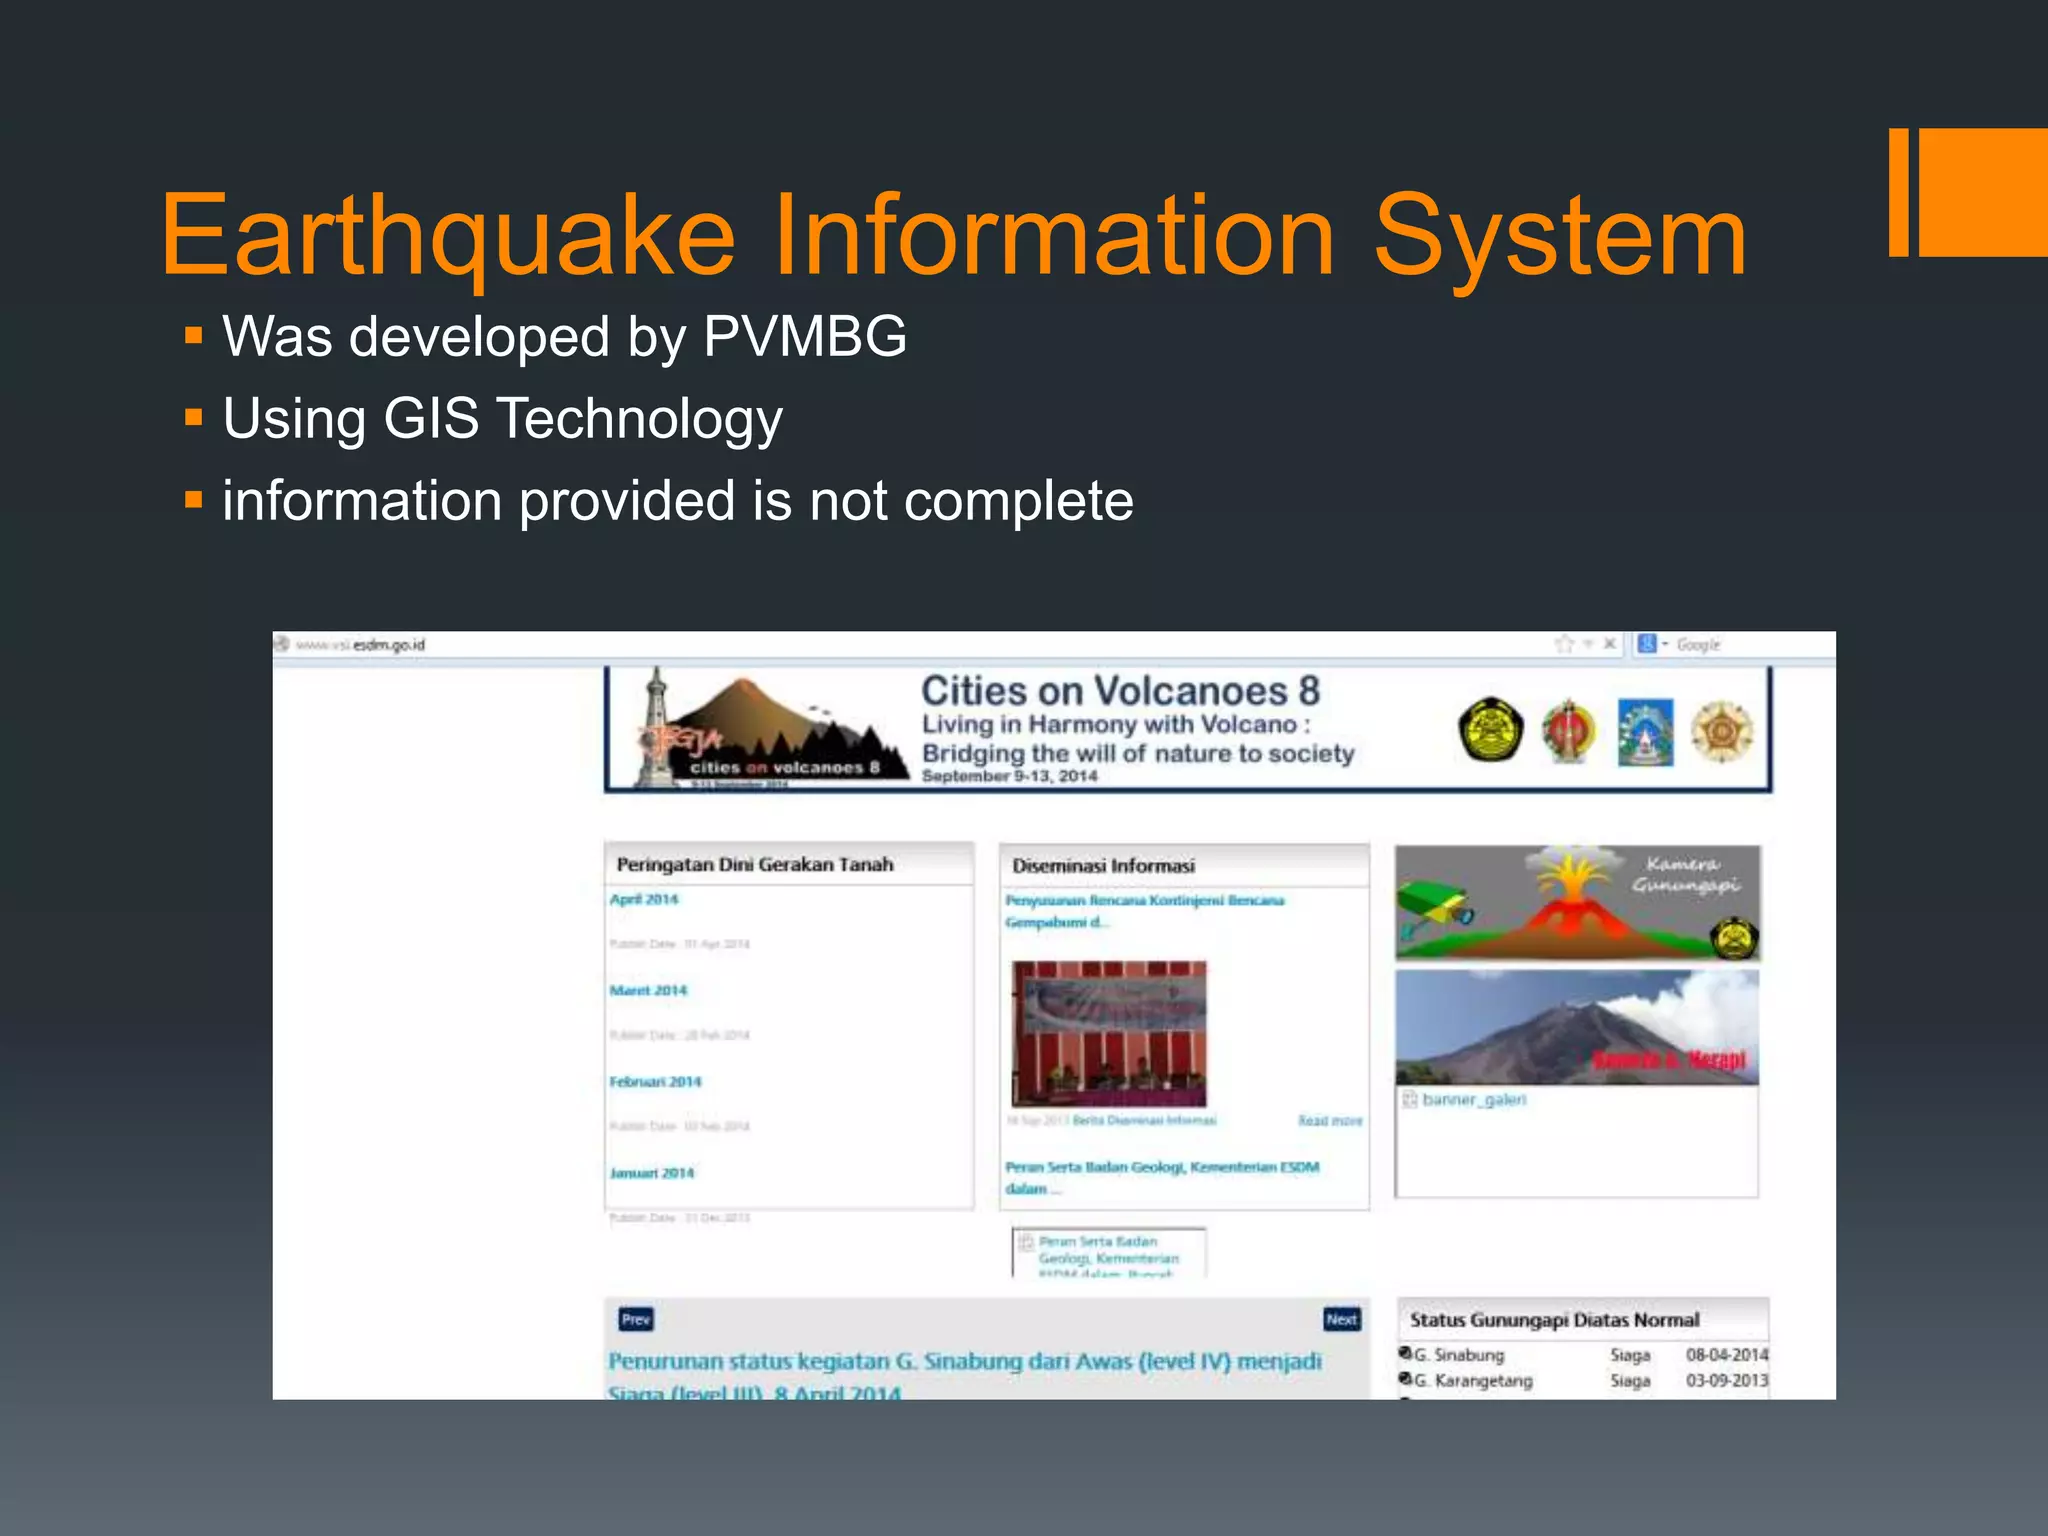
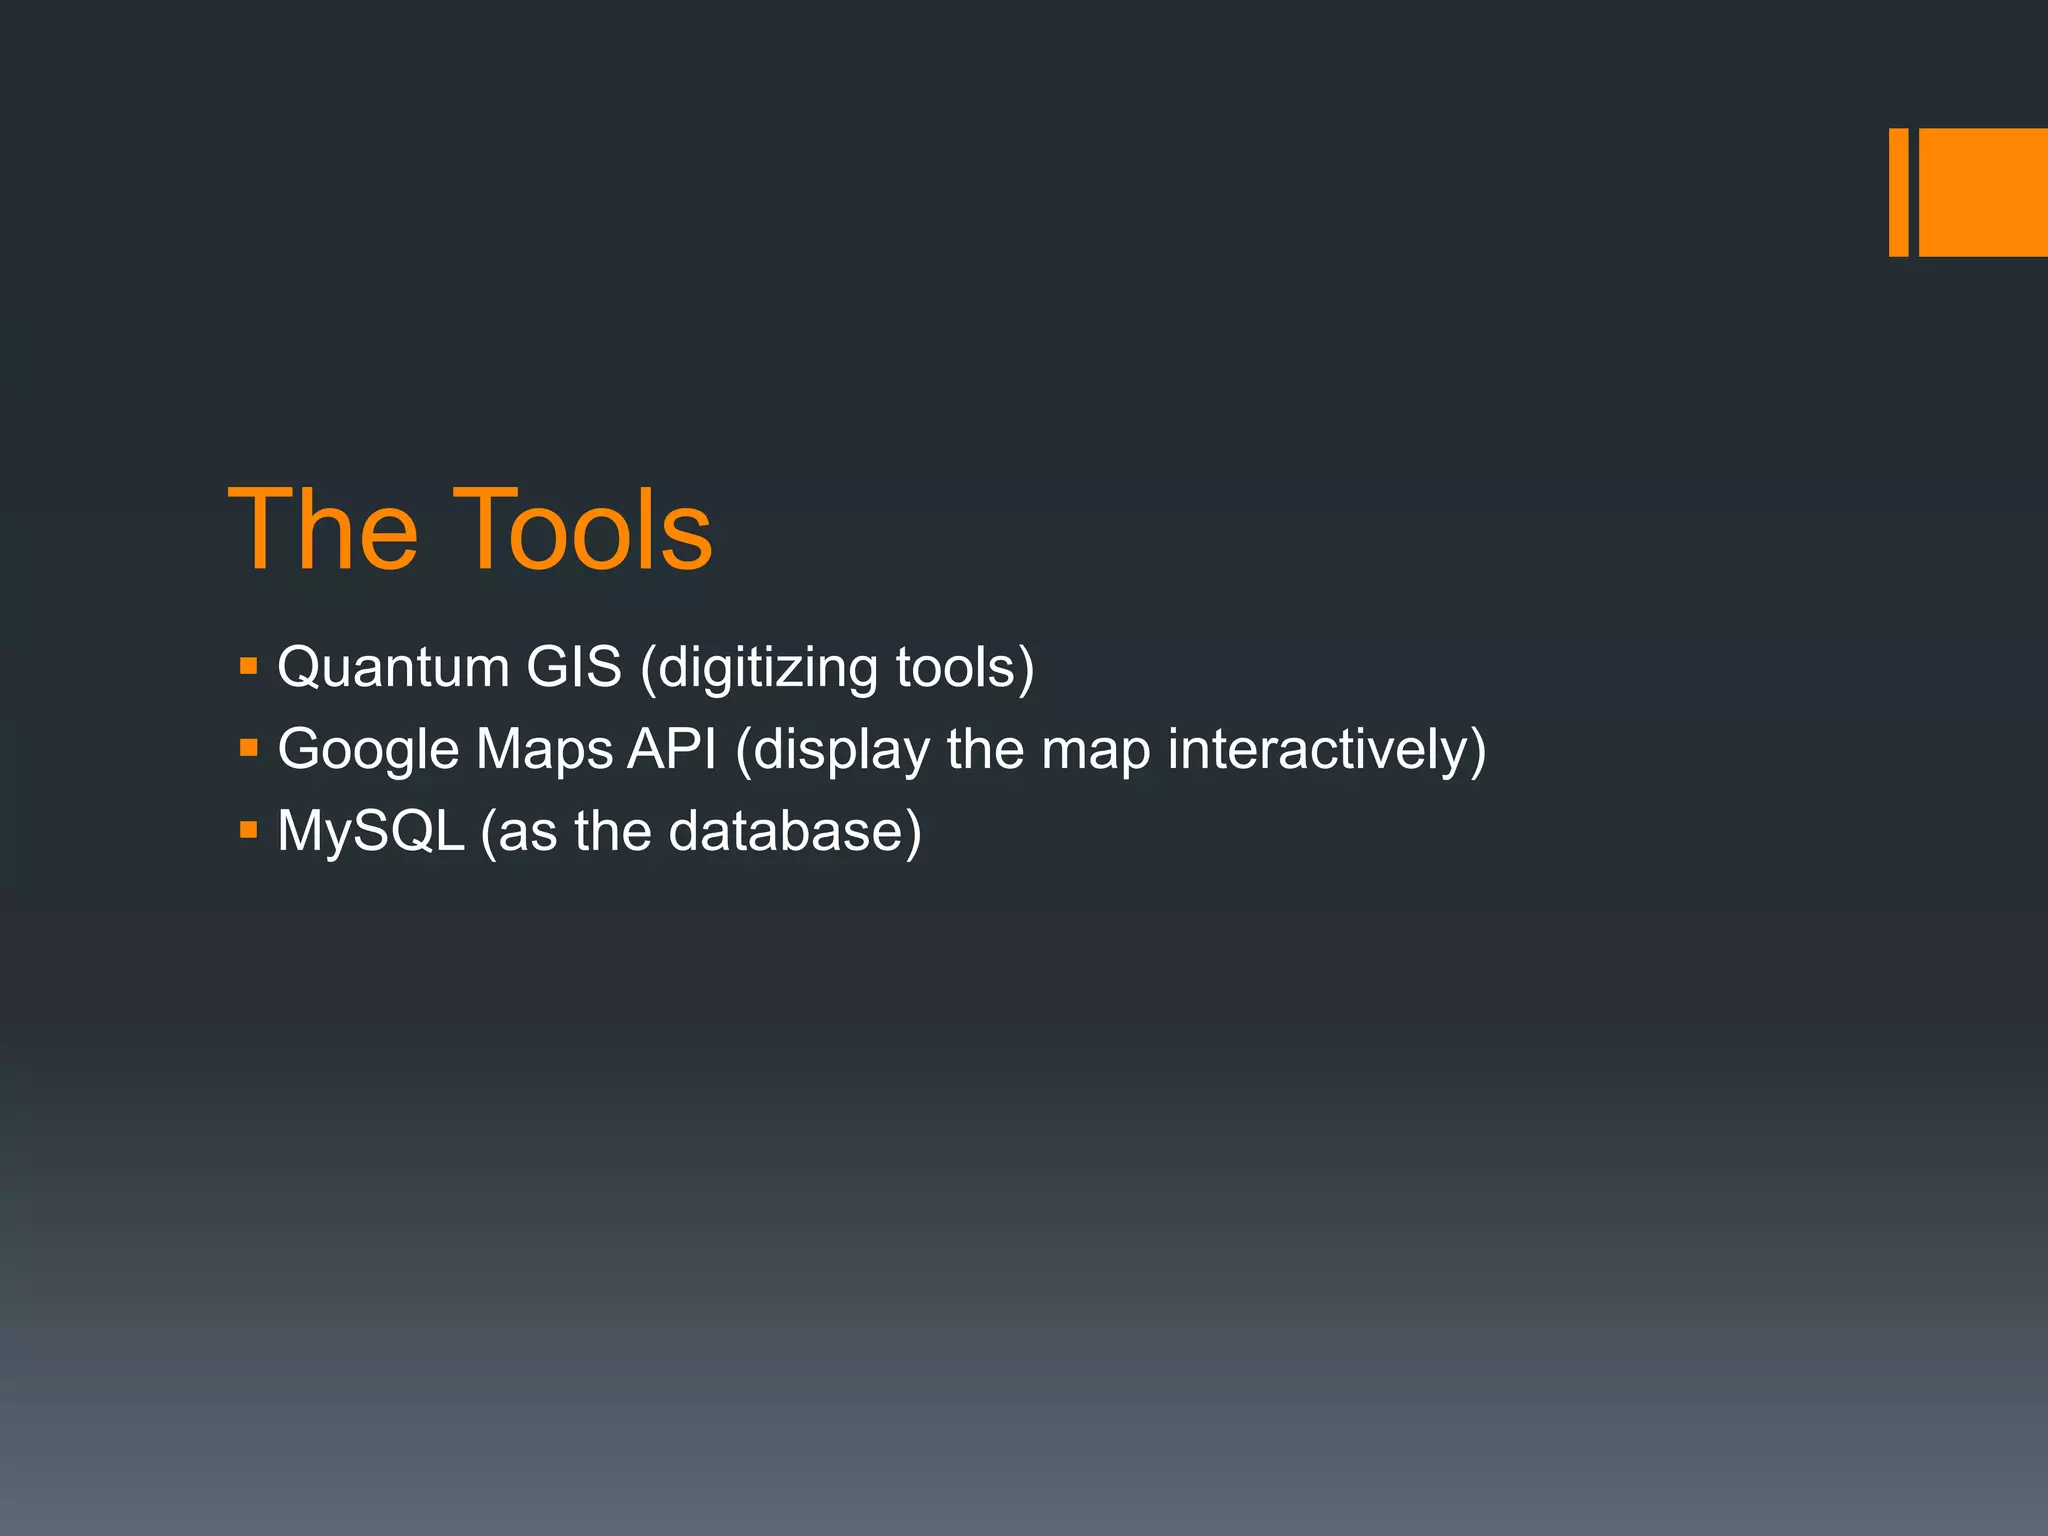

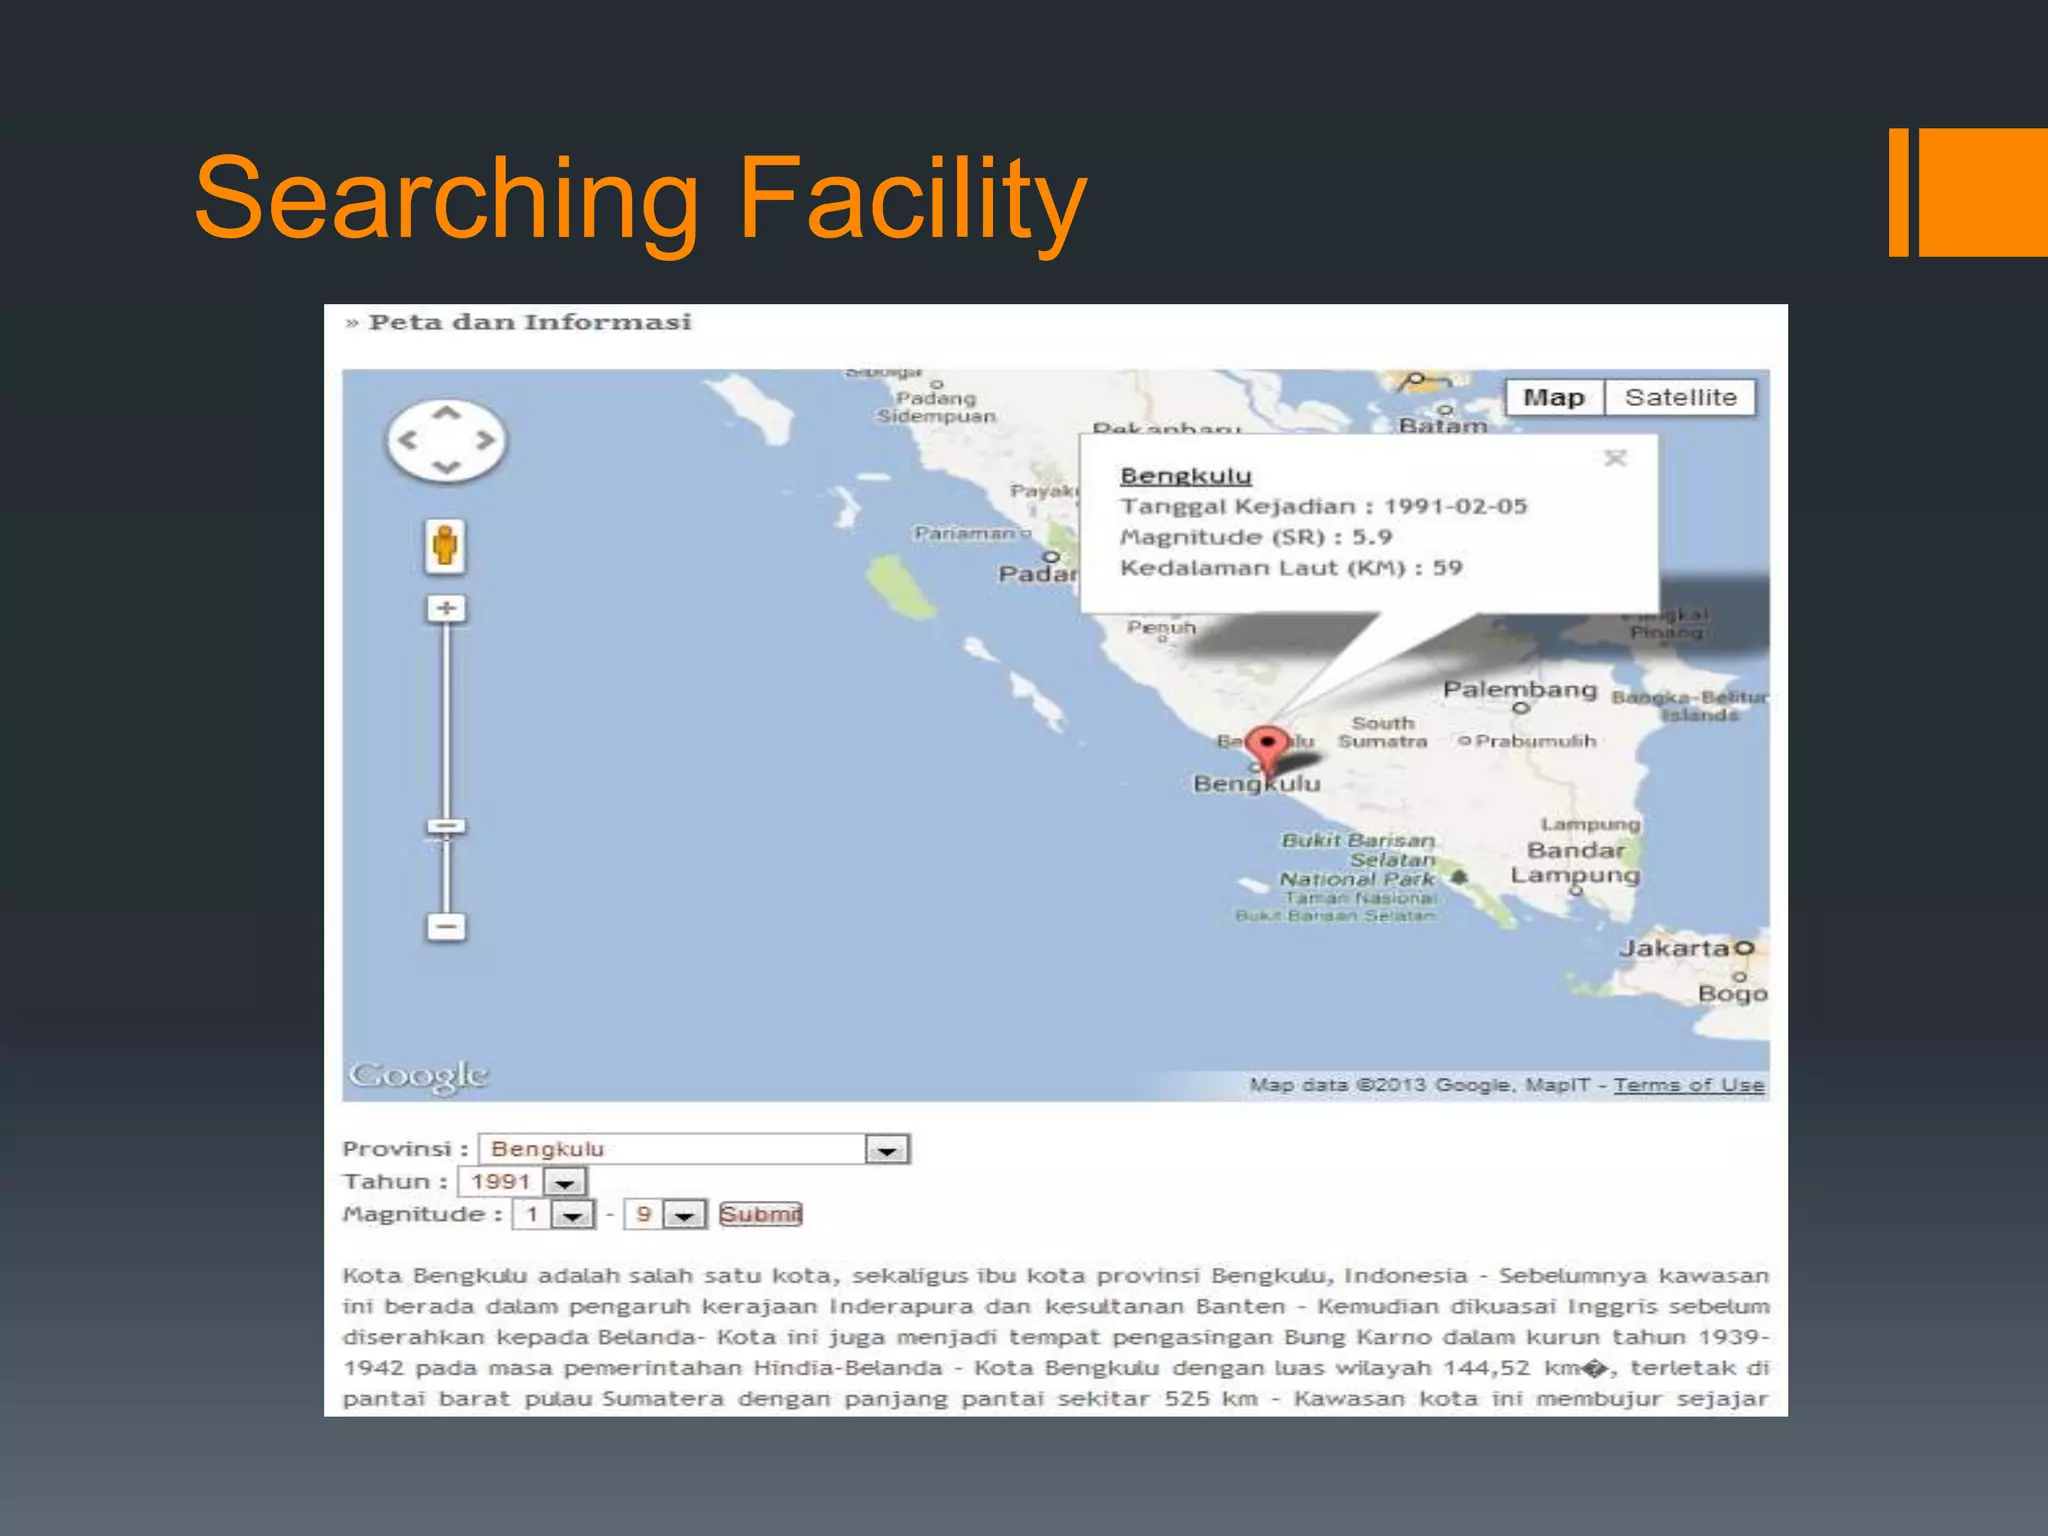
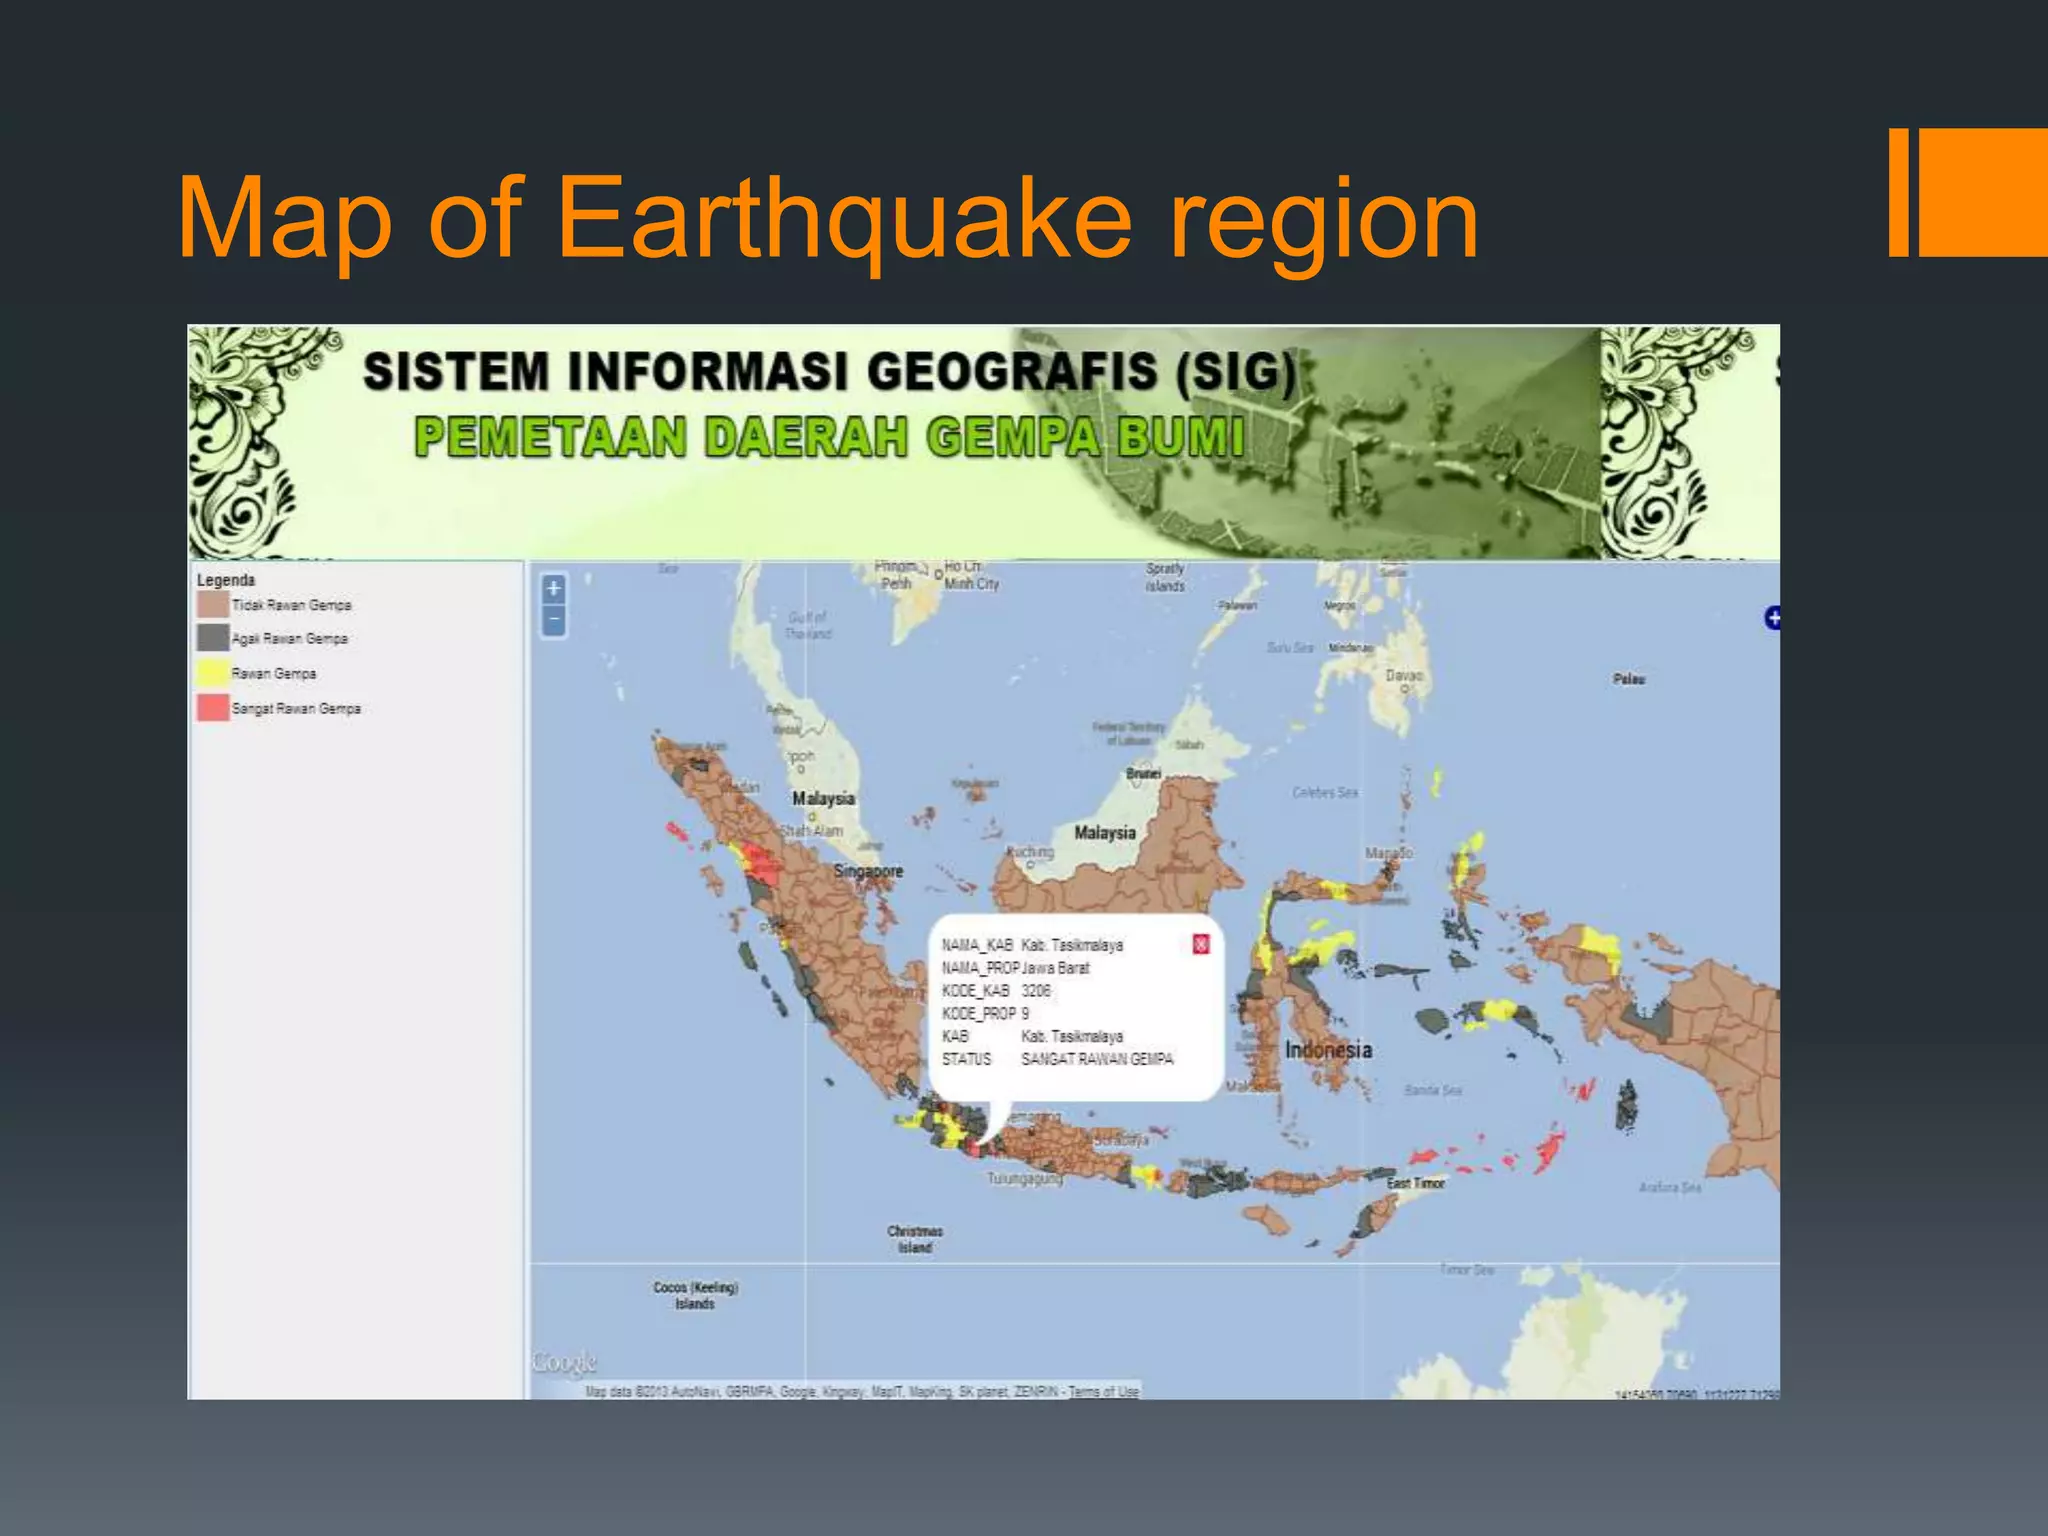


This document proposes building a new web-based earthquake information system for Indonesia using GIS technology. The current system has incomplete information and mapping. The new system would provide breaking news, maps marking earthquake locations by date and magnitude. Areas would be color-coded based on earthquake frequency. It would use Quantum GIS for digitizing maps, MySQL for data storage, and Google Maps API for interactive displays. This would make earthquake data more detailed and help users identify high-risk areas.


