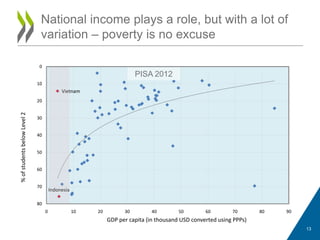
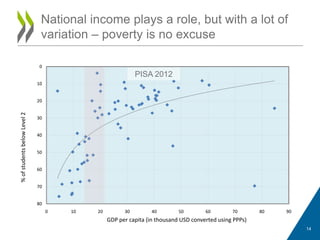
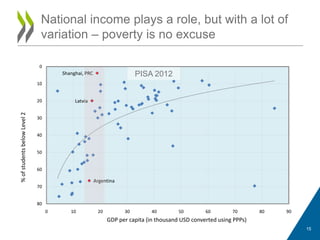
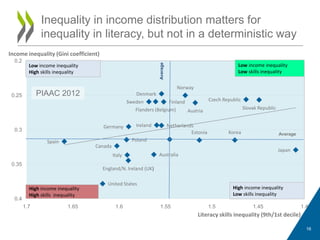
LITERACIES: KEY TO
INCLUSIVE SOCIETIES
Dirk Van Damme
Head of the Innovation and Measuring
Progress division, Directorate for Education
and Skills, OECD
• Inform you on what the most evidence tells us
– EFA Monitoring Report
– OECD‟s PISA 2012
– OECD‟s Adult Skills Survey / PIAAC
• Draw lessons for policies and practices from the
available evidence
• Make a case for evidence-based advocacy and
action
Purposes
2
• Progress is made, but not enough
• Low literacy is not a destiny: policies and practices
matter!
• Literacy impacts on various economic and social
outcomes
• Looking beyond literacy
– Not just about the very basic skills
– Multi-literacies: multi-dimensionality of literacy
– Not only skills development, but also skills use
• Conclusions: literacy policies for inclusive societies
Outline
3
PROGRESS, BUT
NOT ENOUGH
4
• The adult illiteracy rate fell from 24% in 1990 to 18% in 2000
and 16% in 2011.
• However, the number of illiterate adults remains stubbornly
high at 774 million, a fall of 12% since 1990 but just 1% since
2000.
• The number of illiterate adults is projected only to fall to 743
million by 2015. In 32 out of 89 countries, the adult literacy
rate will still be below 80%.
• In sub-Saharan Africa, the number of illiterate adults has
increased by 37% since 1990, mainly as a result of population
growth.
• Women make up nearly two-thirds of the total, and since 1990
there has been no progress in reducing this share.
Progress made, but slowing down
EFA Global Monitoring Report 2013/14 5
Many countries have decreased their numbers
of low-performing 15-year olds
0
10
20
30
40
50
60
70
80
90
Peru
Albania
Chile
Indonesia
Latvia
Poland
Liechtenstein
Israel
Germany
Portugal
Switzerland
Brazil
Russian…
Thailand
Romania
Denmark
Mexico
Hungary
Belgium
HongKong-China
Greece
OECDaverage…
Ireland
UnitedStates
Norway
Bulgaria
CzechRepublic
Japan
Austria
Italy
Canada
Australia
Korea
Spain
NewZealand
France
Finland
Iceland
Argentina
Sweden
PercentageofstudentsbelowproficiencyLevel2inreading
2012 2000
Countries are ranked in descending amount of progress
But many countries still have 30, 40, …
to even 60% of low-literate 15 year-olds
PISA 2012
6
• Progress is not only uneven across
countries, but also unevenly distributed within
countries
• Many are excluded from the benefits of
educational expansion and skills
improvement, but exclusion is often
concentrated in particular groups
– Gender, location, ethnicity, socio-economic
background, age, immigrant status, language, …
Progress not only too slow, but also unevenly
distributed
7
Huge social disparities in youth literacy
EFA 2013
8
LOW LITERACY IS
NO DESTINY – POLICIES
AND PRACTICES MATTER
9
Low literacy risk among youth related but not
completely explained by mean literacy levels
0
10
20
30
40
50
60
70300
350
400
450
500
550
600
650
Peru
Qatar
Kazakhstan
Albania
Argentina
Indonesia
Malaysia
Jordan
Colombia
Tunisia
Brazil
Uruguay
Montenegro
Mexico
Bulgaria
Romania
CostaRica
Thailand
Chile
UnitedArabEmirates
Serbia
Cyprus
SlovakRepublic
RussianFederation
Turkey
Greece
Lithuania
Slovenia
Iceland
Sweden
Croatia
Israel
Portugal
Luxembourg
Spain
Hungary
Latvia
Austria
Italy
CzechRepublic
Denmark
UnitedStates
UnitedKingdom
Norway
France
Germany
VietNam
Belgium
Macao-China
Switzerland
Netherlands
Australia
NewZealand
Liechtenstein
Estonia
Poland
Canada
ChineseTaipei
Ireland
Finland
Korea
Japan
Singapore
HongKong-China
Shanghai-China
Mean score on the reading scale % of students below Level 2
Expon. (Mean score on the reading scale) Expon. (% of students below Level 2)
PISA 2012
10
Vietnam
Croatia
Estonia
Denmark
Costa Rica
Macao-China
Turkey
Albania
Indonesia
Sweden
Italy
Luxembourg
Israel
France
New Zealand
Rankpercentagestudentsbelowlevel2
Rank mean reading score
Less inclusive countries: with
higher percentage students below
level 2 than predicted by their
mean score
More inclusive countries: with
lower percentage students below
level 2 than predicted by their
mean score
PISA 2012
11
National income plays a role, but with a lot of
variation – poverty is no excuse
0
10
20
30
40
50
60
70
80
0 10 20 30 40 50 60 70 80 90
%ofstudentsbelowLevel2
GDP per capita (in thousand USD converted using PPPs)
PISA 2012
12
National income plays a role, but with a lot of
variation – poverty is no excuse
Indonesia
Vietnam
0
10
20
30
40
50
60
70
80
0 10 20 30 40 50 60 70 80 90
%ofstudentsbelowLevel2
GDP per capita (in thousand USD converted using PPPs)
PISA 2012
13
National income plays a role, but with a lot of
variation – poverty is no excuse
0
10
20
30
40
50
60
70
80
0 10 20 30 40 50 60 70 80 90
%ofstudentsbelowLevel2
GDP per capita (in thousand USD converted using PPPs)
PISA 2012
14
National income plays a role, but with a lot of
variation – poverty is no excuse
Argentina
Latvia
Shanghai, PRC
0
10
20
30
40
50
60
70
80
0 10 20 30 40 50 60 70 80 90
%ofstudentsbelowLevel2
GDP per capita (in thousand USD converted using PPPs)
PISA 2012
15
16
Inequality in income distribution matters for
inequality in literacy, but not in a deterministic way
Australia
Austria
Canada
Czech Republic
Denmark
Estonia
Finland
Germany Ireland
Italy
Japan
Korea
Netherlands
Norway
Poland
Slovak Republic
Spain
Sweden
United States
Flanders (Belgium)
England/N. Ireland (UK)
0.2
0.25
0.3
0.35
0.4
1.41.451.51.551.61.651.7
Literacy skills inequality (9th/1st decile)
Income inequality (Gini coefficient)
Low income inequality
Low skills inequality
High income inequality
Low skills inequality
High income inequality
High skills inequality
Low income inequality
High skills inequality
Average
Average
PIAAC 2012
PIAAC 2012
17
18
Schooling matters a lot, but is not the only
reason why adults lack basic literacy skills
210
230
250
270
290
310
330
Tertiary Education Below upper secondary education Upper secondary or post-secondary non-tertiary education
PIAAC mean literacy proficiency scores for 25-64 year-olds by educational attainment (2012)
PIAAC 2012
Level 2
240
250
260
270
280
290
300
310
15 20 25 30 35 40 45 50 55 60 65
19
Age matters a lot for literacy, even after
correcting for education and other factors
Age
Score
Literacy
unadjusted
Numeracy
unadjusted
Numeracy
adjusted
Literacy
adjusted
LITERACY IMPACTS ON
VARIOUS ECONOMIC AND
SOCIAL OUTCOMES
20
1
2
3
4
5
Good to
excellent health
Being Employed High levels of
trust
Participation in
volunteer
activities
High levels of
political efficacy
High wages
Average Germany England (UK) Flanders (Belgium)
21
Likelihood of positive social and economic
outcomes among highly literate adults
(scoring at Level 4/5 compared with those scoring at Level 1 or below)
Odds ratio
PIAAC 2012
22
The effect of education and literacy on labour
market participation
PIAAC 2012
23
Literacy skills impact on employment, but
qualifications determine earnings
0
500
1000
1500
2000
2500
3000
3500
4000
4500
5000
0
10
20
30
40
50
60
70
80
90
100
Average monthly
earnings ($USD)
Employment rate (%)
Earnings
ISCED 0/1/2 ISCED 3/4 ISCED 5/6
Level 1
Level 2
Level 3
Level 4/5
Flemish Community, Belgium
PIAAC 2012
Low literacy skills increase likelihood to
negative social outcomes
1
2
3
4
5
Trust Political efficacy volunteer Health
Oddsratio–referenceisLevel4/5
Odds ratios adjusted for age, gender, education and immigrant and language background
PIAAC 2012
24
Low literacy skills increase likelihood to
negative social outcomes
1
2
3
4
5
Political efficacy Trust volunteer Health
Oddsratio–referenceisLevel4/5
Odds ratios adjusted for age, gender, education and immigrant and language background
PIAAC 2012
25
Low literacy skills increase likelihood to
negative social outcomes
1
2
3
4
5
volunteer Trust Political efficacy Health
Oddsratio–referenceisLevel4/5
Odds ratios adjusted for age, gender, education and immigrant and language background
PIAAC 2012
26
Low literacy skills increase likelihood to
negative social outcomes
1
2
3
4
5
Health Trust Political efficacy volunteer
Oddsratio–referenceisLevel4/5
Odds ratios adjusted for age, gender, education and immigrant and language background
PIAAC 2012
27
• The impact of low literacy on various measures
of social well-being and inclusiveness is high to
very high
• But the impact also varies a lot between
countries, depending on institutional contexts
• Literacy is interacting with a lot of other
determinants, often reinforcing their impact
• Sometimes, literacy is also competing with other
factors (e.g. educational attainment)
Literacy matters for various social outcomes
28
PIAAC 2012
29
• More education generally means more literacy, but
the relationship is not always straightforward
– High-educated people losing skills
– Low-educated people learning skills
• Whether it is educational attainment or literacy
which matter most for social outcomes, differs for
each measure and for each country
• More educational opportunities are of course
crucial, but lack of education in early years should
not condemn people for the rest of their life-course
Relationship between education and literacy
30
BEYOND LITERACY: MORE
THAN JUST BASIC SKILLS
31
32
Evolution of employment in occupational groups
defined by level of skills proficiency
• Labour markets and social realities are changing
quickly, asking for ever higher skills needs
• Also mid-level literacy skills will soon not suffice
to protect people from vulnerable jobs and living
conditions, and seem to be even more
endangered than low-skilled jobs
• Literacy is not a dichotomous „one-off‟ reality, but
a continuous effort to improve and enhance
skills
More than just basic skills
33
BEYOND LITERACY:
MULTI-LITERACIES
34
Literacy
Numeracy
Digital
literacy
Financial
literacy
Media
literacy
Visual
literacy
Problem
solving
Multi-
lingualism
Cultural
literacy
Science
literacy
Emotional
literacy
Multi-literacies
35
• Digital literacy (“problem-solving in ICT-environments”)
is becoming a critically important skill
• From less than 7% of 16-65 year-olds in the
Netherlands, Norway and Sweden to around 23% or
higher in Italy, Korea, Poland, the Slovak Republic
and Spain lack the basic skills to use ICT for daily
tasks (PIAAC, 2012)
For example: digital literacy
36
• Multi-dimensionality of literacy, but at the same time
risk of inflation of the concept itself
• Various dimensions and modes of low-literacy
reinforce each other, but sometimes people also
compensate skills shortages
• How are modes of communication in the lives of
people changing in reality?
• How are different dimensions – cognitive, problem-
solving, communication, social, emotional –
interacting, reinforcing or contradicting each other?
• On what dimensions should policies and practices
focus to empower people?
Multi-literacies
37
BEYOND LITERACY:
USES OF LITERACY SKILLS
38
• What adults do, both at work and outside work, is
closely related to proficiency.
• Adults who engage more often in literacy- and
numeracy-related activities and use ICTs more (both
at work and outside of work) have higher proficiency
in each domain
• Engagement in relevant activities outside of work
has an even stronger relationship with the skills
assessed than engagement in the corresponding
activities at work.
Literacy skills use and proficiency strongly
related
39
Reading at work is associated with literacy
skills – especially in open economies
40
Reading at work is associated with literacy
skills – but less so in more closed economies
41
But reading outside work matters even more
42
Also ICT-skills are closely associated with
usage of such skills at work
43
• There is a clear relationship between the extent
of participation in organised adult learning and
the average level of key information-processing
skills in a given country.
• The large variation among countries at similar
levels of economic development suggests major
differences in learning cultures, learning
opportunities at work, and adult-education
structures.
Adult education and proficiency are also
strongly related
44
45
Likelihood of participating in adult education and
training, by level of literacy proficiency
1
2
3
4
5
6
7
8 Level 1 Level 2 Level 3 Level 4/5
Reference group:
Below Level 1
Odds Ratio
CONCLUSIONS: LITERACY
POLICIES FOR INCLUSIVE
SOCIETIES
46
• Illiteracy and low literacy remains a terrible
reality for far too many people in all countries
• Literacy is unequally distributed within
countries, dependent on gender, age, social
background, ethnicity, migration
status, language, etc.
• The impact of literacy on various measures of
economic and social well-being is huge – low
literacy in many cases means being excluded
from jobs, full citizenship, health, community life
and public communication
What the evidence tells us
47
• Low literacy levels are no destiny, but can be
changed
– On country level: against the odds of national
income or overall literacy levels, some countries
succeed in keeping low-literacy levels under
control, and others don‟t
– On individual level: against the odds of their
background, education and status many
individuals succeed in acquiring good literacy
levels, but they can‟t do that alone, they need help
What the evidence tells us also
48
• Countries utterly underestimate the cost of low
literacy and the potential benefits from raising
literacy levels
– Increasing productivity, employment, earning, tax
– Fostering social inclusion and social cohesion
– Reducing poverty, ill health, crime
– Improving the functioning of political democracy
• Neglecting or underestimating the literacy crisis
comes at a cost, now and in the future!
Literacy is a matter of human rights and social
justice, but also of economic and social progress
49
• Ensure a good initial education for all, including taking
specific measures to guarantee that disadvantaged
groups take full benefit from education
• Prevent poor initial education resulting in a vicious
circle of missed opportunities for jobs, continuing
learning and use of literacy skills
• Identify those who can benefit from learning most
• Make adult education more flexible, so that learners
can adapt learning to their lives more easily
• Improve skills metrics and assessments, because
assessment also drives change
Policies that work
50
• Create literacy-rich environments at work and in the
community which help people to develop and use
literacy skills
• Take specific measures to ensure that low-literate
people get equal access to continuing
education, health, social services, etc.
• Value literacy skills, but value also other skills people
have
• Make literacy learning everybody‟s business – help
employers to make best use of everybody‟s skills
Policies that work
51
• Valuing literacy skills more means:
– Rewarding people who acquire and improve literacy
skills, for example by opening up labour markets for
skills instead of diploma‟s
– Potentially also penalizing low-literate adults with
educational qualifications and taking away the social
protection function of educational qualifications
• Creating literacy-rich environments means:
– Helping people to develop, use and maintain skills
– Potentially also excluding and stigmatising low-literate
people more
Literacy policies and practices face dilemma‟s
52
• It is vitally important for literacy policies and
actions to positively emphasize the opportunities
of literacy and to empower people to
learn, rather than to stigmatise low-literate adults
for their lack of skills.
• Literacy actions can easily result in unwanted
effects when over-problematising skills
shortages from a deficit-perspective.
An empowerment approach, not a deficit one
53
• All this will not happen by itself, but needs
concerted and determined action
– Governments and international organisations
– Business, employers, social partners
– Education and social services
– Grass-roots movements, NGO‟s
– Social entrepreneurs and innovators
URGENT ACTION IS NEEDED!
54
Thanks!
dirk.vandamme@oecd.org
www.oecd.org/edu/ceri
twitter @VanDammeEDU
55

World literacy summit keynote: why low-literacy matters and what policy can do

  • 1.
    LITERACIES: KEY TO INCLUSIVESOCIETIES Dirk Van Damme Head of the Innovation and Measuring Progress division, Directorate for Education and Skills, OECD
  • 2.
    • Inform youon what the most evidence tells us – EFA Monitoring Report – OECD‟s PISA 2012 – OECD‟s Adult Skills Survey / PIAAC • Draw lessons for policies and practices from the available evidence • Make a case for evidence-based advocacy and action Purposes 2
  • 3.
    • Progress ismade, but not enough • Low literacy is not a destiny: policies and practices matter! • Literacy impacts on various economic and social outcomes • Looking beyond literacy – Not just about the very basic skills – Multi-literacies: multi-dimensionality of literacy – Not only skills development, but also skills use • Conclusions: literacy policies for inclusive societies Outline 3
  • 4.
  • 5.
    • The adultilliteracy rate fell from 24% in 1990 to 18% in 2000 and 16% in 2011. • However, the number of illiterate adults remains stubbornly high at 774 million, a fall of 12% since 1990 but just 1% since 2000. • The number of illiterate adults is projected only to fall to 743 million by 2015. In 32 out of 89 countries, the adult literacy rate will still be below 80%. • In sub-Saharan Africa, the number of illiterate adults has increased by 37% since 1990, mainly as a result of population growth. • Women make up nearly two-thirds of the total, and since 1990 there has been no progress in reducing this share. Progress made, but slowing down EFA Global Monitoring Report 2013/14 5
  • 6.
    Many countries havedecreased their numbers of low-performing 15-year olds 0 10 20 30 40 50 60 70 80 90 Peru Albania Chile Indonesia Latvia Poland Liechtenstein Israel Germany Portugal Switzerland Brazil Russian… Thailand Romania Denmark Mexico Hungary Belgium HongKong-China Greece OECDaverage… Ireland UnitedStates Norway Bulgaria CzechRepublic Japan Austria Italy Canada Australia Korea Spain NewZealand France Finland Iceland Argentina Sweden PercentageofstudentsbelowproficiencyLevel2inreading 2012 2000 Countries are ranked in descending amount of progress But many countries still have 30, 40, … to even 60% of low-literate 15 year-olds PISA 2012 6
  • 7.
    • Progress isnot only uneven across countries, but also unevenly distributed within countries • Many are excluded from the benefits of educational expansion and skills improvement, but exclusion is often concentrated in particular groups – Gender, location, ethnicity, socio-economic background, age, immigrant status, language, … Progress not only too slow, but also unevenly distributed 7
  • 8.
    Huge social disparitiesin youth literacy EFA 2013 8
  • 9.
    LOW LITERACY IS NODESTINY – POLICIES AND PRACTICES MATTER 9
  • 10.
    Low literacy riskamong youth related but not completely explained by mean literacy levels 0 10 20 30 40 50 60 70300 350 400 450 500 550 600 650 Peru Qatar Kazakhstan Albania Argentina Indonesia Malaysia Jordan Colombia Tunisia Brazil Uruguay Montenegro Mexico Bulgaria Romania CostaRica Thailand Chile UnitedArabEmirates Serbia Cyprus SlovakRepublic RussianFederation Turkey Greece Lithuania Slovenia Iceland Sweden Croatia Israel Portugal Luxembourg Spain Hungary Latvia Austria Italy CzechRepublic Denmark UnitedStates UnitedKingdom Norway France Germany VietNam Belgium Macao-China Switzerland Netherlands Australia NewZealand Liechtenstein Estonia Poland Canada ChineseTaipei Ireland Finland Korea Japan Singapore HongKong-China Shanghai-China Mean score on the reading scale % of students below Level 2 Expon. (Mean score on the reading scale) Expon. (% of students below Level 2) PISA 2012 10
  • 11.
    Vietnam Croatia Estonia Denmark Costa Rica Macao-China Turkey Albania Indonesia Sweden Italy Luxembourg Israel France New Zealand Rankpercentagestudentsbelowlevel2 Rankmean reading score Less inclusive countries: with higher percentage students below level 2 than predicted by their mean score More inclusive countries: with lower percentage students below level 2 than predicted by their mean score PISA 2012 11
  • 12.
    National income playsa role, but with a lot of variation – poverty is no excuse 0 10 20 30 40 50 60 70 80 0 10 20 30 40 50 60 70 80 90 %ofstudentsbelowLevel2 GDP per capita (in thousand USD converted using PPPs) PISA 2012 12
  • 13.
    National income playsa role, but with a lot of variation – poverty is no excuse Indonesia Vietnam 0 10 20 30 40 50 60 70 80 0 10 20 30 40 50 60 70 80 90 %ofstudentsbelowLevel2 GDP per capita (in thousand USD converted using PPPs) PISA 2012 13
  • 14.
    National income playsa role, but with a lot of variation – poverty is no excuse 0 10 20 30 40 50 60 70 80 0 10 20 30 40 50 60 70 80 90 %ofstudentsbelowLevel2 GDP per capita (in thousand USD converted using PPPs) PISA 2012 14
  • 15.
    National income playsa role, but with a lot of variation – poverty is no excuse Argentina Latvia Shanghai, PRC 0 10 20 30 40 50 60 70 80 0 10 20 30 40 50 60 70 80 90 %ofstudentsbelowLevel2 GDP per capita (in thousand USD converted using PPPs) PISA 2012 15
  • 16.
    16 Inequality in incomedistribution matters for inequality in literacy, but not in a deterministic way Australia Austria Canada Czech Republic Denmark Estonia Finland Germany Ireland Italy Japan Korea Netherlands Norway Poland Slovak Republic Spain Sweden United States Flanders (Belgium) England/N. Ireland (UK) 0.2 0.25 0.3 0.35 0.4 1.41.451.51.551.61.651.7 Literacy skills inequality (9th/1st decile) Income inequality (Gini coefficient) Low income inequality Low skills inequality High income inequality Low skills inequality High income inequality High skills inequality Low income inequality High skills inequality Average Average PIAAC 2012
  • 17.
  • 18.
    18 Schooling matters alot, but is not the only reason why adults lack basic literacy skills 210 230 250 270 290 310 330 Tertiary Education Below upper secondary education Upper secondary or post-secondary non-tertiary education PIAAC mean literacy proficiency scores for 25-64 year-olds by educational attainment (2012) PIAAC 2012
  • 19.
    Level 2 240 250 260 270 280 290 300 310 15 2025 30 35 40 45 50 55 60 65 19 Age matters a lot for literacy, even after correcting for education and other factors Age Score Literacy unadjusted Numeracy unadjusted Numeracy adjusted Literacy adjusted
  • 20.
    LITERACY IMPACTS ON VARIOUSECONOMIC AND SOCIAL OUTCOMES 20
  • 21.
    1 2 3 4 5 Good to excellent health BeingEmployed High levels of trust Participation in volunteer activities High levels of political efficacy High wages Average Germany England (UK) Flanders (Belgium) 21 Likelihood of positive social and economic outcomes among highly literate adults (scoring at Level 4/5 compared with those scoring at Level 1 or below) Odds ratio PIAAC 2012
  • 22.
    22 The effect ofeducation and literacy on labour market participation PIAAC 2012
  • 23.
    23 Literacy skills impacton employment, but qualifications determine earnings 0 500 1000 1500 2000 2500 3000 3500 4000 4500 5000 0 10 20 30 40 50 60 70 80 90 100 Average monthly earnings ($USD) Employment rate (%) Earnings ISCED 0/1/2 ISCED 3/4 ISCED 5/6 Level 1 Level 2 Level 3 Level 4/5 Flemish Community, Belgium PIAAC 2012
  • 24.
    Low literacy skillsincrease likelihood to negative social outcomes 1 2 3 4 5 Trust Political efficacy volunteer Health Oddsratio–referenceisLevel4/5 Odds ratios adjusted for age, gender, education and immigrant and language background PIAAC 2012 24
  • 25.
    Low literacy skillsincrease likelihood to negative social outcomes 1 2 3 4 5 Political efficacy Trust volunteer Health Oddsratio–referenceisLevel4/5 Odds ratios adjusted for age, gender, education and immigrant and language background PIAAC 2012 25
  • 26.
    Low literacy skillsincrease likelihood to negative social outcomes 1 2 3 4 5 volunteer Trust Political efficacy Health Oddsratio–referenceisLevel4/5 Odds ratios adjusted for age, gender, education and immigrant and language background PIAAC 2012 26
  • 27.
    Low literacy skillsincrease likelihood to negative social outcomes 1 2 3 4 5 Health Trust Political efficacy volunteer Oddsratio–referenceisLevel4/5 Odds ratios adjusted for age, gender, education and immigrant and language background PIAAC 2012 27
  • 28.
    • The impactof low literacy on various measures of social well-being and inclusiveness is high to very high • But the impact also varies a lot between countries, depending on institutional contexts • Literacy is interacting with a lot of other determinants, often reinforcing their impact • Sometimes, literacy is also competing with other factors (e.g. educational attainment) Literacy matters for various social outcomes 28
  • 29.
  • 30.
    • More educationgenerally means more literacy, but the relationship is not always straightforward – High-educated people losing skills – Low-educated people learning skills • Whether it is educational attainment or literacy which matter most for social outcomes, differs for each measure and for each country • More educational opportunities are of course crucial, but lack of education in early years should not condemn people for the rest of their life-course Relationship between education and literacy 30
  • 31.
    BEYOND LITERACY: MORE THANJUST BASIC SKILLS 31
  • 32.
    32 Evolution of employmentin occupational groups defined by level of skills proficiency
  • 33.
    • Labour marketsand social realities are changing quickly, asking for ever higher skills needs • Also mid-level literacy skills will soon not suffice to protect people from vulnerable jobs and living conditions, and seem to be even more endangered than low-skilled jobs • Literacy is not a dichotomous „one-off‟ reality, but a continuous effort to improve and enhance skills More than just basic skills 33
  • 34.
  • 35.
  • 36.
    • Digital literacy(“problem-solving in ICT-environments”) is becoming a critically important skill • From less than 7% of 16-65 year-olds in the Netherlands, Norway and Sweden to around 23% or higher in Italy, Korea, Poland, the Slovak Republic and Spain lack the basic skills to use ICT for daily tasks (PIAAC, 2012) For example: digital literacy 36
  • 37.
    • Multi-dimensionality ofliteracy, but at the same time risk of inflation of the concept itself • Various dimensions and modes of low-literacy reinforce each other, but sometimes people also compensate skills shortages • How are modes of communication in the lives of people changing in reality? • How are different dimensions – cognitive, problem- solving, communication, social, emotional – interacting, reinforcing or contradicting each other? • On what dimensions should policies and practices focus to empower people? Multi-literacies 37
  • 38.
    BEYOND LITERACY: USES OFLITERACY SKILLS 38
  • 39.
    • What adultsdo, both at work and outside work, is closely related to proficiency. • Adults who engage more often in literacy- and numeracy-related activities and use ICTs more (both at work and outside of work) have higher proficiency in each domain • Engagement in relevant activities outside of work has an even stronger relationship with the skills assessed than engagement in the corresponding activities at work. Literacy skills use and proficiency strongly related 39
  • 40.
    Reading at workis associated with literacy skills – especially in open economies 40
  • 41.
    Reading at workis associated with literacy skills – but less so in more closed economies 41
  • 42.
    But reading outsidework matters even more 42
  • 43.
    Also ICT-skills areclosely associated with usage of such skills at work 43
  • 44.
    • There isa clear relationship between the extent of participation in organised adult learning and the average level of key information-processing skills in a given country. • The large variation among countries at similar levels of economic development suggests major differences in learning cultures, learning opportunities at work, and adult-education structures. Adult education and proficiency are also strongly related 44
  • 45.
    45 Likelihood of participatingin adult education and training, by level of literacy proficiency 1 2 3 4 5 6 7 8 Level 1 Level 2 Level 3 Level 4/5 Reference group: Below Level 1 Odds Ratio
  • 46.
    CONCLUSIONS: LITERACY POLICIES FORINCLUSIVE SOCIETIES 46
  • 47.
    • Illiteracy andlow literacy remains a terrible reality for far too many people in all countries • Literacy is unequally distributed within countries, dependent on gender, age, social background, ethnicity, migration status, language, etc. • The impact of literacy on various measures of economic and social well-being is huge – low literacy in many cases means being excluded from jobs, full citizenship, health, community life and public communication What the evidence tells us 47
  • 48.
    • Low literacylevels are no destiny, but can be changed – On country level: against the odds of national income or overall literacy levels, some countries succeed in keeping low-literacy levels under control, and others don‟t – On individual level: against the odds of their background, education and status many individuals succeed in acquiring good literacy levels, but they can‟t do that alone, they need help What the evidence tells us also 48
  • 49.
    • Countries utterlyunderestimate the cost of low literacy and the potential benefits from raising literacy levels – Increasing productivity, employment, earning, tax – Fostering social inclusion and social cohesion – Reducing poverty, ill health, crime – Improving the functioning of political democracy • Neglecting or underestimating the literacy crisis comes at a cost, now and in the future! Literacy is a matter of human rights and social justice, but also of economic and social progress 49
  • 50.
    • Ensure agood initial education for all, including taking specific measures to guarantee that disadvantaged groups take full benefit from education • Prevent poor initial education resulting in a vicious circle of missed opportunities for jobs, continuing learning and use of literacy skills • Identify those who can benefit from learning most • Make adult education more flexible, so that learners can adapt learning to their lives more easily • Improve skills metrics and assessments, because assessment also drives change Policies that work 50
  • 51.
    • Create literacy-richenvironments at work and in the community which help people to develop and use literacy skills • Take specific measures to ensure that low-literate people get equal access to continuing education, health, social services, etc. • Value literacy skills, but value also other skills people have • Make literacy learning everybody‟s business – help employers to make best use of everybody‟s skills Policies that work 51
  • 52.
    • Valuing literacyskills more means: – Rewarding people who acquire and improve literacy skills, for example by opening up labour markets for skills instead of diploma‟s – Potentially also penalizing low-literate adults with educational qualifications and taking away the social protection function of educational qualifications • Creating literacy-rich environments means: – Helping people to develop, use and maintain skills – Potentially also excluding and stigmatising low-literate people more Literacy policies and practices face dilemma‟s 52
  • 53.
    • It isvitally important for literacy policies and actions to positively emphasize the opportunities of literacy and to empower people to learn, rather than to stigmatise low-literate adults for their lack of skills. • Literacy actions can easily result in unwanted effects when over-problematising skills shortages from a deficit-perspective. An empowerment approach, not a deficit one 53
  • 54.
    • All thiswill not happen by itself, but needs concerted and determined action – Governments and international organisations – Business, employers, social partners – Education and social services – Grass-roots movements, NGO‟s – Social entrepreneurs and innovators URGENT ACTION IS NEEDED! 54
  • 55.