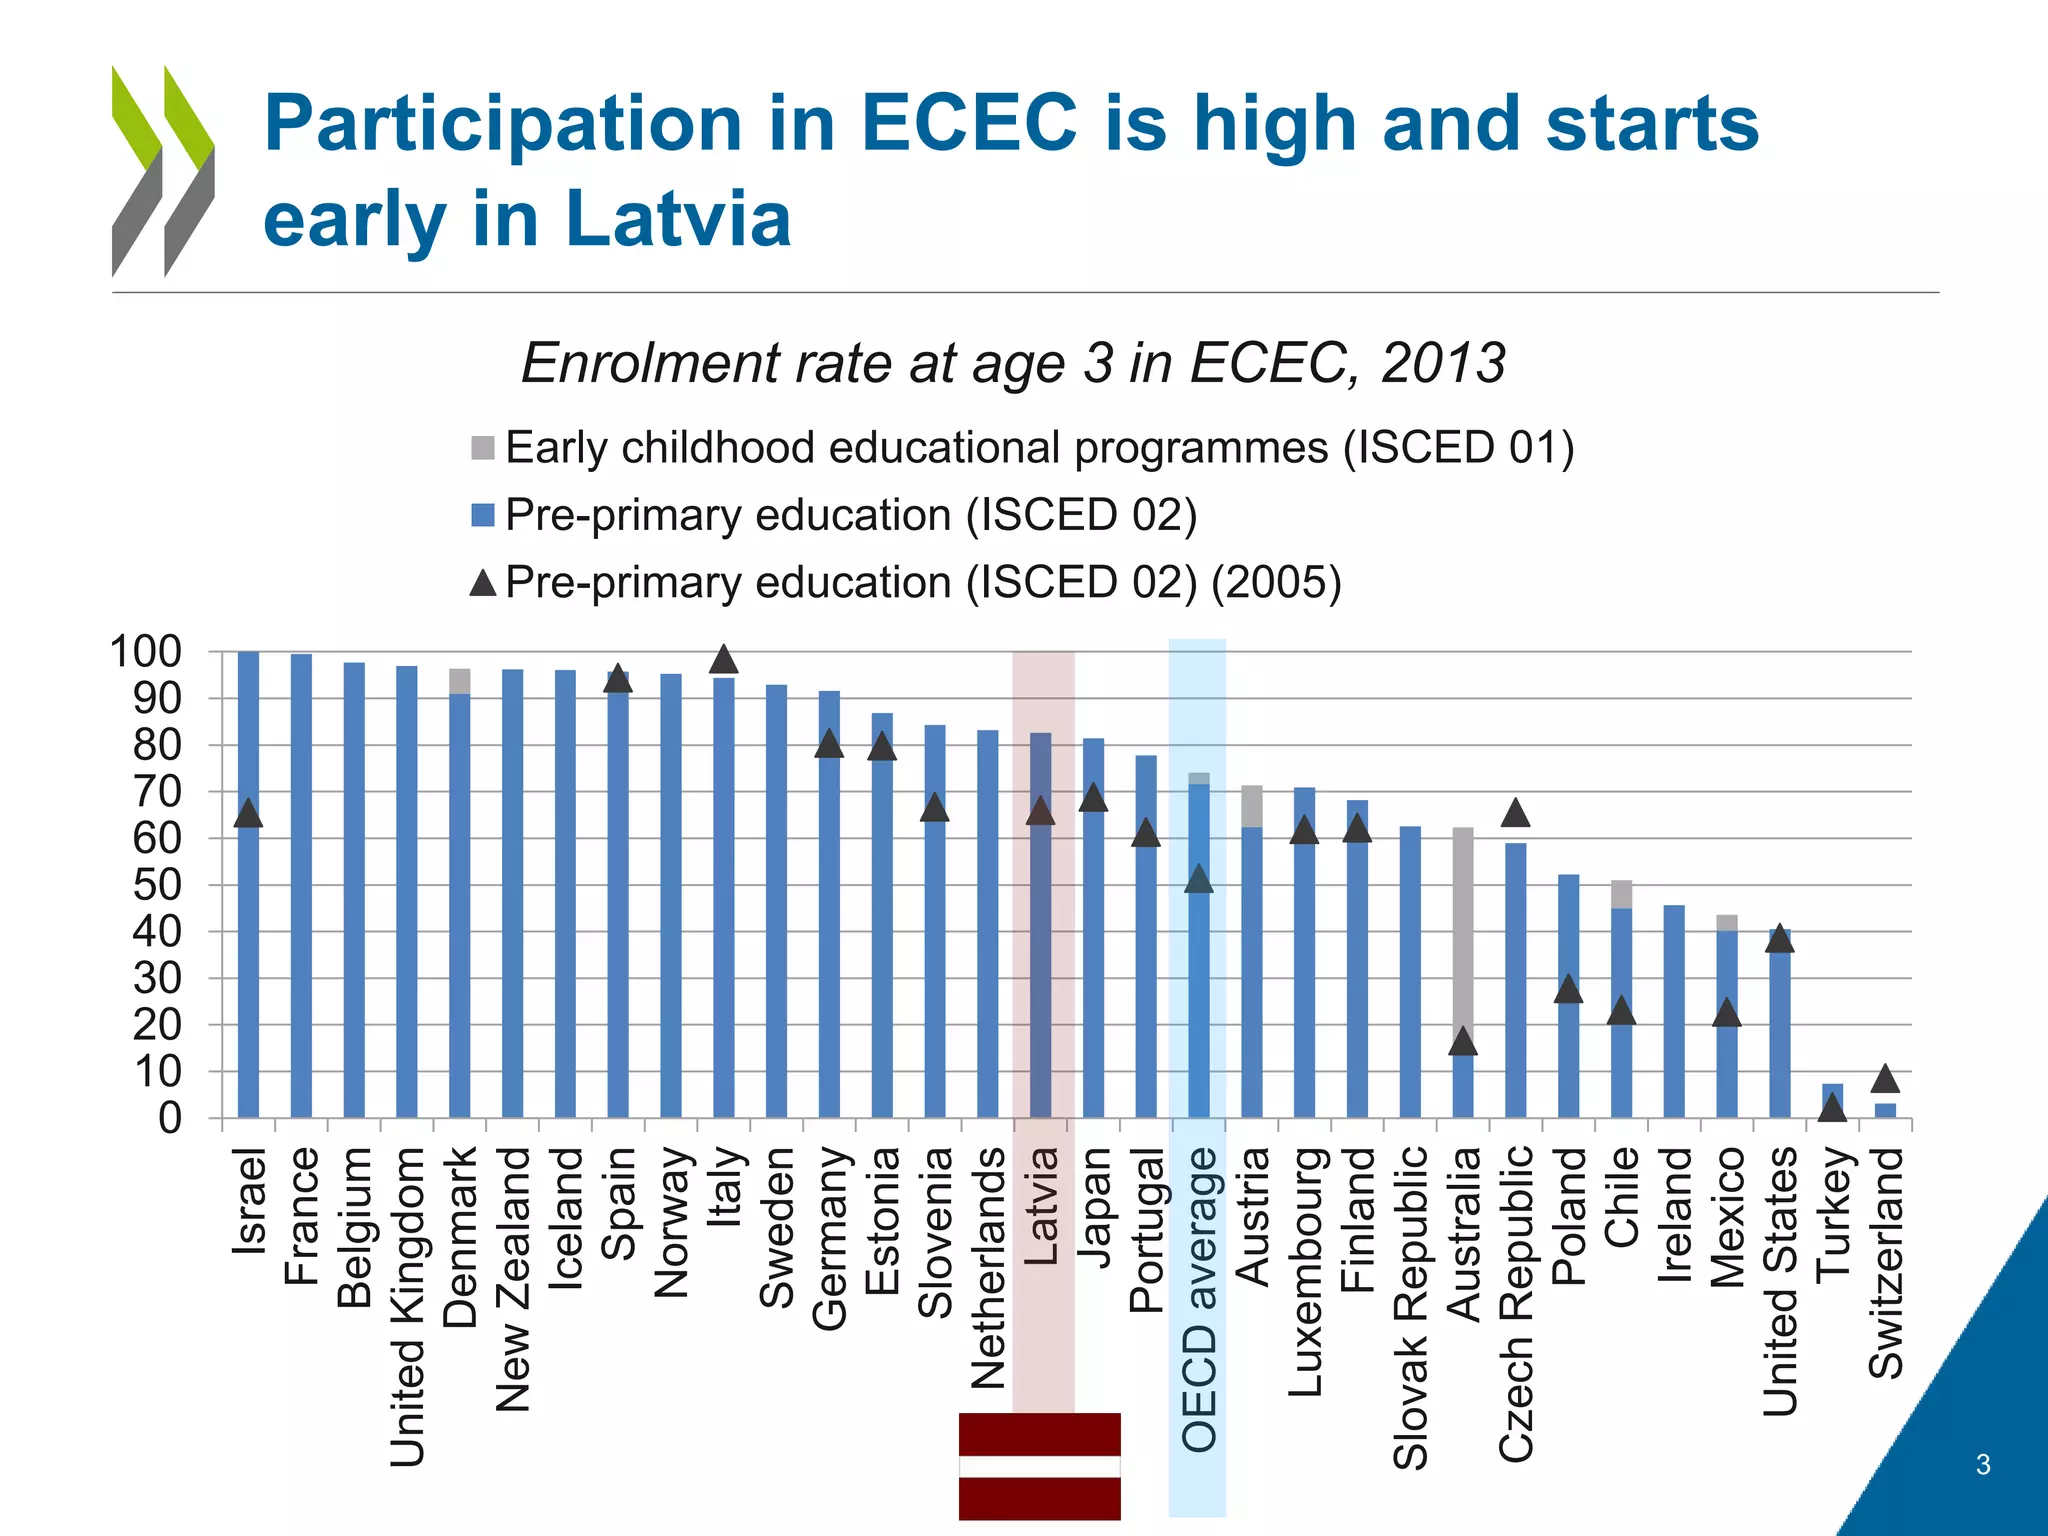
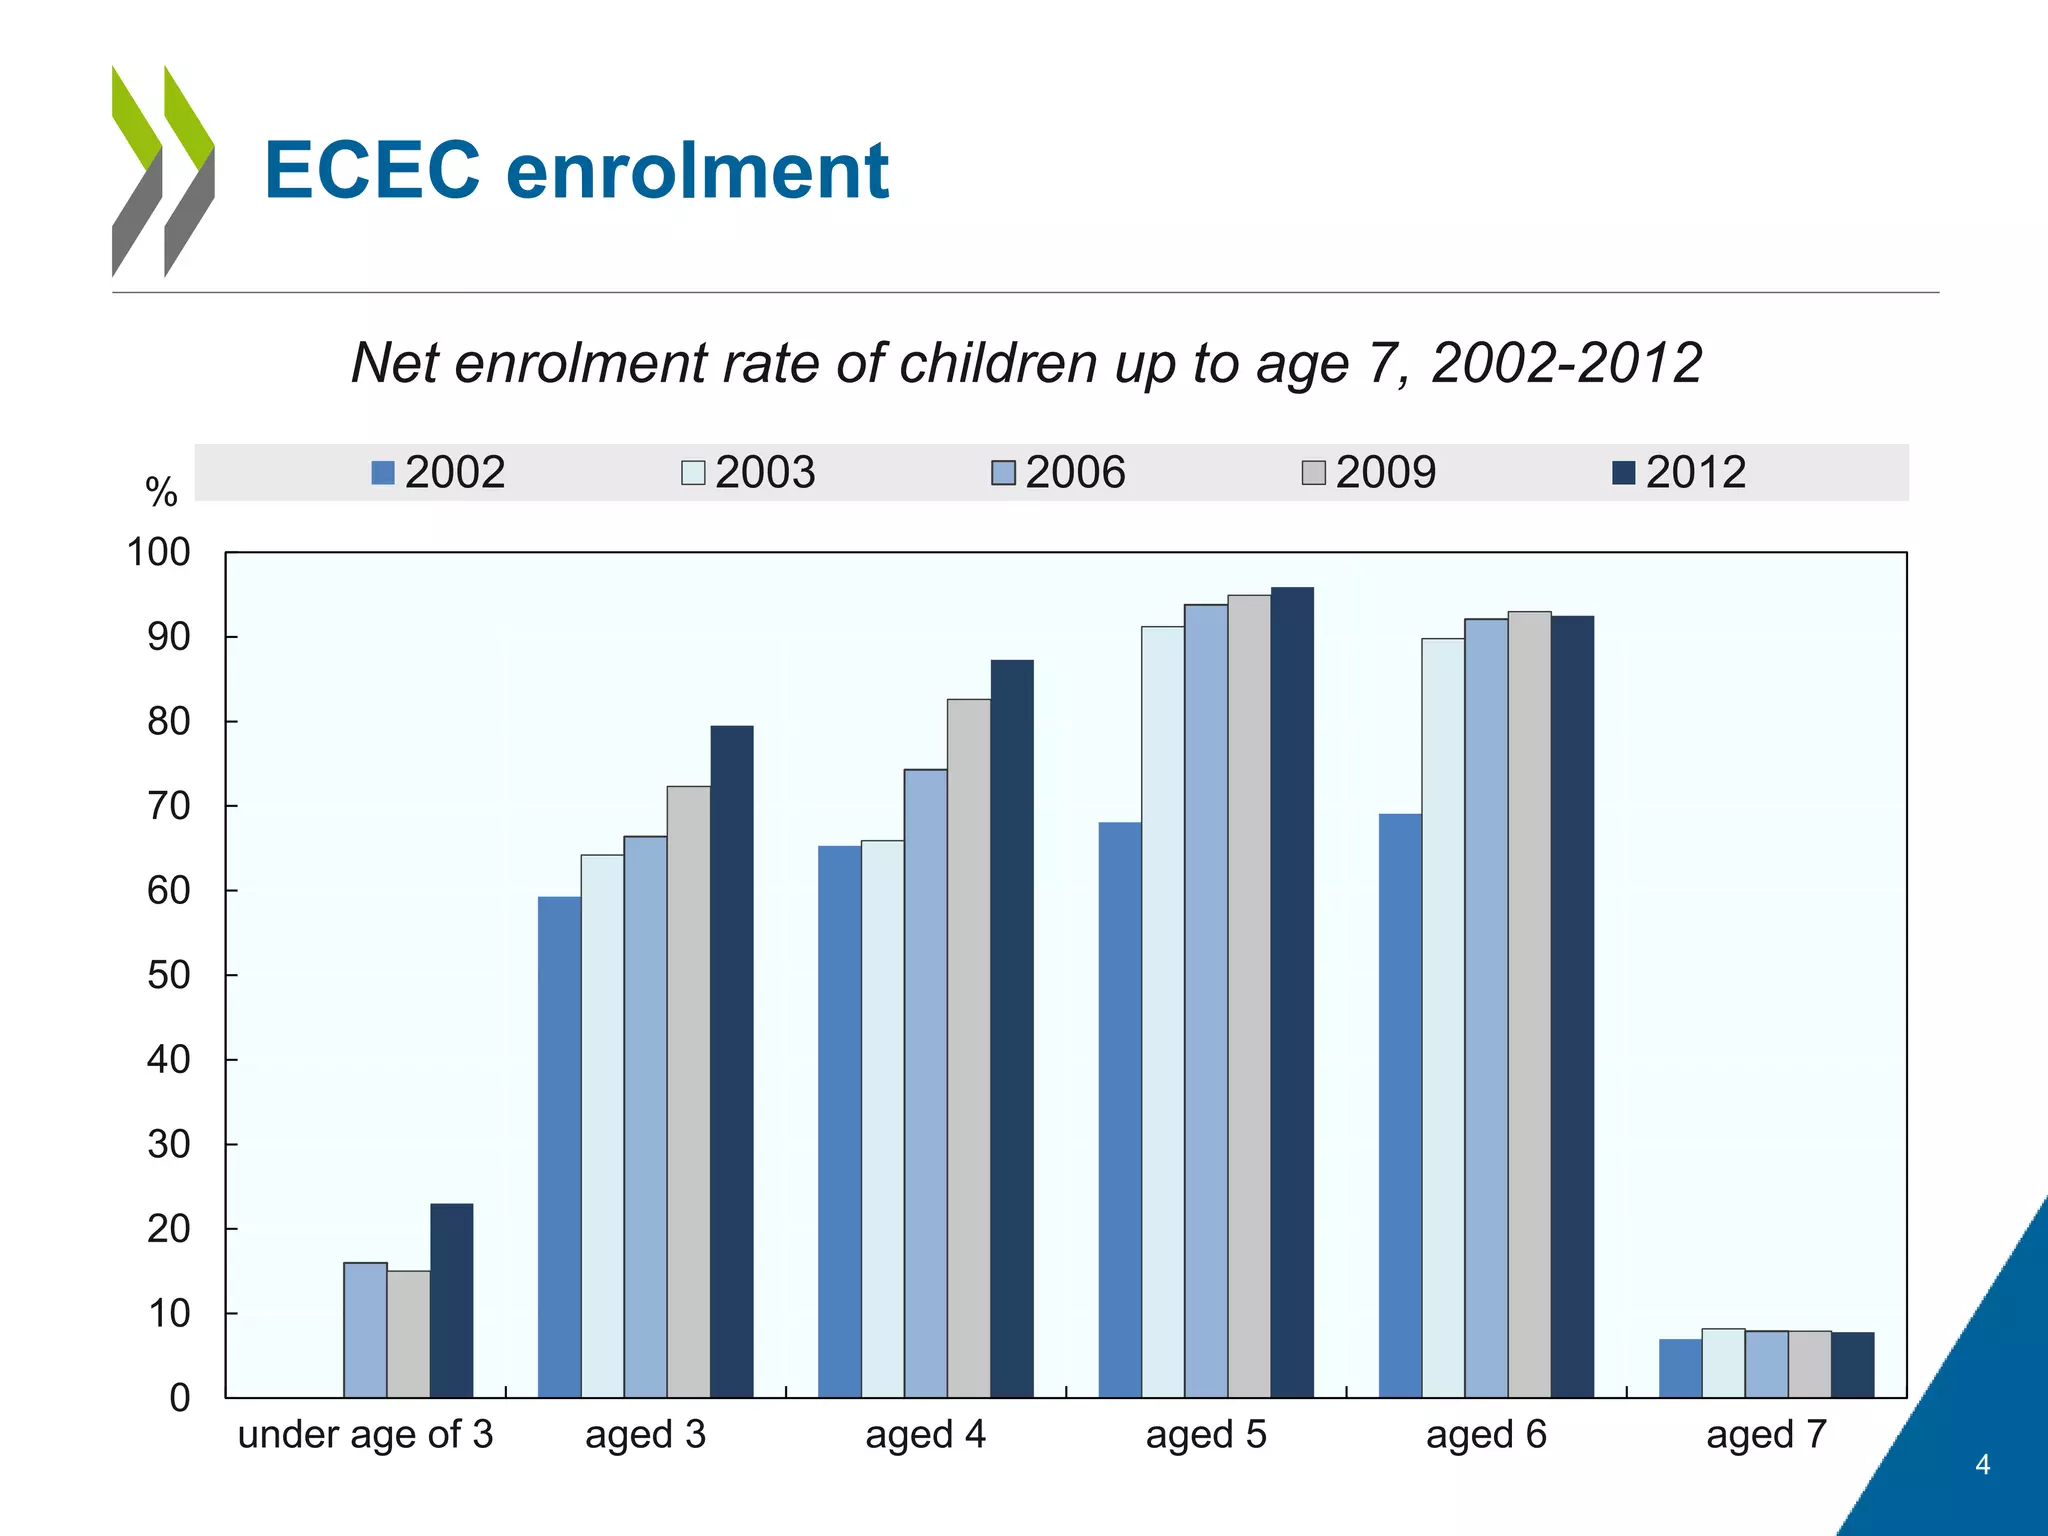
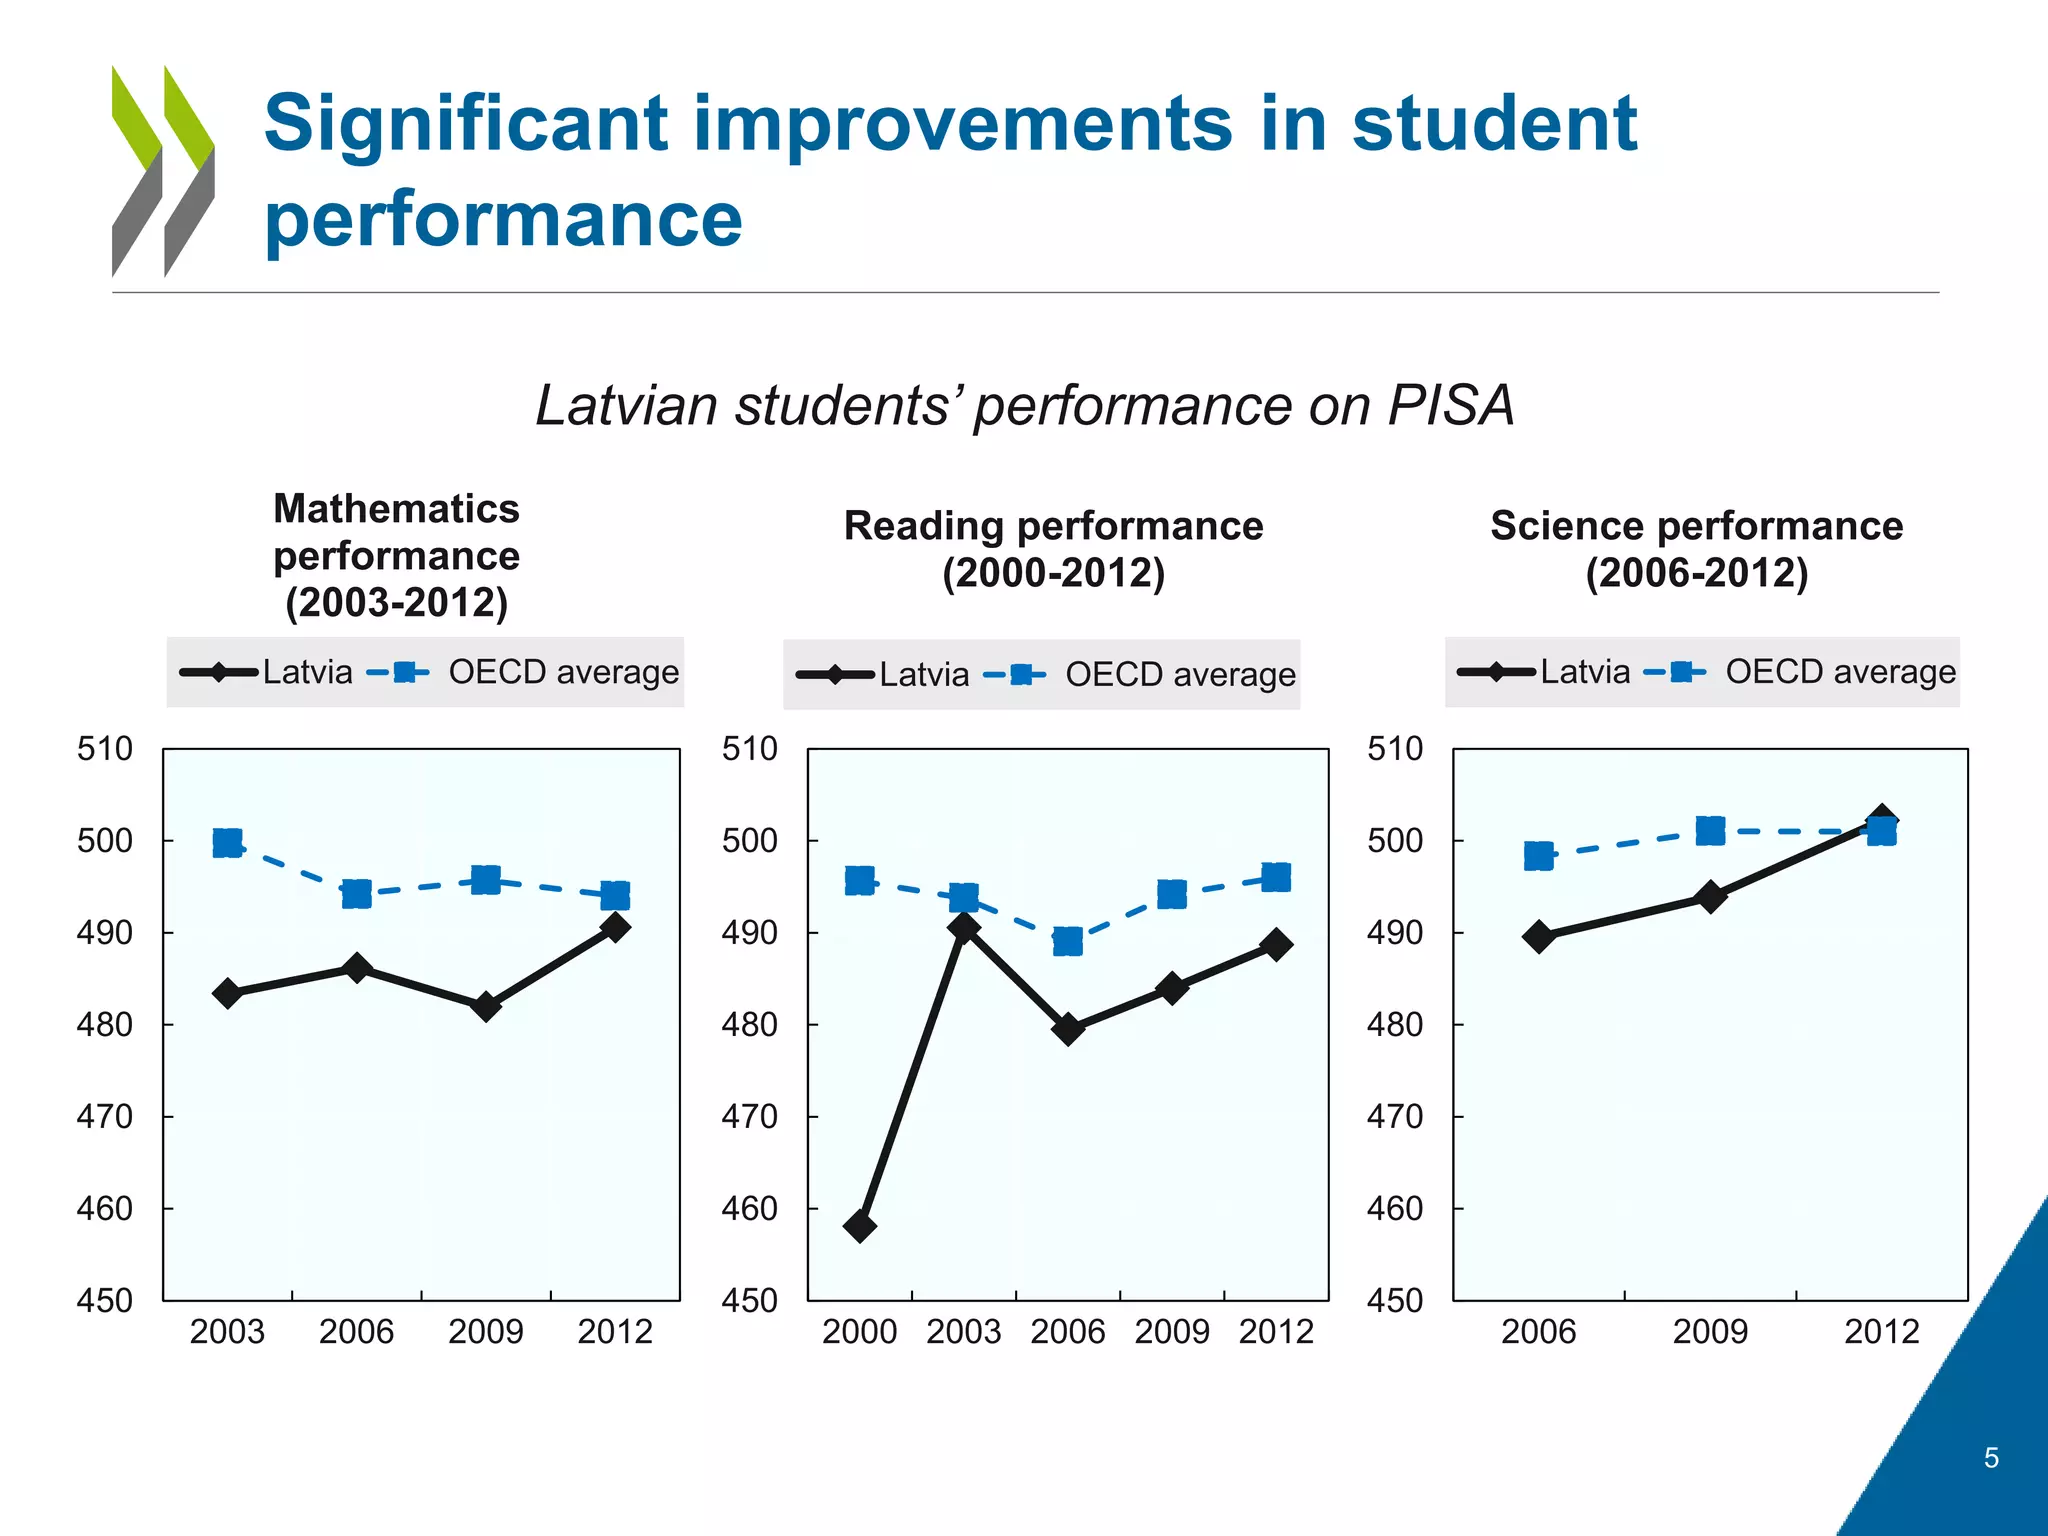
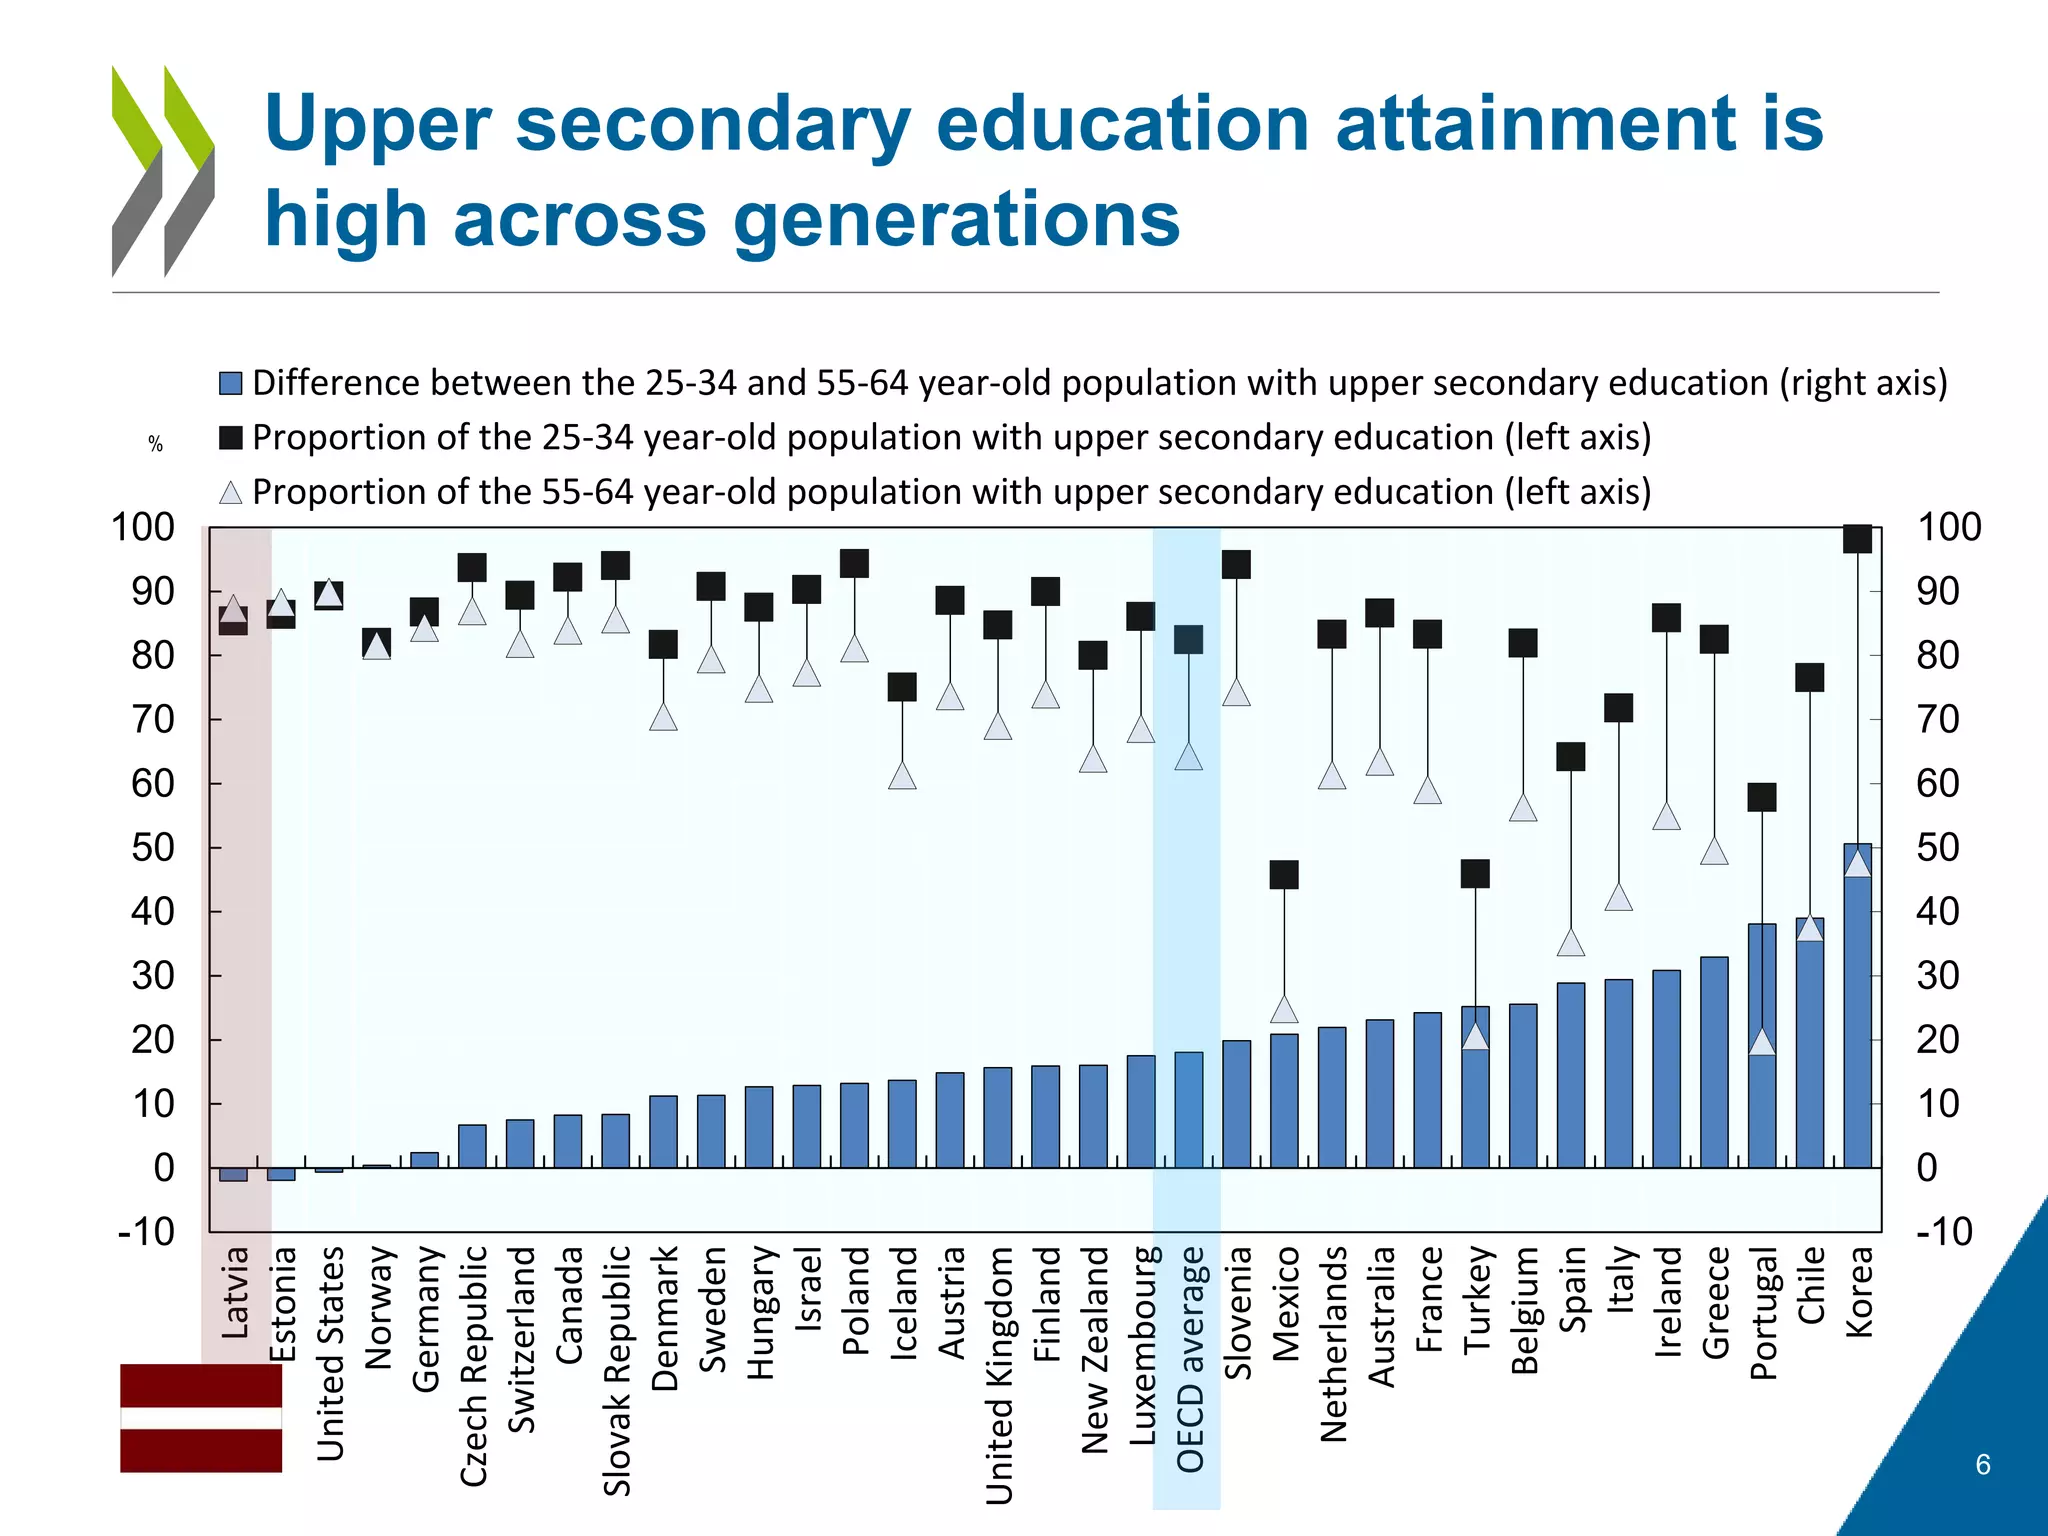
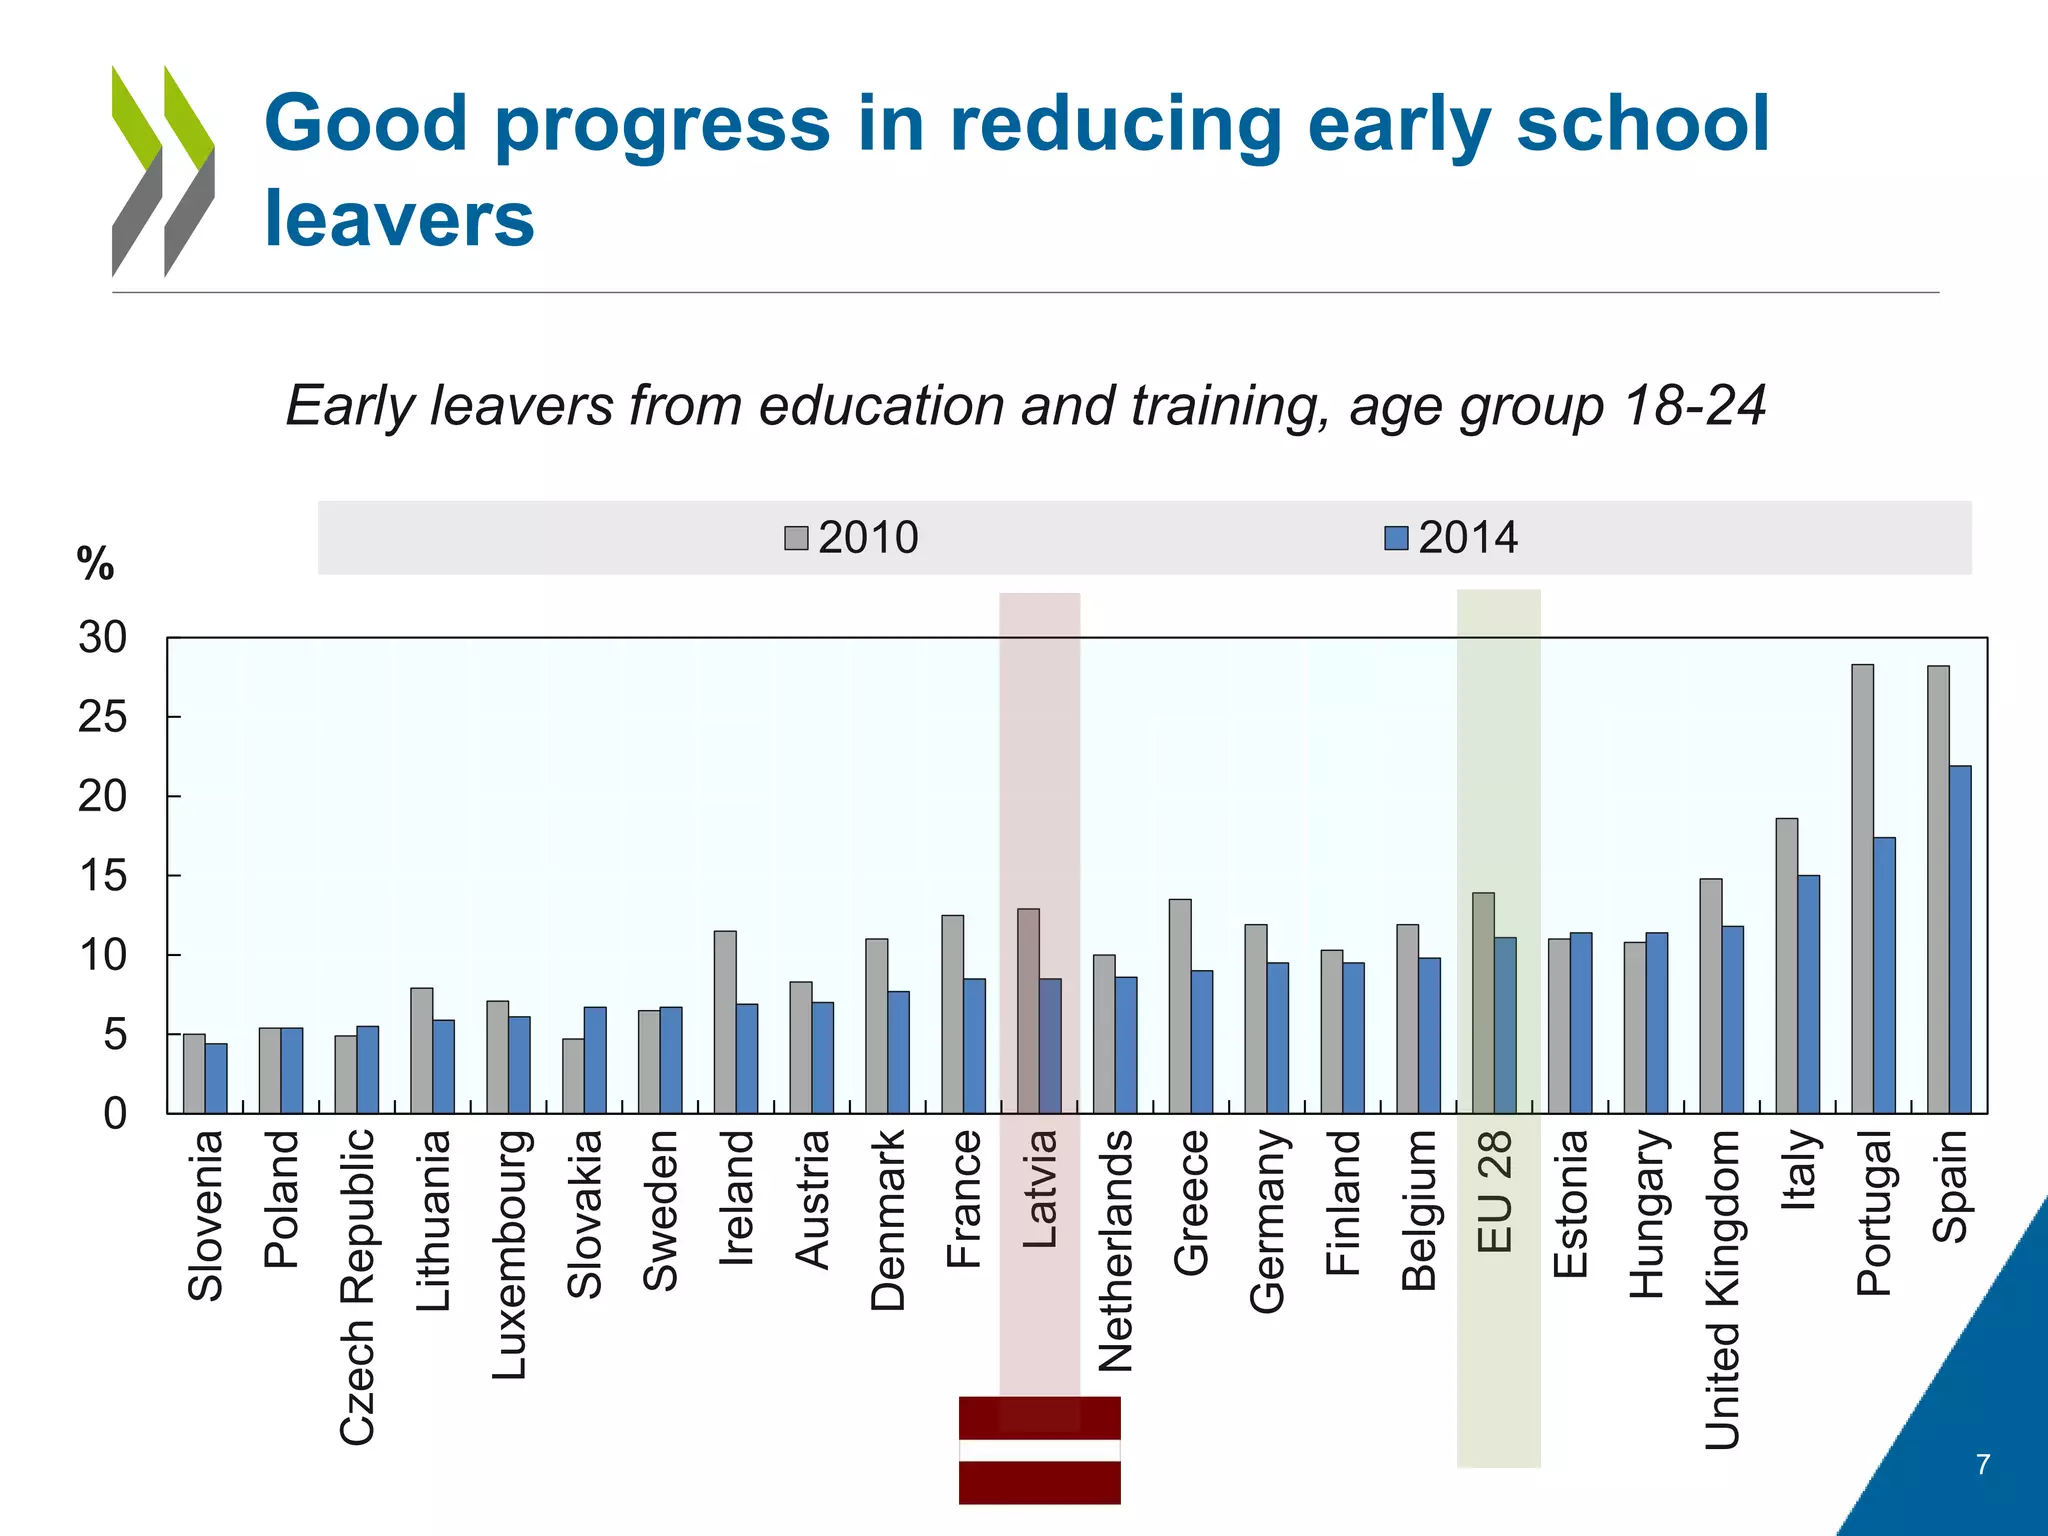
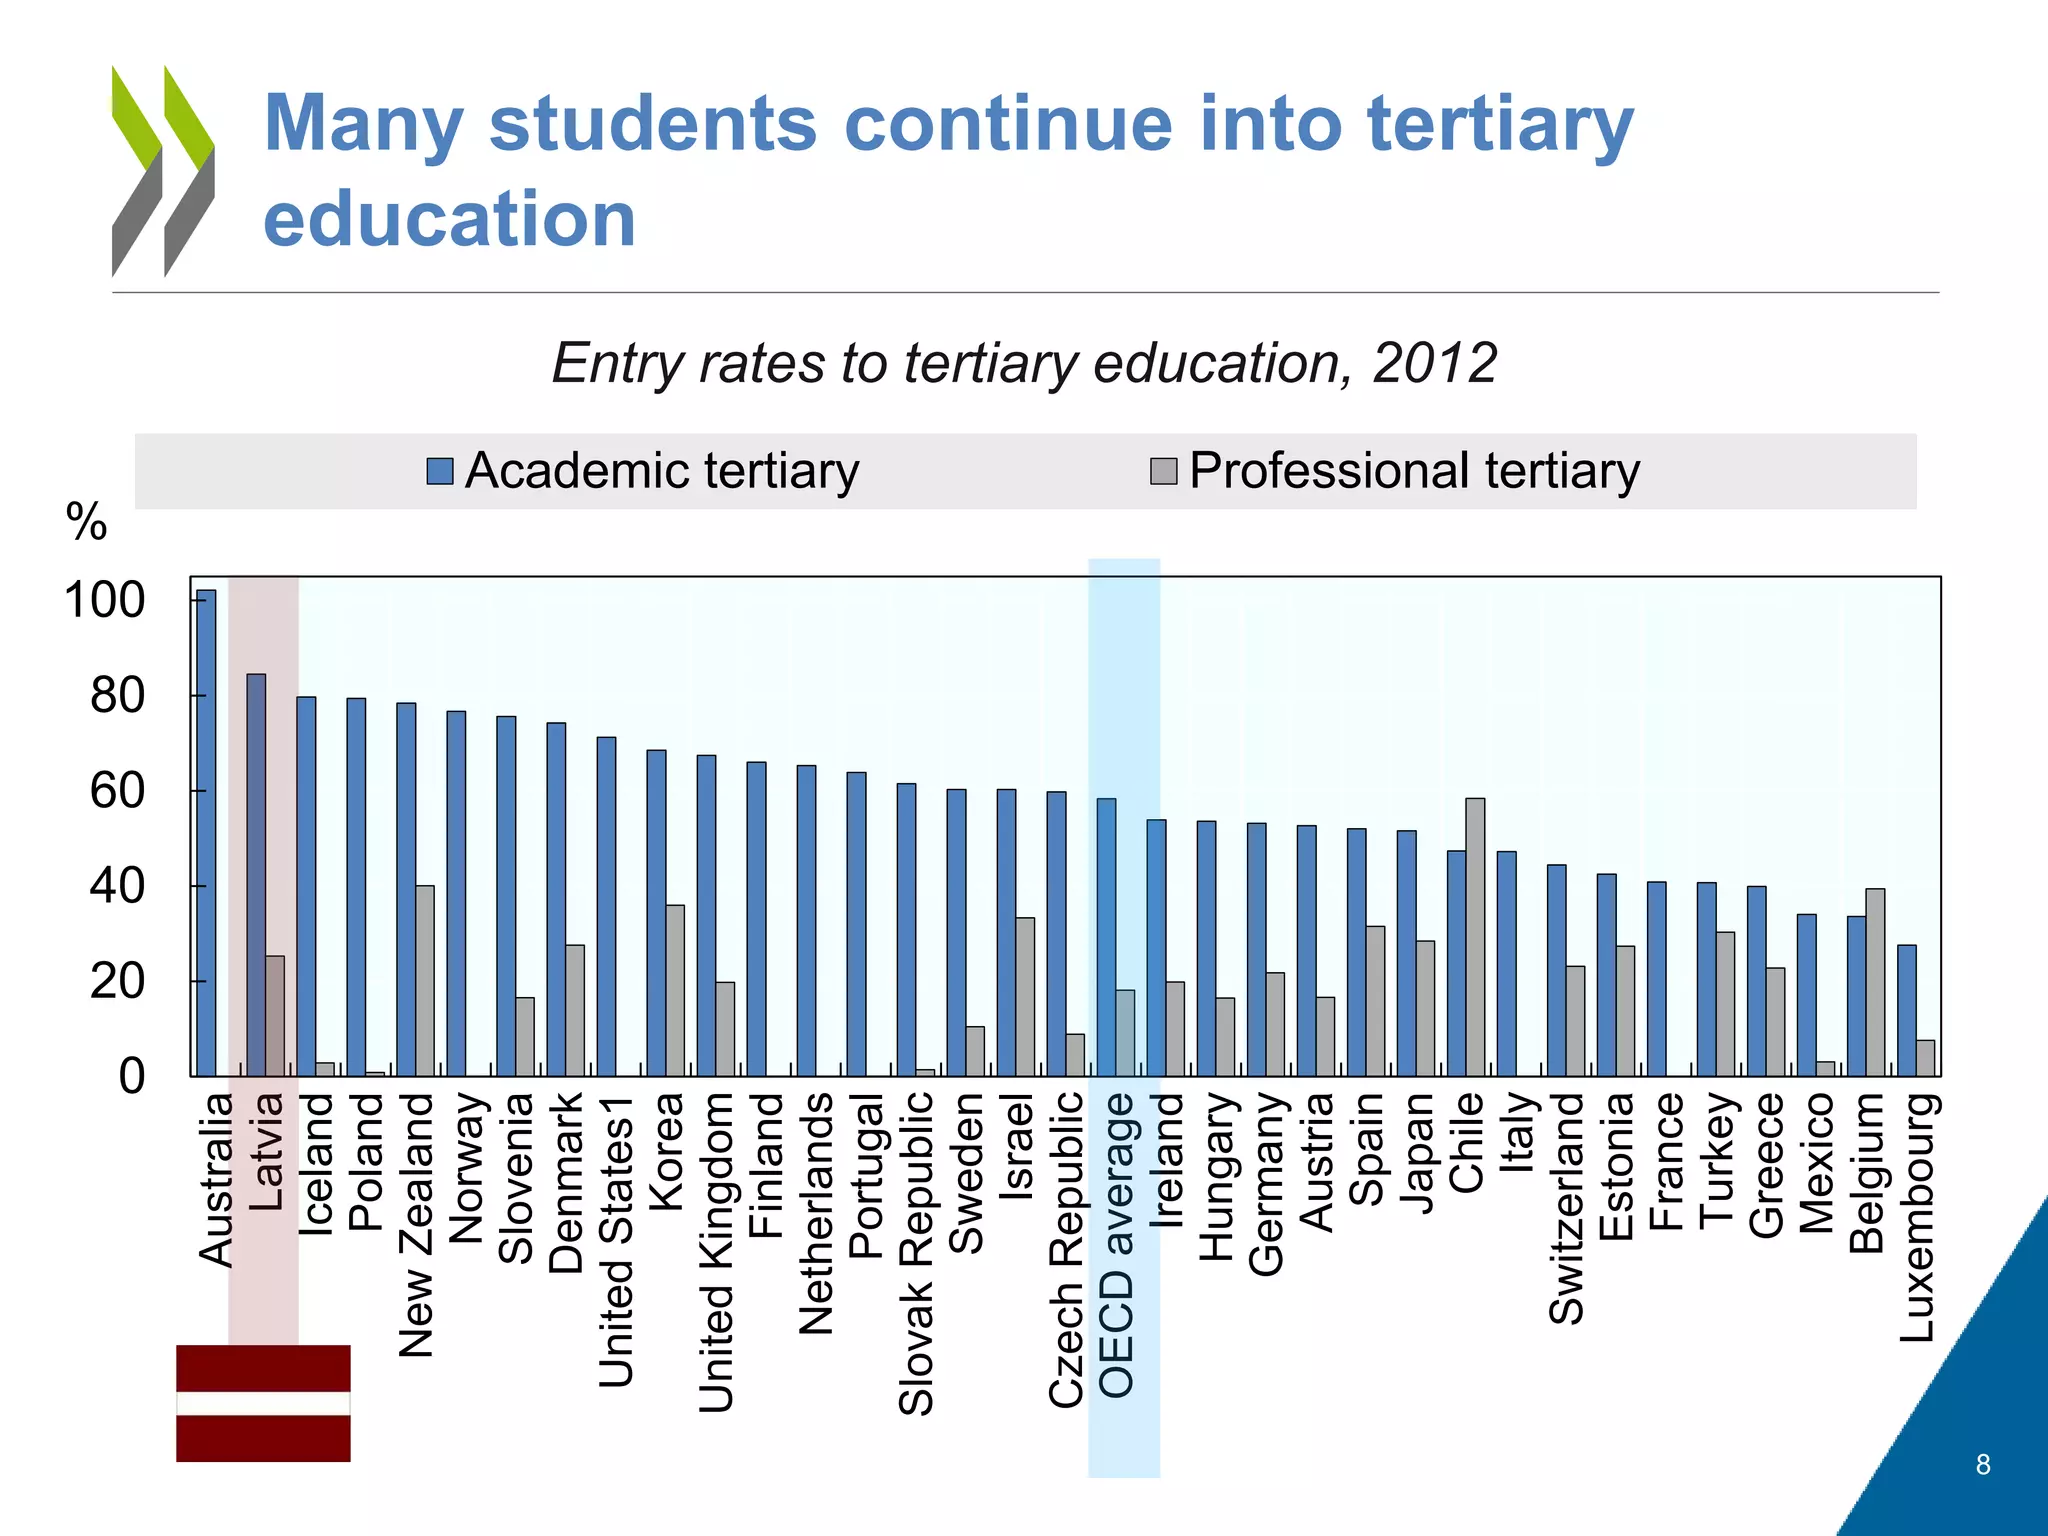
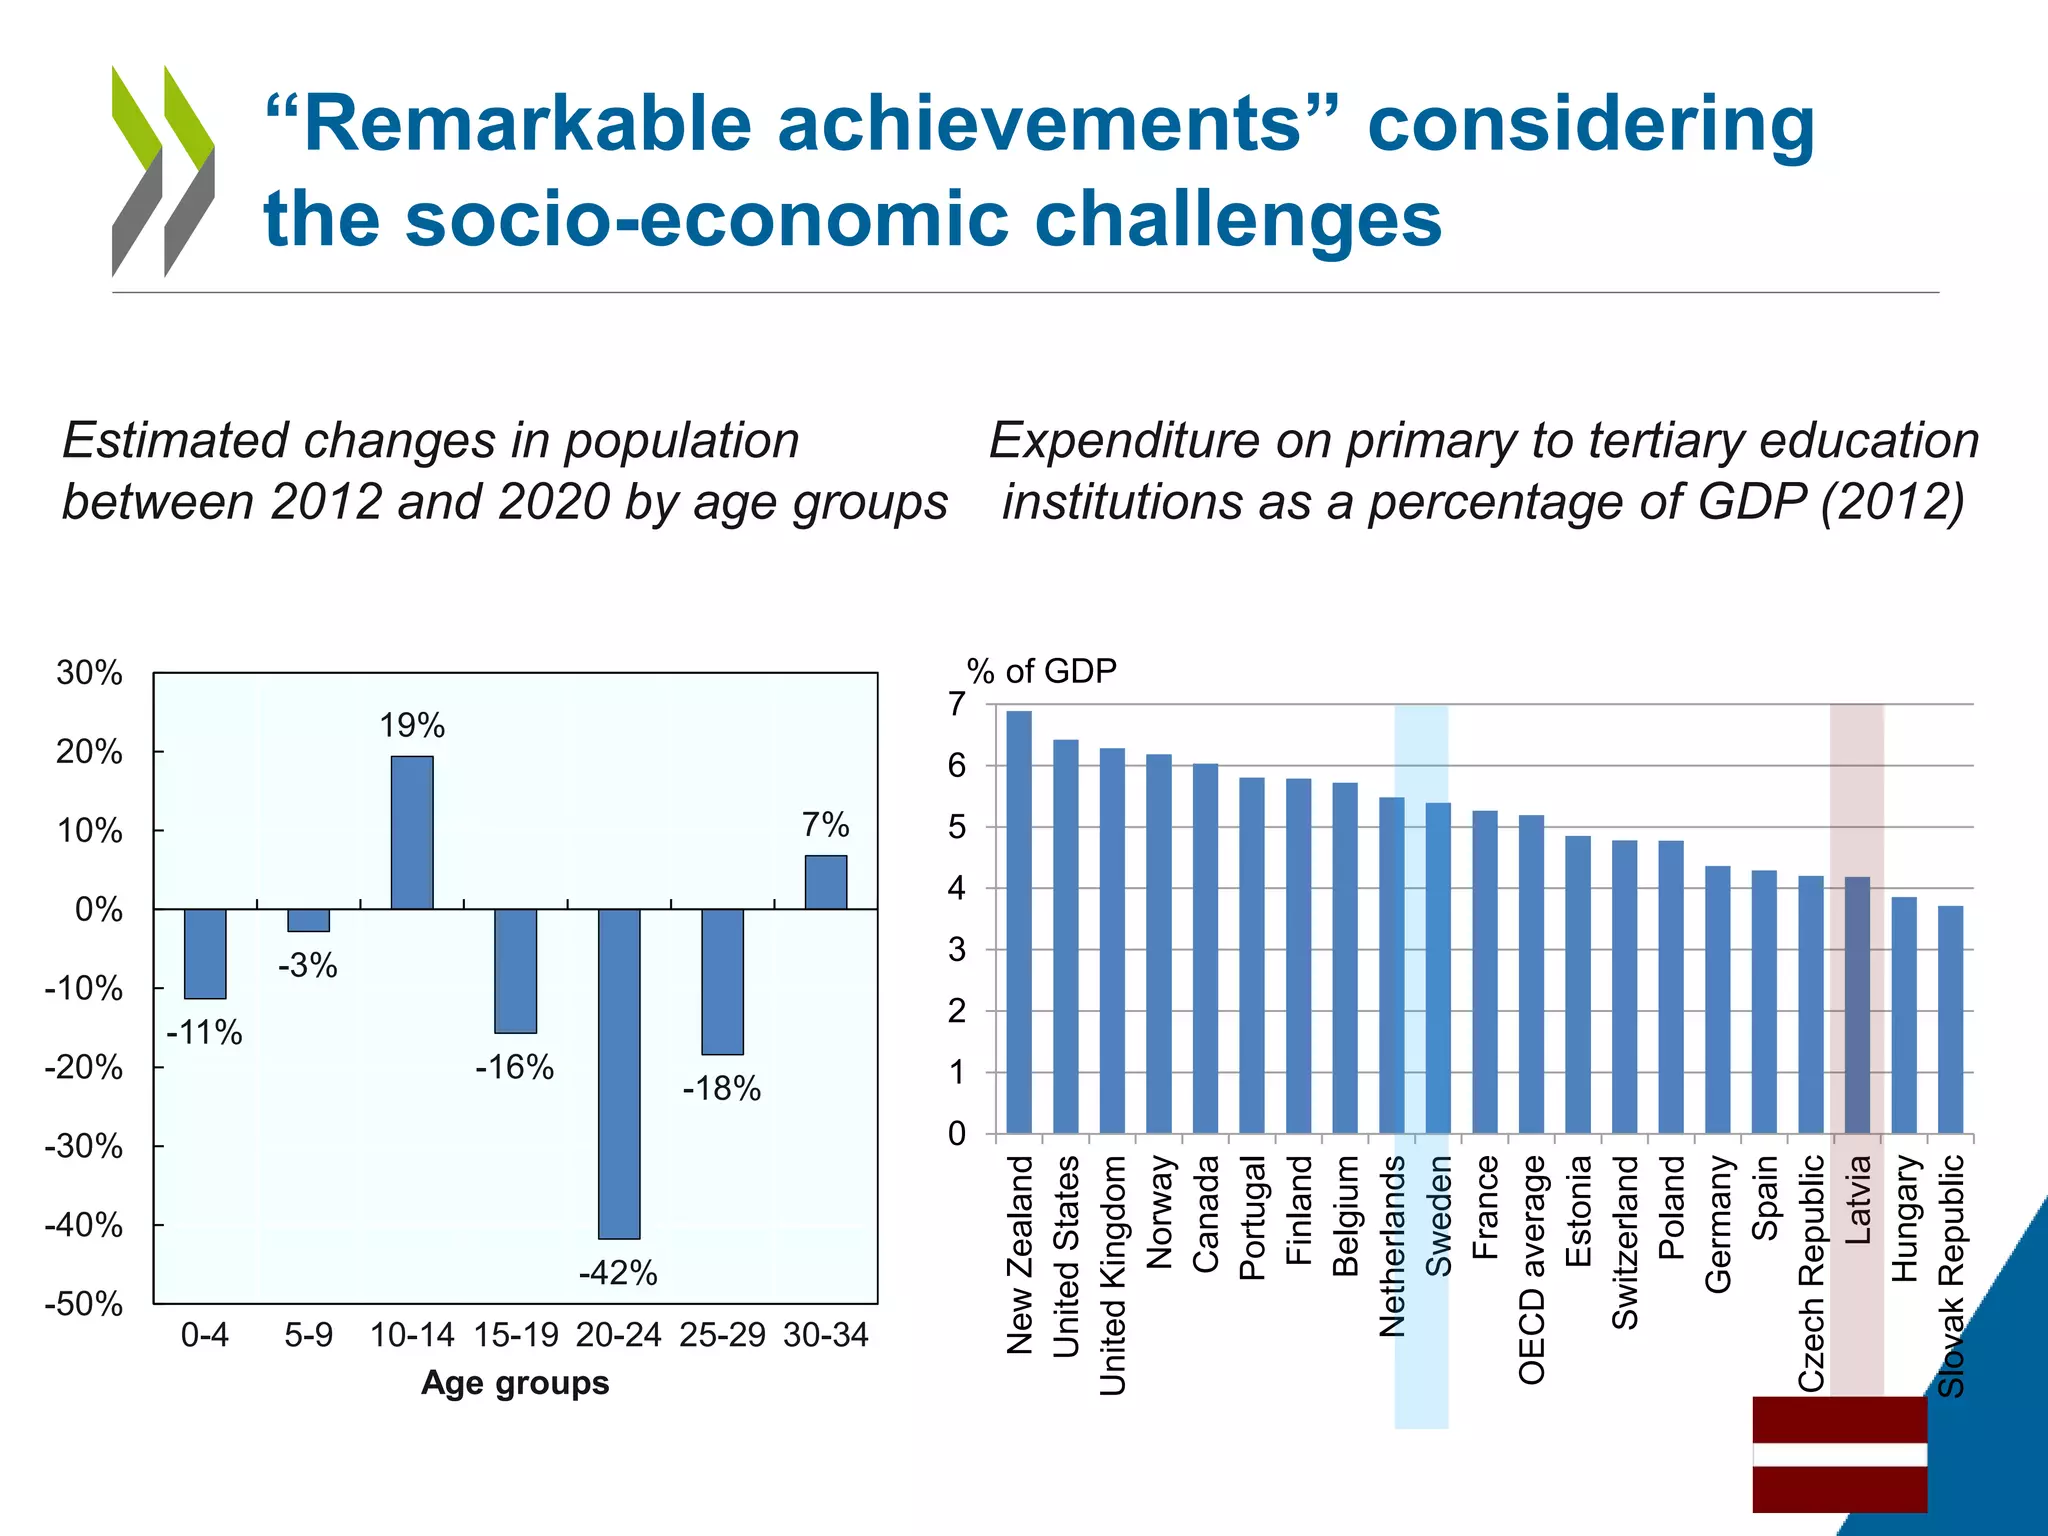
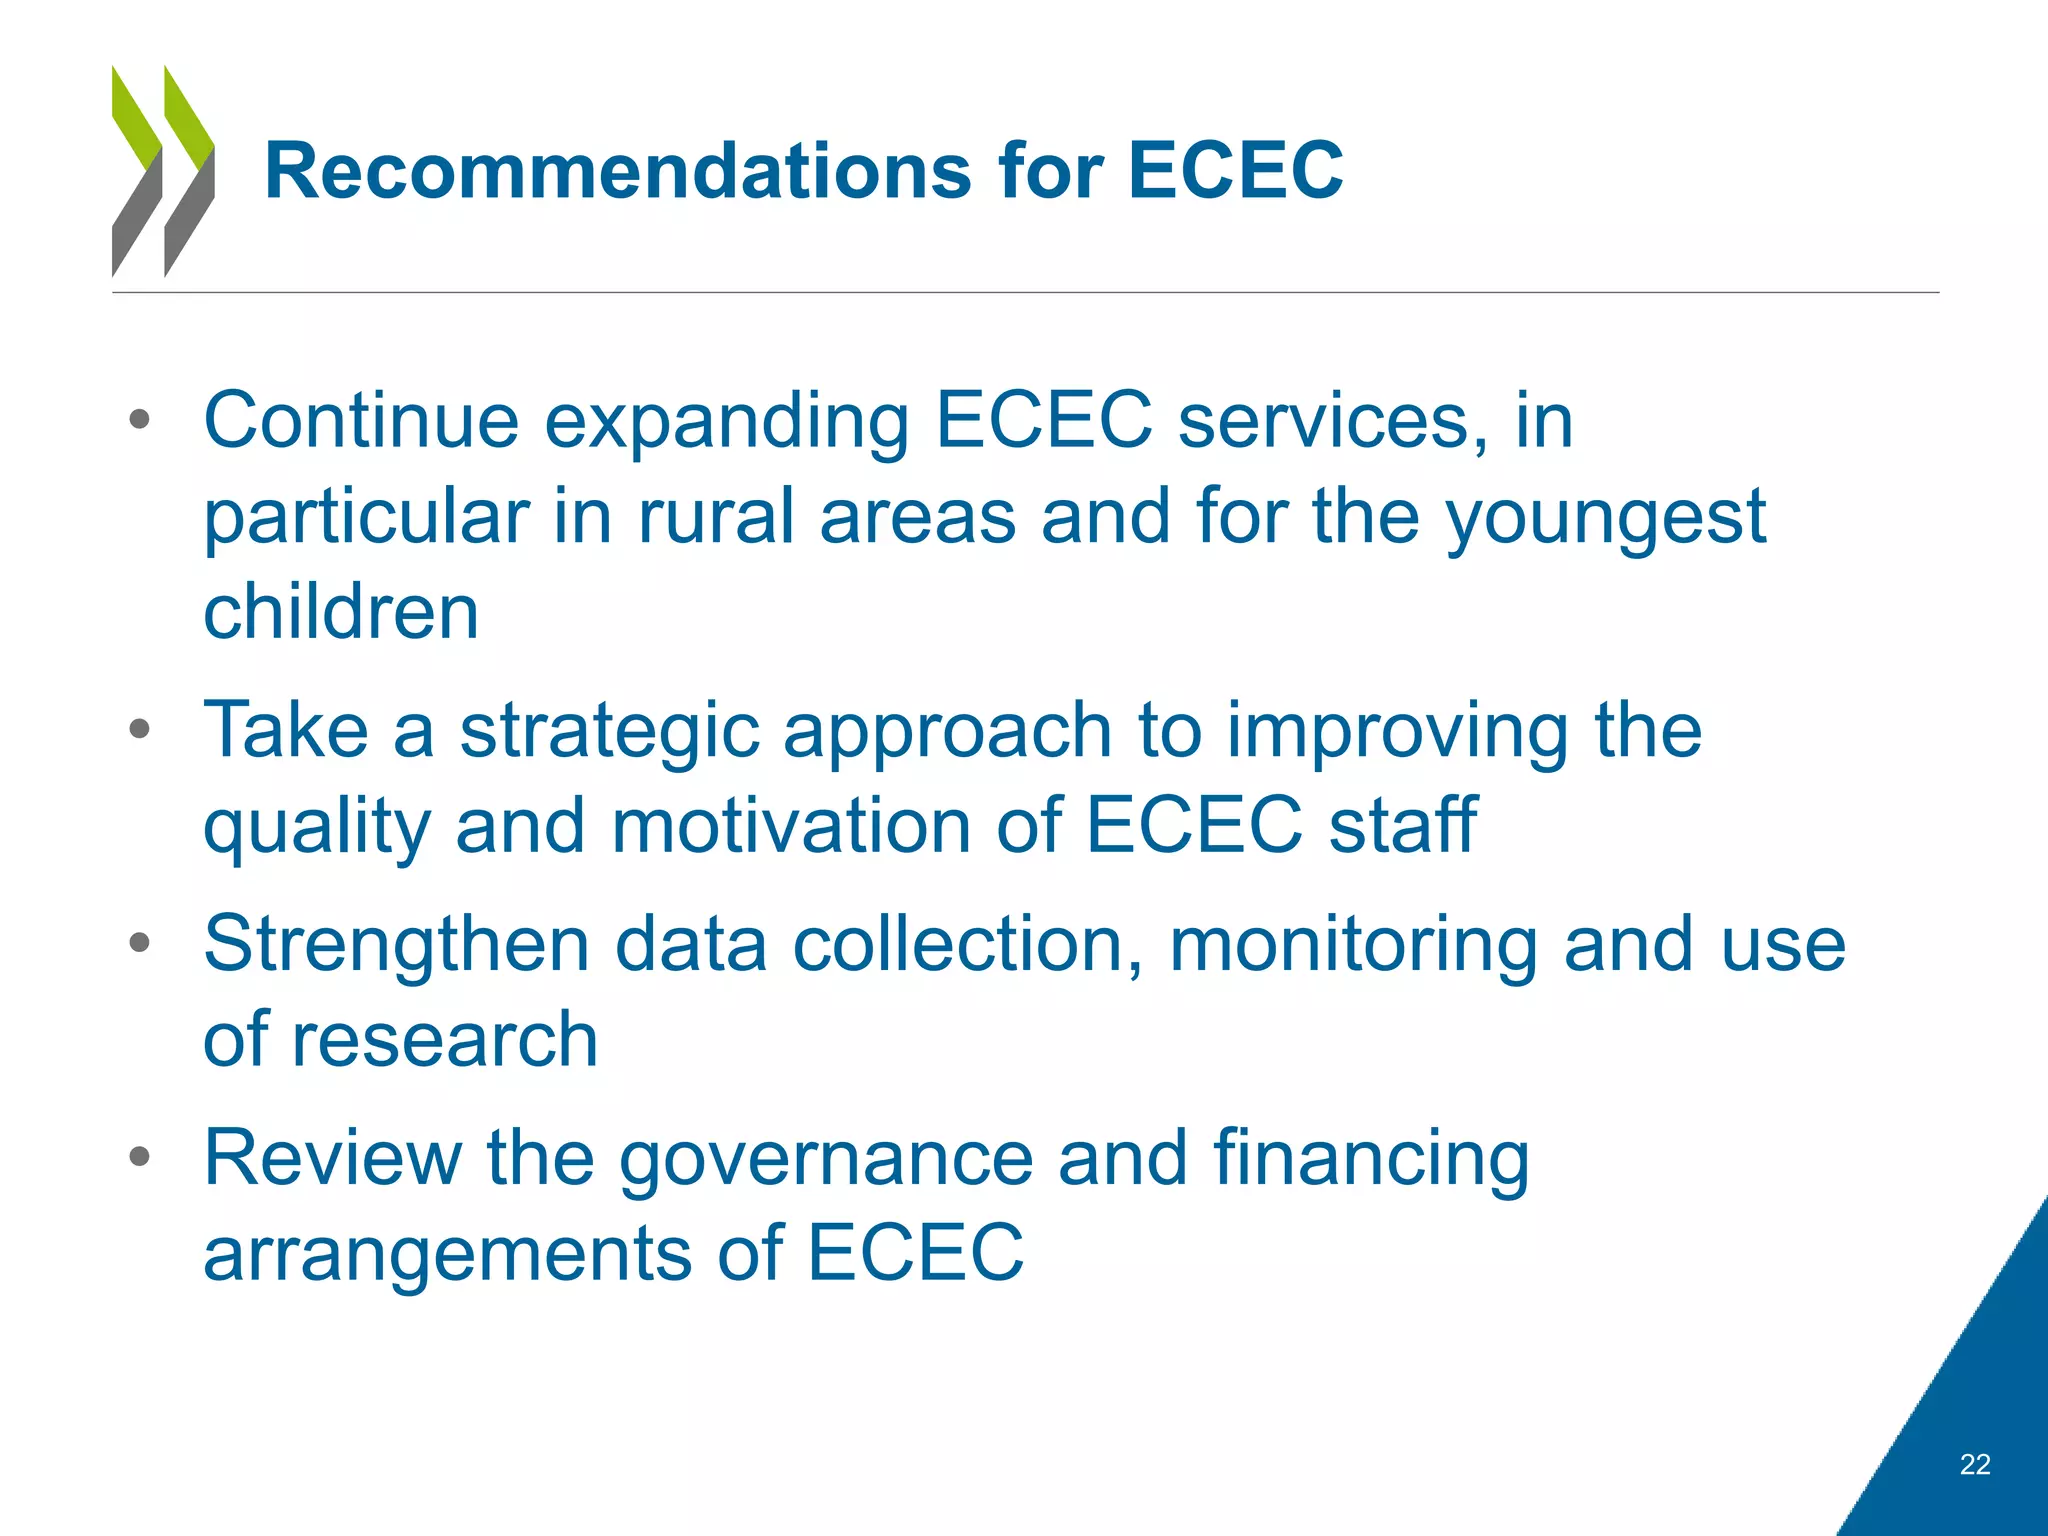
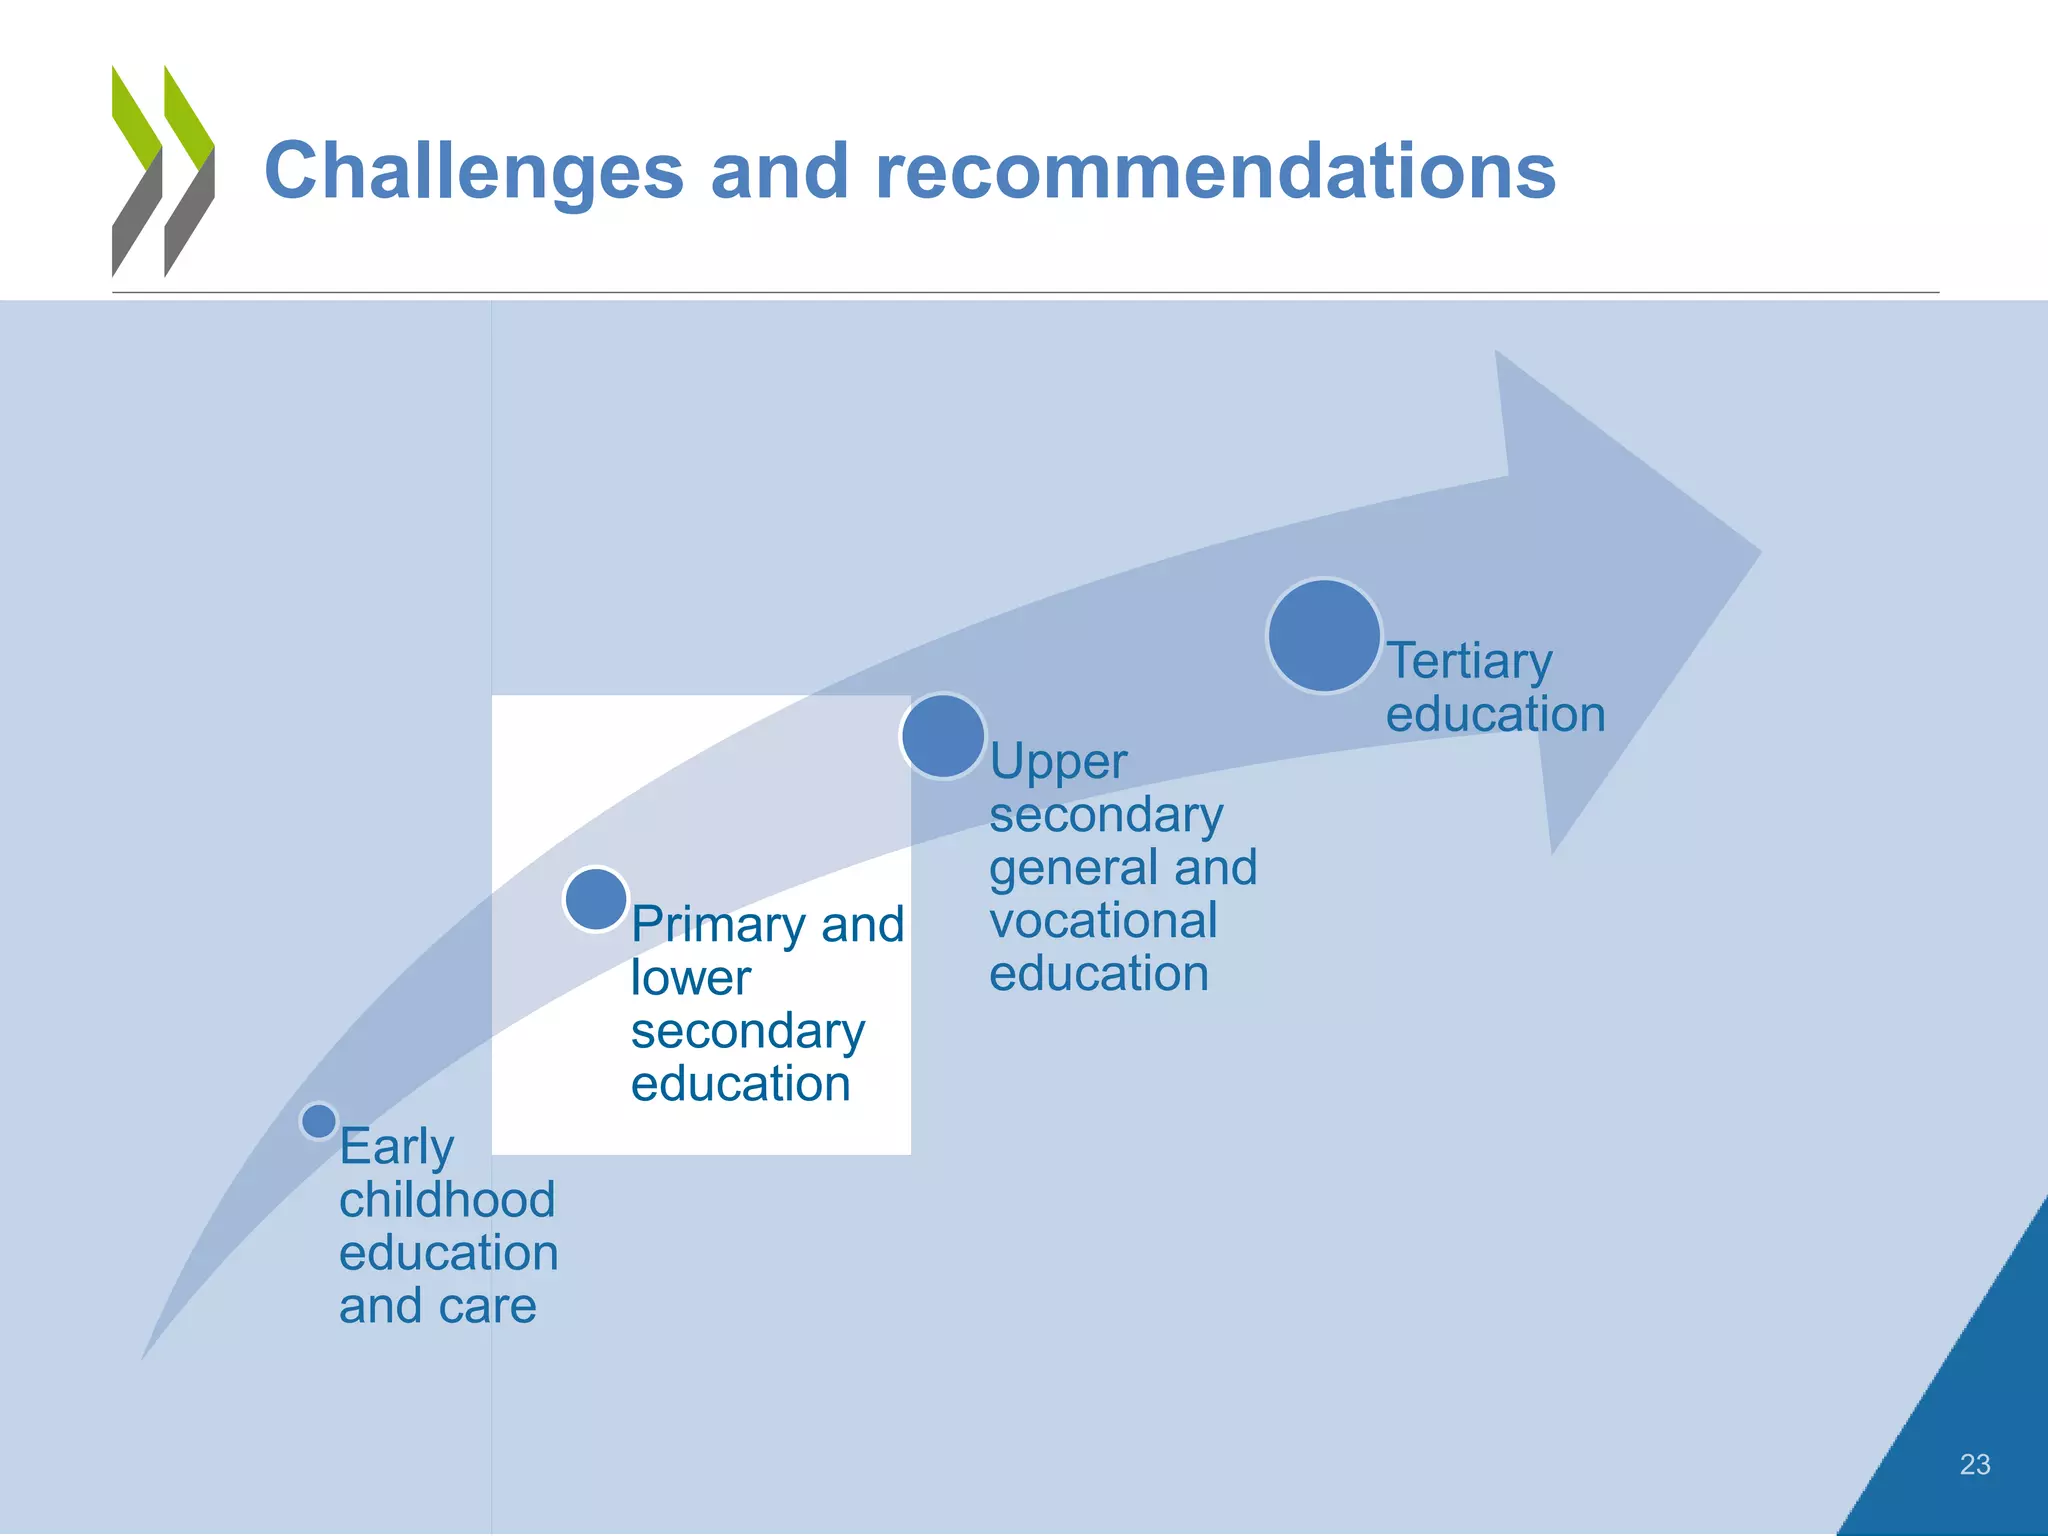
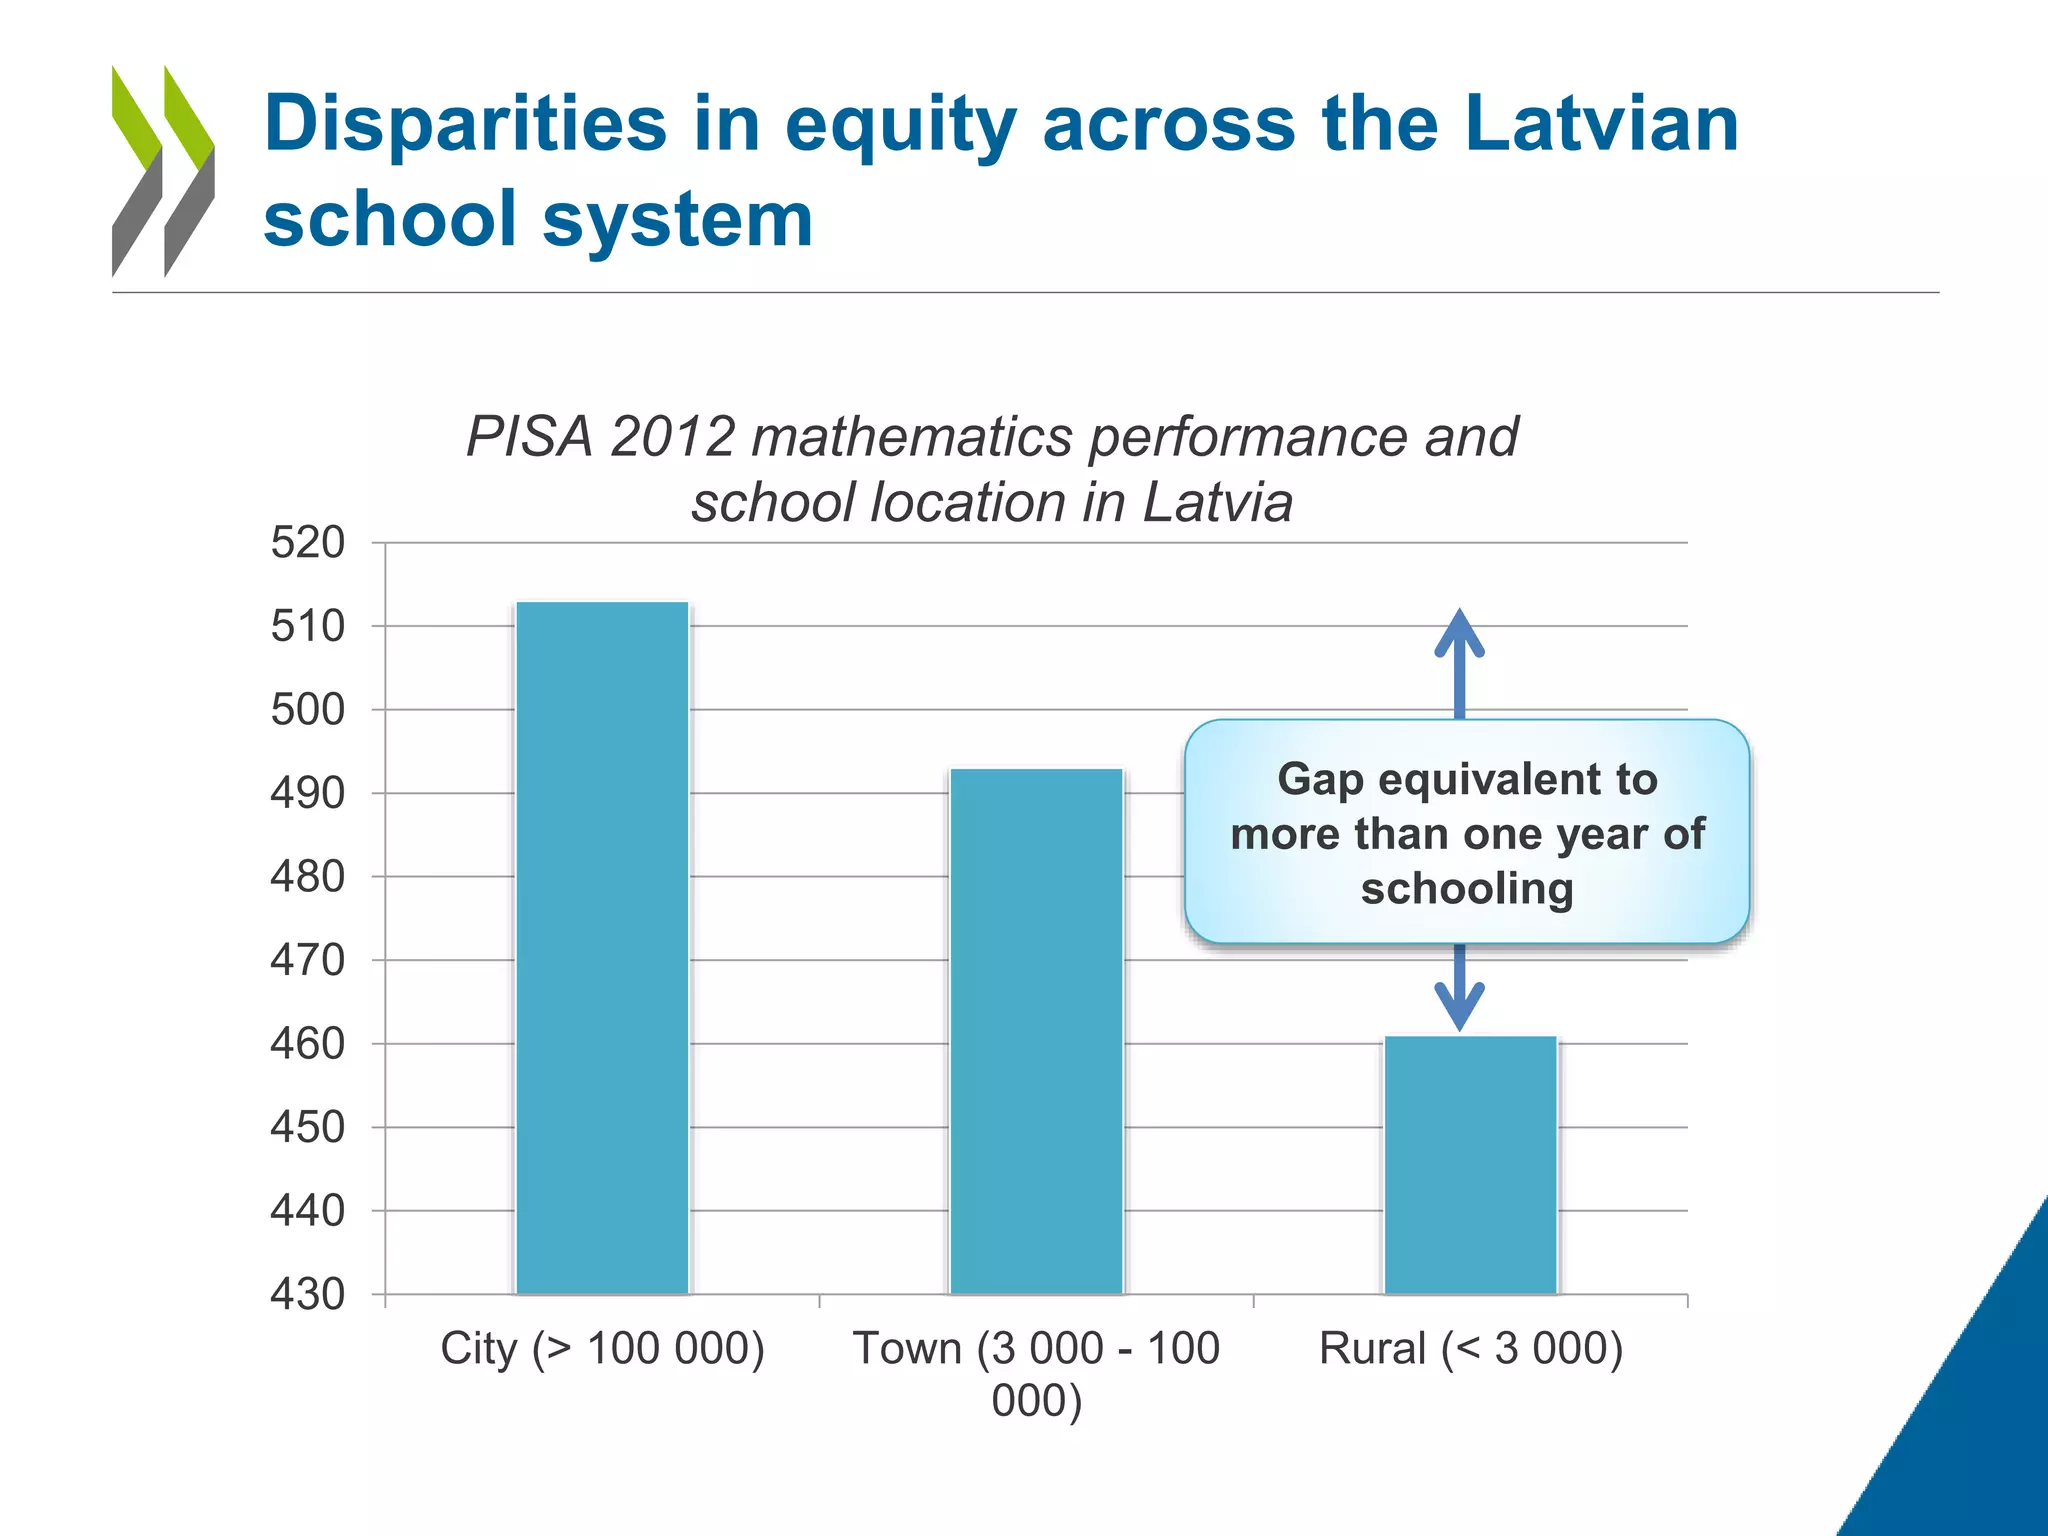
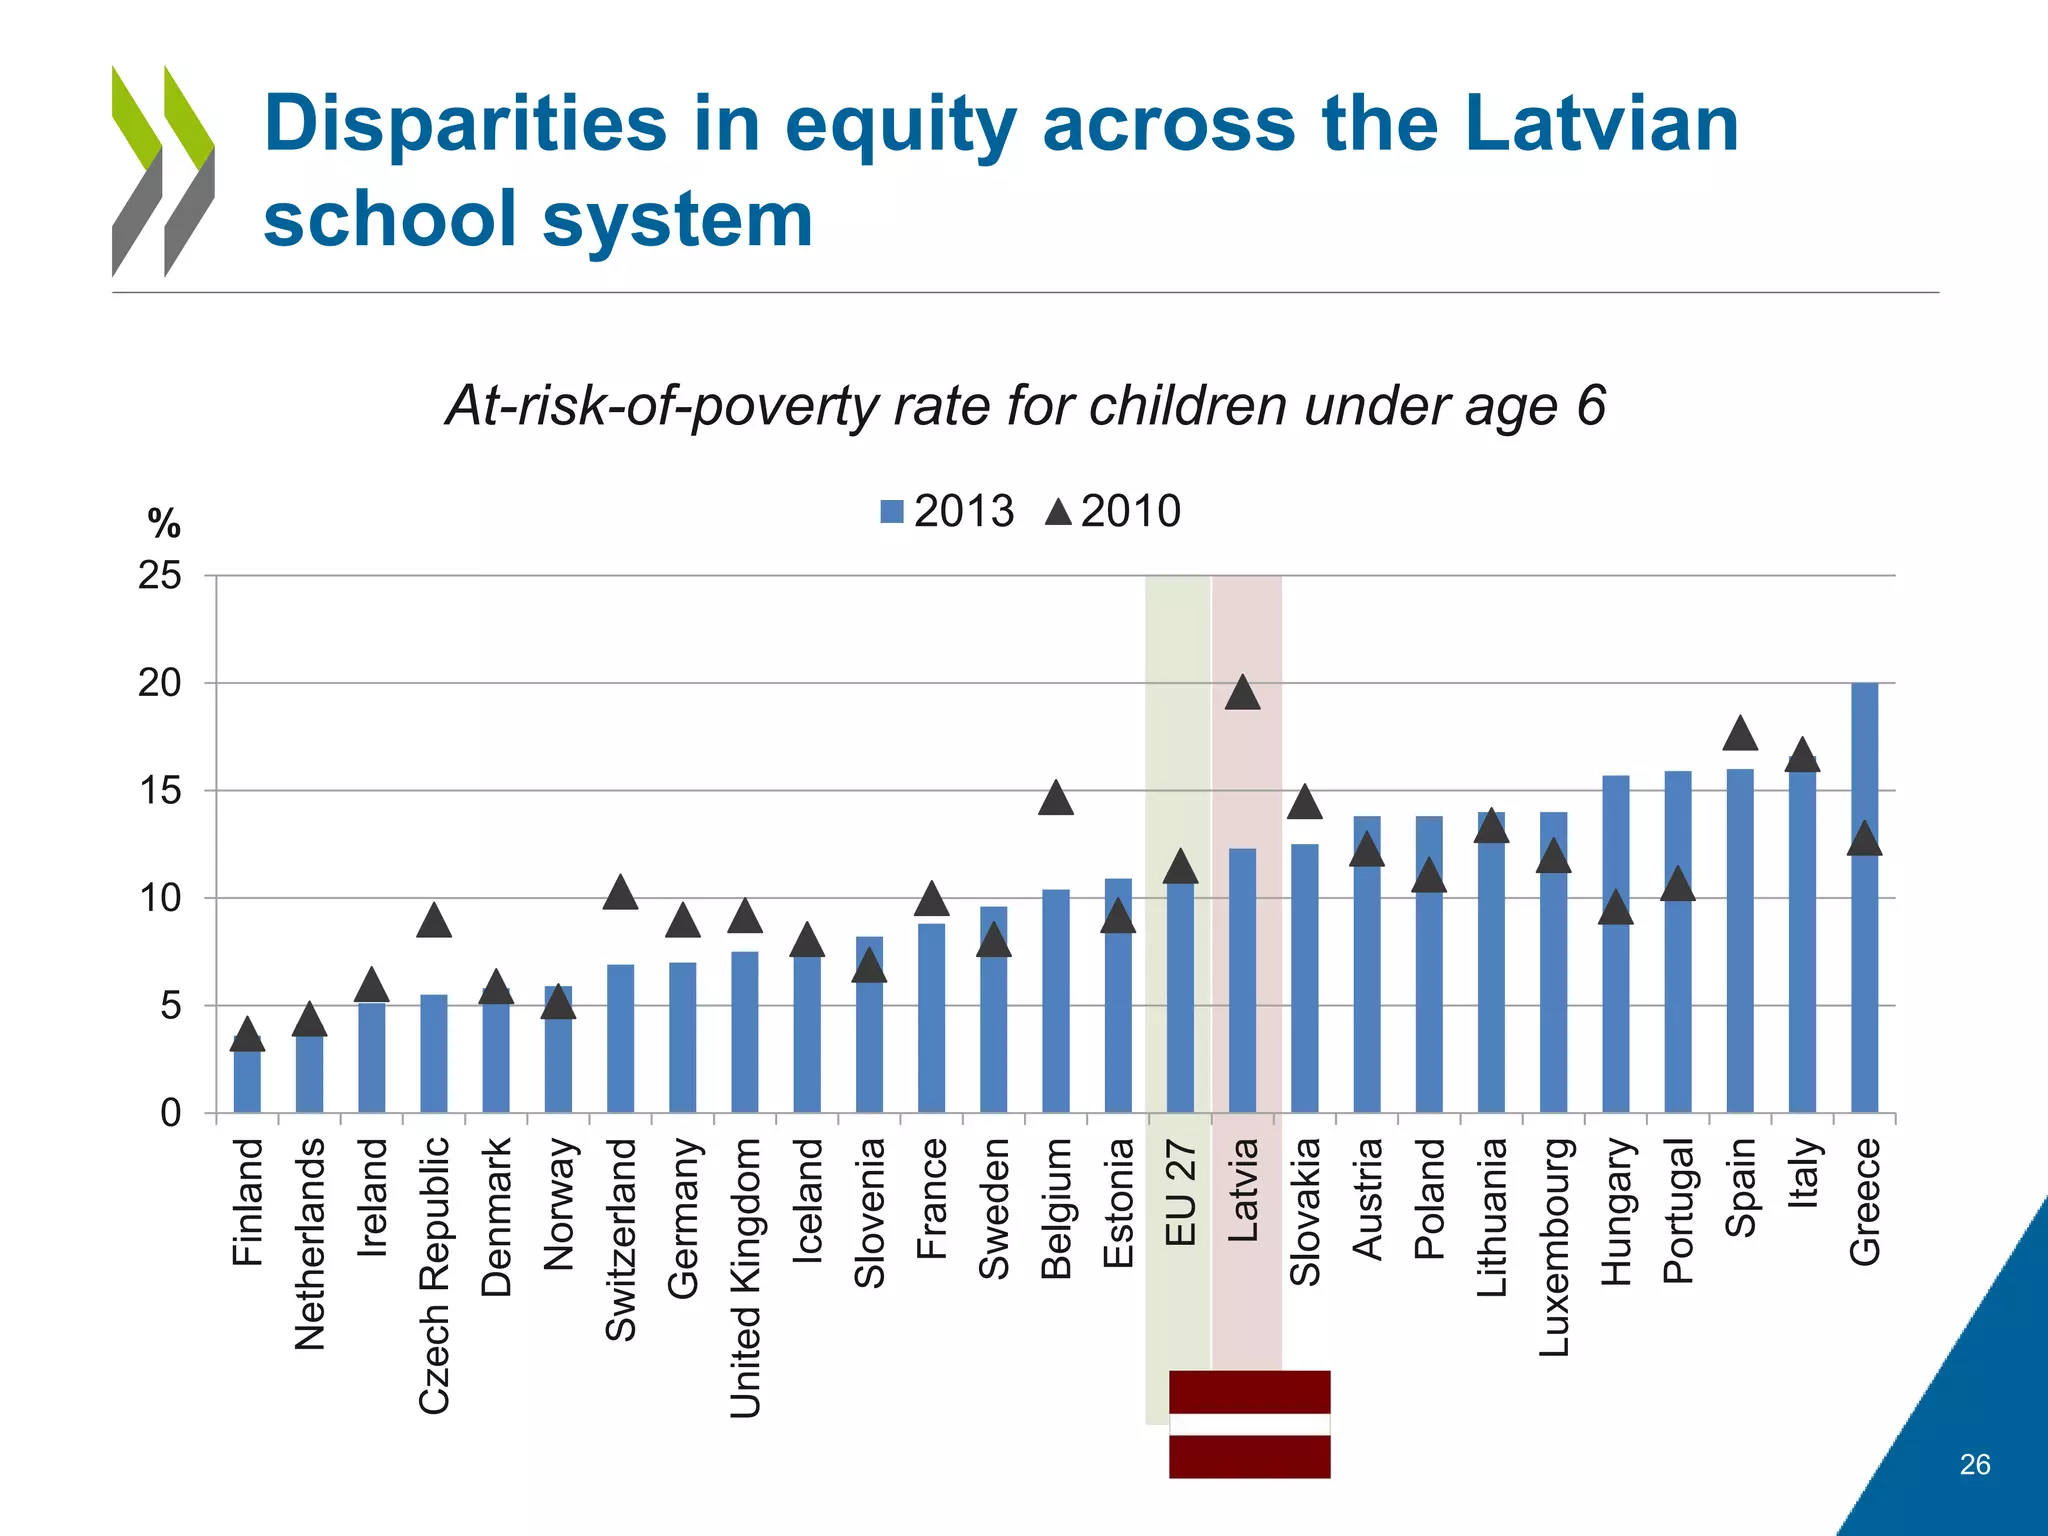
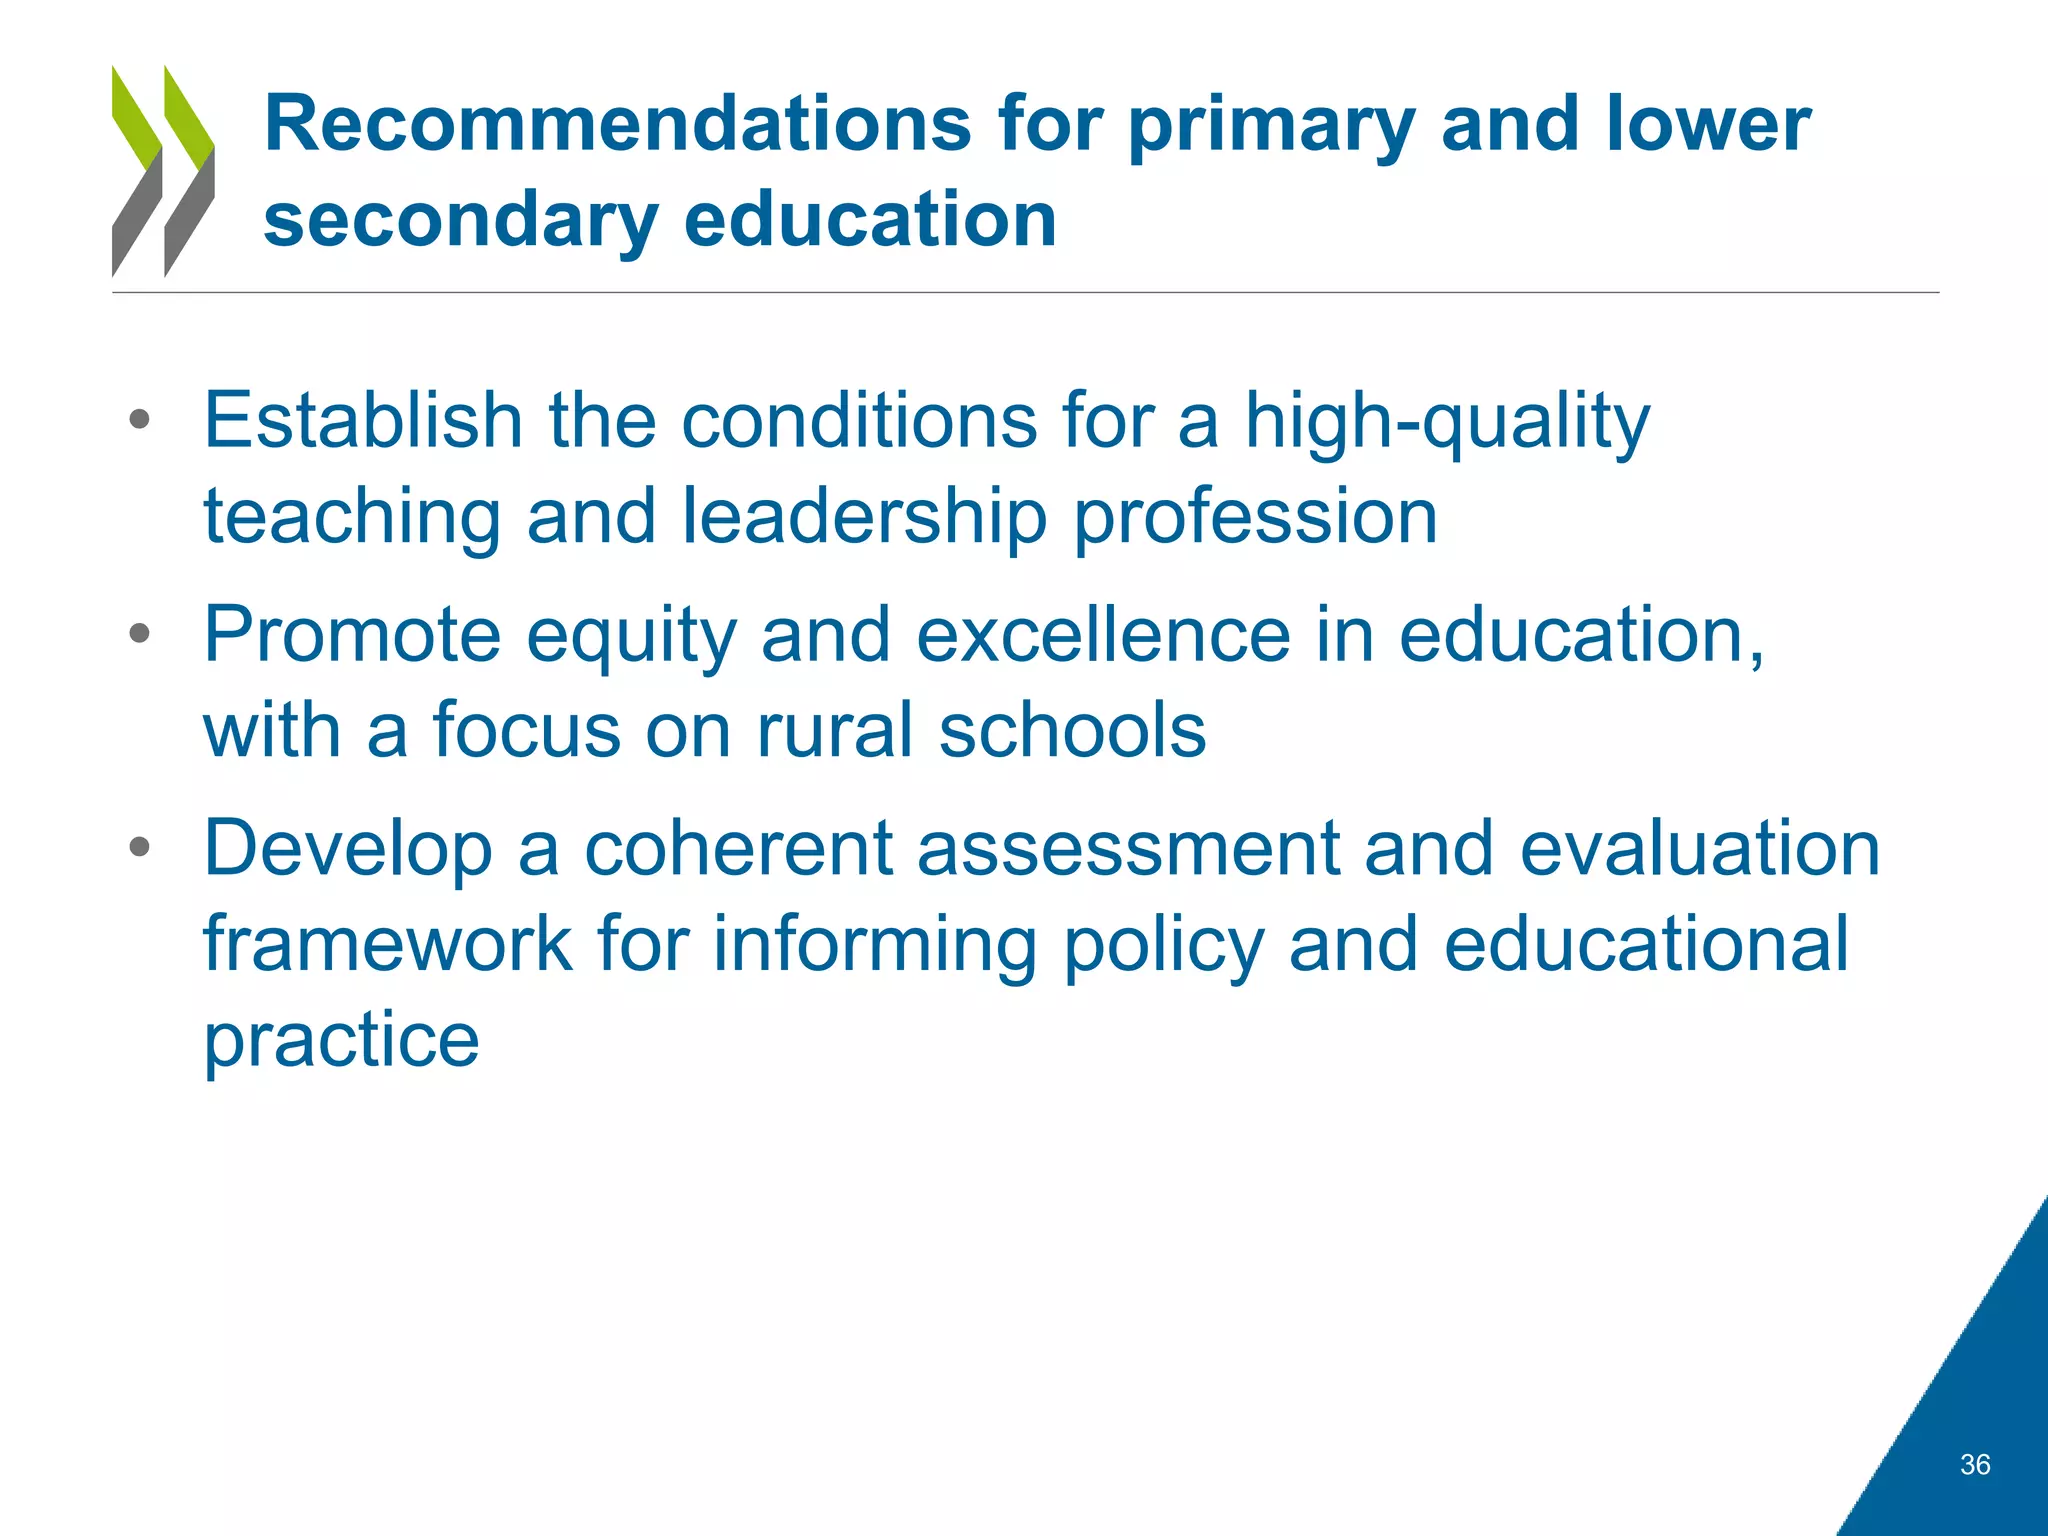
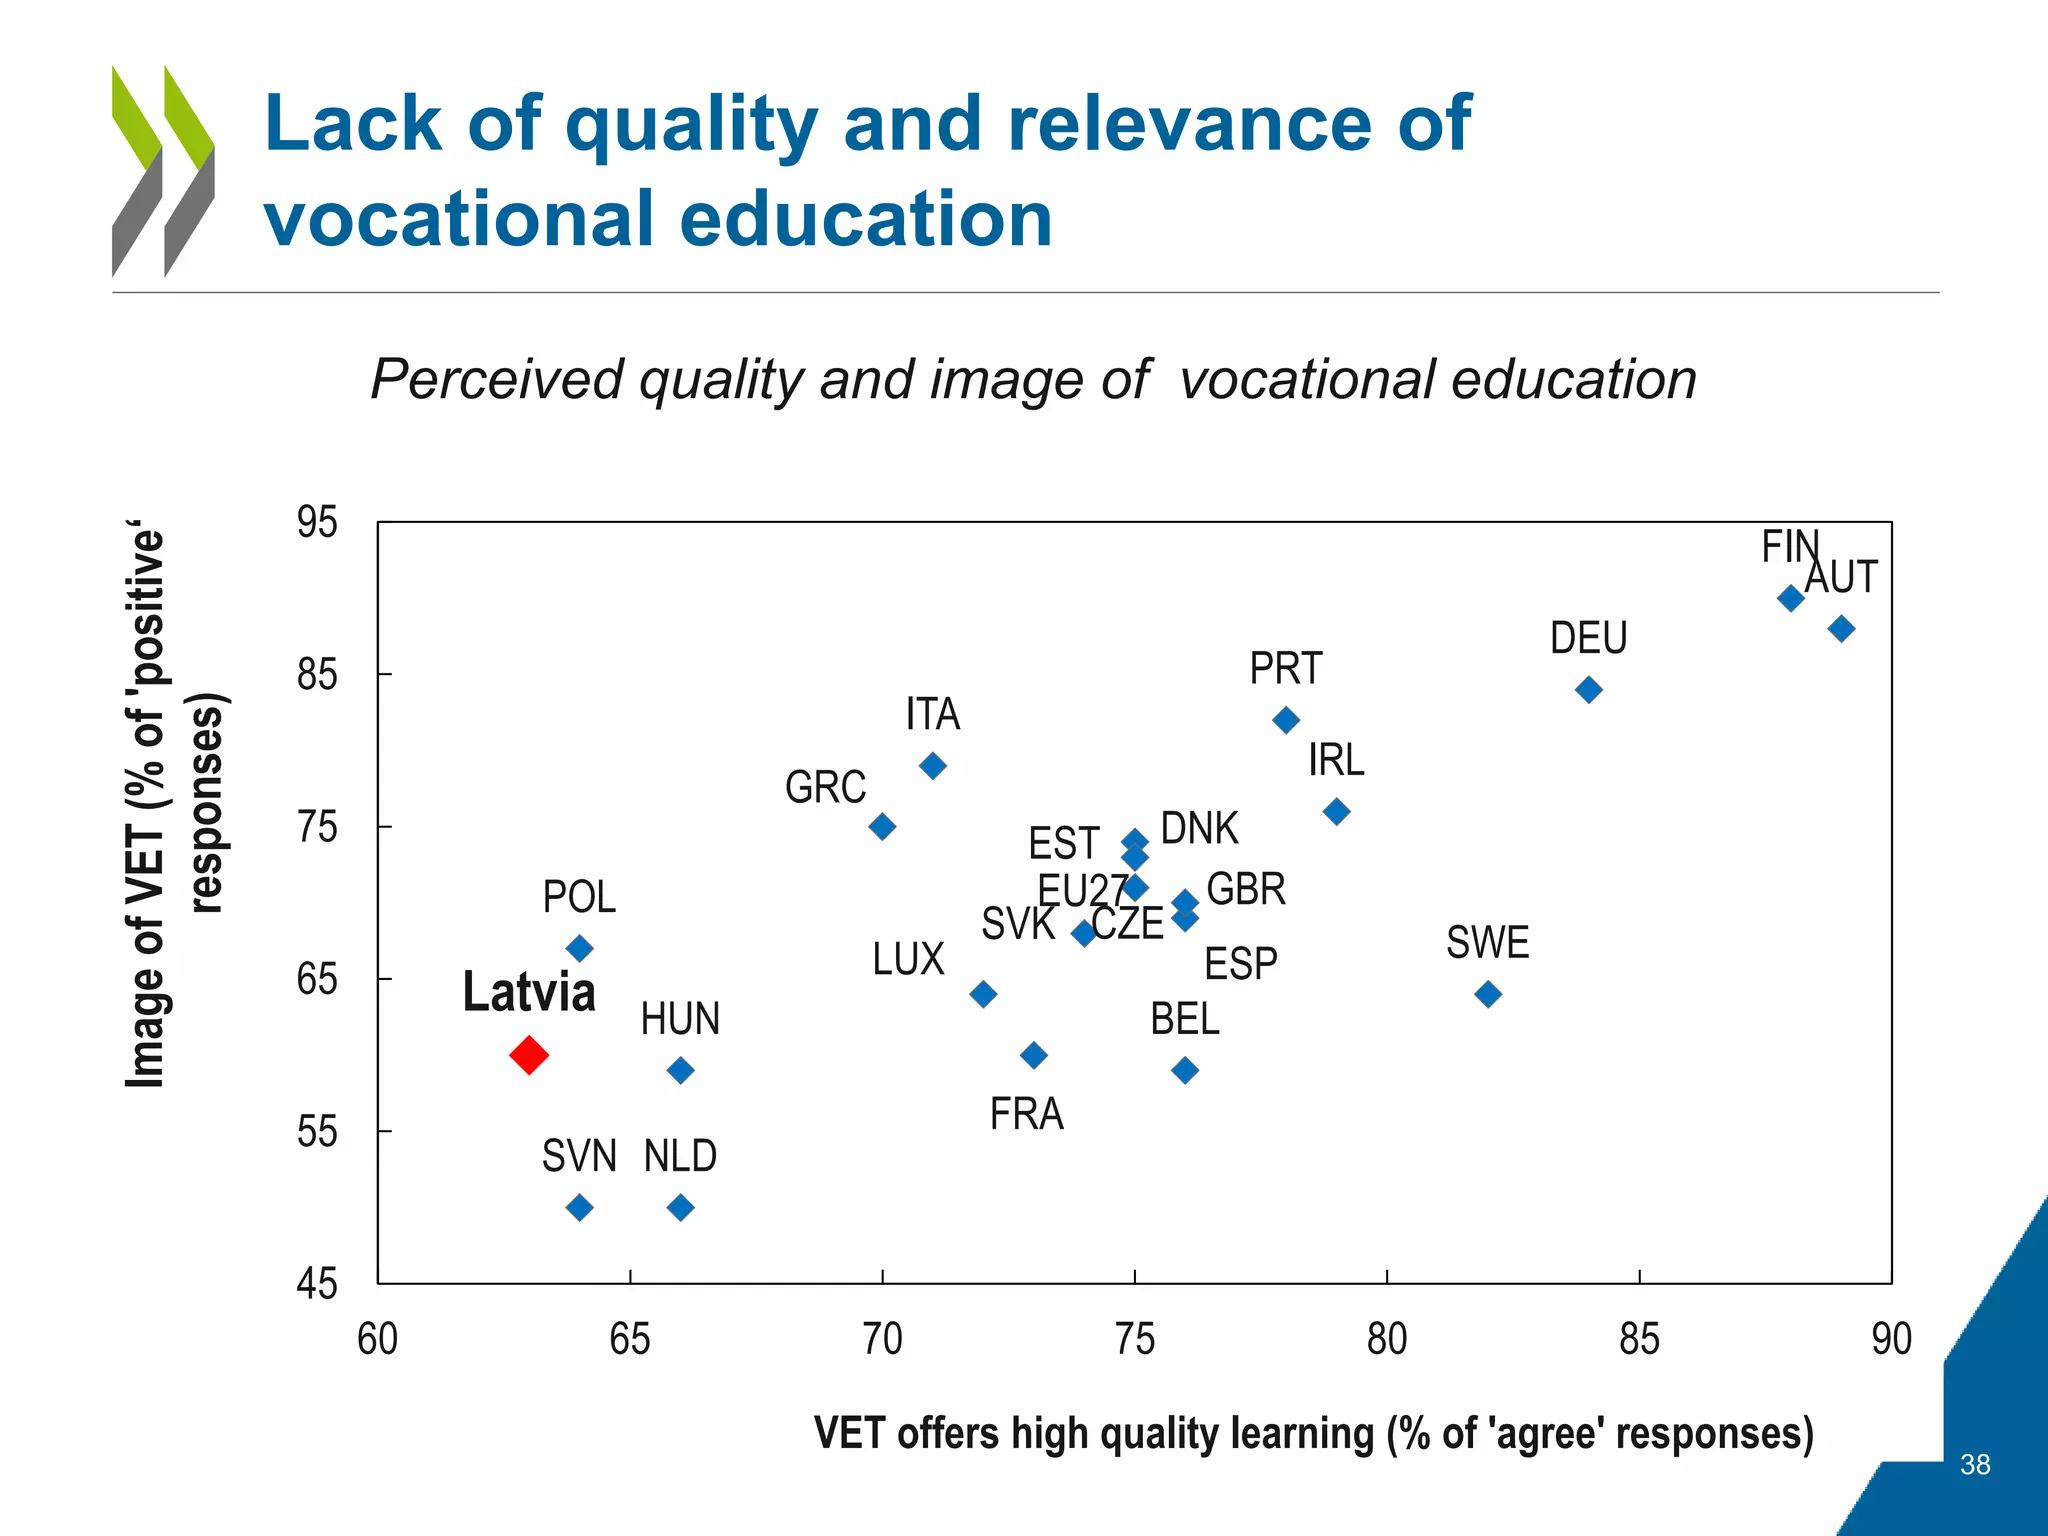
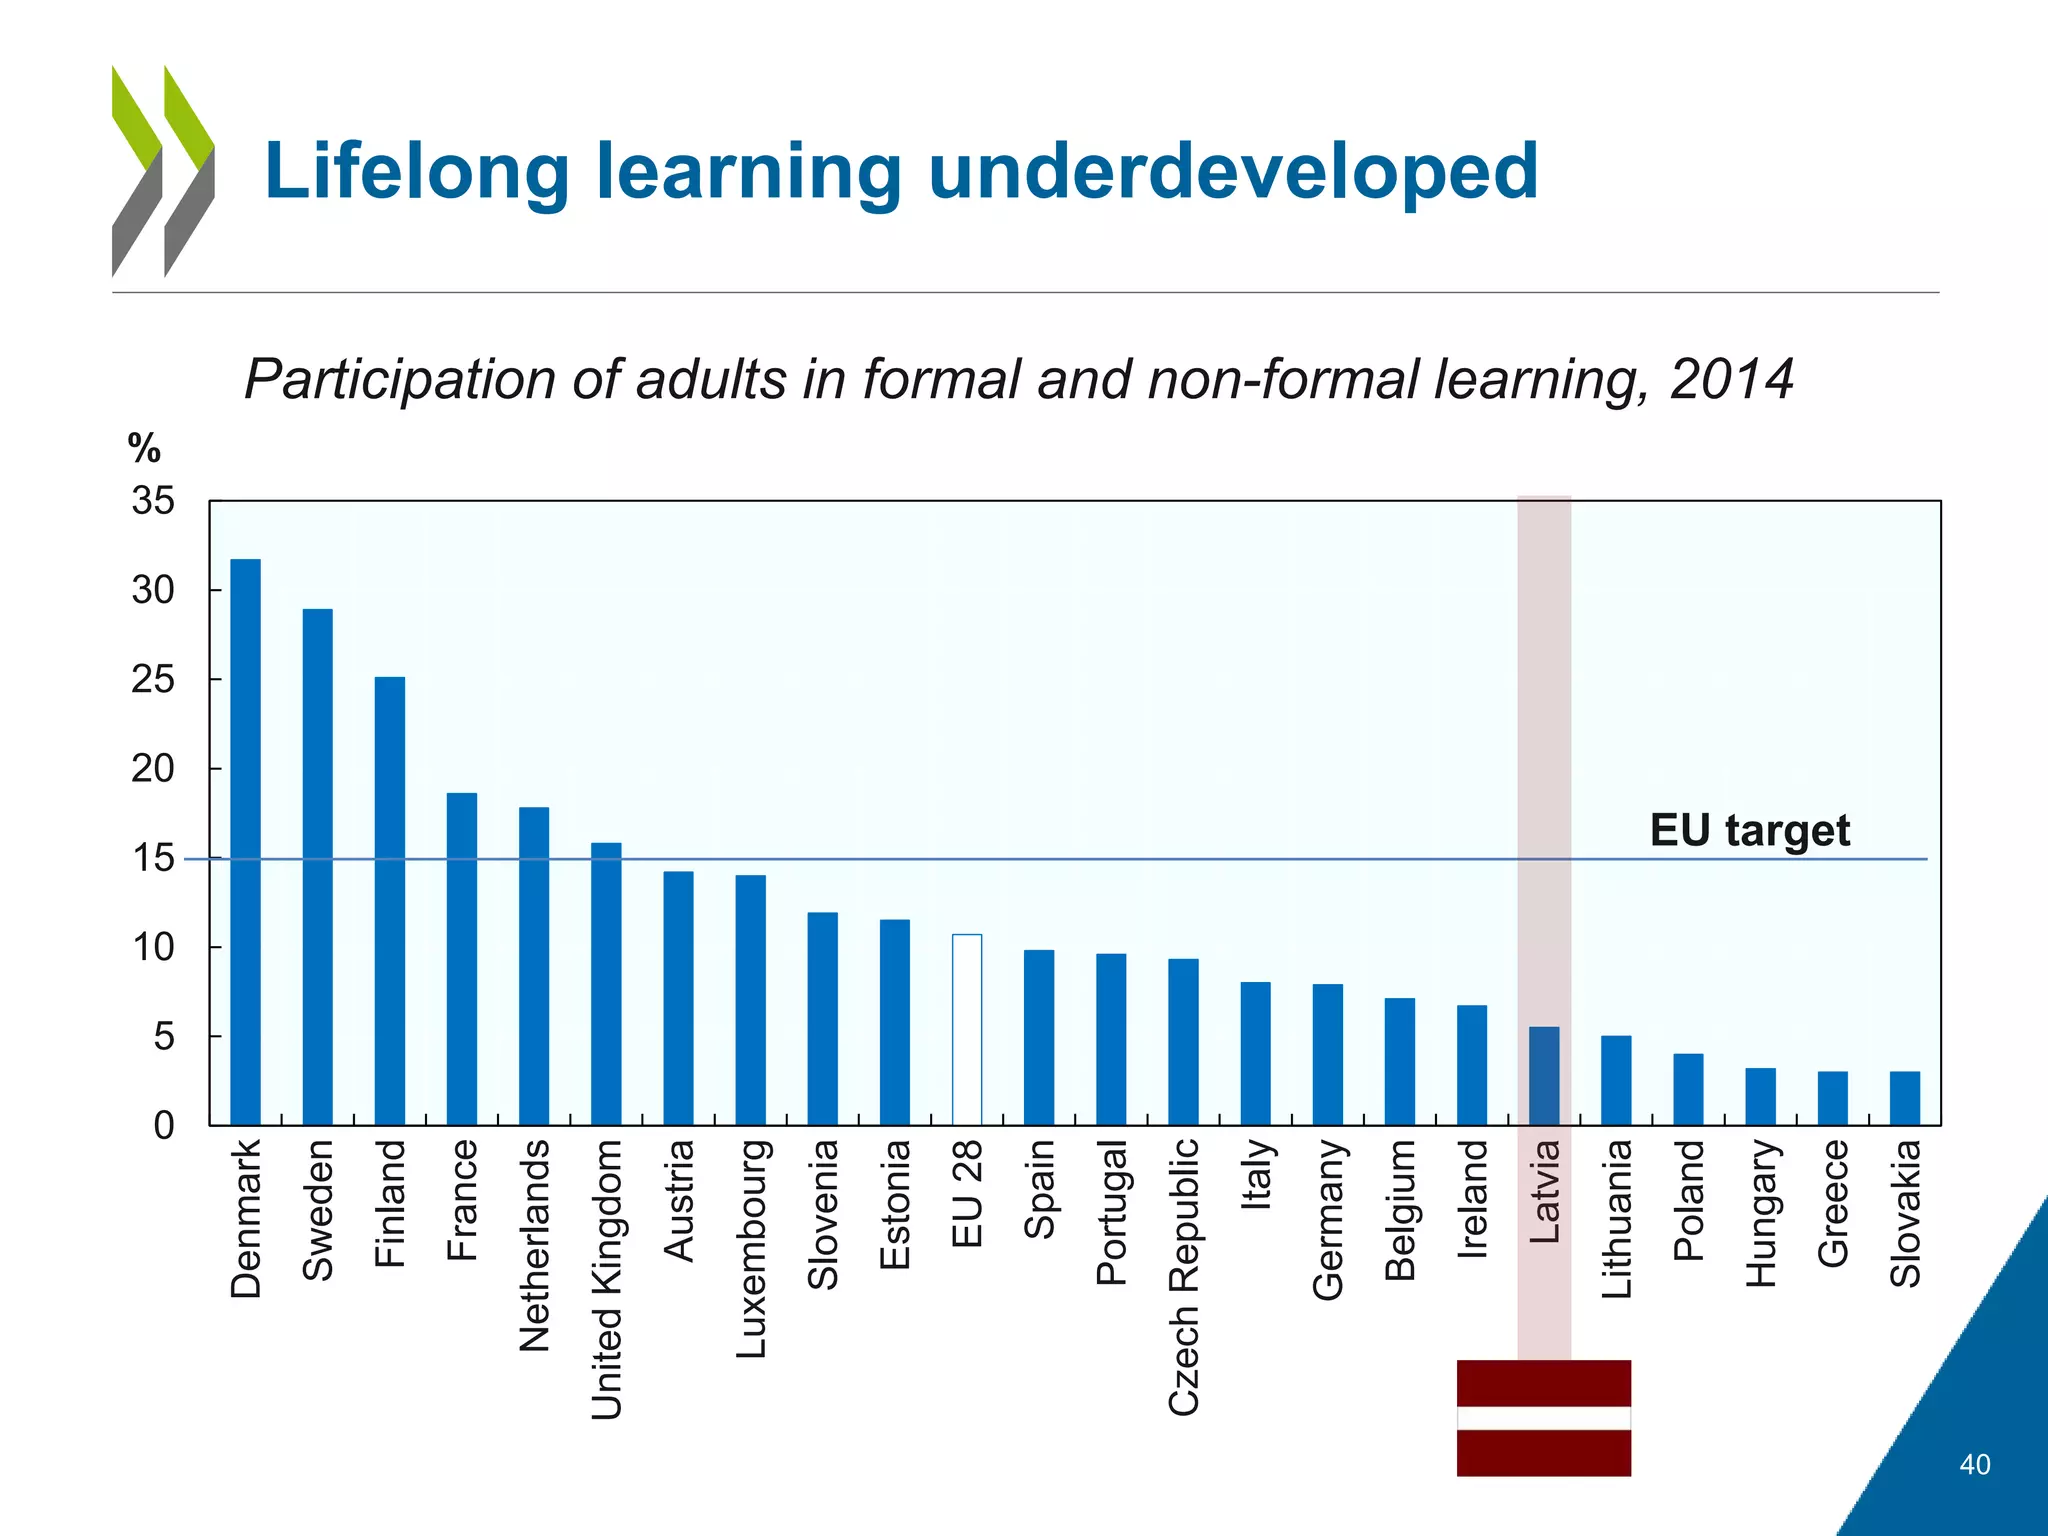
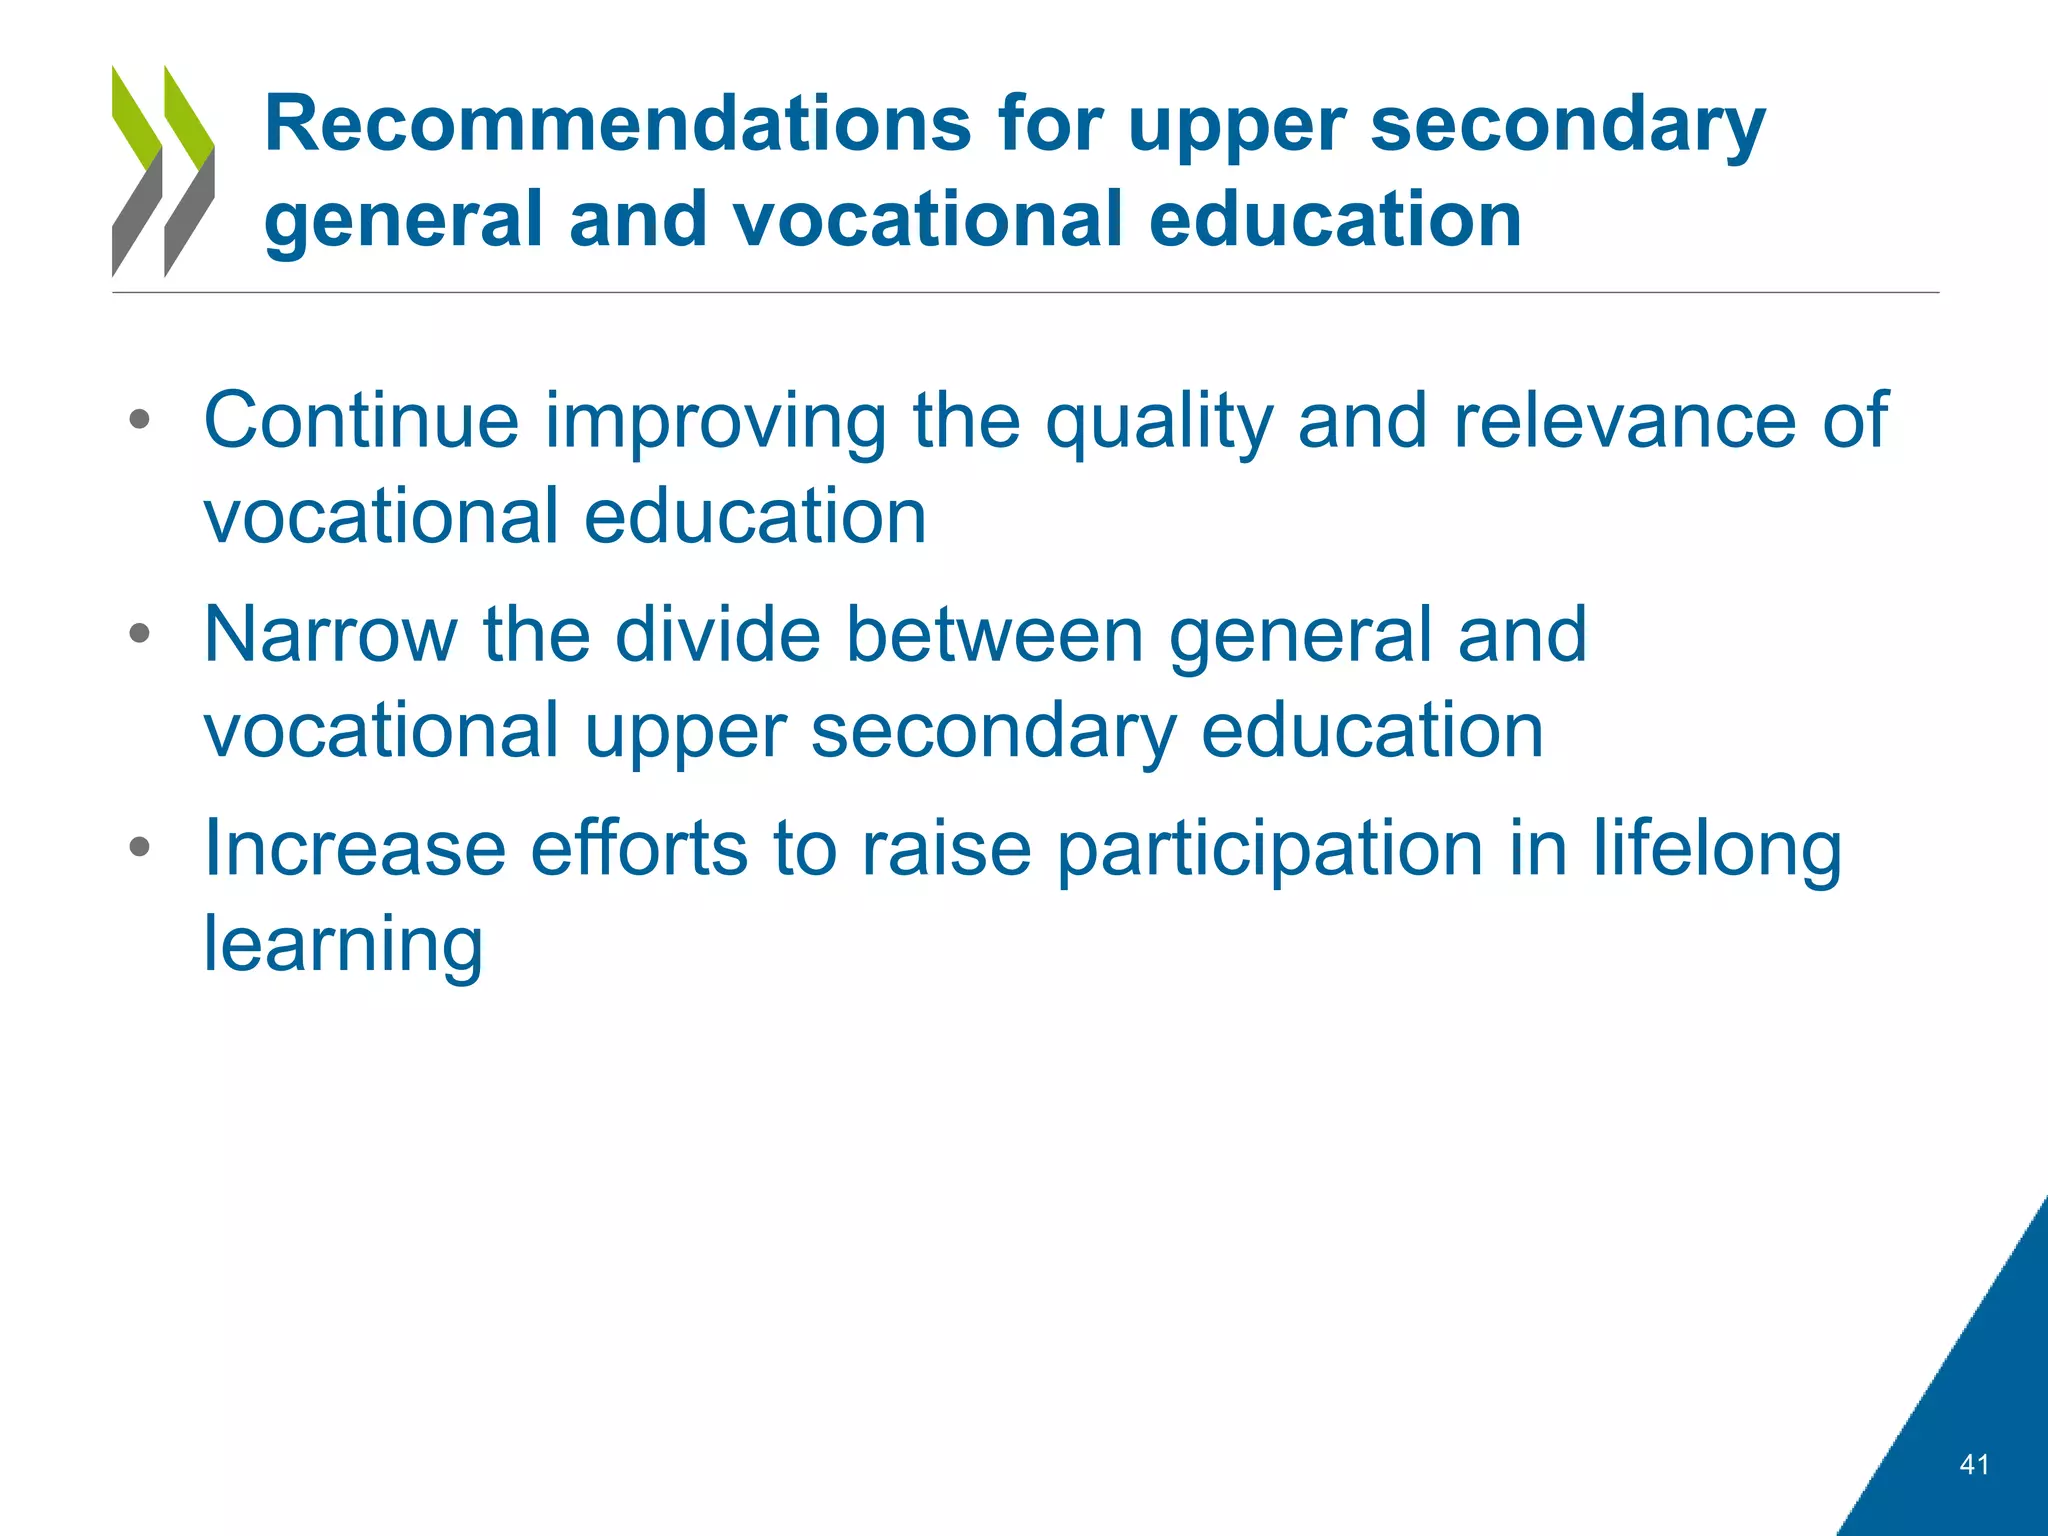
19 May 2016
Andreas Schleicher
Director for Education and Skills, OECD
REVIEWS OF NATIONAL
POLICIES FOR EDUCATION:
EDUCATION IN LATVIA
PROGRESS, CHALLENGES AND
RECOMMENDATIONS
2
Reviews of National Policies for Education:
Education in Latvia
Early
childhood
education
and care
Primary and
lower
secondary
education
Upper
secondary
general and
vocational
education
Tertiary
education
Enrolment rate at age 3 in ECEC, 2013
3
Participation in ECEC is high and starts
early in Latvia
0
10
20
30
40
50
60
70
80
90
100
Israel
France
Belgium
UnitedKingdom
Denmark
NewZealand
Iceland
Spain
Norway
Italy
Sweden
Germany
Estonia
Slovenia
Netherlands
Latvia
Japan
Portugal
OECDaverage
Austria
Luxembourg
Finland
SlovakRepublic
Australia
CzechRepublic
Poland
Chile
Ireland
Mexico
UnitedStates
Turkey
Switzerland
Early childhood educational programmes (ISCED 01)
Pre-primary education (ISCED 02)
Pre-primary education (ISCED 02) (2005)
4
ECEC enrolment
0
10
20
30
40
50
60
70
80
90
100
under age of 3 aged 3 aged 4 aged 5 aged 6 aged 7
% 2002 2003 2006 2009 2012
Net enrolment rate of children up to age 7, 2002-2012
Latvian students’ performance on PISA
5
Significant improvements in student
performance
450
460
470
480
490
500
510
2003 2006 2009 2012
Mathematics
performance
(2003-2012)
Latvia OECD average
450
460
470
480
490
500
510
2000 2003 2006 2009 2012
Reading performance
(2000-2012)
Latvia OECD average
450
460
470
480
490
500
510
2006 2009 2012
Science performance
(2006-2012)
Latvia OECD average
6
Upper secondary education attainment is
high across generations
-10
0
10
20
30
40
50
60
70
80
90
100
-10
0
10
20
30
40
50
60
70
80
90
100
Latvia
Estonia
UnitedStates
Norway
Germany
CzechRepublic
Switzerland
Canada
SlovakRepublic
Denmark
Sweden
Hungary
Israel
Poland
Iceland
Austria
UnitedKingdom
Finland
NewZealand
Luxembourg
OECDaverage
Slovenia
Mexico
Netherlands
Australia
France
Turkey
Belgium
Spain
Italy
Ireland
Greece
Portugal
Chile
Korea
Difference between the 25-34 and 55-64 year-old population with upper secondary education (right axis)
Proportion of the 25-34 year-old population with upper secondary education (left axis)
Proportion of the 55-64 year-old population with upper secondary education (left axis)
%
Early leavers from education and training, age group 18-24
7
Good progress in reducing early school
leavers
0
5
10
15
20
25
30
Slovenia
Poland
CzechRepublic
Lithuania
Luxembourg
Slovakia
Sweden
Ireland
Austria
Denmark
France
Latvia
Netherlands
Greece
Germany
Finland
Belgium
EU28
Estonia
Hungary
UnitedKingdom
Italy
Portugal
Spain
%
2010 2014
8
Many students continue into tertiary
education
0
20
40
60
80
100
Australia
Latvia
Iceland
Poland
NewZealand
Norway
Slovenia
Denmark
UnitedStates1
Korea
UnitedKingdom
Finland
Netherlands
Portugal
SlovakRepublic
Sweden
Israel
CzechRepublic
OECDaverage
Ireland
Hungary
Germany
Austria
Spain
Japan
Chile
Italy
Switzerland
Estonia
France
Turkey
Greece
Mexico
Belgium
Luxembourg
%
Academic tertiary Professional tertiary
Entry rates to tertiary education, 2012
Estimated changes in population
between 2012 and 2020 by age groups
“Remarkable achievements” considering
the socio-economic challenges
0
1
2
3
4
5
6
7
NewZealand
UnitedStates
UnitedKingdom
Norway
Canada
Portugal
Finland
Belgium
Netherlands
Sweden
France
OECDaverage
Estonia
Switzerland
Poland
Germany
Spain
CzechRepublic
Latvia
Hungary
SlovakRepublic
% of GDP
Expenditure on primary to tertiary education
institutions as a percentage of GDP (2012)
-11%
-3%
19%
-16%
-42%
-18%
7%
-50%
-40%
-30%
-20%
-10%
0%
10%
20%
30%
0-4 5-9 10-14 15-19 20-24 25-29 30-34
Age groups
The kind of things that
are easy to teach are
now easy to automate,
digitize or outsource
Robotics
>1m km,
one minor accident,
occasional human
intervention
Augmented Reality
A lot more to come
• 3D printing
• Synthetic biology
• Brain enhancements
• Nanomaterials
• Etc.
Changes in the demand for skills
Trends in different tasks in occupations (United States)
35
40
45
50
55
60
65
70
1960 1970 1980 1990 2000 2006 2009
Routine manual
Nonroutine manual
Routine cognitive
Nonroutine analytic
Nonroutine interpersonal
Mean task input in percentiles of 1960 task distribution
Source: Autor, David H. and Brendan M. Price. 2013. "The Changing Task Composition of the US Labor Market: An Update of Autor, Levy, and
Murnane (2003)." MIT Mimeograph, June.
16
Challenges and recommendations
Early
childhood
education
and care
Primary and
lower
secondary
education
Upper
secondary
general and
vocational
education
Tertiary
education
Formal childcare by duration - % over the population of 0-2 year-olds (2014)
17
Participation of the youngest children is
still relatively low
0
10
20
30
40
50
60
70
80
Denmark
Sweden
Norway
Belgium
Luxembourg
Netherlands
Portugal
Iceland
France
Spain
Slovenia
Switzerland
Finland
UnitedKingdom
Ireland
EU27
Germany
Italy
Lithuania
Latvia
Estonia
Austria
Hungary
Greece
Slovakia
CzechRepublic
Poland
% 30 hours or over From 1 to 29 hours
18
Participation in ECEC is unequal across
Latvia
0
10
20
30
40
50
60
70
80
0
50
100
150
200
250
300
350
400
450
500
2003 2004 2005 2006 2007 2008 2009 2010 2011 2012 2013 2014
Institutions in urban areas (left axis) Institutions in rural areas (left axis)
Enrolment in urban areas, thsd (right axis) Enrolment in rural areas, thsd (right axis)
Age distribution of ECEC teachers
19
Barriers to developing a high-quality and
motivated ECEC profession
0%
10%
20%
30%
40%
50%
60%
70%
80%
90%
100%
Norway
Belgium
UnitedKingdom
Austria
Poland
Slovenia
Luxembourg
France
Germany
Switzerland
Spain
Latvia
Netherlands
CzechRepublic
Estonia
Lithuania
50 years or over 40 to 49 30 to 39 less than 30
Differences in mathematics performance, by attendance at pre-primary school
20
Need for strengthen data collection,
monitoring and use of research
-20
0
20
40
60
80
100
120
France
SlovakRepublic
Belgium
Italy
Switzerland
CzechRepublic
Israel
Denmark
Germany
UnitedKingdom
Greece
Spain
Japan
Finland
Poland
Sweden
Australia
NewZealand
OECDaverage
Netherlands
Austria
Luxembourg
Mexico
Iceland
Portugal
Turkey
Canada
Norway
Lithuania
Chile
Korea
UnitedStates
Slovenia
Ireland
Latvia
Estonia
Score-pointdifferencebetweenstudentswho
attendedpre-primaryschoolformorethanoneyear
andthosewhohadnotattended
Before accounting for socio-economic status
After accounting for socio-economic status
21
Governance and financing hamper equal
access to quality ECEC
• Continue expanding ECEC services, in
particular in rural areas and for the youngest
children
• Take a strategic approach to improving the
quality and motivation of ECEC staff
• Strengthen data collection, monitoring and use
of research
• Review the governance and financing
arrangements of ECEC
22
Recommendations for ECEC
23
Challenges and recommendations
Early
childhood
education
and care
Primary and
lower
secondary
education
Upper
secondary
general and
vocational
education
Tertiary
education
24
Students and teacher supply
0
5 000
10 000
15 000
20 000
25 000
0
50 000
100 000
150 000
200 000
250 000
300 000
2002 2003 2004 2005 2006 2007 2008 2009 2010 2011 2012
Number of students, Grades 1-9 (left axis)
Number of teachers, Grades 1-9 (right axis)
430
440
450
460
470
480
490
500
510
520
City (> 100 000) Town (3 000 - 100
000)
Rural (< 3 000)
PISA 2012 mathematics performance and
school location in Latvia
Disparities in equity across the Latvian
school system
Gap equivalent to
more than one year of
schooling
At-risk-of-poverty rate for children under age 6
26
Disparities in equity across the Latvian
school system
0
5
10
15
20
25
Finland
Netherlands
Ireland
CzechRepublic
Denmark
Norway
Switzerland
Germany
UnitedKingdom
Iceland
Slovenia
France
Sweden
Belgium
Estonia
EU27
Latvia
Slovakia
Austria
Poland
Lithuania
Luxembourg
Hungary
Portugal
Spain
Italy
Greece
% 2013 2010
27
Underdeveloped assessment and
evaluation arrangements
SteeringPriority setting Accountability
ImplementationPolicy Design
Knowledge use
Knowledge production
28
Low remuneration and low status of the
education profession
0.0
0.2
0.4
0.6
0.8
1.0
1.2
1.4
1.6
1.8
2.0
Korea
Mexico
Germany
Portugal
Spain
Netherlands
Ireland
NewZealand
Canada
Japan
UnitedKingdom
Denmark
Chile
Slovenia
Luxembourg
Belgium
Australia
Finland
Italy
Greece
Austria
France
Israel
Lithuania
Poland
UnitedStates
Sweden
Norway
CzechRepublic
Iceland
Hungary
Estonia
SlovakRepublic
Latvia
%
Lower secondary teachers' salaries (after 15 years of experience/minimum
training) relative to per capita GDP
-10
-5
0
5
10
15
Portugal
Spain
Switzerland
Belgium
Korea
Luxembourg
Germany
Greece
Japan
Australia
UnitedKingdom
NewZealand
France
Netherlands
Denmark
Italy
Austria
CzechRepublic
Hungary
Norway
Iceland
Ireland
Mexico
Finland
Sweden
UnitedStates
Poland
SlovakRepublic
Salary as % of GDP/capita Instruction time 1/teaching time 1/class size
Contribution of various factors to upper secondary teacher
compensation costs, per student as a percentage of GDP per capita
Percentage points
Difference with OECD average
Policy levers to teacher professionalism
Knowledge base for teaching
(initial education and incentives for
professional development)
Autonomy: Teachers’ decision-
making power over their work
(teaching content, course offerings,
discipline practices)
Peer networks: Opportunities
for exchange and support
needed to maintain high
standards of teaching (participation
in induction, mentoring, networks,
feedback from direct observations)
Teacher
professionalism
Teacher professionalism
Knowledge base for teaching
(initial education and incentives for
professional development)
Autonomy: Teachers’ decision-
making power over their work
(teaching content, course offerings,
discipline practices)
Peer networks: Opportunities
for exchange and support
needed to maintain high
standards of teaching (participation
in induction, mentoring, networks,
feedback from direct observations)
0
1
2
3
4
5
6
7
8
9
10
Spain
Japan
France
Brazil
Finland
Flanders
Norway
Alberta(Canada)
Australia
Denmark
Israel
Korea
UnitedStates
CzechRepublic
Shanghai(China)
Latvia
Netherlands
Poland
England
NewZealand
Singapore
Estonia
Networks Autonomy Knowledge
Mean mathematics performance, by school location,
after accounting for socio-economic status
Fig II.3.3
3232 TALIS Teacher professionalism index
0
10
20
30
40
50
60
70
80
90
100 Discussindividual
students
Shareresources
Teamconferences
Collaborateforcommon
standards
Teamteaching
CollaborativePD
Jointactivities
Classroomobservations
Percentageofteachers
Professional collaboration
Percentage of lower secondary teachers who report doing the following activities at least once per month
Professional collaboration among teachers
Exchange and co-ordination
Mean mathematics performance, by school location,
after accounting for socio-economic status
Fig II.3.3
3434 Teachers Self-Efficacy and Professional Collaboration
11.40
11.60
11.80
12.00
12.20
12.40
12.60
12.80
13.00
13.20
13.40
Never
Onceayearorless
2-4timesayear
5-10timesayear
1-3timesamonth
Onceaweekormore
Teacherself-efficacy(level)
Teach jointly as a
team in the same
class
Observe other
teachers’ classes and
provide feedback
Engage in joint
activities across
different classes
Take part in
collaborative
professional learning
Less
frequently
More
frequently
0
10
20
30
40
50
60
70
Low professionalism
High professionalism
Mean mathematics performance, by school location,
after accounting for socio-economic status
Fig II.3.3
3535 Teacher professionalism index and teacher outcomes
Perceptions of
teachers’ status
Satisfaction with
the profession
Satisfaction with the
work environment
Teachers’
self-efficacy
Predicted percentile
• Establish the conditions for a high-quality
teaching and leadership profession
• Promote equity and excellence in education,
with a focus on rural schools
• Develop a coherent assessment and evaluation
framework for informing policy and educational
practice
36
Recommendations for primary and lower
secondary education
37
Challenges and recommendations
Early
childhood
education
and care
Primary and
lower
secondary
education
Upper
secondary
general and
vocational
education
Tertiary
education
Perceived quality and image of vocational education
38
Lack of quality and relevance of
vocational education
EU27
BEL
CZE
DNK
DEU
EST
IRL
GRC
ESP
FRA
ITA
Latvia
LUX
HUN
NLD
AUT
POL
PRT
SVN
SVK
FIN
SWE
GBR
45
55
65
75
85
95
60 65 70 75 80 85 90
ImageofVET(%of'positive‘
responses)
VET offers high quality learning (% of 'agree' responses)
39
Stark divide between upper secondary
general and vocational pathways
Participation of adults in formal and non-formal learning, 2014
40
Lifelong learning underdeveloped
0
5
10
15
20
25
30
35
Denmark
Sweden
Finland
France
Netherlands
UnitedKingdom
Austria
Luxembourg
Slovenia
Estonia
EU28
Spain
Portugal
CzechRepublic
Italy
Germany
Belgium
Ireland
Latvia
Lithuania
Poland
Hungary
Greece
Slovakia
%
EU target
• Continue improving the quality and relevance of
vocational education
• Narrow the divide between general and
vocational upper secondary education
• Increase efforts to raise participation in lifelong
learning
41
Recommendations for upper secondary
general and vocational education
42
Challenges and recommendations
Early
childhood
education
and care
Primary and
lower
secondary
education
Upper
secondary
general and
vocational
education
Tertiary
education
43
System capacity not aligned with demographic
decline, fiscal reality and labour market needs
Number of tertiary education institutions and students
0
20000
40000
60000
80000
100000
120000
140000
0
10
20
30
40
50
60
70
Number of institutions (left axis) Number of students (right axis)
44
System capacity not aligned with demographic
decline, fiscal reality and labour market needs
Percentage of graduates by field of study
0% 10% 20% 30% 40% 50% 60%
Education
Humanities and art
Social sciences, business and law
Natural sciences, mathematics and information
technologies
Engineering, manufacturing and construction
Agriculture
Health and welfare
Services
2004 2009 2014
45
Inadequate tertiary education funding
0
5 000
10 000
15 000
20 000
25 000
Luxembourg
UnitedStates
Switzerland
UnitedKingdom
Sweden
Norway
Netherlands
Finland
Germany
Japan
Australia
Austria
Belgium
France
Ireland
NewZealand
Spain
Israel
Slovenia
CzechRepublic
Italy
Korea
Poland
Iceland
Portugal
SlovakRepublic
Hungary
Estonia
Mexico
Chile
Turkey
Latvia
Annual expenditure per tertiary student by educational
institutions for all services (2012)
OECD average
In equivalent USD
converted using PPPs)
32 876
Pillar 1: basic
funding
Pillar 2:
performance-
oriented funding
Pillar 3:
innovation-
oriented funding
Teaching • number of
study places
(per field)
• cost-oriented
weight
• number of
graduates
• number of
incoming and
outgoing students
profile-oriented
target
agreements
teaching +
research + third
missionResearch • number of
professors/ac
ademic staff
(per field)
• cost-oriented
weight
• bibliometric
indicator
• third party funds
• number of PhDs
46
Proposed tertiary education financing model
Funding of
centres of
excellence
Institutional indicators
47
Concerns about the quality of tertiary
education and science
European Innovation Scoreboards: Summary Innovation Index 2014
0.0
0.1
0.2
0.3
0.4
0.5
0.6
0.7
0.8
0.9
Switzerland
Sweden
Denmark
Finland
Germany
Netherlands
Luxembourg
UnitedKingdom
Ireland
Iceland
Belgium
France
Austria
EU
Slovenia
Estonia
Norway
CzechRepublic
Italy
Portugal
Spain
Hungary
Greece
Slovakia
Poland
Lithuania
Latvia
Turkey
• Move forward with the implementation of the
three-pillar financing model
• Continue improving the quality of tertiary
education and science
• Continue efforts to realign system capacity
with demographic decline, fiscal reality and
labour market needs
• Strengthen the capacity for strategic
leadership and management
48
Recommendations for tertiary education
49
Making educational reform happen
• Clear and consistent priorities (across
governments and across time), ambition and
urgency, and the capacity to learn rapidly.
Shared vision
• Appropriate targets, real-time data, monitoring,
incentives aligned to targets, accountability, and
the capacity to intervene where necessary.
Performance
management
• Building professional capabilities, sharing best
practice and innovation, flexible management, and
frontline ethos aligned with system objectives.
Frontline capacity
• Strong leadership at every level, including teacher
leadership, adequate process design and
consistency of focus across agencies.
Delivery architecture
Resilience to
political
change
Engage
stakeholders
Careful
piloting
Sustainable
resources
Careful timing
Partnership
with the
profession
• Acknowledge divergent views and interests
• Communicate, communicate, communicate
– Feedback reduces the likelihood of strong
opposition
– Involvement of stakeholders cultivates a sense
of joint ownership over policies, and hence helps
build consensus over both the need and the
relevance of reforms
• Mechanisms of regular and institutionalised
consultation contribute to the development
of trust among parties, and help them reach
consensus
– Regular interactions raise awareness of the
concerns of others, thus fostering a climate of
compromise
• External pressures can build a compelling
case for change .
50 Successful reform implementation
Strive for
consensus about
the aims without
compromising the drive
for improvement
Resilience to
political
change
Engage
stakeholders
Careful
piloting
Sustainable
resources
Careful timing
Partnership
with the
profession
• Regular involvement by teachers in
policy design helps to build capacity and
shared ideas over time
• Several countries have established
teaching councils that provide teachers
with both a forum for policy
development and, critically, a
mechanism for profession-led standard
setting and quality assurance in teacher
education, teacher induction, teacher
performance and career development
• Policy can encourage the formation of
such communities .
51 Successful reform implementation
Engage teachers
not just in the
implementation of
reform but in their
design
Resilience to
political
change
Engage
stakeholders
Careful
piloting
Sustainable
resources
Careful timing
Partnership
with the
profession
• Currently only one in ten educational
reforms is evaluated
• Policy experimentation can help build
consensus on implementation and can
prove powerful in testing out policy
initiatives and – by virtue of their
temporary nature and limited scope –
overcoming fears and resistance by
specific groups of stakeholders.
52 Successful reform implementation
Use and evaluate
pilot projects before
full implementation
Resilience to
political
change
Engage
stakeholders
Careful
piloting
Sustainable
resources
Careful timing
Partnership
with the
profession
• The benefits for ‘winners’ are often
insufficient to mobilise support, the
costs for ‘losers’ are concentrated
• Need for consistent, co-ordinated
efforts to persuade those affected of
the need for change and, in particular,
to communicate the costs of inaction
53 Successful reform implementation
Back reforms with
sustainable capacity
Resilience to
political
change
Engage
stakeholders
Careful
piloting
Sustainable
resources
Careful timing
Partnership
with the
profession
• All political players and stakeholders
need to develop realistic expectations
about the pace and nature of reforms to
improve outcomes
• Certain reform measures are best
introduced before others, particularly
because of the substantial gap between
the time at which the initial cost of
reform is incurred, and the time when
the intended benefits of reforms
materialise
• Time is needed to learn about and
understand impact, to build trust and
develop capacity for the next stage .
54 Successful reform implementation
Time implementation
carefully
Resilience to
political
change
Engage
stakeholders
Careful
piloting
Sustainable
resources
Careful timing
Partnership
with the
profession
• Putting the teaching profession at the
heart of education reform requires a
fruitful dialogue between governments
and unions
• Teachers should not just be part of the
implementation of reforms but also part
of their design
• Conflict isn’t best addressed by weak
unions but by strong social partnership .
55 Successful reform implementation
Build partnerships
with education
unions to design and
implement reforms
5656Lessonsfromhighperformers
Some students learn at high levels All students need to learn at high levels
Student inclusion
Routine cognitive skills Conceptual understanding,
complex ways of thinking, ways of working
Curriculum, instruction and assessment
Standardisation and compliance High-level professional knowledge workers
Teacher quality
‘Tayloristic’, hierarchical Flat, collegial
Work organisation
Primarily to authorities Primarily to peers and stakeholders
Accountability
What it all means
The old bureaucratic system The modern enabling system
Thank you
WWW.OECD.ORG/EDUCATION
ANDREAS.SCHLEICHER@OECD.ORG

Education in Latvia - Progress, Challenges and Recommendations

  • 1.
    19 May 2016 AndreasSchleicher Director for Education and Skills, OECD REVIEWS OF NATIONAL POLICIES FOR EDUCATION: EDUCATION IN LATVIA PROGRESS, CHALLENGES AND RECOMMENDATIONS
  • 2.
    2 Reviews of NationalPolicies for Education: Education in Latvia Early childhood education and care Primary and lower secondary education Upper secondary general and vocational education Tertiary education
  • 3.
    Enrolment rate atage 3 in ECEC, 2013 3 Participation in ECEC is high and starts early in Latvia 0 10 20 30 40 50 60 70 80 90 100 Israel France Belgium UnitedKingdom Denmark NewZealand Iceland Spain Norway Italy Sweden Germany Estonia Slovenia Netherlands Latvia Japan Portugal OECDaverage Austria Luxembourg Finland SlovakRepublic Australia CzechRepublic Poland Chile Ireland Mexico UnitedStates Turkey Switzerland Early childhood educational programmes (ISCED 01) Pre-primary education (ISCED 02) Pre-primary education (ISCED 02) (2005)
  • 4.
    4 ECEC enrolment 0 10 20 30 40 50 60 70 80 90 100 under ageof 3 aged 3 aged 4 aged 5 aged 6 aged 7 % 2002 2003 2006 2009 2012 Net enrolment rate of children up to age 7, 2002-2012
  • 5.
    Latvian students’ performanceon PISA 5 Significant improvements in student performance 450 460 470 480 490 500 510 2003 2006 2009 2012 Mathematics performance (2003-2012) Latvia OECD average 450 460 470 480 490 500 510 2000 2003 2006 2009 2012 Reading performance (2000-2012) Latvia OECD average 450 460 470 480 490 500 510 2006 2009 2012 Science performance (2006-2012) Latvia OECD average
  • 6.
    6 Upper secondary educationattainment is high across generations -10 0 10 20 30 40 50 60 70 80 90 100 -10 0 10 20 30 40 50 60 70 80 90 100 Latvia Estonia UnitedStates Norway Germany CzechRepublic Switzerland Canada SlovakRepublic Denmark Sweden Hungary Israel Poland Iceland Austria UnitedKingdom Finland NewZealand Luxembourg OECDaverage Slovenia Mexico Netherlands Australia France Turkey Belgium Spain Italy Ireland Greece Portugal Chile Korea Difference between the 25-34 and 55-64 year-old population with upper secondary education (right axis) Proportion of the 25-34 year-old population with upper secondary education (left axis) Proportion of the 55-64 year-old population with upper secondary education (left axis) %
  • 7.
    Early leavers fromeducation and training, age group 18-24 7 Good progress in reducing early school leavers 0 5 10 15 20 25 30 Slovenia Poland CzechRepublic Lithuania Luxembourg Slovakia Sweden Ireland Austria Denmark France Latvia Netherlands Greece Germany Finland Belgium EU28 Estonia Hungary UnitedKingdom Italy Portugal Spain % 2010 2014
  • 8.
    8 Many students continueinto tertiary education 0 20 40 60 80 100 Australia Latvia Iceland Poland NewZealand Norway Slovenia Denmark UnitedStates1 Korea UnitedKingdom Finland Netherlands Portugal SlovakRepublic Sweden Israel CzechRepublic OECDaverage Ireland Hungary Germany Austria Spain Japan Chile Italy Switzerland Estonia France Turkey Greece Mexico Belgium Luxembourg % Academic tertiary Professional tertiary Entry rates to tertiary education, 2012
  • 9.
    Estimated changes inpopulation between 2012 and 2020 by age groups “Remarkable achievements” considering the socio-economic challenges 0 1 2 3 4 5 6 7 NewZealand UnitedStates UnitedKingdom Norway Canada Portugal Finland Belgium Netherlands Sweden France OECDaverage Estonia Switzerland Poland Germany Spain CzechRepublic Latvia Hungary SlovakRepublic % of GDP Expenditure on primary to tertiary education institutions as a percentage of GDP (2012) -11% -3% 19% -16% -42% -18% 7% -50% -40% -30% -20% -10% 0% 10% 20% 30% 0-4 5-9 10-14 15-19 20-24 25-29 30-34 Age groups
  • 10.
    The kind ofthings that are easy to teach are now easy to automate, digitize or outsource
  • 11.
  • 12.
    >1m km, one minoraccident, occasional human intervention
  • 13.
  • 14.
    A lot moreto come • 3D printing • Synthetic biology • Brain enhancements • Nanomaterials • Etc.
  • 15.
    Changes in thedemand for skills Trends in different tasks in occupations (United States) 35 40 45 50 55 60 65 70 1960 1970 1980 1990 2000 2006 2009 Routine manual Nonroutine manual Routine cognitive Nonroutine analytic Nonroutine interpersonal Mean task input in percentiles of 1960 task distribution Source: Autor, David H. and Brendan M. Price. 2013. "The Changing Task Composition of the US Labor Market: An Update of Autor, Levy, and Murnane (2003)." MIT Mimeograph, June.
  • 16.
    16 Challenges and recommendations Early childhood education andcare Primary and lower secondary education Upper secondary general and vocational education Tertiary education
  • 17.
    Formal childcare byduration - % over the population of 0-2 year-olds (2014) 17 Participation of the youngest children is still relatively low 0 10 20 30 40 50 60 70 80 Denmark Sweden Norway Belgium Luxembourg Netherlands Portugal Iceland France Spain Slovenia Switzerland Finland UnitedKingdom Ireland EU27 Germany Italy Lithuania Latvia Estonia Austria Hungary Greece Slovakia CzechRepublic Poland % 30 hours or over From 1 to 29 hours
  • 18.
    18 Participation in ECECis unequal across Latvia 0 10 20 30 40 50 60 70 80 0 50 100 150 200 250 300 350 400 450 500 2003 2004 2005 2006 2007 2008 2009 2010 2011 2012 2013 2014 Institutions in urban areas (left axis) Institutions in rural areas (left axis) Enrolment in urban areas, thsd (right axis) Enrolment in rural areas, thsd (right axis)
  • 19.
    Age distribution ofECEC teachers 19 Barriers to developing a high-quality and motivated ECEC profession 0% 10% 20% 30% 40% 50% 60% 70% 80% 90% 100% Norway Belgium UnitedKingdom Austria Poland Slovenia Luxembourg France Germany Switzerland Spain Latvia Netherlands CzechRepublic Estonia Lithuania 50 years or over 40 to 49 30 to 39 less than 30
  • 20.
    Differences in mathematicsperformance, by attendance at pre-primary school 20 Need for strengthen data collection, monitoring and use of research -20 0 20 40 60 80 100 120 France SlovakRepublic Belgium Italy Switzerland CzechRepublic Israel Denmark Germany UnitedKingdom Greece Spain Japan Finland Poland Sweden Australia NewZealand OECDaverage Netherlands Austria Luxembourg Mexico Iceland Portugal Turkey Canada Norway Lithuania Chile Korea UnitedStates Slovenia Ireland Latvia Estonia Score-pointdifferencebetweenstudentswho attendedpre-primaryschoolformorethanoneyear andthosewhohadnotattended Before accounting for socio-economic status After accounting for socio-economic status
  • 21.
    21 Governance and financinghamper equal access to quality ECEC
  • 22.
    • Continue expandingECEC services, in particular in rural areas and for the youngest children • Take a strategic approach to improving the quality and motivation of ECEC staff • Strengthen data collection, monitoring and use of research • Review the governance and financing arrangements of ECEC 22 Recommendations for ECEC
  • 23.
    23 Challenges and recommendations Early childhood education andcare Primary and lower secondary education Upper secondary general and vocational education Tertiary education
  • 24.
    24 Students and teachersupply 0 5 000 10 000 15 000 20 000 25 000 0 50 000 100 000 150 000 200 000 250 000 300 000 2002 2003 2004 2005 2006 2007 2008 2009 2010 2011 2012 Number of students, Grades 1-9 (left axis) Number of teachers, Grades 1-9 (right axis)
  • 25.
    430 440 450 460 470 480 490 500 510 520 City (> 100000) Town (3 000 - 100 000) Rural (< 3 000) PISA 2012 mathematics performance and school location in Latvia Disparities in equity across the Latvian school system Gap equivalent to more than one year of schooling
  • 26.
    At-risk-of-poverty rate forchildren under age 6 26 Disparities in equity across the Latvian school system 0 5 10 15 20 25 Finland Netherlands Ireland CzechRepublic Denmark Norway Switzerland Germany UnitedKingdom Iceland Slovenia France Sweden Belgium Estonia EU27 Latvia Slovakia Austria Poland Lithuania Luxembourg Hungary Portugal Spain Italy Greece % 2013 2010
  • 27.
    27 Underdeveloped assessment and evaluationarrangements SteeringPriority setting Accountability ImplementationPolicy Design Knowledge use Knowledge production
  • 28.
    28 Low remuneration andlow status of the education profession 0.0 0.2 0.4 0.6 0.8 1.0 1.2 1.4 1.6 1.8 2.0 Korea Mexico Germany Portugal Spain Netherlands Ireland NewZealand Canada Japan UnitedKingdom Denmark Chile Slovenia Luxembourg Belgium Australia Finland Italy Greece Austria France Israel Lithuania Poland UnitedStates Sweden Norway CzechRepublic Iceland Hungary Estonia SlovakRepublic Latvia % Lower secondary teachers' salaries (after 15 years of experience/minimum training) relative to per capita GDP
  • 29.
    -10 -5 0 5 10 15 Portugal Spain Switzerland Belgium Korea Luxembourg Germany Greece Japan Australia UnitedKingdom NewZealand France Netherlands Denmark Italy Austria CzechRepublic Hungary Norway Iceland Ireland Mexico Finland Sweden UnitedStates Poland SlovakRepublic Salary as %of GDP/capita Instruction time 1/teaching time 1/class size Contribution of various factors to upper secondary teacher compensation costs, per student as a percentage of GDP per capita Percentage points Difference with OECD average
  • 30.
    Policy levers toteacher professionalism Knowledge base for teaching (initial education and incentives for professional development) Autonomy: Teachers’ decision- making power over their work (teaching content, course offerings, discipline practices) Peer networks: Opportunities for exchange and support needed to maintain high standards of teaching (participation in induction, mentoring, networks, feedback from direct observations) Teacher professionalism
  • 31.
    Teacher professionalism Knowledge basefor teaching (initial education and incentives for professional development) Autonomy: Teachers’ decision- making power over their work (teaching content, course offerings, discipline practices) Peer networks: Opportunities for exchange and support needed to maintain high standards of teaching (participation in induction, mentoring, networks, feedback from direct observations)
  • 32.
  • 33.
  • 34.
    Mean mathematics performance,by school location, after accounting for socio-economic status Fig II.3.3 3434 Teachers Self-Efficacy and Professional Collaboration 11.40 11.60 11.80 12.00 12.20 12.40 12.60 12.80 13.00 13.20 13.40 Never Onceayearorless 2-4timesayear 5-10timesayear 1-3timesamonth Onceaweekormore Teacherself-efficacy(level) Teach jointly as a team in the same class Observe other teachers’ classes and provide feedback Engage in joint activities across different classes Take part in collaborative professional learning Less frequently More frequently
  • 35.
    0 10 20 30 40 50 60 70 Low professionalism High professionalism Meanmathematics performance, by school location, after accounting for socio-economic status Fig II.3.3 3535 Teacher professionalism index and teacher outcomes Perceptions of teachers’ status Satisfaction with the profession Satisfaction with the work environment Teachers’ self-efficacy Predicted percentile
  • 36.
    • Establish theconditions for a high-quality teaching and leadership profession • Promote equity and excellence in education, with a focus on rural schools • Develop a coherent assessment and evaluation framework for informing policy and educational practice 36 Recommendations for primary and lower secondary education
  • 37.
    37 Challenges and recommendations Early childhood education andcare Primary and lower secondary education Upper secondary general and vocational education Tertiary education
  • 38.
    Perceived quality andimage of vocational education 38 Lack of quality and relevance of vocational education EU27 BEL CZE DNK DEU EST IRL GRC ESP FRA ITA Latvia LUX HUN NLD AUT POL PRT SVN SVK FIN SWE GBR 45 55 65 75 85 95 60 65 70 75 80 85 90 ImageofVET(%of'positive‘ responses) VET offers high quality learning (% of 'agree' responses)
  • 39.
    39 Stark divide betweenupper secondary general and vocational pathways
  • 40.
    Participation of adultsin formal and non-formal learning, 2014 40 Lifelong learning underdeveloped 0 5 10 15 20 25 30 35 Denmark Sweden Finland France Netherlands UnitedKingdom Austria Luxembourg Slovenia Estonia EU28 Spain Portugal CzechRepublic Italy Germany Belgium Ireland Latvia Lithuania Poland Hungary Greece Slovakia % EU target
  • 41.
    • Continue improvingthe quality and relevance of vocational education • Narrow the divide between general and vocational upper secondary education • Increase efforts to raise participation in lifelong learning 41 Recommendations for upper secondary general and vocational education
  • 42.
    42 Challenges and recommendations Early childhood education andcare Primary and lower secondary education Upper secondary general and vocational education Tertiary education
  • 43.
    43 System capacity notaligned with demographic decline, fiscal reality and labour market needs Number of tertiary education institutions and students 0 20000 40000 60000 80000 100000 120000 140000 0 10 20 30 40 50 60 70 Number of institutions (left axis) Number of students (right axis)
  • 44.
    44 System capacity notaligned with demographic decline, fiscal reality and labour market needs Percentage of graduates by field of study 0% 10% 20% 30% 40% 50% 60% Education Humanities and art Social sciences, business and law Natural sciences, mathematics and information technologies Engineering, manufacturing and construction Agriculture Health and welfare Services 2004 2009 2014
  • 45.
    45 Inadequate tertiary educationfunding 0 5 000 10 000 15 000 20 000 25 000 Luxembourg UnitedStates Switzerland UnitedKingdom Sweden Norway Netherlands Finland Germany Japan Australia Austria Belgium France Ireland NewZealand Spain Israel Slovenia CzechRepublic Italy Korea Poland Iceland Portugal SlovakRepublic Hungary Estonia Mexico Chile Turkey Latvia Annual expenditure per tertiary student by educational institutions for all services (2012) OECD average In equivalent USD converted using PPPs) 32 876
  • 46.
    Pillar 1: basic funding Pillar2: performance- oriented funding Pillar 3: innovation- oriented funding Teaching • number of study places (per field) • cost-oriented weight • number of graduates • number of incoming and outgoing students profile-oriented target agreements teaching + research + third missionResearch • number of professors/ac ademic staff (per field) • cost-oriented weight • bibliometric indicator • third party funds • number of PhDs 46 Proposed tertiary education financing model Funding of centres of excellence Institutional indicators Institutional indicators
  • 47.
    47 Concerns about thequality of tertiary education and science European Innovation Scoreboards: Summary Innovation Index 2014 0.0 0.1 0.2 0.3 0.4 0.5 0.6 0.7 0.8 0.9 Switzerland Sweden Denmark Finland Germany Netherlands Luxembourg UnitedKingdom Ireland Iceland Belgium France Austria EU Slovenia Estonia Norway CzechRepublic Italy Portugal Spain Hungary Greece Slovakia Poland Lithuania Latvia Turkey
  • 48.
    • Move forwardwith the implementation of the three-pillar financing model • Continue improving the quality of tertiary education and science • Continue efforts to realign system capacity with demographic decline, fiscal reality and labour market needs • Strengthen the capacity for strategic leadership and management 48 Recommendations for tertiary education
  • 49.
    49 Making educational reformhappen • Clear and consistent priorities (across governments and across time), ambition and urgency, and the capacity to learn rapidly. Shared vision • Appropriate targets, real-time data, monitoring, incentives aligned to targets, accountability, and the capacity to intervene where necessary. Performance management • Building professional capabilities, sharing best practice and innovation, flexible management, and frontline ethos aligned with system objectives. Frontline capacity • Strong leadership at every level, including teacher leadership, adequate process design and consistency of focus across agencies. Delivery architecture
  • 50.
    Resilience to political change Engage stakeholders Careful piloting Sustainable resources Careful timing Partnership withthe profession • Acknowledge divergent views and interests • Communicate, communicate, communicate – Feedback reduces the likelihood of strong opposition – Involvement of stakeholders cultivates a sense of joint ownership over policies, and hence helps build consensus over both the need and the relevance of reforms • Mechanisms of regular and institutionalised consultation contribute to the development of trust among parties, and help them reach consensus – Regular interactions raise awareness of the concerns of others, thus fostering a climate of compromise • External pressures can build a compelling case for change . 50 Successful reform implementation Strive for consensus about the aims without compromising the drive for improvement
  • 51.
    Resilience to political change Engage stakeholders Careful piloting Sustainable resources Careful timing Partnership withthe profession • Regular involvement by teachers in policy design helps to build capacity and shared ideas over time • Several countries have established teaching councils that provide teachers with both a forum for policy development and, critically, a mechanism for profession-led standard setting and quality assurance in teacher education, teacher induction, teacher performance and career development • Policy can encourage the formation of such communities . 51 Successful reform implementation Engage teachers not just in the implementation of reform but in their design
  • 52.
    Resilience to political change Engage stakeholders Careful piloting Sustainable resources Careful timing Partnership withthe profession • Currently only one in ten educational reforms is evaluated • Policy experimentation can help build consensus on implementation and can prove powerful in testing out policy initiatives and – by virtue of their temporary nature and limited scope – overcoming fears and resistance by specific groups of stakeholders. 52 Successful reform implementation Use and evaluate pilot projects before full implementation
  • 53.
    Resilience to political change Engage stakeholders Careful piloting Sustainable resources Careful timing Partnership withthe profession • The benefits for ‘winners’ are often insufficient to mobilise support, the costs for ‘losers’ are concentrated • Need for consistent, co-ordinated efforts to persuade those affected of the need for change and, in particular, to communicate the costs of inaction 53 Successful reform implementation Back reforms with sustainable capacity
  • 54.
    Resilience to political change Engage stakeholders Careful piloting Sustainable resources Careful timing Partnership withthe profession • All political players and stakeholders need to develop realistic expectations about the pace and nature of reforms to improve outcomes • Certain reform measures are best introduced before others, particularly because of the substantial gap between the time at which the initial cost of reform is incurred, and the time when the intended benefits of reforms materialise • Time is needed to learn about and understand impact, to build trust and develop capacity for the next stage . 54 Successful reform implementation Time implementation carefully
  • 55.
    Resilience to political change Engage stakeholders Careful piloting Sustainable resources Careful timing Partnership withthe profession • Putting the teaching profession at the heart of education reform requires a fruitful dialogue between governments and unions • Teachers should not just be part of the implementation of reforms but also part of their design • Conflict isn’t best addressed by weak unions but by strong social partnership . 55 Successful reform implementation Build partnerships with education unions to design and implement reforms
  • 56.
    5656Lessonsfromhighperformers Some students learnat high levels All students need to learn at high levels Student inclusion Routine cognitive skills Conceptual understanding, complex ways of thinking, ways of working Curriculum, instruction and assessment Standardisation and compliance High-level professional knowledge workers Teacher quality ‘Tayloristic’, hierarchical Flat, collegial Work organisation Primarily to authorities Primarily to peers and stakeholders Accountability What it all means The old bureaucratic system The modern enabling system
  • 57.