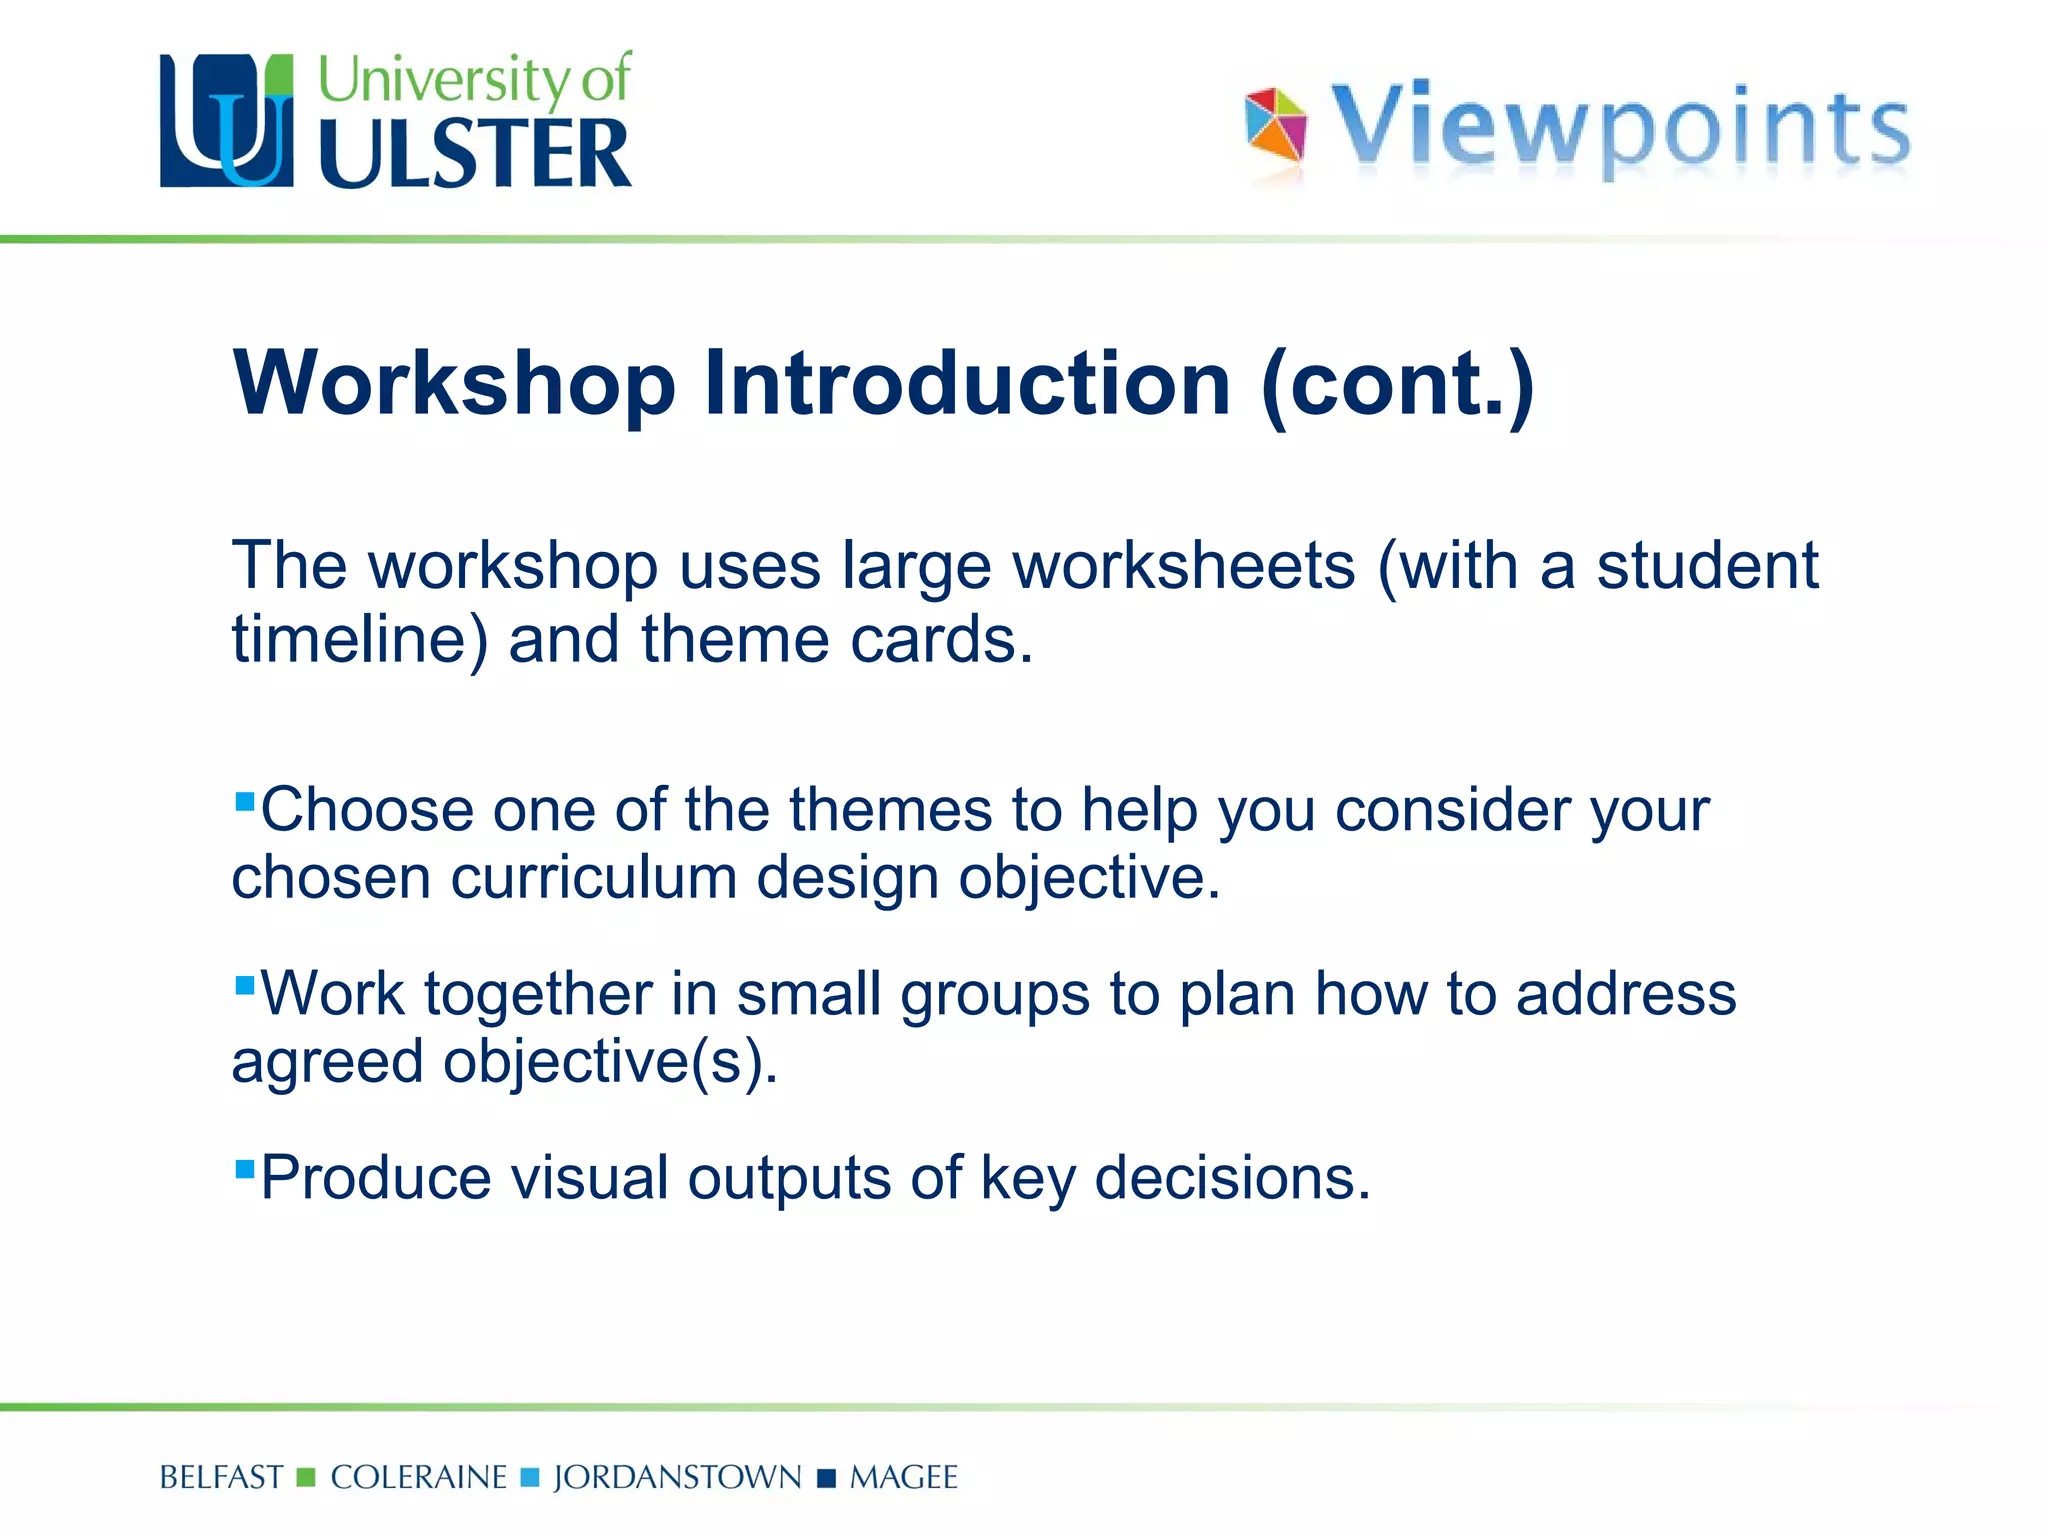
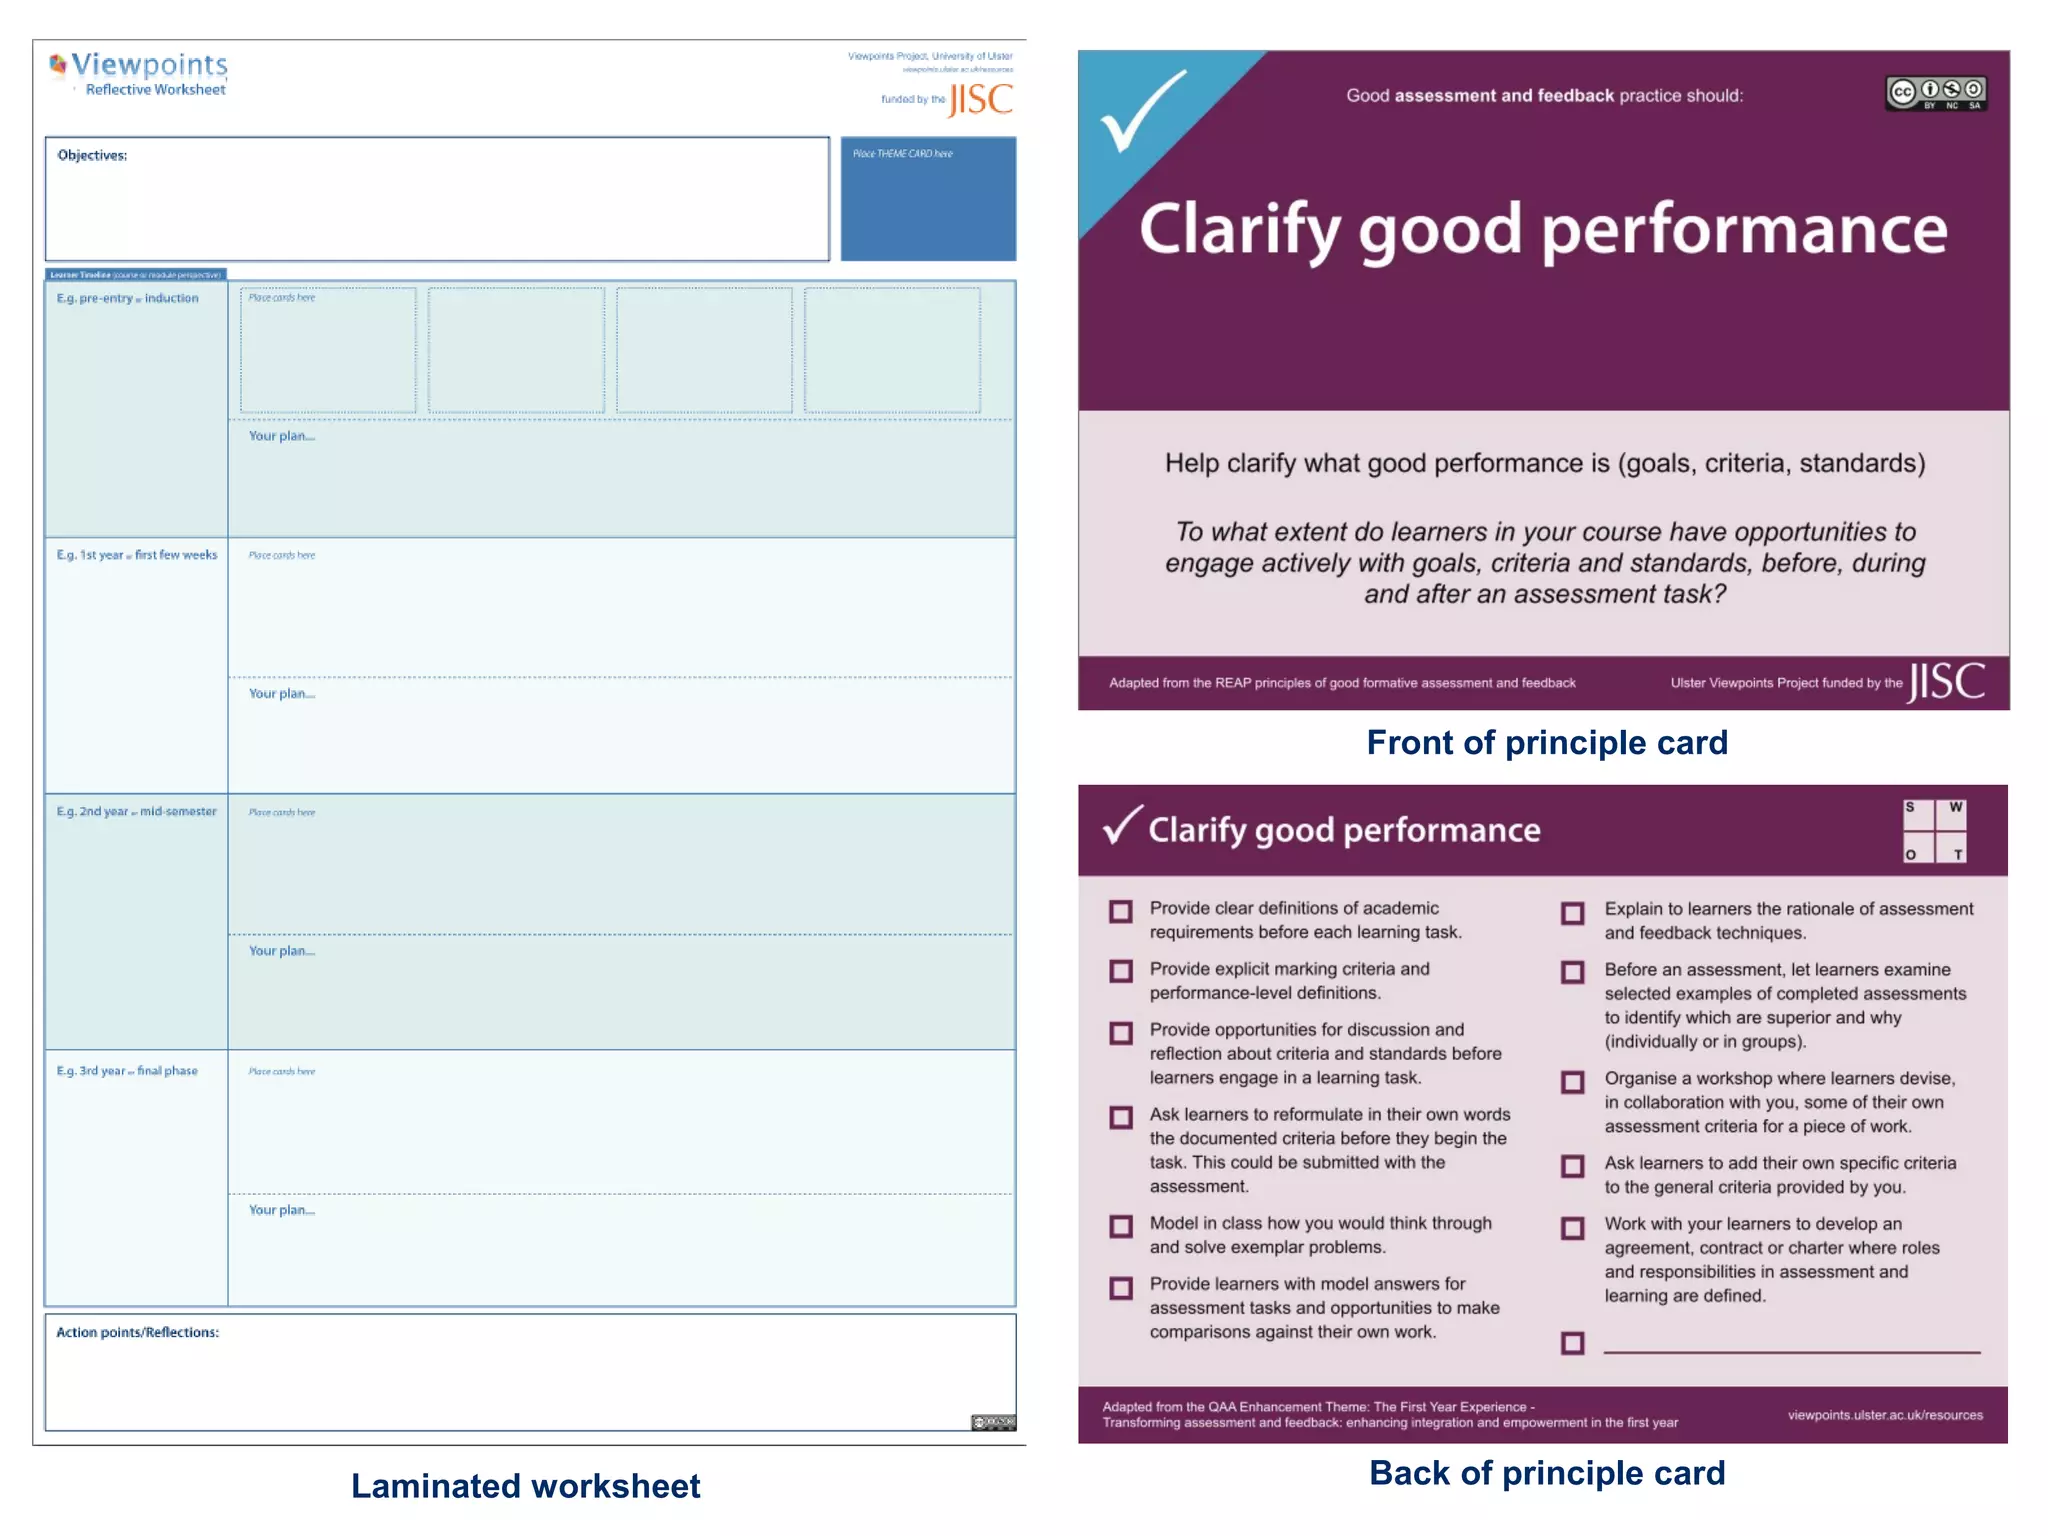
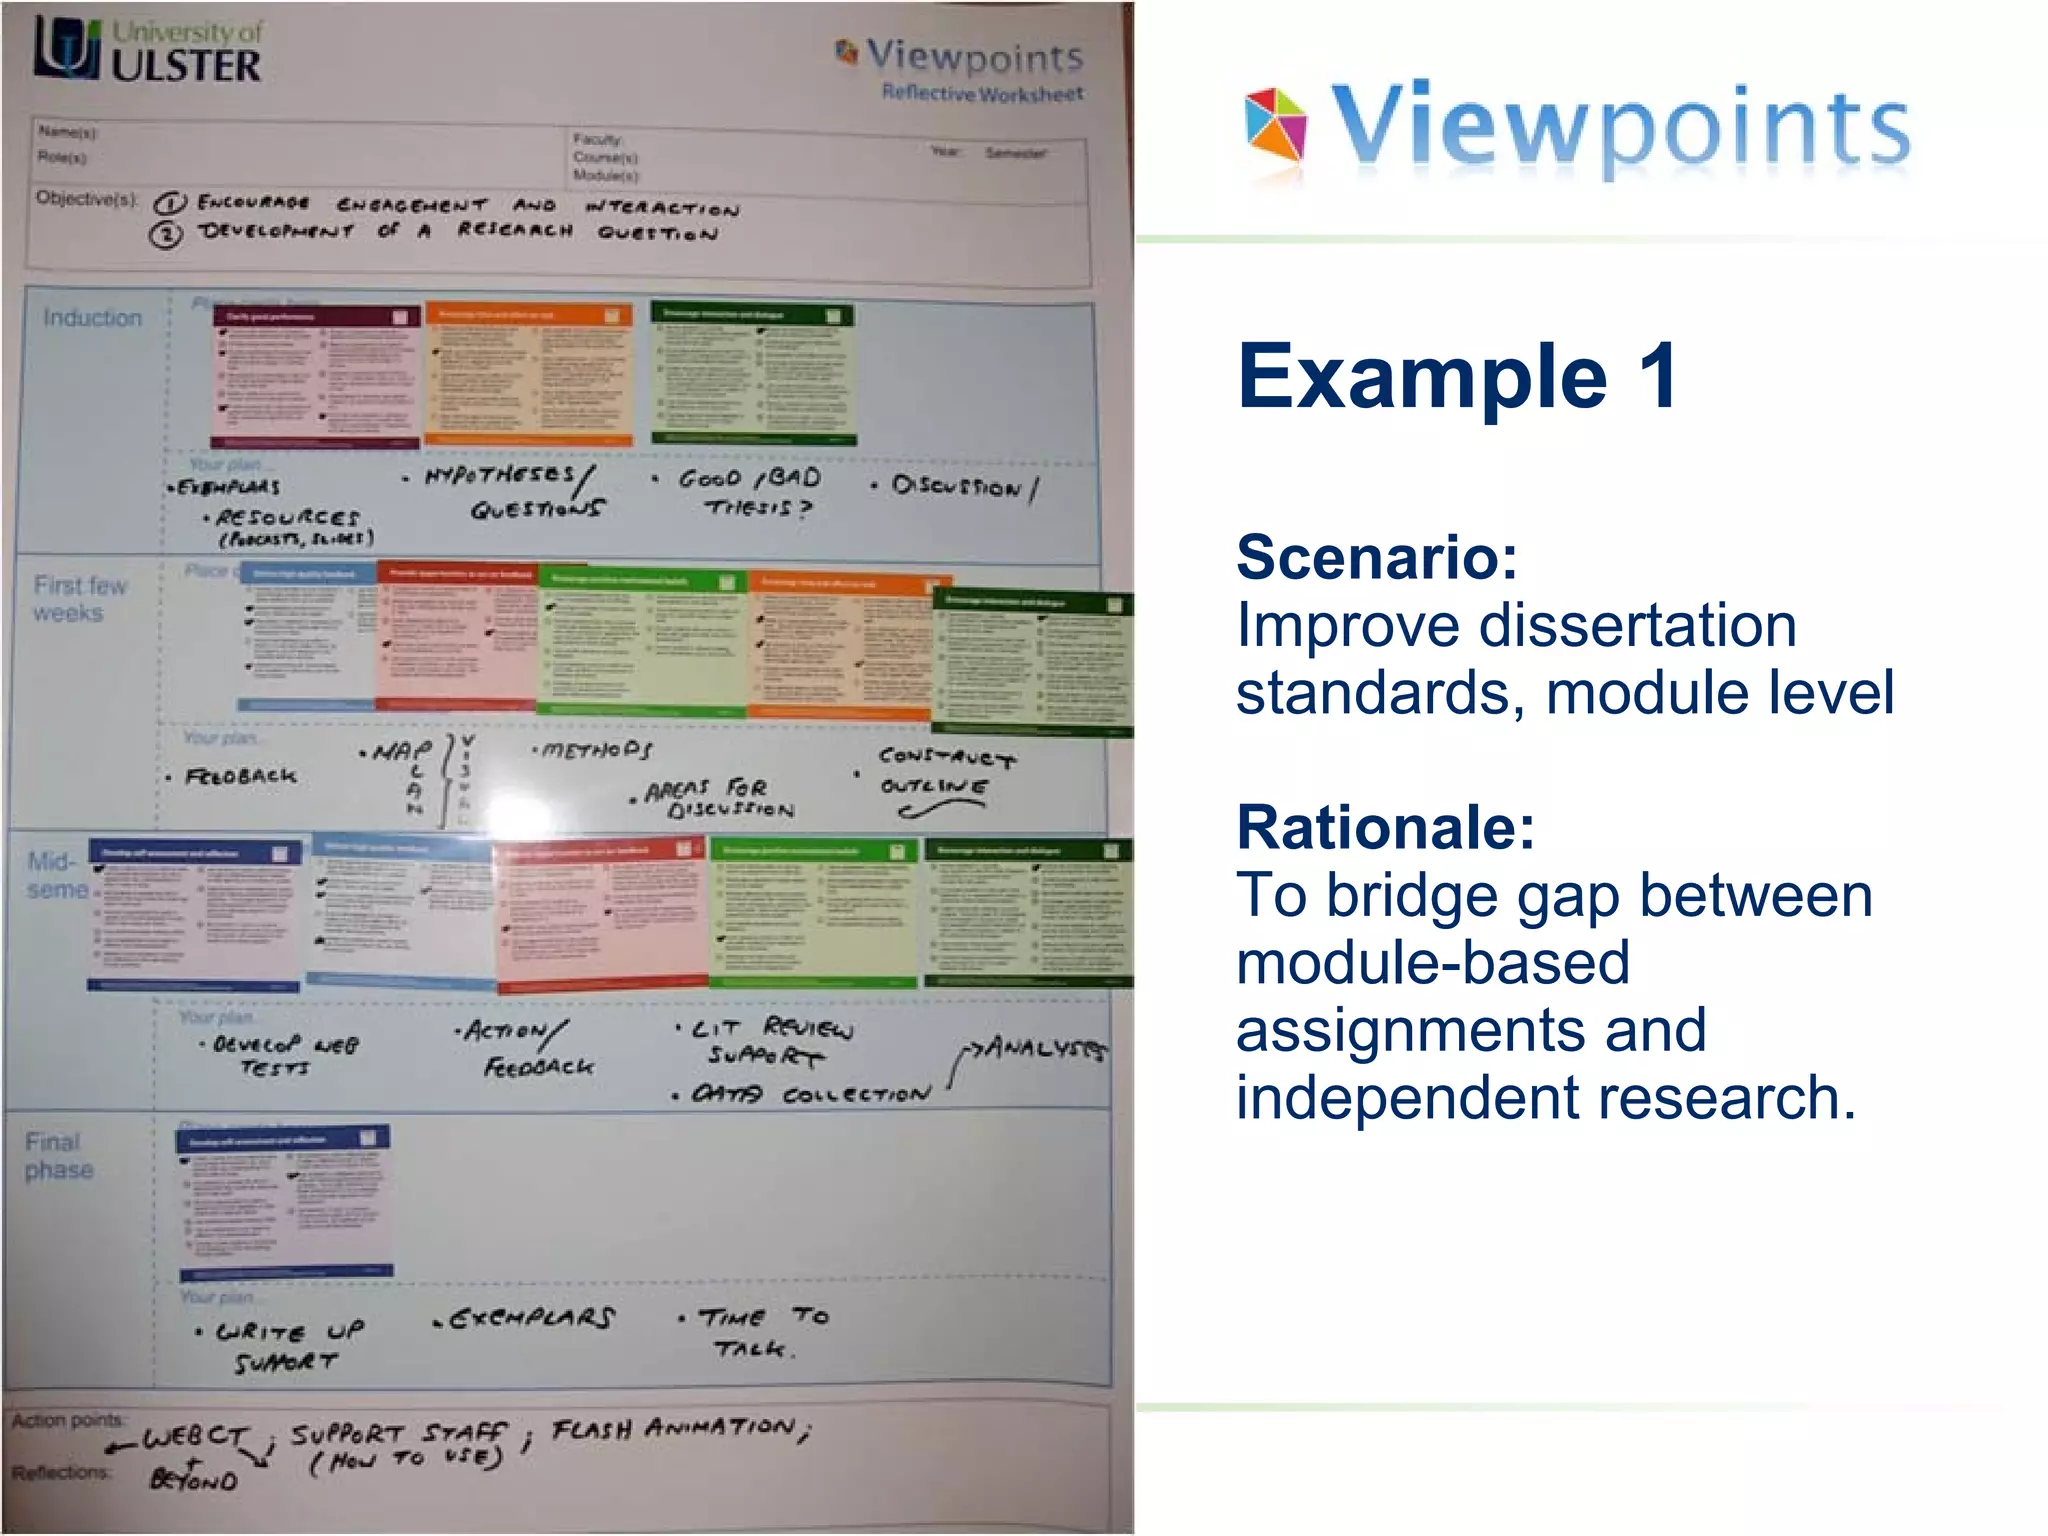
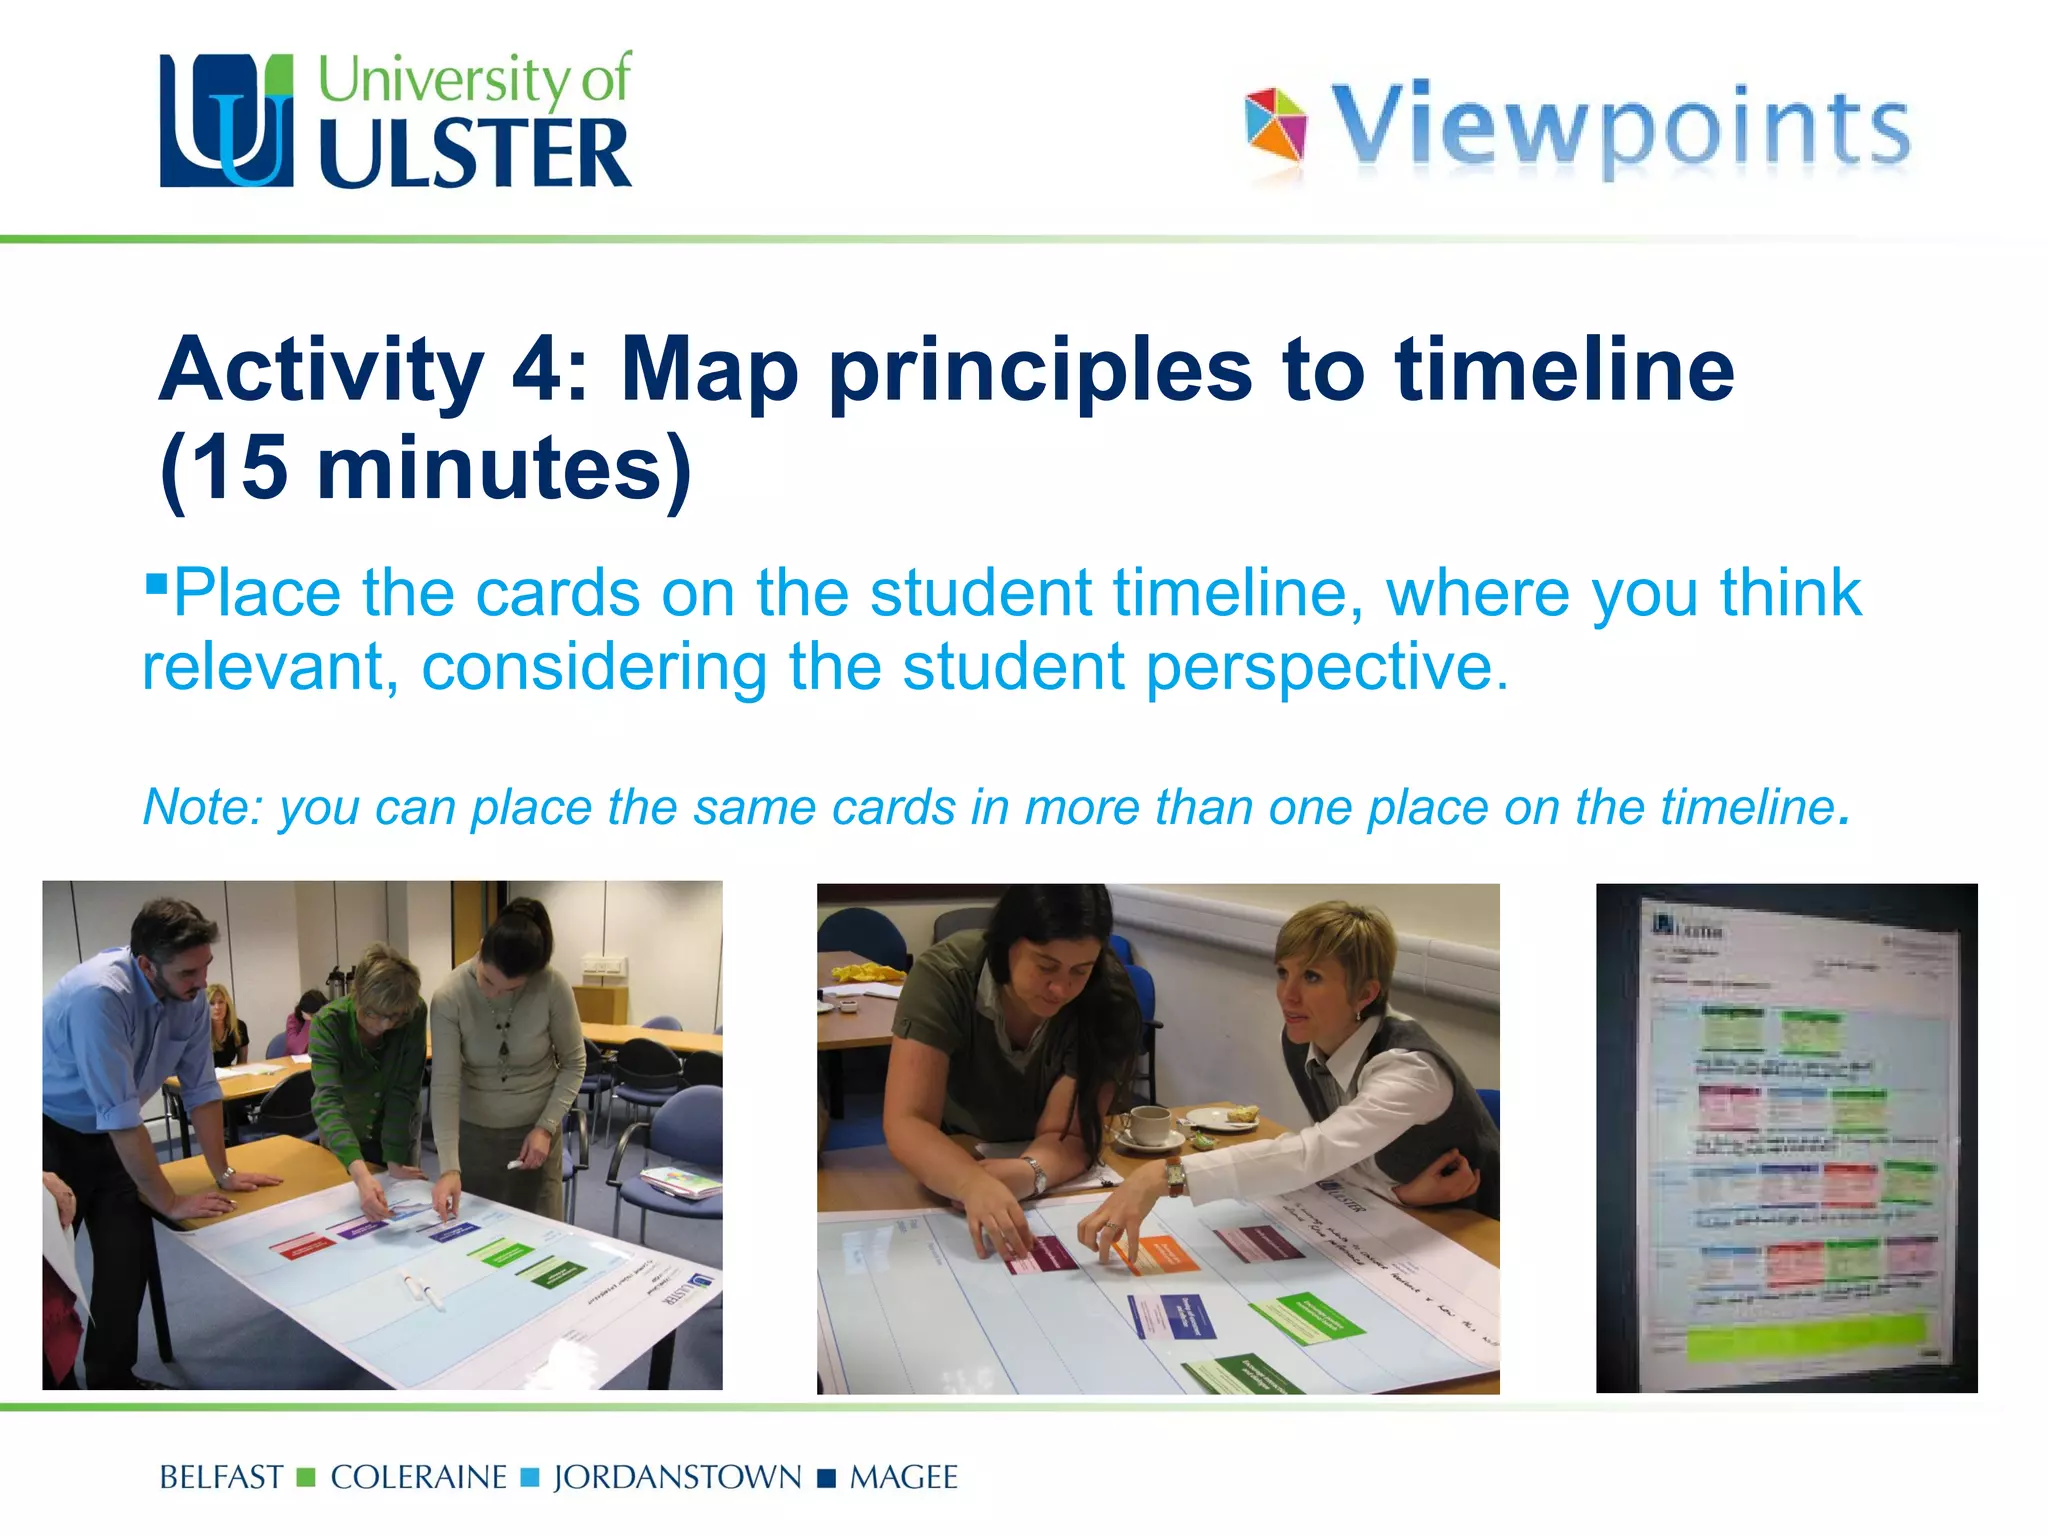
This workshop uses reflective tools like timelines and theme cards to help staff design effective curriculum. Participants work in small groups to choose a curriculum design objective, select a theme, and map principles from theme cards to a student timeline to address their objective. Examples on the backs of the cards provide ideas to consider. The workshop concludes with groups formulating plans, agreeing on action points, and sharing their work to get feedback.
A mind map is a diagram used to visually organize information. A mind map is often created around a single concept, drawn as an image in the center of a blank landscape page, to which associated representations of ideas such as images, words and parts of words are added.
A research problem is connected to state-of-the-art “check” in a given field of study
A researcher needs to find gaps in the knowledge and to fill them (by doing this research)
It must be demonstrated that at least some aspects of the problem have not been solved yet in a given context, e.g. country, sector of the economy etc.
State of the art is a required tool in evaluating the existing body of knowledge and verifying the gap.
This slide is about all necessary information about the rules of data mining...
This is short presentation for any type of students who want to do better in any examinations. The points mentioned in the presentation are very vast in nature, though I have tried them at very introductory level. The Students or Teachers can give extra information about them. It is also possible that some necessary points or elements may have missed from the presentation. Those will be added in the next Presentation !!
Mind Mapping:how to maximize your brain’s potential
Let your creative energy radiate from both sides of your brain, from the kernel of your Mind Map
By presenting ideas in a radial, graphical, nonlinear manner, mind maps encourage a brainstorming approach to planning and organizing tasks.
* Millions of people are using mind maps for brainstorming, note taking, document drafting, project planning and other tasks that require hierarchical structuring of information.
A Mind Map is a powerful graphic technique which harnesses the full range of cortical skills in a single, powerful manner skills manner
Three case studies deploying cluster analysisGreg Makowski
Three case studies are discussed, that include cluster analysis as a component.
1) Customer description for a credit card attrition model, to describe how to talk to customers.
2) Hotel price optimization. Use clusters to find subsets of similar behavior, and optimize prices within each cluster. Use a neural net as the objective function.
3) Retail supply chain, planning replenishment using 52 week demand curves using thousands of seasonal "profiles" or clusters.
An infographic (or information graphic) is a visual representation of information or data. An infographic is a collection of imagery, data visualizations like pie charts and bar graphs, and minimal text that gives an easy-to-understand overview of a topic. This presentation explains the concept of mindmap, infographics, and its tools.
Accelerating Random Forests in Scikit-LearnGilles Louppe
Random Forests are without contest one of the most robust, accurate and versatile tools for solving machine learning tasks. Implementing this algorithm properly and efficiently remains however a challenging task involving issues that are easily overlooked if not considered with care. In this talk, we present the Random Forests implementation developed within the Scikit-Learn machine learning library. In particular, we describe the iterative team efforts that led us to gradually improve our codebase and eventually make Scikit-Learn's Random Forests one of the most efficient implementations in the scientific ecosystem, across all libraries and programming languages. Algorithmic and technical optimizations that have made this possible include:
- An efficient formulation of the decision tree algorithm, tailored for Random Forests;
- Cythonization of the tree induction algorithm;
- CPU cache optimizations, through low-level organization of data into contiguous memory blocks;
- Efficient multi-threading through GIL-free routines;
- A dedicated sorting procedure, taking into account the properties of data;
- Shared pre-computations whenever critical.
Overall, we believe that lessons learned from this case study extend to a broad range of scientific applications and may be of interest to anybody doing data analysis in Python.
This presentation was delivered on the 13th May 2010 at a University of Ulster revalidation away day for the Business school. It included an overview of the work of the Viewpoints project (helping Ulster staff with curriculum design) and an interactive workshop to let staff plan their assessment and feedback strategy for a course.
This presentation was delivered on the 11th June 2010 as part of a workshop for Economics in the University of Ulster
It included an overview of the work of the Viewpoints project (helping Ulster staff with curriculum design) and an interactive workshop to let staff redesign their assessment and feedback strategy for a course.
This presentation is part of an interactive workshop session delivered at the 3rd CAMEL meeting between University of Ulster, University of Strathclyde and Open University. It gives a taster of the Viewpoints Information Skills and Assessment and Feedback workshop sessions.
A short presentation delivered as part of an interactive workshop session, at the CAMEL meeting between University of Ulster, Strathclyde and Open University. It demonstrates how the workshop session would work, using the Assessment and Feedback and Information Skills strands
This presentation was delivered on the 28th May 2010 as part of the School of Law First Year Review.
It included an overview of the work of the Viewpoints project (helping Ulster staff with curriculum design) and an interactive workshop to let staff redesign their assessment and feedback strategy for a course, in particular to help them redesign one module so that it fits better with the other modules and helps students with the transition to University.
Dr Alan Masson (Magee Campus) and Catherine O’Donnell (Jordanstown Campus) delivered ‘Week 6: Assessment and Feedback’ on the Postgraduate Certificate in Higher Education Course (PgCHEP) course on 27th October 2010.
This workshop was delivered on 18th April 2011 at the TFL Development Programme Residential at the Rosspark Hotel in Ballymena. The theme of the Programme was 'Student Engagement' and there were 3 project teams from the University of Ulster exploring this theme.
This workshop, which was delivered at ALT-C 2010 in Nottingham, aims to stimulate constructive dialogue around curriculum planning, allow collaboration and creativity, and help participants plan a student-centred curriculum design model.
a workshop presentationon curriculum design that introduces the idea of the Design Studio as an approach at Sheffield Hallam University and shares the Viewpoints method developed by the University of Ulster
Viewpoints Assessment and Feedback workshops at the Ulster eLearning Conference 2010 - helping practitioners creatively reflect on their assessment and feedback practice, considering the student perspective.
This presentation was first delivered at the Sixth International Blended Learning Conference, as part of a joint workshop, on the 16th of June 2011. It introduces the JISC-funded Viewpoints curriculum design project, given some examples of Viewpoints outputs, and gives some conclusions.
The French Revolution, which began in 1789, was a period of radical social and political upheaval in France. It marked the decline of absolute monarchies, the rise of secular and democratic republics, and the eventual rise of Napoleon Bonaparte. This revolutionary period is crucial in understanding the transition from feudalism to modernity in Europe.
For more information, visit-www.vavaclasses.com
Welcome to TechSoup New Member Orientation and Q&A (May 2024).pdfTechSoup
In this webinar you will learn how your organization can access TechSoup's wide variety of product discount and donation programs. From hardware to software, we'll give you a tour of the tools available to help your nonprofit with productivity, collaboration, financial management, donor tracking, security, and more.
We all have good and bad thoughts from time to time and situation to situation. We are bombarded daily with spiraling thoughts(both negative and positive) creating all-consuming feel , making us difficult to manage with associated suffering. Good thoughts are like our Mob Signal (Positive thought) amidst noise(negative thought) in the atmosphere. Negative thoughts like noise outweigh positive thoughts. These thoughts often create unwanted confusion, trouble, stress and frustration in our mind as well as chaos in our physical world. Negative thoughts are also known as “distorted thinking”.
How to Make a Field invisible in Odoo 17Celine George
It is possible to hide or invisible some fields in odoo. Commonly using “invisible” attribute in the field definition to invisible the fields. This slide will show how to make a field invisible in odoo 17.
Operation “Blue Star” is the only event in the history of Independent India where the state went into war with its own people. Even after about 40 years it is not clear if it was culmination of states anger over people of the region, a political game of power or start of dictatorial chapter in the democratic setup.
The people of Punjab felt alienated from main stream due to denial of their just demands during a long democratic struggle since independence. As it happen all over the word, it led to militant struggle with great loss of lives of military, police and civilian personnel. Killing of Indira Gandhi and massacre of innocent Sikhs in Delhi and other India cities was also associated with this movement.
Synthetic Fiber Construction in lab .pptxPavel ( NSTU)
Synthetic fiber production is a fascinating and complex field that blends chemistry, engineering, and environmental science. By understanding these aspects, students can gain a comprehensive view of synthetic fiber production, its impact on society and the environment, and the potential for future innovations. Synthetic fibers play a crucial role in modern society, impacting various aspects of daily life, industry, and the environment. ynthetic fibers are integral to modern life, offering a range of benefits from cost-effectiveness and versatility to innovative applications and performance characteristics. While they pose environmental challenges, ongoing research and development aim to create more sustainable and eco-friendly alternatives. Understanding the importance of synthetic fibers helps in appreciating their role in the economy, industry, and daily life, while also emphasizing the need for sustainable practices and innovation.
The Indian economy is classified into different sectors to simplify the analysis and understanding of economic activities. For Class 10, it's essential to grasp the sectors of the Indian economy, understand their characteristics, and recognize their importance. This guide will provide detailed notes on the Sectors of the Indian Economy Class 10, using specific long-tail keywords to enhance comprehension.
For more information, visit-www.vavaclasses.com
2. Session Outline
• Introduction to the Viewpoints curriculum design
resources and processes
• Examples of workshop outputs, photos, findings
• Group work activities
• Conclusions and questions
3. Workshop Introduction
This workshop uses a series of reflective tools
(timeline and theme cards) to prompt ideas about
creating effective curriculum design.
The tools help staff consider themes such as:
- assessment and feedback
- information skills
- learner engagement
while considering the learner perspective.
4. Workshop Introduction (cont.)
The workshop uses large worksheets (with a student
timeline) and theme cards.
Choose one of the themes to help you consider your
chosen curriculum design objective.
Work together in small groups to plan how to address
agreed objective(s).
Produce visual outputs of key decisions.
8. Example 2
Scenario:
Improve student engagement
Rationale:
Course up for revalidation –
going to be using a blended
approach (combination of
block face-to-face teaching
and online learning).
10. Activity 1: Agree objective (10 minutes)
Spend a few minutes discussing/brainstorming -
o Why do you need to redesign your chosen
module/course?
Briefly record details of your objective in the space
provided on the worksheet.
o E.g. ‘Improve student engagement’, ‘Improve
feedback methods’.
You might also find it useful to note key decisions on the
worksheet using markers or post-its as you go along.
11. Activity 2: Choose a theme (10 minutes)
Select one of the three themes (Assessment and
Feedback, Information Skills or Learner Engagement),
which relates to your objective.
Begin to think about how your chosen theme could help
you meet your objective(s).
You might find it useful to make notes on the worksheet using
markers or post-its as you go along.
12. Activity 3: Select principles (10 minutes)
Firstly, only read the front of the cards for your chosen theme.
Choose any cards/principles that might help you address your
objective(s).
13. Activity 4: Map principles to timeline
(15 minutes)
Place the cards on the student timeline, where you think
relevant, considering the student perspective.
Note: you can place the same cards in more than one place on the timeline.
14. Activity 5: Select examples (15 minutes)
Turn over the selected cards to show the examples on the
back.
Select any examples that might help achieve your
objectives by ticking them on the cards.
If time is short, only turn over the most important cards.
15. Activity 6: Review ideas & formulate plan
(10 minutes)
Discuss how your ideas could be used in practice.
Make notes using post-its or markers on worksheet.
Tailor the examples to your own teaching practice.
16. Activity 7: Action points & reflections
(10 minutes)
Agree any final reflections and action points to take forward.
Record these action points on the timeline.
17. Activity 8: Share plans (5 mins/group)
If there is more than one group, one or two members from
each group should present their completed worksheet and
briefly feed back on their conclusions.