Download as PPSX, PPTX

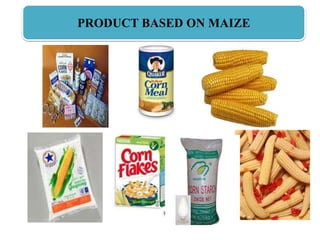
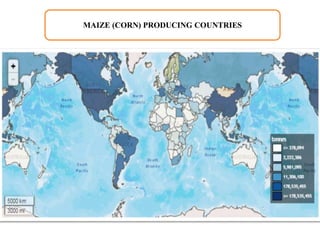
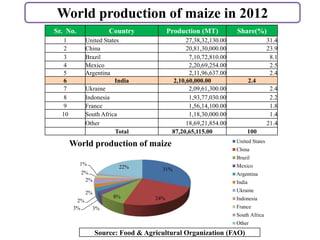
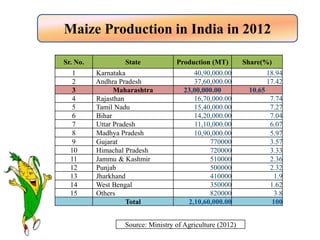
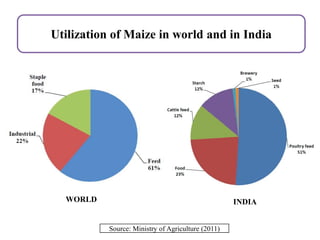
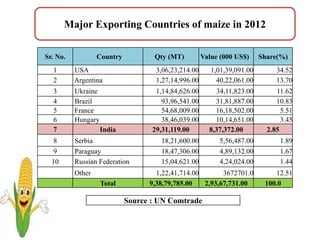
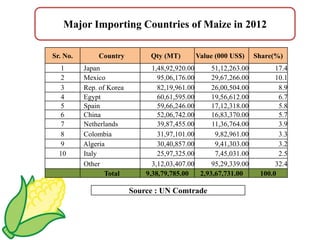
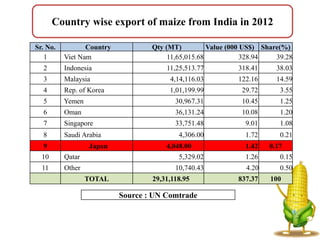
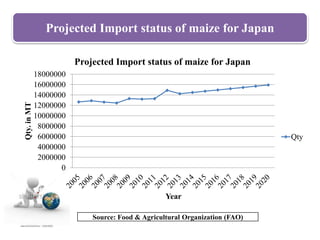
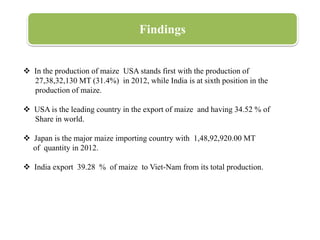


The document presents an analysis of maize production, export, and import trends globally and in India, highlighting the leading producers like the USA and China. It details export specifications and major importing and exporting countries, with Japan identified as the largest importer. Additionally, it discusses potential export destinations for India, noting that India’s maize exports represent a small fraction of total production.


