STUDY OF MORPHOLOGICAL AND YIELD ATRIBUTING CHARACTERS IN INDIGENOUS RICE (ORYZA SATIVA L.) OF BASTAR

The present study was carried out to study ninety four rice accessions, along with checks, on the basis of sixteen qualitative and twenty quantitative characters. Analysis of variance for quantitative characters showed differences for different characters. High coefficient of variation in the entire genotypes was observed for grain yield per plant (27.4 %), number of effective tillers per plant (22.37 %), test weight (21.14 %) and kernel length breadth ratio (20.59 %). Correlation analysis revealed positive and highly significant correlation of total number of filled grains per panicle, total number of grains per panicle, plant height and number of effective tiller per plant; harvest index, test weight, flag leaf length and days to maturity had positive highly significant correlation with grain yield per plant. Principal Component Analysis revealed, out of 20, only seven principal components (PCs) exhibited more than 1.00 eigen value, and showed about 77.42 % variability among the traits studied. So, these 7 PCs were given due importance for further explanation. Component matrix revealed that the PC1 was mostly related to quality characters while PC2, PC3, PC4, PC5, PC6 and PC7 mostly associated with yield related traits. Cluster analysis performed by UPGMA method using Euclidean distance as dissimilarity measure divided the 97 genotypes of rice into ten clusters. The cluster III constituted of 48 genotypes, forming the largest cluster followed by cluster VI (22 genotypes), cluster V (10 genotypes), cluster II (5 genotypes) and cluster VIII (4 genotypes), cluster I, IV and VII (two genotypes each), cluster IX and X had (only one genotypes each). Quality analysis performed for 97 rice genotypes revealed wide range of genetic variability for most of the quality traits.

Recommended
More Related Content
What's hot
What's hot (20)
Similar to STUDY OF MORPHOLOGICAL AND YIELD ATRIBUTING CHARACTERS IN INDIGENOUS RICE (ORYZA SATIVA L.) OF BASTAR
Similar to STUDY OF MORPHOLOGICAL AND YIELD ATRIBUTING CHARACTERS IN INDIGENOUS RICE (ORYZA SATIVA L.) OF BASTAR (20)
More from Vipin Pandey
More from Vipin Pandey (9)
Recently uploaded
Recently uploaded (20)
STUDY OF MORPHOLOGICAL AND YIELD ATRIBUTING CHARACTERS IN INDIGENOUS RICE (ORYZA SATIVA L.) OF BASTAR
- 1. www.tjprc.org editor@tjprc.org STUDY OF MORPHOLOGICAL AND YIELD ATRIBUTING CHARACTERS IN INDIGENOUS RICE (ORYZA SATIVA L.) OF BASTAR VIPIN KUMAR PANDEY1 & SONALI KAR2 1 P.G Student, Department of Genetics and Plant Breeding S G College of Agriculture and Research Station Kumhrawand, Jagdalpur, Bastar, India 2 Scientist, Department of Genetics and Plant Breeding S G College of Agriculture and Research Station Kumhrawand, Jagdalpur, Bastar, India ABSTRACT The present study was carried out to study ninety four rice accessions, along with checks, on the basis of sixteen qualitative and twenty qualitative characters. Analysis of variance for quantitative characters showed differences for different characters. High coefficient of variation in the entire genotypes was observed for grain yield per plant (27.4 %), number of effective tillers per plant (22.37 %), test weight (21.14 %) and kernel length breadth ratio (20.59 %). Correlation analysis revealed positive and highly significant correlation of total number of filled grains per panicle, total number of grains per panicle, plant height and number of effective tiller per plant; harvest index, test weight, flag leaf length and days to maturity had positive highly significant correlation with grain yield per plant. Principal Component Analysis revealed, out of 20, only seven principal components (PCs) exhibited more than 1.00 eigen value, and showed about 77.42 % variability among the traits studied. So, these 7 PCs were given due importance for further explanation. Component matrix revealed that the PC1 was mostly related to quality characters while PC2, PC3, PC4, PC5, PC6 and PC7 mostly associated with yield related traits. Cluster analysis performed by UPGMA method using Euclidean distance as dissimilarity measure divided the 97 genotypes of rice into ten clusters. The cluster III constituted of 48 genotypes, forming the largest cluster followed by cluster VI (22 genotypes), cluster V (10 genotypes), cluster II (5 genotypes) and cluster VIII (4 genotypes), cluster I, IV and VII (two genotypes each), cluster IX and X had (only one genotypes each). Quality analysis performed for 97 rice genotypes revealed wide range of genetic variability for most of the quality traits. KEYWORDS: . High coefficient of variation, number of effective tiller per plant& kernel length breadth ratio Received: Jun 25, 2017; Accepted: Jul 09, 2017; Published: Jul 31, 2017; Paper Id.: IJASRAUG201770 INTRODUCTION Rice is one of the most important staple foods for more than half of the world’s population and influences the livelihoods and economies of several billion people. Rice is life for most people living in Asia. Indigenous varieties are rapidly being lost due to changes in land use and agricultural practices, which favour agronomically improved varieties. Some indigenous rice genotypes of Bastar contain special quality characters like iron and zinc content and some rice genotypes contain delicious scent, exportable grain texture or size, cooking quality or rich in vitamins. The diversity among land races of any crop is required for improvement of the crop. This investigation may be helpful for researchers to identify the gene, needed in the near future to achieve food security. Many traditional cultivars are Safari, Gurmatia, BhataMokdo, ChudiDhan, Kalimoonch, Laicha etc. According to the traditional healers of Bastar region, many of these medicinal rice varieties are used in traditional medicine system for treatment of rheumatism, skin infections, paralysis, diabetes etc. (Das and Oudhia, 2001). For the development OriginalArticle International Journal of Agricultural Science and Research (IJASR) ISSN(P): 2250-0057; ISSN(E): 2321-0087 Vol. 7, Issue 4, Aug 2017, 537-546 © TJPRC Pvt. Ltd.
- 2. 538 Vipin Kumar Pandey & Sonali Kar Impact Factor (JCC): 5.9857 NAAS Rating: 4.13 of economically high-yielding varieties with all of the desirable agronomic traits, it is also important to consider other characteristics when selecting the parental material, such as aspects related to difference in grain type and shape, plant height and other yield related traits. Yield is a complex trait being governed by a large number of cumulative, duplicate and dominant genes and directly or indirectly influenced by environment, as well as responds poorly to the direct selection. Keeping these points in view, to find out suitable genotypes or donor to meet any current or future demand for improvement of the rice crop, various indigenous rice genotypes were taken under study. MATERIALS AND METHODS The experiment was carried out at Research cum Instructional Farm, S.G. College of Agriculture and Research Station, Kumhrawand, Jagdalpur, Bastar, Chhattisgarh, India. The experimental materials comprised of ninety four local landraces of rice and three popular standard checks. The experiment was conducted during Kharif 2016 in RBD Design to assess the agro morphological characterization, genetic variability, association analysis and genetic divergence among the ninety four local landraces of rice (Oryza sativa L.) and three popular standard checks namely MTU-1010, Danteshwari and CR-40.The observations on various agro-morphological characters including qualitative and quantitative characters of rice were recorded viz. harvest index, grain yield/plant, days to 50% flowering, days to maturity, flag leaf length, flag leaf width, plant height, panicle length, number of effective tillers/plant, total number of grain /panicle, spikelet fertility, test weight, total number of filled grains/panicle, days to first heading, grain breadth, grain length, grain length breadth ratio, kernel breadth, kernel length, kernel length breadth ratio, grain shape and kernel shape.The data recorded on ninety four local landraces of rice and three popular standard checks for different quantitative characters and quality characters were subjected to the statistical analysis. RESULTS AND DISCUSSIONS To establish distinctiveness among rice genotypes, qualitative characters have been used. Qualitative traits are considered as morphological markers in the identification of genotypes of rice, because they are less influenced by environment. In the present investigation, out of 16 qualitative characters observed, basal leaf sheath color, leaf blade color, flag leaf angle, apiculus color, awn length, awn color, auricle color, days to 50% flowering, plant height, panicle length, maturity(days) recorded highest variation followed by flag leaf width, flag leaf length, stigma color and awning observed low variation in different genotypes. Medium flag leaf width, Medium flag leaf length and awning absent was observed in 92%, 82% and 74% in the genotypes, respectively. All the 97 genotypes exhibited 2-cleft shape of ligule, and marked no differences among genotypes. Similar findings were reported by Parikh et al. (2012); Subudhiet al. (2012); Raoet al. (2013); Sarawgiet al. (2014); Gupta et al. (2014); Ahmed et al. (2016) and Kumar et al. (2016). Thus, characterization of germplasm genotypes establishes distinctiveness among rice genotypes. It is not only important for utilizing the appropriate attribute based donors in breeding programmes, but also essential in the present era for protecting the unique rice. Wide range of genetic variability was observed for most of the quantitative traits. High magnitude of coefficient of variation (more than 20 %) in the entire genotypes was observed for grain yield per plant (27.4 %), number of effective tillers per plant (22.37 %), test weight (21.14 %), kernel length breadth ratio (20.59 %). Similarly findings of High amount of coefficient of variation for effective tillers per plant were observed by Singh et al. (2010) and Badriet al. (2015). Correlation analysis revealed positive and highly significant correlation of total number of filled grains per panicle, total
- 3. Study of Morphological and Yield Atributing Characters in 539 Indigenous Rice (Oryza Sativa L.) of Bastar www.tjprc.org editor@tjprc.org number of grains per panicle, plant height and number of effective tiller per plant, harvest index, test weight, flag leaf length and days to maturity had positive and highly significant correlation with grain yield per plant. It indicates strong correlation of these traits with grain yield per plant and selection for these traits will be useful in improving grain yield. Positive correlation between desirable traits is favorable, because it helps in simultaneous improvement of both the characters. On the other hand, negative correlation will hinder the simultaneous expression of both characters with high values. In such situation some economic compromise has to be made (Table 1). Path coefficient analysis revealed that flag leaf length, days to maturity, plant height, number of effective tillers per plant, harvest index, and total number of grains per panicle had highly significant positive correlation with grain yield per plant as well as positive direct effect on grain yield per plant. The total number of filled grains per panicle had significant positive correlation with grain yield per plant but exhibited very high negative direct effect on grain yield. In this situation, correlation is mainly due to indirect effects of the character through another component trait, so indirect causal factors are to be considered simultaneously for selection. According to the magnitude of the direct effects on grain yield, the order of yield components was direct selection for characters viz. flag leaf length, days to maturity, plant height, number of effective tillers per plant, harvest index and total number of grains per panicle, which will be very effective for increasing the grain yield, hence they should be given consideration in the selection criteria (Table 2). PCA was performed for twenty agro morphological traits in local landraces of rice and presented in Table. As per the criteria set by Brejdaet al. (2000), the PC with eigen values >1 and which explained at least 5 % of the variation in the data were considered in the present study. The PC with higher Eigen values and variables which had high factor loading was considered as best representative of system attributes. Out of 20, only seven principal components (PCs) exhibited more than 1.00 Eigen value, and showed about 77.42 % variability among the traits studied. So, these 7 PCs were given due importance for further explanation. The PC1 showed 20.76 % while, PC2, PC3, PC4, PC5, PC6 and PC7 exhibited16.47%, 12.51%, 10.18%, 7.17%, 5.83% and 5.49% variability respectively among the genotypes for the traits under study (Table 3). The first PC accounts for as much of the variability in the data as possible, and each succeeding component accounts for as much of the remaining variability as possible. Component matrix revealed that the PC1 was mostly related to quality characters while PC2, PC3, PC4, PC5, PC6 and PC7 mostly associated with yield related traits. So, a good breeding programme can be initiated by selecting the genotypes from PC1 for quality aspect and for yield related traits genotypes from PC2, PC3, PC4, PC5 and PC6 can be selected. These results are in agreement with the findings of earlier workers (Sinha and Mishra, 2013, Nachimuthuet al. 2014, Musyokiet al. 2015 and Balochet al. 2016).Top 10 principal component scores (PC scores) for all the genotypes were estimated in seven principal components. These scores can be utilized to propose precise selection indices, whose intensity can be decided by variability explained by each of the principal component. High PC score for a particular accession in a particular component denotes high values for the variables in that particular accession. So, genotypes showing top scores in their respective components can be selected for breeding programmes in association with the traits showing high factor loadings in their respective components. Cluster analysis performed by UPGMA method using Euclidean distance as dissimilarity measure divided the 97 genotypes of rice into ten clusters. The genotypes were not evenly distributed among the clusters. The cluster III constituted of 48 genotypes, forming the largest cluster followed by cluster VI (22 genotypes), cluster V (10 genotypes), cluster II (5 genotypes) and cluster VIII (4 genotypes), cluster I, IV and VII (two genotypes each), cluster IX and X had
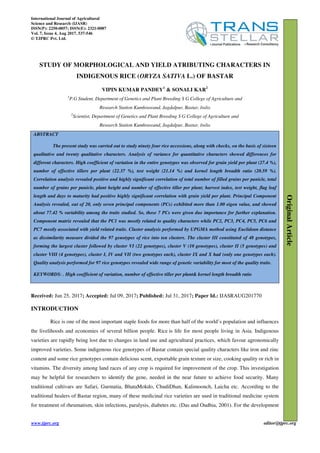
- 4. 540 Vipin Kumar Pandey & Sonali Kar Impact Factor (JCC): 5.9857 NAAS Rating: 4.13 (only one genotypes each). The pattern of group constellation proved the existence of significant amount of variability. The intra cluster distance ranged from 0.00 (cluster IX and X) to 24.82 (cluster III). The inter cluster distance was maximum between cluster I and VIII (175.36) and minimum inter cluster distance was observed between cluster II and cluster III (34.51). To realize much variability and high heterotic effect, parents should be selected from two clusters having wider inter cluster distance. Considering importance of genetic distance and relative contribution of characters towards total divergence, the present study indicated that parental lines selected from cluster I (Ragovati, CR40) for total number of filled grains per panicle, total number of grains per panicle, number of effective tiller per plant, grain yield per plant and flag leaf length while cluster IV (Baktichudi, Hathipanjra) contained for spikelet fertility, plant height, panicle length, test weight, flag leaf width, grain length and kernel length, while cluster VII (Bhasampatti, Ghaghardhan) for grain breadth and kernel breadth. Cluster IX (Tagandhan) had for days to 50 % flowering, days to first heading, and days to maturity whereas, cluster X (Danteshwari) had for harvest index, grain length breadth ratio and kernel length breadth ratio could be used in crossing programmes to achieve desired segregants. This results are in confirmation with the findings of Banumathyet al. (2010), Chanbeniet al. (2012); Prasad et al. (2013), Haqueet al. (2014), Beevi and Venkatesan (2015) andPanigrahiet al. (2016). (Table 4, 5and Figure 1) Quality analysis performed for rice genotypes revealed all the quality characters under study showed more than 60% ( high heritability), except for kernel length breadth ratio (47.53%) and for 47.64% kernel breadth, other characters was estimated highest heritability 97.46% for grain length, 93.95 % for, grain breadth, 68.67% for kernel length and 62.72 for grain length breadth ratio. In case of quality characters, highest magnitude of genetic advance as percent of mean was recorded except for grain breadth, 13.93 % and kernel breadth 14.34 %; other characters was estimated highest magnitude of genetic advance as percent of mean was recordedkernel length breadth ratio (31.89 %), kernel length for (28.17 %), grain length breadth ratio for (26.59 %) and grain length (23.28)(Table 6). Table 1: Correlation for Different Quantitative Traits Characters TNFGP TNGP SF PH NETH PL HI TW FLL FLW TNFGP 1 0.697** -0.099 0.08 0.031 0.181* -0.053 -0.176* 0.096 0.088 TNGP 1 0.270** 0.053 0.006 0.141* 0.231** 0.215** 0.115 0.101 SF 1 0.051 0.069 -0.076 0.591** 0.665** -0.033 0.079 PH 1 -0.074 0.327** -0.104 0.190** 0.179* 0.074 NETH 1 -0.116 0.039 -0.172* 0.156* -0.038 PL 1 -0.131 -0.035 0.043 -0.032 HI 1 0.464** 0.001 0.053 TW 1 -0.052 0.211** FLL 1 -0.094 FLW 1 DTF DTFH DTM GB GL GLBR KB KL KLBR GYP
- 5. Study of Morphological and Yield Atributing Characters in 541 Indigenous Rice (Oryza Sativa L.) of Bastar www.tjprc.org editor@tjprc.org Table 1: Continued Characters DTF DTFH DTM GB GL GLBR KB KL KLBR GYP TNFGP 0.034 -0.101 0.179* -0.157* -0.238** -0.203** -0.131 -0.217** -0.213** 0.344** TNGP 0.051 0.362** 0.230** 0.353** 0.220** 0.219** 0.364** 0.249** 0.209** 0.336** SF -0.201** 0.659** -0.056 0.783** 0.778** 0.764** 0.770** 0.756** 0.719** -0.011 PH 0.223** 0.123 0.082 -0.01 0.149* 0.077 -0.032 0.1 0.072 0.257** NETH -0.072 -0.035 0.055 -0.084 -0.014 0.113 -0.102 -0.056 0.077 0.276** PL 0.099 0.002 -0.083 -0.095 -0.043 -0.041 -0.109 -0.059 -0.029 0.12 HI -0.225** 0.401** -0.091 0.511** 0.524** 0.509** 0.503** 0.582** 0.536** 0.297** TW 0.054 0.688** 0.019 0.830** 0.832** 0.569** 0.800** 0.803** 0.560** 0.142* FLL -0.064 -0.051 0.014 -0.024 -0.052 -0.033 -0.015 -0.069 -0.064 0.200** FLW -0.041 0.028 -0.057 0.108 0.118 0.038 0.172* 0.121 0.025 0.133 DTF 1 0.373** 0.574** -0.1 0.003 -0.062 -0.147* -0.039 -0.065 0.078 DTFH 1 0.345** 0.737** 0.765** 0.686** 0.702** 0.726** 0.658** 0.036 DTM 1 -0.012 0.074 0.073 -0.023 0.052 0.059 0.191** GB 1 0.771** 0.572** 0.949** 0.761** 0.566** 0.007 GL 1 0.893** 0.741** 0.939** 0.853** 0.087 GLBR 1 0.570** 0.846** 0.926** -0.008 KB 1 0.725** 0.514** 0.002 KL 1 0.897** 0.099 KLBR 1 0.027 GYP 1 *= significant at 0.05, **= significant at 0.01 HI=Harvest Index, GYP=grain yield/plant, DTF= days to 50%flowering, DTM =days to maturity, FLL=flag leaf length, FLW=flag leaf width, PH= plant height, PL=panicle length, NETH= no. of effective tillers/plant, TNGP= total no. of grain /panicle, SF spikelet fertility, TW=test weight, TNFGP=total number of filled grains/panicle, DTFH=date of first heading, GB=grain breadth, GL= grain length, GLGR=grain length breadth ratio, KB=kernel breadth, KL=kernel length, KLBR= kernel length breadth ratio. Table 2: Path Coefficients Showing Direct and Indirect Effects of Different Characters on Grain Yield Per Plant Characters TNFGP TNGP SF PH NETH PL HI TW FLL FLW TNFGP -1.45 1.68 0.07 0.02 0.01 0.02 0.03 0.01 0.01 0.01 TNGP -1.38 1.77 -0.06 0.01 0.00 0.02 0.01 0.01 0.01 0.01 SF -0.24 -0.24 0.42 0.03 0.04 0.00 0.08 0.00 0.00 0.00 PH -0.14 0.11 0.06 0.21 -0.03 0.03 -0.05 -0.02 0.02 0.01 NETH -0.04 -0.01 0.04 -0.02 0.38 -0.01 0.01 0.02 0.01 0.00 PL -0.31 0.38 0.01 0.07 -0.05 0.08 -0.04 0.00 0.01 0.00 HI -0.11 0.03 0.08 -0.03 0.01 -0.01 0.43 0.00 0.00 0.00 TW 0.12 -0.16 0.02 0.06 -0.11 0.00 0.03 -0.07 -0.01 0.02 FLL -0.20 0.25 -0.01 0.04 0.06 0.00 0.01 0.00 0.10 -0.01 FLW -0.17 0.17 0.02 0.02 -0.02 0.00 0.00 -0.02 -0.01 0.08 DTF -0.09 0.22 -0.09 0.05 -0.03 0.01 -0.09 -0.02 -0.01 0.00 DTFH -0.11 0.22 -0.07 0.05 -0.04 0.01 -0.06 -0.02 -0.01 0.00 DTM -0.30 0.45 -0.05 0.02 0.02 -0.01 -0.05 0.00 0.00 -0.01 GB -0.02 0.10 -0.05 0.00 -0.11 0.00 -0.03 -0.04 0.00 0.01 GL 0.29 -0.38 0.02 0.07 -0.03 0.01 0.02 -0.04 -0.01 0.01 GLBR 0.21 -0.32 0.05 0.04 0.06 0.01 0.02 0.01 0.00 0.00 KB -0.10 0.18 -0.04 -0.01 -0.13 0.00 -0.02 -0.04 0.00 0.02 KL 0.21 -0.24 0.00 0.05 -0.06 0.00 0.08 -0.03 -0.01 0.01 KLBR 0.20 -0.27 0.02 0.03 0.04 0.01 0.06 0.00 -0.01 0.00 Table 2: Continued Characters DTF DTFH DTM GB GL GLBR KB KL KLBR Correlation with GYP TNFGP 0.00 0.00 0.03 -0.01 -0.19 0.16 0.05 0.05 -0.10 0.344** TNGP -0.01 0.00 0.04 -0.04 -0.19 0.20 0.07 0.05 -0.12 0.336** SF 0.01 0.00 -0.02 0.09 0.04 -0.13 -0.07 0.00 0.04 -0.011
- 6. 542 Vipin Kumar Pandey & Sonali Kar Impact Factor (JCC): 5.9857 NAAS Rating: 4.13 Table 2: Contd., PH -0.01 0.01 0.01 -0.01 0.30 -0.20 -0.03 -0.08 0.11 0.257** NETH 0.00 0.00 0.01 0.22 -0.08 -0.17 -0.24 0.06 0.07 0.276** PL 0.00 0.00 -0.02 -0.01 0.09 -0.07 -0.03 -0.02 0.06 0.120 HI 0.01 0.00 -0.02 0.05 0.04 -0.06 -0.04 -0.07 0.11 0.297** TW -0.01 0.01 0.00 -0.48 0.53 0.12 0.42 -0.19 -0.03 0.142* FLL 0.00 0.00 0.00 0.01 -0.06 0.03 0.00 0.04 -0.06 0.200** FLW 0.00 0.00 -0.01 -0.14 0.14 0.05 0.17 -0.06 -0.04 0.133 DTF -0.06 0.02 0.10 -0.06 0.26 -0.12 0.01 -0.06 0.06 0.078 DTFH -0.05 0.02 0.09 -0.06 0.24 -0.11 0.00 -0.06 0.07 0.036 DTM -0.04 0.01 0.16 0.05 0.14 -0.18 -0.06 -0.04 0.09 0.191** GB 0.00 0.00 -0.01 -0.76 -0.05 0.85 0.65 0.02 -0.45 0.007 GL -0.02 0.01 0.02 0.04 0.91 -0.74 -0.09 -0.29 0.44 0.087 GLBR -0.01 0.00 0.02 0.58 0.61 -1.11 -0.53 -0.20 0.61 -0.008 KB 0.00 0.00 -0.01 -0.66 -0.11 0.79 0.75 0.05 -0.56 0.002 KL -0.01 0.00 0.02 0.04 0.71 -0.58 -0.10 -0.38 0.56 0.099 KLBR 0.00 0.00 0.02 0.46 0.53 -0.91 -0.56 -0.28 0.75 0.027 Note -: Residual factor =0.33271, Figures in bold are direct effects. **Significant at 1% level, * Significant at 5% level. HI=Harvest Index, GYP=grain yield/plant, DTF= days to 50%flowering, DTM =days to maturity, FLL=flag leaf length, FLW=flag leaf width, PH= plant height, PL=panicle length, NETH= no. of effective tillers/plant, TNGP= total no. of grain /panicle, SF spikelet fertility, TW=test weight, TNFGP=total no. of filled grains/panicle, DTFH=date of first heading, GB=grain breadth, GL= grain length, GLGR=grain length breadth ratio, KB=kernel breadth, KL=kernel length, KLBR= kernel length breadth ratio Table 3: Principal Component Analysis of 20 Agro-Morphological Traits for 97 Genotypes of Rice Traits Components PC1 PC2 PC3 PC4 PC5 PC6 PC7 TNFGP -0.056 0.209 0.473 -0.218 0.060 -0.326 -0.052 TNGP -0.083 0.228 0.455 -0.144 0.065 -0.261 -0.228 SF 0.085 -0.003 0.085 -0.202 0.161 -0.329 0.616 PH 0.191 0.240 0.058 -0.166 0.390 0.191 0.165 NETH 0.086 -0.110 0.264 -0.057 -0.339 0.403 0.370 PL 0.021 0.075 0.092 -0.120 0.605 0.254 -0.076 GYP 0.102 0.277 0.185 -0.354 -0.289 0.207 -0.005 HI 0.027 -0.013 -0.031 -0.383 -0.370 -0.035 -0.384 TW 0.009 0.402 -0.346 -0.134 0.001 0.015 0.041 FLL -0.042 -0.004 0.204 -0.128 0.056 0.612 -0.094 FLW -0.055 0.208 -0.100 -0.122 -0.252 0.016 0.420 DTF 0.124 0.369 0.082 0.423 -0.052 0.061 -0.018 DTFH 0.123 0.338 0.094 0.430 -0.030 0.085 -0.095 DTM 0.154 0.210 0.247 0.327 -0.198 -0.084 0.083 GB -0.319 0.311 -0.222 -0.053 0.027 0.065 -0.007 GL 0.342 0.182 -0.253 -0.082 0.015 -0.003 0.032 GLBR 0.446 -0.099 -0.042 -0.011 0.025 -0.057 0.002 KB -0.360 0.268 -0.199 -0.065 -0.028 -0.016 0.020 KL 0.342 0.190 -0.201 -0.187 -0.033 -0.087 -0.174 KLBR 0.451 -0.075 -0.043 -0.071 -0.003 -0.035 -0.116 Eigenvalue 4.151 3.295 2.502 2.037 1.433 1.165 1.097 Variability (%) 20.755 16.474 12.511 10.184 7.166 5.826 5.487 Cumulative % 20.755 37.230 49.741 59.925 67.090 72.916 78.403 Note: Values in bold represent highly weighted factors in respective PC.
- 7. Study of Morphological and Yield Atributing Characters in 543 Indigenous Rice (Oryza Sativa L.) of Bastar www.tjprc.org editor@tjprc.org HI=Harvest Index, GYP=grain yield/plant, DTF= days to 50%flowering, DTM =days to maturity, FLL=flag leaf length, FLW=flag leaf width, PH= plant height, PL=panicle length, NETH= no. of effective tillers/plant, TNGP= total no. of grain /panicle, SF spikelet fertility, TW=test weight, TNFGP=total no. of filled grains/panicle, DTFH=date of first heading, GB=grain breadth, GL= grain length, GLGR=grain length breadth ratio, KB=kernel breadth, KL=kernel length, KLBR= kernel length breadth ratio. Table 4: Distribution of 97 Rice Genotypes among Ten Clusters Clusters Number Number of Genotypes Genotypes Name I 2 Ragovati, CR40 II 5 Hiranbako, Alamdhan, Bhans path, Dogarkabri, Lalmakdo III 48 Band kari, Ram jeera, Bariadhan, Loktimachhi, Pat dhan, Sendursenga, Kadamphool, Sona sari, Cheptigurmutiya, Bhatamokdo, Narial, Kal tut masilo, Kari chudi, Bghalmijo, Bhukukuda, Kpoorsai, Baku dhan, Bhatadubraj, Sagipareta, Haldighati, Bode bargi, Koorlu mundi, Angadhan, Lankeshri, Rami gali, Bhatagadakhuta, Raikera, Pharsaphool, Godavari, Bhanvargedi, Dhabdadhan, Barangi, Goyadi, Aajandhan, Hisyadhan, Dokramecha, Barhasal, Kakdakdo, Bargidhan, Koosumjhopa, Bas koriya, Bhatakanai, Rang gadakhuta, Ghdvaphool, Mundrachudi, Gogalsathka, Laycha, Machhalipoti IV 2 Baktichudi, Hathipanjra V 10 Bans koria, Mayurfunda, Noni dhan, Kava padi, Kurlikabri, Altimijo, Masur lochia, Kala umari, Basomati, Kormel VI 22 Surmatia, Tikichudi, Anjani, Kukdamor, Koogdhan, Tama koni, Dumarphool, Mudria, Dumarphool, Karmaribhog, Kari gudi, Dogarkanri, Machidhan, Kura dhan, Ram bhog, Aasanchudi, Chagdikaj, Mankidhan, Bhaludubraj, Son pari, Godandi, Hare krishna VII 2 Bhasampatti, Ghaghardhan VIII 4 Kari khuji, Mehardhan, Mohadhan, MTU1010 IX 1 Tagandhan X 1 Danteshwari Table 5: Estimates of Intra (Diagonal and Bold) and Inter Cluster Distances among Ten Clusters Class I II III IV V VI VII VIII IX X I 21.80 83.19 100.92 156.55 63.88 140.87 67.22 175.36 103.22 101.50 II 21.84 34.51 88.44 46.73 67.95 58.95 100.23 81.94 59.18 III 24.82 60.86 47.01 41.39 63.41 81.95 73.16 69.84 IV 18.83 97.62 39.69 116.71 70.63 101.82 119.41 V 22.72 85.81 43.66 127.90 64.71 86.39 VI 24.60 93.79 46.98 90.47 87.01 VII 13.64 128.04 67.73 68.50 VIII 24.15 127.74 98.46 IX 0.00 111.34 X 0.00
- 8. 544 Vipin Kumar Pandey & Sonali Kar Impact Factor (JCC): 5.9857 NAAS Rating: 4.13 Figure 1: Dendogram Describing the Distribution of Genotypes Table 6: Heritability (H2 ), Geometric Mean (GM) and Genetic Advance (GA) as Percent of Mean Average and Critical Difference (CD) for Different Quality Characters Character CD 5% CD 1% GM h2 (%) GA as % of Mean GB 0.090 0.119 3.049 47.64016 13.93255 GL 0.073 0.097 8.673 93.95157 23.27602 GLBR 0.104 0.138 2.894 62.71525 26.58811 KB 0.077 0.102 2.538 47.52669 14.34164 KL 0.040 0.053 6.288 97.45606 28.16437 KLBR 0.091 0.121 2.526 68.66854 31.88559 GB=grain breadth, GL= grain length, GLGR=grain length breadth ratio, KB=kernel breadth, KL=kernel length, KLBR= kernel length breadth ratio.
- 9. Study of Morphological and Yield Atributing Characters in 545 Indigenous Rice (Oryza Sativa L.) of Bastar www.tjprc.org editor@tjprc.org CONCLUSIONS The above mentioned characters, showing high estimate of genetic advance as percent of mean are governed by additive genes, and selection for them will be rewarded. The rice accession used in the study revealed significant variability for most of the morphological traits. Amongst the genotypes studied, high coefficients of variation were observed for most of the characters studied, indicating the existence of sufficient variability. The desirable traits from these hopeful sources can be merged into elite entries with higher yield potential or exploited for advanced genetic analysis studies. Correlation studies revealed that selection criteria based on correlation analysis revealed positive and highly significant correlation of grain yield per plant with total number of filled grains per panicle, total number of grains per panicle, plant height and number of effective tiller per plant, harvest index, test weight, flag leaf length and days to maturity would be quite useful for further improvement. Therefore, it can be concluded that the direct selection for characters viz. flag leaf length, days to maturity, plant height, number of effective tillers per plant, harvest index, and total number of grains per panicle will be very effective for increasing the grain yield; hence they should be given consideration in the selection criteria. Component matrix revealed that the PC1 was mostly related to quality characters while PC2, PC3, PC4, PC5, PC6 and PC7 mostly associated with yield related traits. So, a good breeding programme can be initiated by selecting the genotypes from PC1 for quality aspect and for yield related traits genotypes from PC2, PC3, PC4, PC5 and PC6 can be selected. Cluster analysis divided the 97 genotypes of rice into ten clusters. The cluster III constituted of 48 genotypes, forming the largest cluster. Considering the importance of genetic distance and relative contribution of characters towards total divergence, the present study indicated that parental lines selected from cluster I (Ragovati, CR40) for total number of filled grains per panicle, total number of grains per panicle, number of effective tiller per plant, grain yield per plant and flag leaf length while cluster IV (Baktichudi, Hathipanjra) contained for spikelet fertility, plant height, panicle length, test weight, flag leaf width, grain length, and kernel length while cluster VII (Bhasampatti, Ghaghardhan) for grain breadth and kernel breadth. Cluster IX (Tagandhan) had for days to 50 % flowering, days to first heading, and days to maturity whereas, cluster X (Danteshwari) had for harvest index, grain length breadth ratio, and kernel length breadth ratio could be used in crossing programmes to achieve desired segregants. ACKNOWLEDGEMENTS The author is thankful to the Department of Genetics and Plant Breeding S G College of Agriculture and Research Station Kumhrawand, Jagdalpur, (C.G.) IGKV. REFERENCES 1. Ahmed, M.S.U., Bashar, M.K., Wazuddin, M. and Shamsuddin, A.K.M. 2016. Agro-Morphological Qualitative Characterization of Jesso-Balam Rice (Oryza sativa L.) Accessions in Bangladesh. Int. J. Agro. Agri. Rec., 8(1): 50-58. 2. Badri, J., Rajkumar, A., Bhadana, V.P., Priyanka, C., Ansari, N.A., Dey, S. and Chary, S. 2015.Genetic Divergence Studies for Yield and its Components in Rice.J. of Rice Res., 8(1): 33-40. 3. Baloch, A.W., Baloch, M., Baloch, R., Kandhro, M.N., Odhano, I.A., Bughio, H.R., Gandahi, N., Baloch, A.M. and Rajput, A.S. 2016.Evaluation of Genetic Diversity in Rice (Oryza sativa L.)Genotypes. Sindh Univ. Res. J., 48(1): 29-32. 4. Banumathy, S., Manimaran, R., Sheeba, A., Manivannan,, N., Ramya, B., Kumar, D. and Ramasubramanian, G.V. 2010. Genetic diversity analysis of rice germplasm lines for yield attributing traits. Electronic J of Plant Breeding, 1(4): 500-504. 5. Beevi, A.H. and Venkatesan, M. 2015. Genetic divergence studies in rice genotypes under saline condition. Int. J. of Current
- 10. 546 Vipin Kumar Pandey & Sonali Kar Impact Factor (JCC): 5.9857 NAAS Rating: 4.13 Adv. Res., 4(1): 6-8. 6. Brejda, J.J., Moorman, T.B., Karlen, D.L. and Dao, T.H. 2000.Identification of regional soil quality factors and indicators. I. Central and Southern High Plains. Soil Sci. Soci. of America J., 64: 2115–2124. 7. Chanbeni, Y.O., Lal, G.M. and Rai, P.K. 2012.Studies on genetic diversity in Rice (Oryza sativa L.).J. of Agric. Tech., 8(3): 1059- 1065. 8. Das, G.K. and Oudhia, P. 2001. Rice as Medicinal Plant in Chhattisgarh (India): A Survey. Agric. Sci. Digest, 21(3): 204-205. 9. Gupta, R., Tetwar, S. and Nair, S.K. 2014.Agro-morphological characterization of rice germplasm of Chhattisgarh. Int. J. Plant Sci., 9(2): 257-262. 10. Haque, S., Pradhan, S.K., Anandan and A., Singh, O. N. 2014. Morphometric Diversity Studies in Rice Genotypes for Yield and Yield Attributing Characters under Drought.The Int. J. of Sci. and Tech., 2(8): 139-142. 11. Kumar, V., Rastogi, N.K., Sarawgi, A.K., Chandraker, P., Singh, P.K. and Jena., B.K. 2016. Agro-Morphological and Quality Characterization of Indigenous and Exotic Aromatic Rice (Oryza sativa L.)Germplasm. J. App. Nat. Sci., 8(1): 314 – 320. 12. Musyoki, M.A., Kioko, F.W., Daniel, A., Wavinya, D.N and Felix, M. 2015. Phenotypic Diversity Studies on Selected Kenyan and Tanzanian Rice (Oryza sativa L.) Genotypes Based on Grain and Kernel Traits. J Rice Res., 3(4): 2375-4338. 13. Nachimuthu, V.V., Robin, S., Sudhakar, D., Rajeshwari, S., Raveendran, S., Subramanian, K.S., Tannidi, S. and Pandian, B.A. 2014. Genotypic variation for micronutrient content in traditional and improved rice lines and its role in biofortification programme. Ind. J. of Sci. and Tech., 7(9): 1414-1425. 14. Panigrahi, P., Sao, A. and Singh, P. (2016).Genetic divergence study in traditional local landraces of rice (Oryza sativa L.) predominant in Bastar Plateau Zone of Chhattisgarh. Adv. Res. J. Crop Improv., 7 (2):192-196. 15. Parikh, M., Motiramani, N.K., Rastogi, N.K. and Sharma, B. 2012.Agro-Morphological characterization and assessment of variability in aromatic rice germplasm.Bangladesh J. Agril. Res. 37(1): 1-8. 16. Prasad, S.G., Radha Krishna, K.V., SubbaRao, L.V. and Chaithanya, U. 2013. Quantitative analysis of rice genotypes (Oryza sativa L.).Int. J. of Innovative Res. and Development., 2(9): 14- 17. 17. Rao, S.L.V., Shiva Prasad, G., Chiranjivi, M., Chaitanya, U. And Surender, R. 2013. DUS characterization for farmer varieties of rice. IOSR Journal of Agriculture and Veterinary Science, 4(5): 35-43. 18. Sarawgi, A.K., Parikh, M., Sharma, B. and Sharma, D. 2014.Phenotypic divergence for agro-morphological traits among dwarf and medium duration rice germplasms and interrelationships between their quantitative traits.The Bioscan, 9 (4): 1677- 1681. 19. Singh, B., Mishra, M.K. and Naik, R.K. 2010.Genetic diversity among some traditional aromatic rice (Oryza sativa L.) varieties of Orissa.Ind. J. Agric. Res., 44 (2):141-145. 20. Sinha, A.K. and Mishra, P.K. 2013. Morphology based multivariate analysis of phenotypic diversity of landraces of rice of Bankura district of West Bengal. J. of Crop and Weed, 9(2): 115-121. 21. Subudhi, H.N., Samantarays, S., Swain, D. and Singh, O.N. 2012. Collection and agro-morphological characterization of aromatic short grain rice in eastern India. Afr. J of Agric. Res., 7(36): 5060- 5068.