Download to read offline
![International Research Journal of Engineering and Technology (IRJET) e-ISSN: 2395-0056
Volume: 07 Issue: 03 | Mar 2020 www.irjet.net p-ISSN: 2395-0072
© 2020, IRJET | Impact Factor value: 7.34 | ISO 9001:2008 Certified Journal | Page 2530
Wind data Estimation of Kolhapur district using Improved Hybrid
Optimization by Genetic Algorithms(iHOGA) and NASA Prediction of
Worldwide Energy Resources (NASA Power)
Ms. Ketki Suryakant Deshmane1, Mr. Aditya Arvind Yadav2, Mr. Shrikant Madan Ingawale3, Mr.
Akshay Sanjay Kamble4.
1M. Tech (Energy Technology), School of Energy Studies, SPPU, Pune, India.
2,3,4
M. Tech (Energy Technology), Department of TechnologyShivaji University, Kolhapur, India.
---------------------------------------------------------------------***----------------------------------------------------------------------
Abstract - Improved hybrid optimization by genetic algorithms is a programme developed in C++ for Simulation and
optimization of hybrid renewable standalone energy system. The programme includes multi objective optimization in time
steps. NASA Prediction of worldwide energy resources is a collection of new data from satellite system NASA Power targets
three user communities 1. Renewable energy 2. Sustainable building 3. Agro climatology. The wind data estimated from
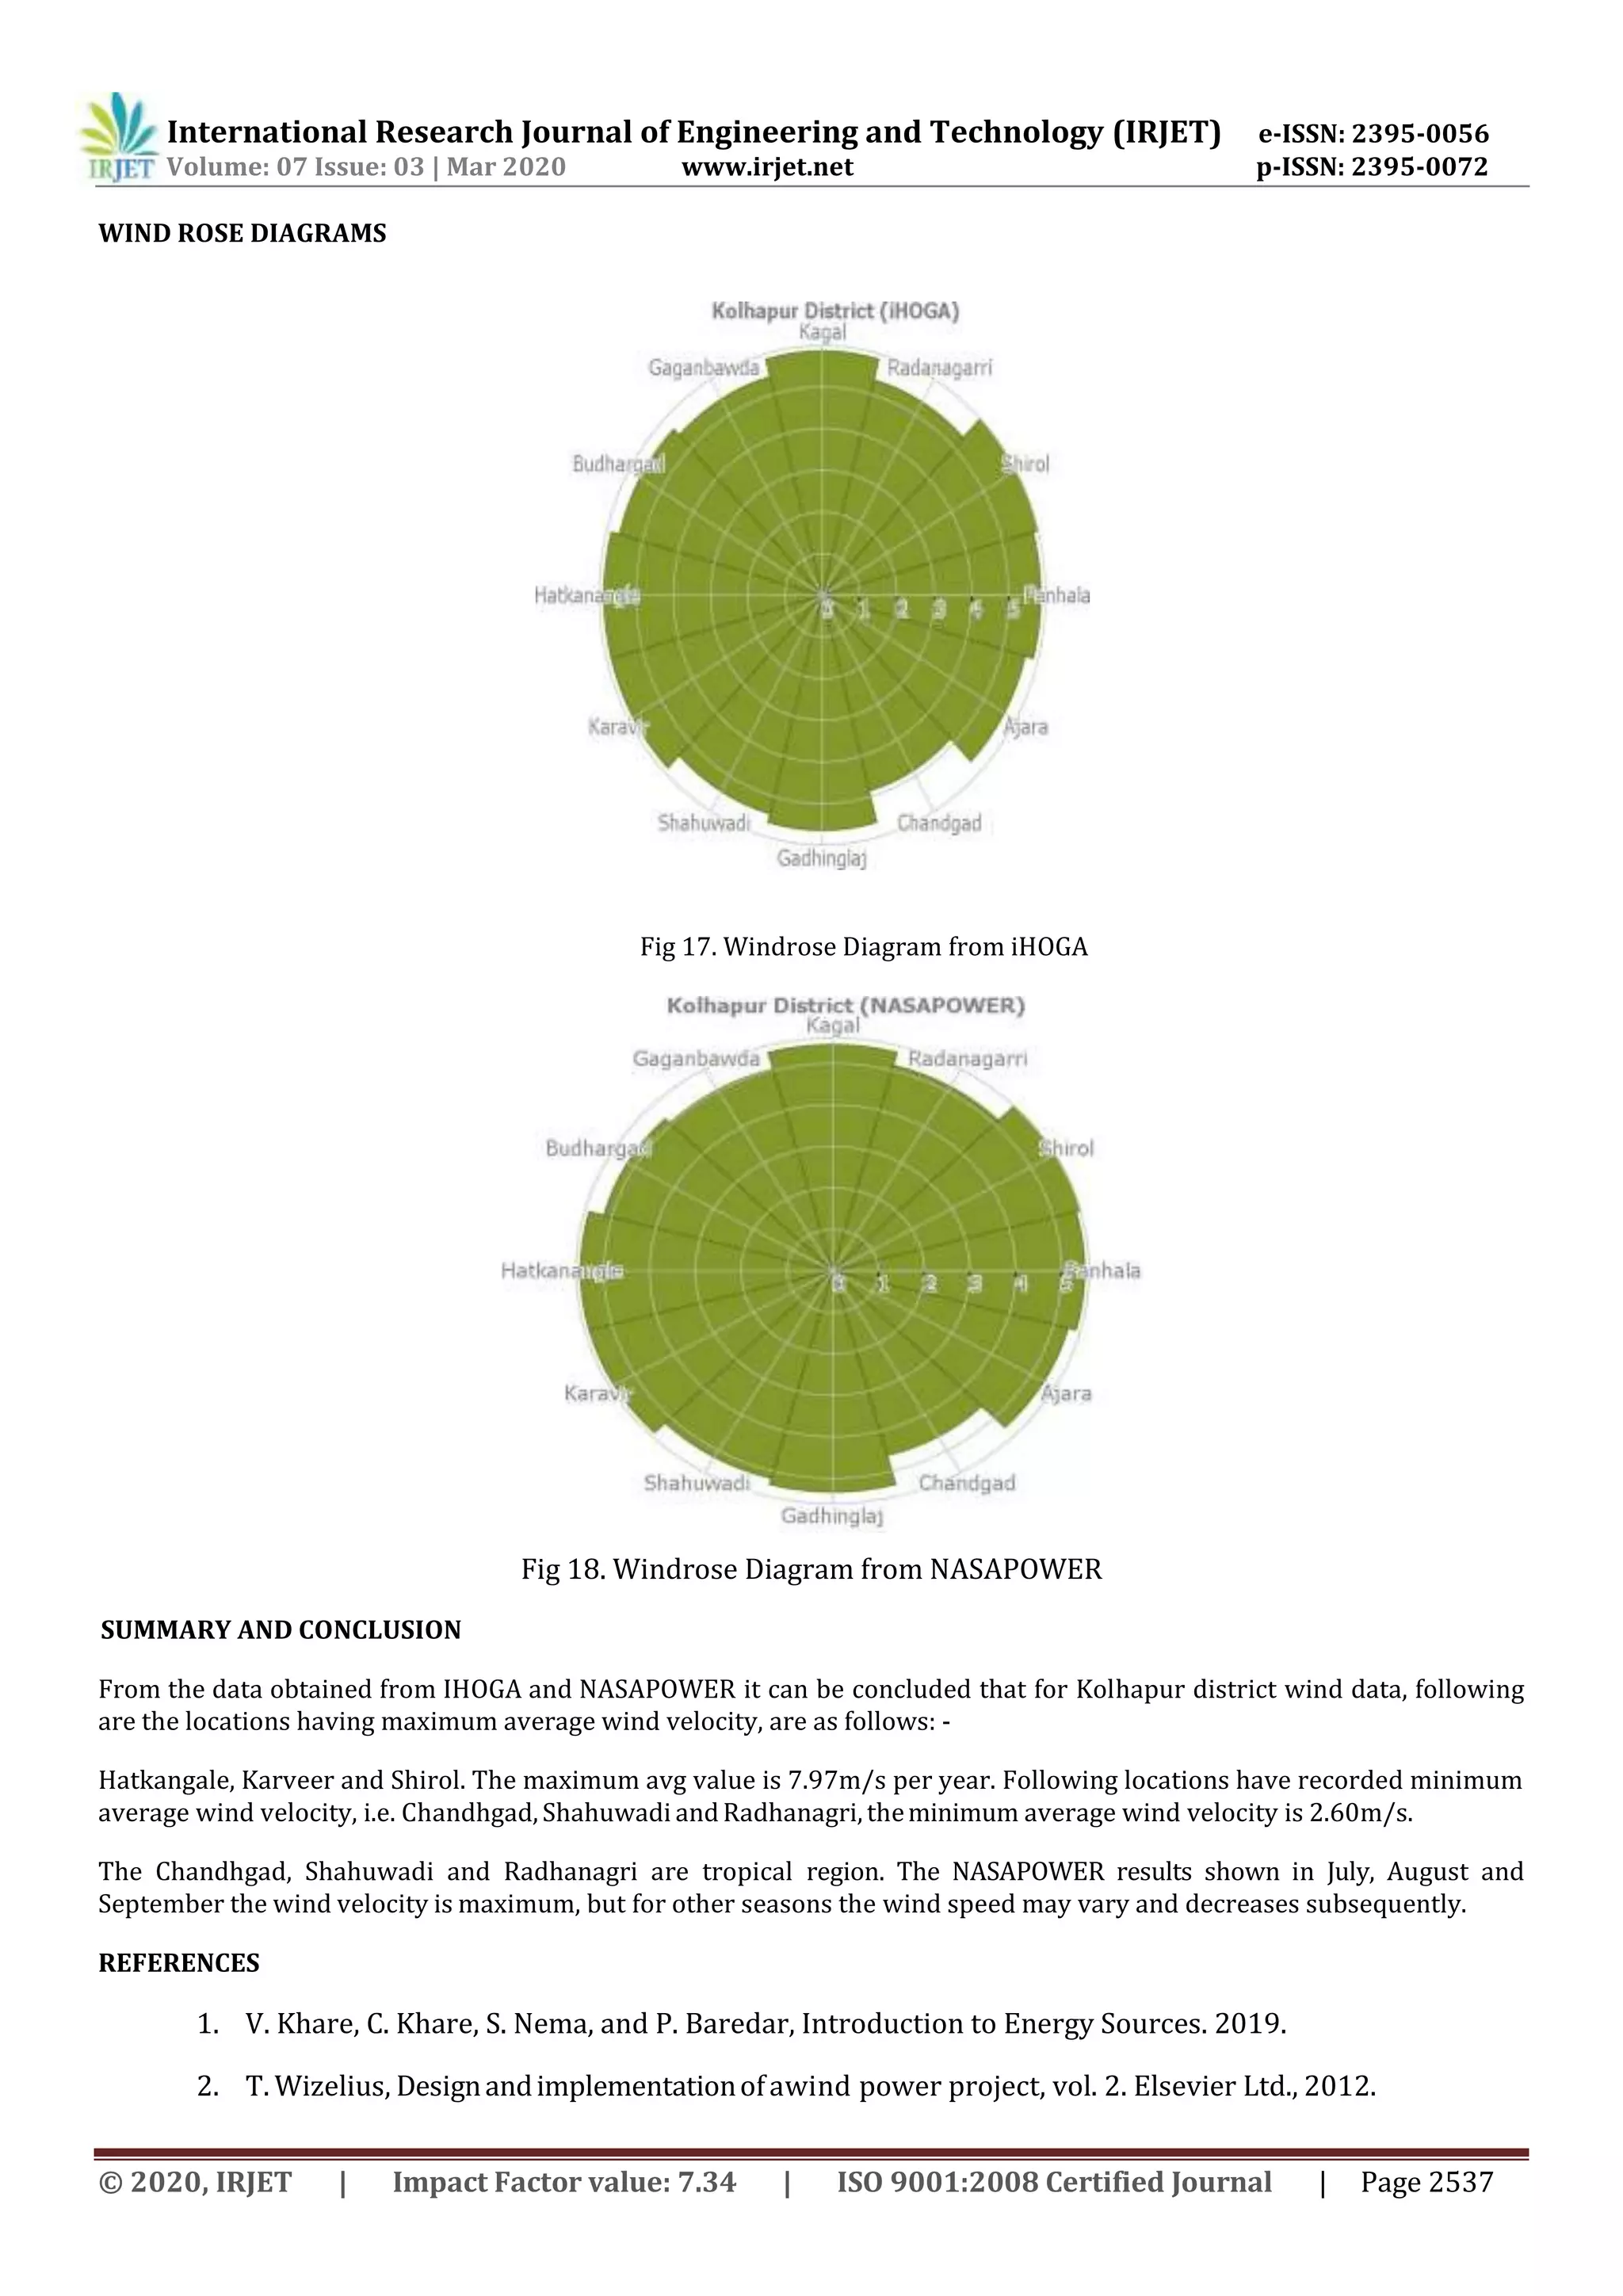
iHOGA and NASA Power will provide average wind speed data in m/sec.
Key Words: Wind data, NASA Power, iHOGA, C++.
INTRODUCTION
Wind is simply a form of moving air as well a part of the sun’s rays because, when the earth heats up from beam and diffuse
radiation, it releases wind. This is a balanced reaction between sun rays and wind to cool the earth. The moving air
inflates and easily reaches a maximum height then fresh and cool air falls down and moves as wind. Differential heating of
the ground surface by the sun causes the movement of large air masses. Such a type of air or wind is used for electricity
generation if the wind speed is between 5 and 25m/s. Electricity generation through wind is done by wind energy
conversion systems[1].
Wind energy conversion systems convert the kinetic energy of the wind into electricity or other forms of energy
Nowadays, wind power is a completely established and sustainable branch of electricity generation and it is worked
accordingly. The energy generation is not the only basis to be considered when installing new wind turbines. A wind
turbine is the main part of a wind energy system because a wind turbine detains the force of wind velocity with the help of
rotor blades. Rotor blades are used to accelerate wind flow over one side of the blade, which leads to a low-pressure
system at the given side. The rotor blades lift to the area of lower pressure just like an airplane wing, due to the difference
in pressure between the two sides of the blade. When the rotor is connected to a shaft, due to the rotation of the shaft, a
generator produces electrical energy.
WIND SPEED
As a general rule, wind speed will increase with height. How large this increase will be depends on the roughness of the
terrain. In areas with high roughness, the wind speed will increase more with height than over a smooth terrain. But the
wind speed at a specific height, for example, 50 m above ground level (agl), will always be higher in an area with low
roughness, if all other factors are equal. For wind turbines it is the wind speed at hub height that is of interest. This height
varies for different models and manufacturers. Available wind data often represent a different height than the hub height.
It is, however, not very difficult to recalculate these data for other heights.
If the average wind speed at a height (ho) is known and the wind speed at hub height (h) has to be found, the following
relation can be used
v/vo=[ h/ho]n
where vo is the known wind speed at the height ho and v is the wind speed at the height h. The value of the exponent α
depends on the roughness of the terrain and on general geographic conditions. These are based on the wind atlas for
Denmark. Roughness class 0 (open water): α = 0.1. Roughnessclass1(openplain):α
= 0.15.](https://image.slidesharecdn.com/irjet-v7i3502-201221025309/75/IRJET-Wind-Data-Estimation-of-Kolhapur-District-using-Improved-Hybrid-Optimization-by-Genetic-Algorithms-IHOGA-and-NASA-Prediction-of-Worldwide-Energy-Resources-NASA-Power-1-2048.jpg)
![International Research Journal of Engineering and Technology (IRJET) e-ISSN: 2395-0056
Volume: 07 Issue: 03 | Mar 2020 www.irjet.net p-ISSN: 2395-0072
© 2020, IRJET | Impact Factor value: 7.34 | ISO 9001:2008 Certified Journal | Page 2531
Fig 1. Wind Weibull Shape
FACTOR AFFECTING WIND SPEED
Wind speed is affected by a number of factors and situations, operating on varying scales (from micro to macro scales).
These include the pressure gradient, Rossby waves and jet streams, and local weather conditions. There are also links to
be found between wind speed and wind direction, notably with the pressure gradient and terrain conditions.
1. Pressure gradient: This term is used to describe the difference in air pressure between two points in the
atmosphere or on the surface of the Earth. It is vital to wind speed, because the greater the difference in pressure, the
faster the wind flows (from the high to low pressure) to balance out the variation. The pressure gradient, when
combined with the Coriolis effect and friction, also influences wind direction.
2. Rossby waves: Rossby waves are strong winds in the upper troposphere. These operate on a global scale and move
from West to East (hence being known as Westerlies). The Ross by waves are themselves a different wind speed from
what we experience in the lower troposphere.
3. Local weather conditions: It plays a key role in influencing wind speed, as the formation of hurricanes,
monsoons and cyclones as freak weather conditions can drastically affect the flow velocity of the wind.[2]
NASA POWER
NASA's goal in Earth science is to observe, understand, and model the Earth system to discover how it is changing, to better
predict change, and to understand the consequences for life on Earth. The Applied Sciences Program, within the Science
Mission Directorate (which replaced both the Office of Earth Science and the Office of Space Science, serves NASA and
Society by expanding and accelerating the realization of societal and economic benefits from Earth science, information,
and technology research and development.
The Prediction of Worldwide Energy Resource (POWER) project was initiated to improve upon the current renewable
energy data set and to create new data sets from new satellite systems. The POWER project targets three user
communities:
1. Renewable Energy: The Renewable Energy Archive is designed to provide access to parameters specifically
tailored to assist in the design of solar and wind powered renewable energy systems.
2. Sustainable Buildings: The Sustainable Buildings Archive is designed to provide industry- friendly parameters
for the buildings community, to include parameters in multi-year monthly averages.](https://image.slidesharecdn.com/irjet-v7i3502-201221025309/75/IRJET-Wind-Data-Estimation-of-Kolhapur-District-using-Improved-Hybrid-Optimization-by-Genetic-Algorithms-IHOGA-and-NASA-Prediction-of-Worldwide-Energy-Resources-NASA-Power-2-2048.jpg)
![International Research Journal of Engineering and Technology (IRJET) e-ISSN: 2395-0056
Volume: 07 Issue: 03 | Mar 2020 www.irjet.net p-ISSN: 2395-0072
© 2020, IRJET | Impact Factor value: 7.34 | ISO 9001:2008 Certified Journal | Page 2533
However, significant technological improvements have been achieved in the recent past, resulting in a reduction of the
investment costs for wind energy thereby improving the prospect of massive future investments. Based on future
projections, the contribution ofwindpowertothetotal globalelectricityproductioncouldreach18% by2050 .[4]
Fig4 .Global capacity windpower[4]
The wind power capacity shown in figure is not distributed evenly across the world. Asia has the largest regional capacity
with 228.5 GW which accounts for the 42.2% of the global capacity.
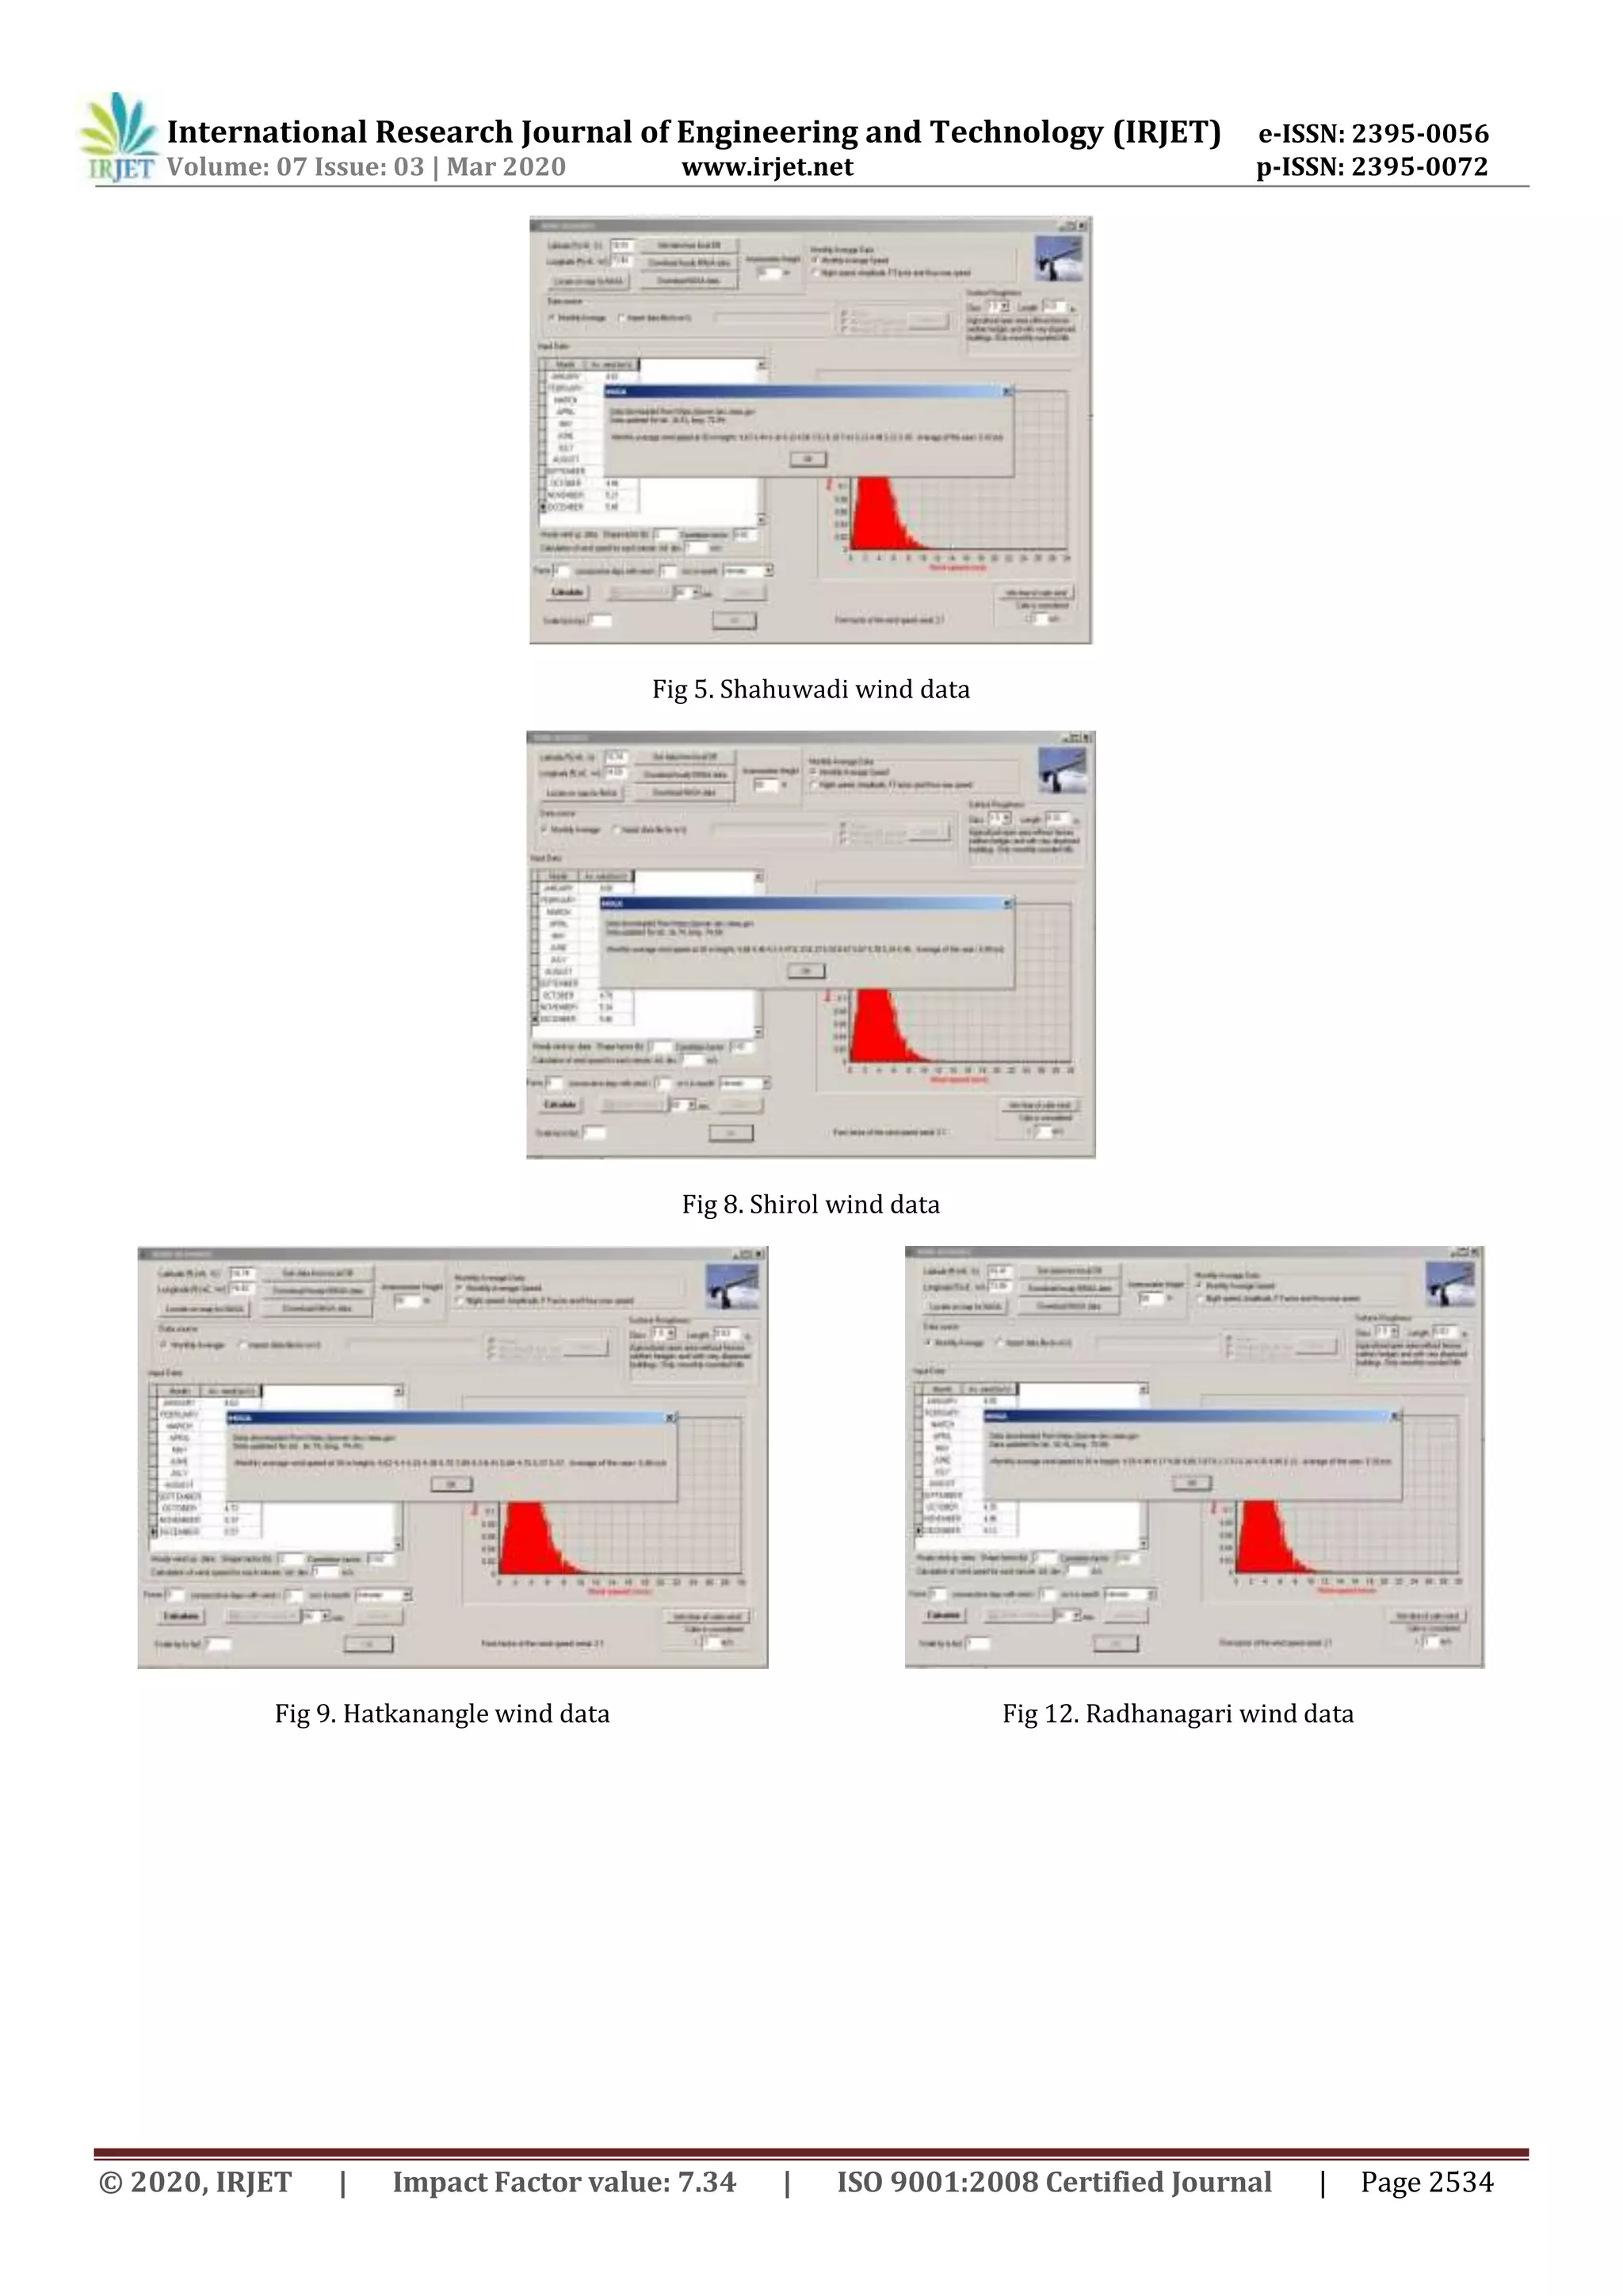
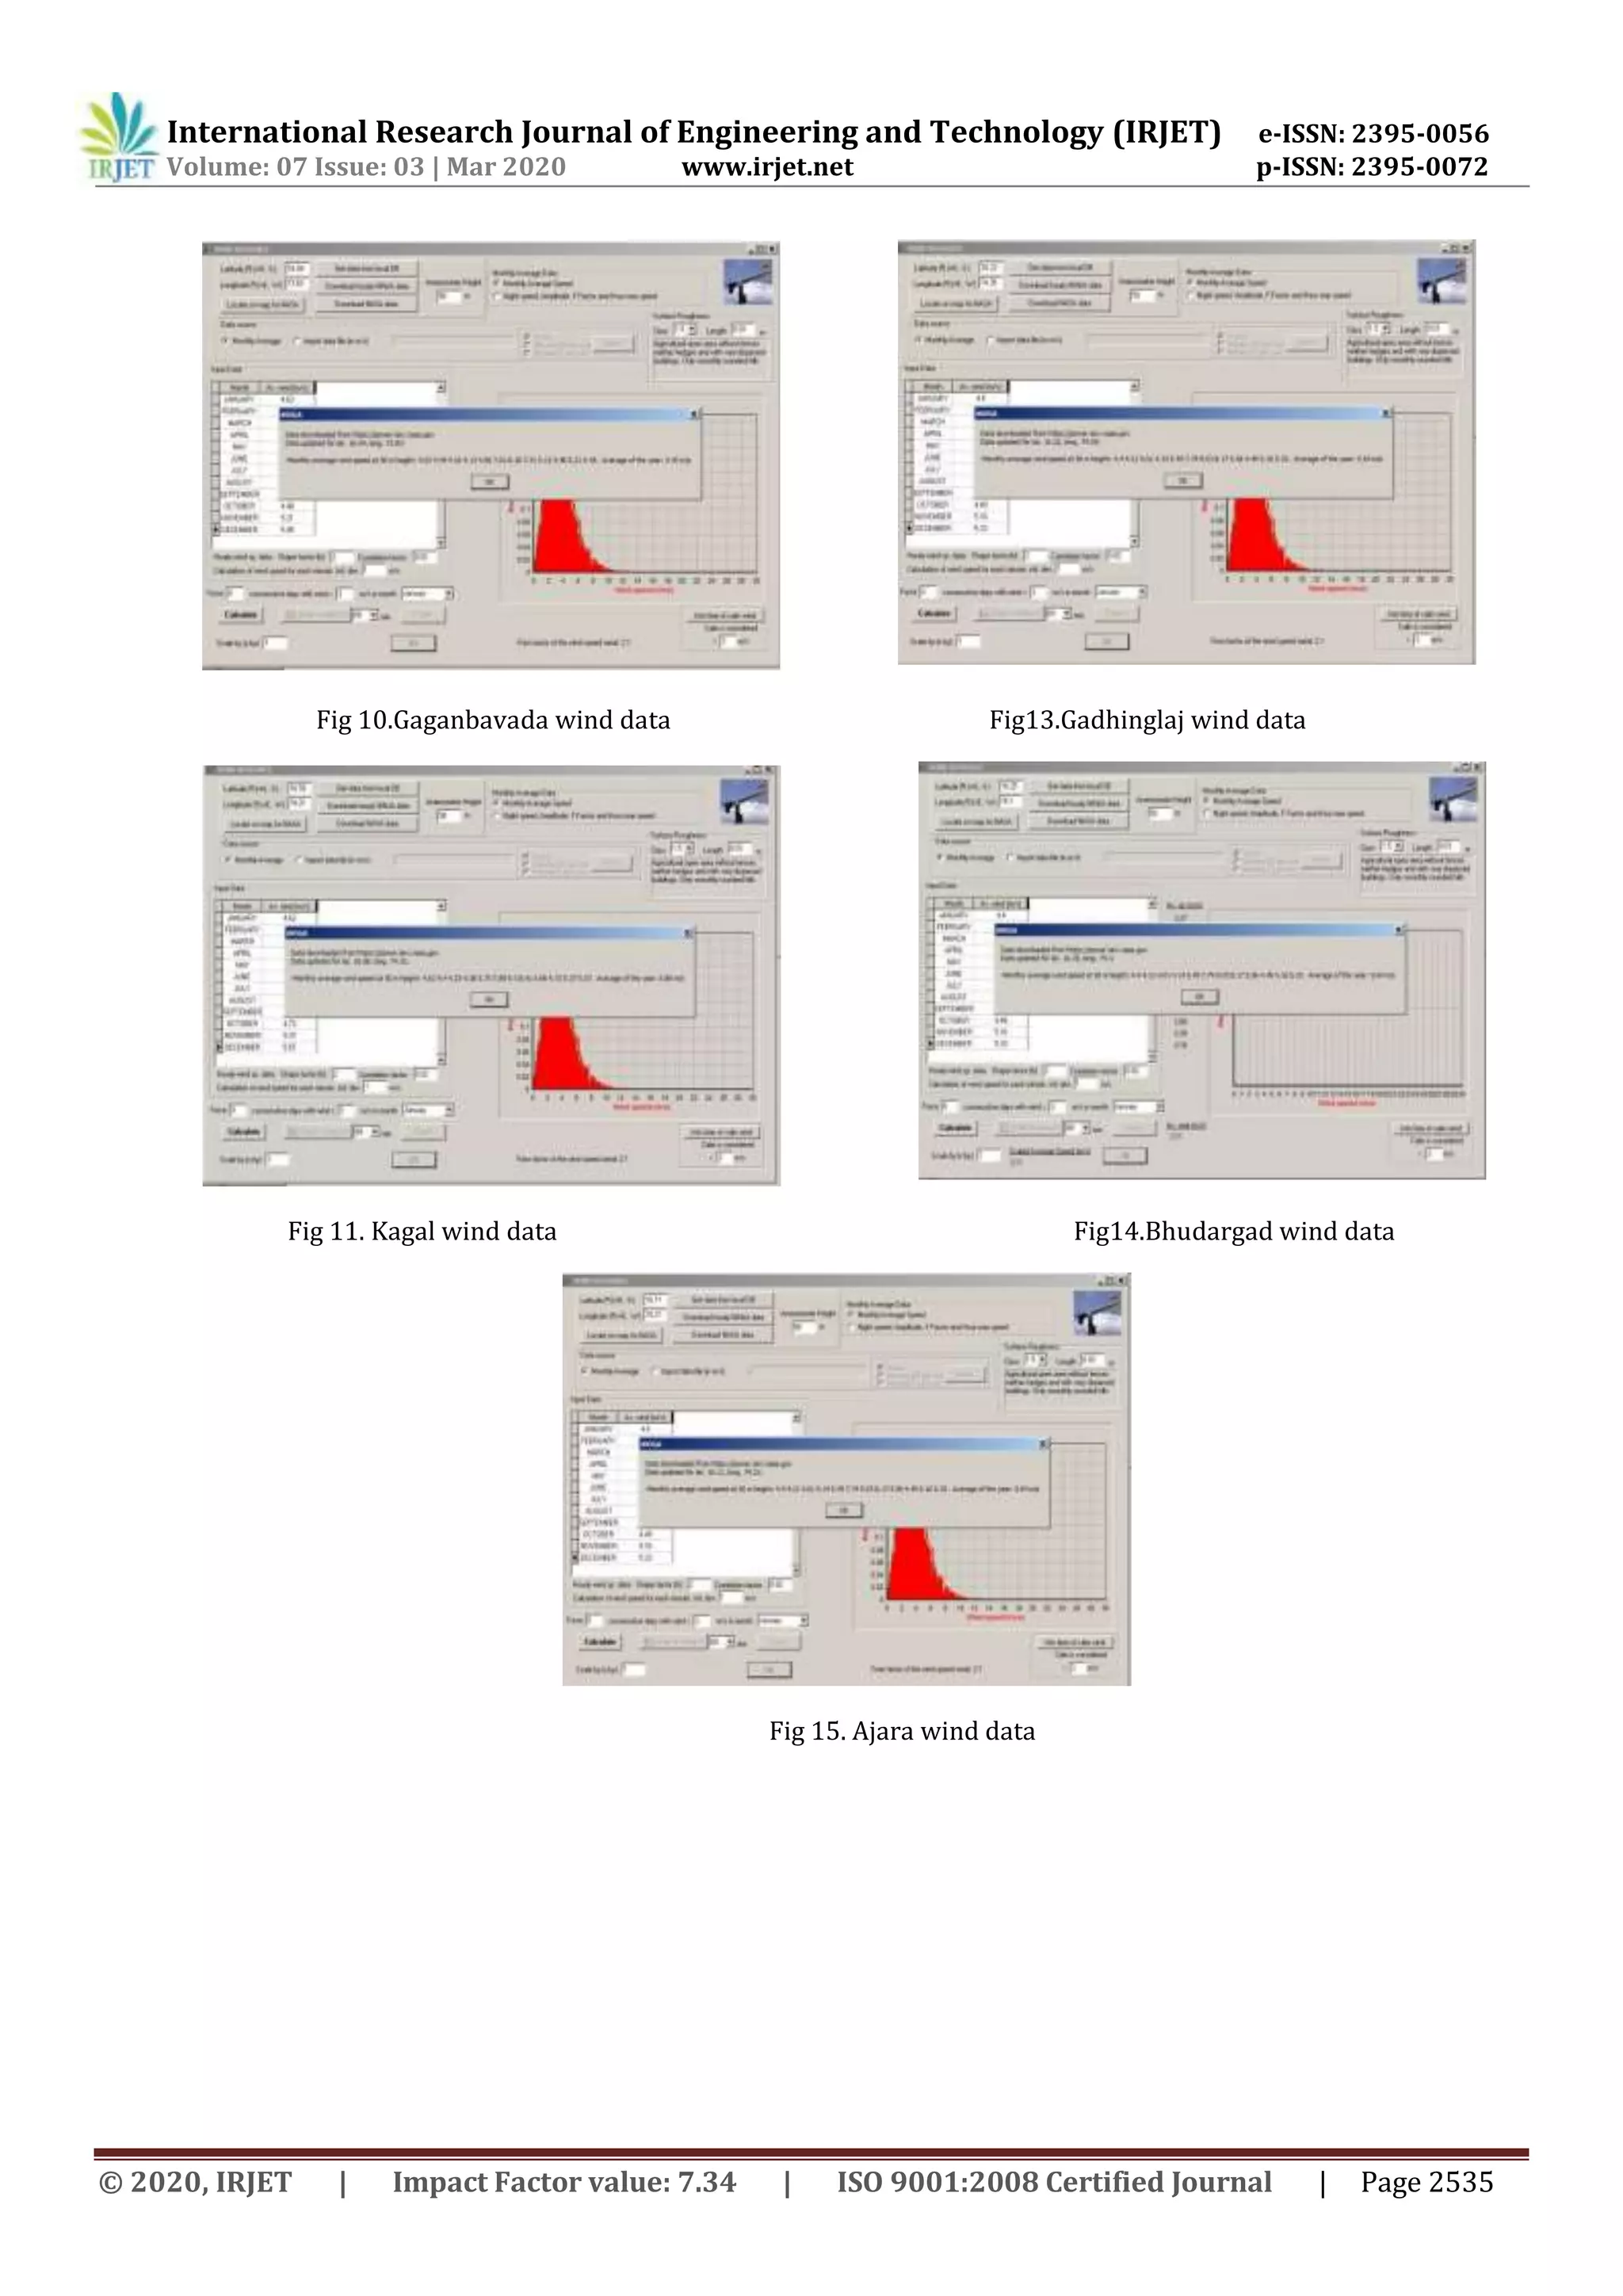
KOLHAPUR DISTRICT WIND DATA BY iHOGA SOFTWARE
Fig6. Panhala wind data
Fig 7. Karvir wind data](https://image.slidesharecdn.com/irjet-v7i3502-201221025309/75/IRJET-Wind-Data-Estimation-of-Kolhapur-District-using-Improved-Hybrid-Optimization-by-Genetic-Algorithms-IHOGA-and-NASA-Prediction-of-Worldwide-Energy-Resources-NASA-Power-4-2048.jpg)
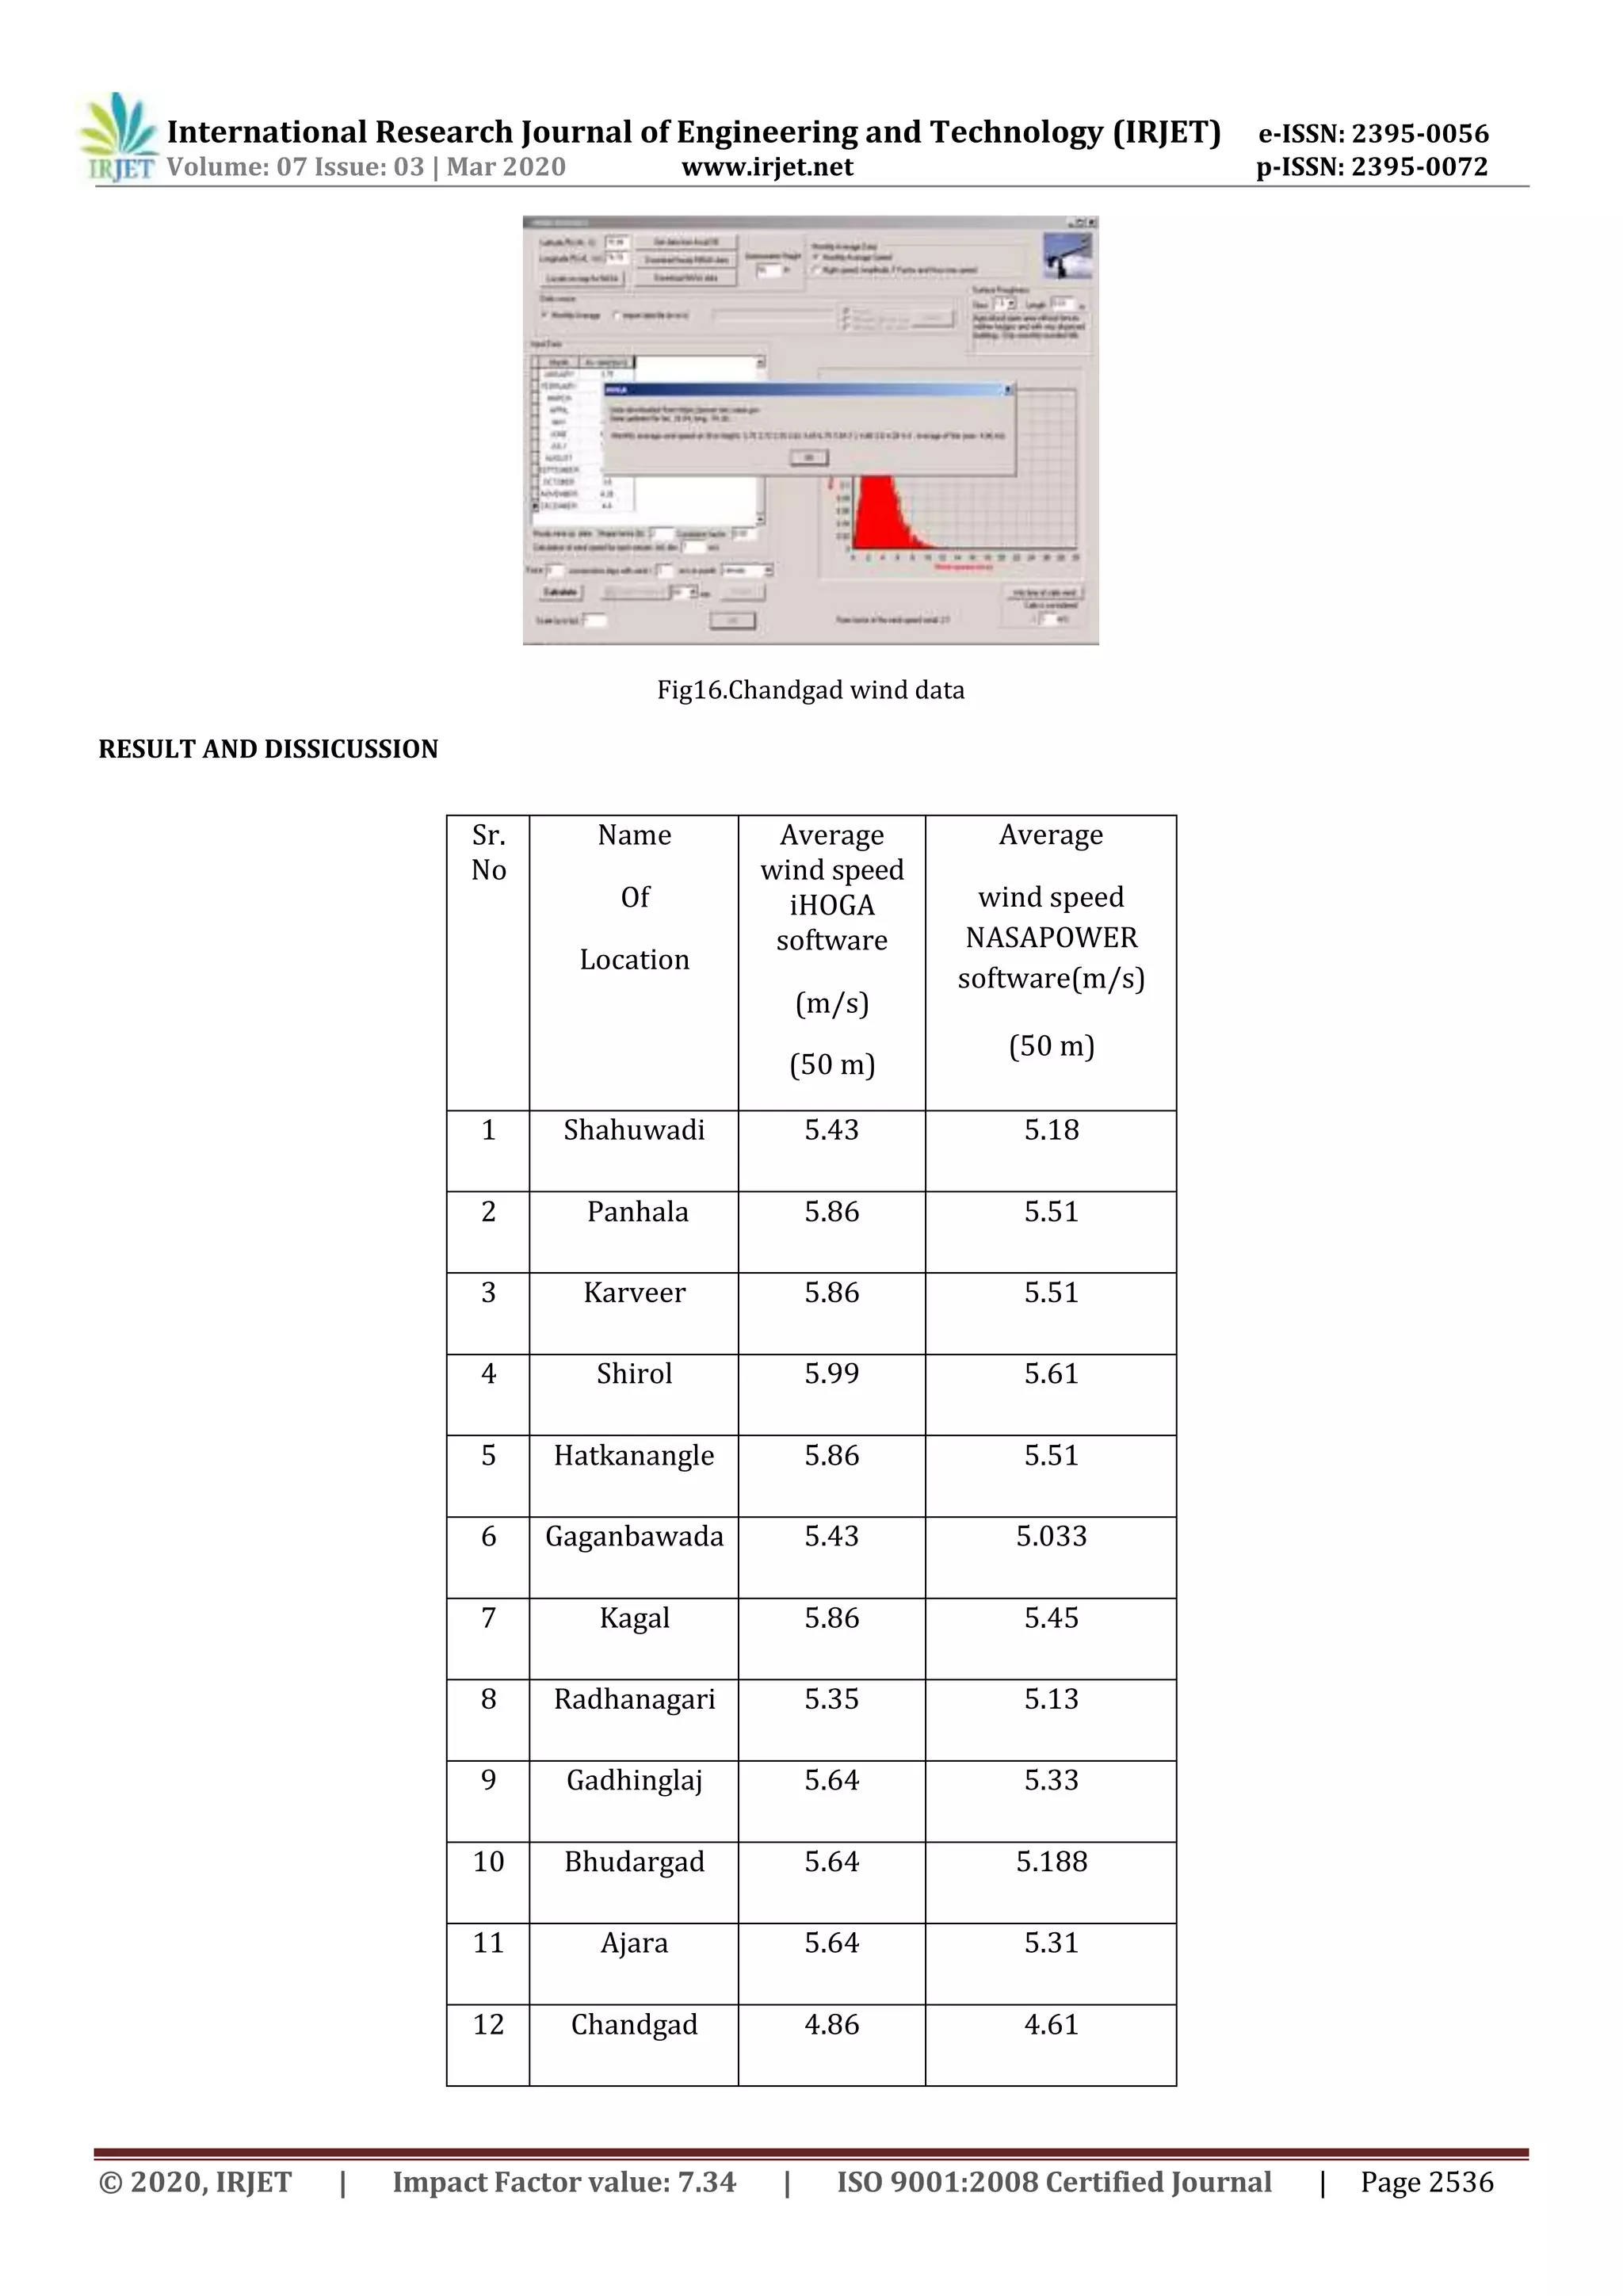


This document compares wind data for Kolhapur district in India obtained from the iHOGA and NASA POWER software programs. The iHOGA program was developed in C++ for optimizing hybrid renewable energy systems, while NASA POWER provides satellite-derived data on renewable resources. Both programs estimate the average wind speed at various locations in Kolhapur. The results show that locations like Hatkangale, Karveer and Shirol have the highest average wind speeds of around 5.5-6 m/s based on both models. Locations like Chandhgad, Shahuwadi and Radhanagari showed the lowest speeds of around 4.5-5 m/s. In general, the results from both


