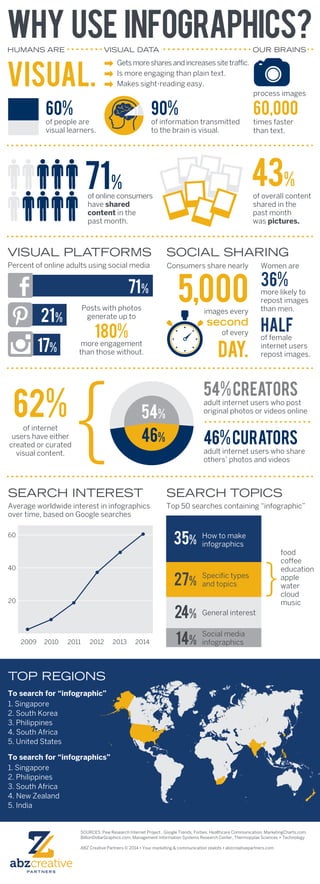
VISUAL.
WHY USe INFOGRAPHICS?HUMANS ARE VISUAL DATA OUR BRAINS
Getsmoresharesandincreasessitetraffic.
Is more engaging than plain text.
Makes sight-reading easy.
of online consumers
have shared
content in the
past month.
of overall content
shared in the
past month
was pictures.
Women are
36%
more likely to
repost images
than men.
Half
of female
internet users
repost images.
71% 43%
90%
of information transmitted
to the brain is visual.
60%
of people are
visual learners.
process images
60,000
times faster
than text.
SEARCH INTEREST
Average worldwide interest in infographics
over time, based on Google searches
SEARCH TOPICS
Top 50 searches containing “infographic”
54%CREATORs
adult internet users who post
original photos or videos online
46%Curators
adult internet users who share
others’ photos and videos
54%
46%
20
40
60
2009 2010 2011 2012 2013 2014
SOCIAL SHARING
62%of internet
users have either
created or curated
visual content.
{
}
Consumers share nearly
images every
of every
second
5,000
day.
VISUAL PLATFORMS
Percent of online adults using social media
71%
21%
17%
Posts with photos
generate up to
180%
more engagement
than those without.
TOP REGIONS
To search for “infographic”
1. Singapore
2. South Korea
3. Philippines
4. South Africa
5. United States
To search for “infographics”
1. Singapore
2. Philippines
3. South Africa
4. New Zealand
5. India
How to make
infographics
Specific types
and topics
Social media
infographics
General interest
35%
27%
24%
14%
food
coffee
education
apple
water
cloud
music
SOURCES: Pew Research Internet Project , Google Trends, Forbes, Healthcare Communication, MarketingCharts.com,
BillionDollarGraphics.com, Management Information Systems Research Center, Thermopylae Sciences + Technology
ABZ Creative Partners © 2014 • Your marketing & communication zealots • abzcreativepartners.com

Why Use Infographics?

  • 1.
    VISUAL. WHY USe INFOGRAPHICS?HUMANSARE VISUAL DATA OUR BRAINS Getsmoresharesandincreasessitetraffic. Is more engaging than plain text. Makes sight-reading easy. of online consumers have shared content in the past month. of overall content shared in the past month was pictures. Women are 36% more likely to repost images than men. Half of female internet users repost images. 71% 43% 90% of information transmitted to the brain is visual. 60% of people are visual learners. process images 60,000 times faster than text. SEARCH INTEREST Average worldwide interest in infographics over time, based on Google searches SEARCH TOPICS Top 50 searches containing “infographic” 54%CREATORs adult internet users who post original photos or videos online 46%Curators adult internet users who share others’ photos and videos 54% 46% 20 40 60 2009 2010 2011 2012 2013 2014 SOCIAL SHARING 62%of internet users have either created or curated visual content. { } Consumers share nearly images every of every second 5,000 day. VISUAL PLATFORMS Percent of online adults using social media 71% 21% 17% Posts with photos generate up to 180% more engagement than those without. TOP REGIONS To search for “infographic” 1. Singapore 2. South Korea 3. Philippines 4. South Africa 5. United States To search for “infographics” 1. Singapore 2. Philippines 3. South Africa 4. New Zealand 5. India How to make infographics Specific types and topics Social media infographics General interest 35% 27% 24% 14% food coffee education apple water cloud music SOURCES: Pew Research Internet Project , Google Trends, Forbes, Healthcare Communication, MarketingCharts.com, BillionDollarGraphics.com, Management Information Systems Research Center, Thermopylae Sciences + Technology ABZ Creative Partners © 2014 • Your marketing & communication zealots • abzcreativepartners.com