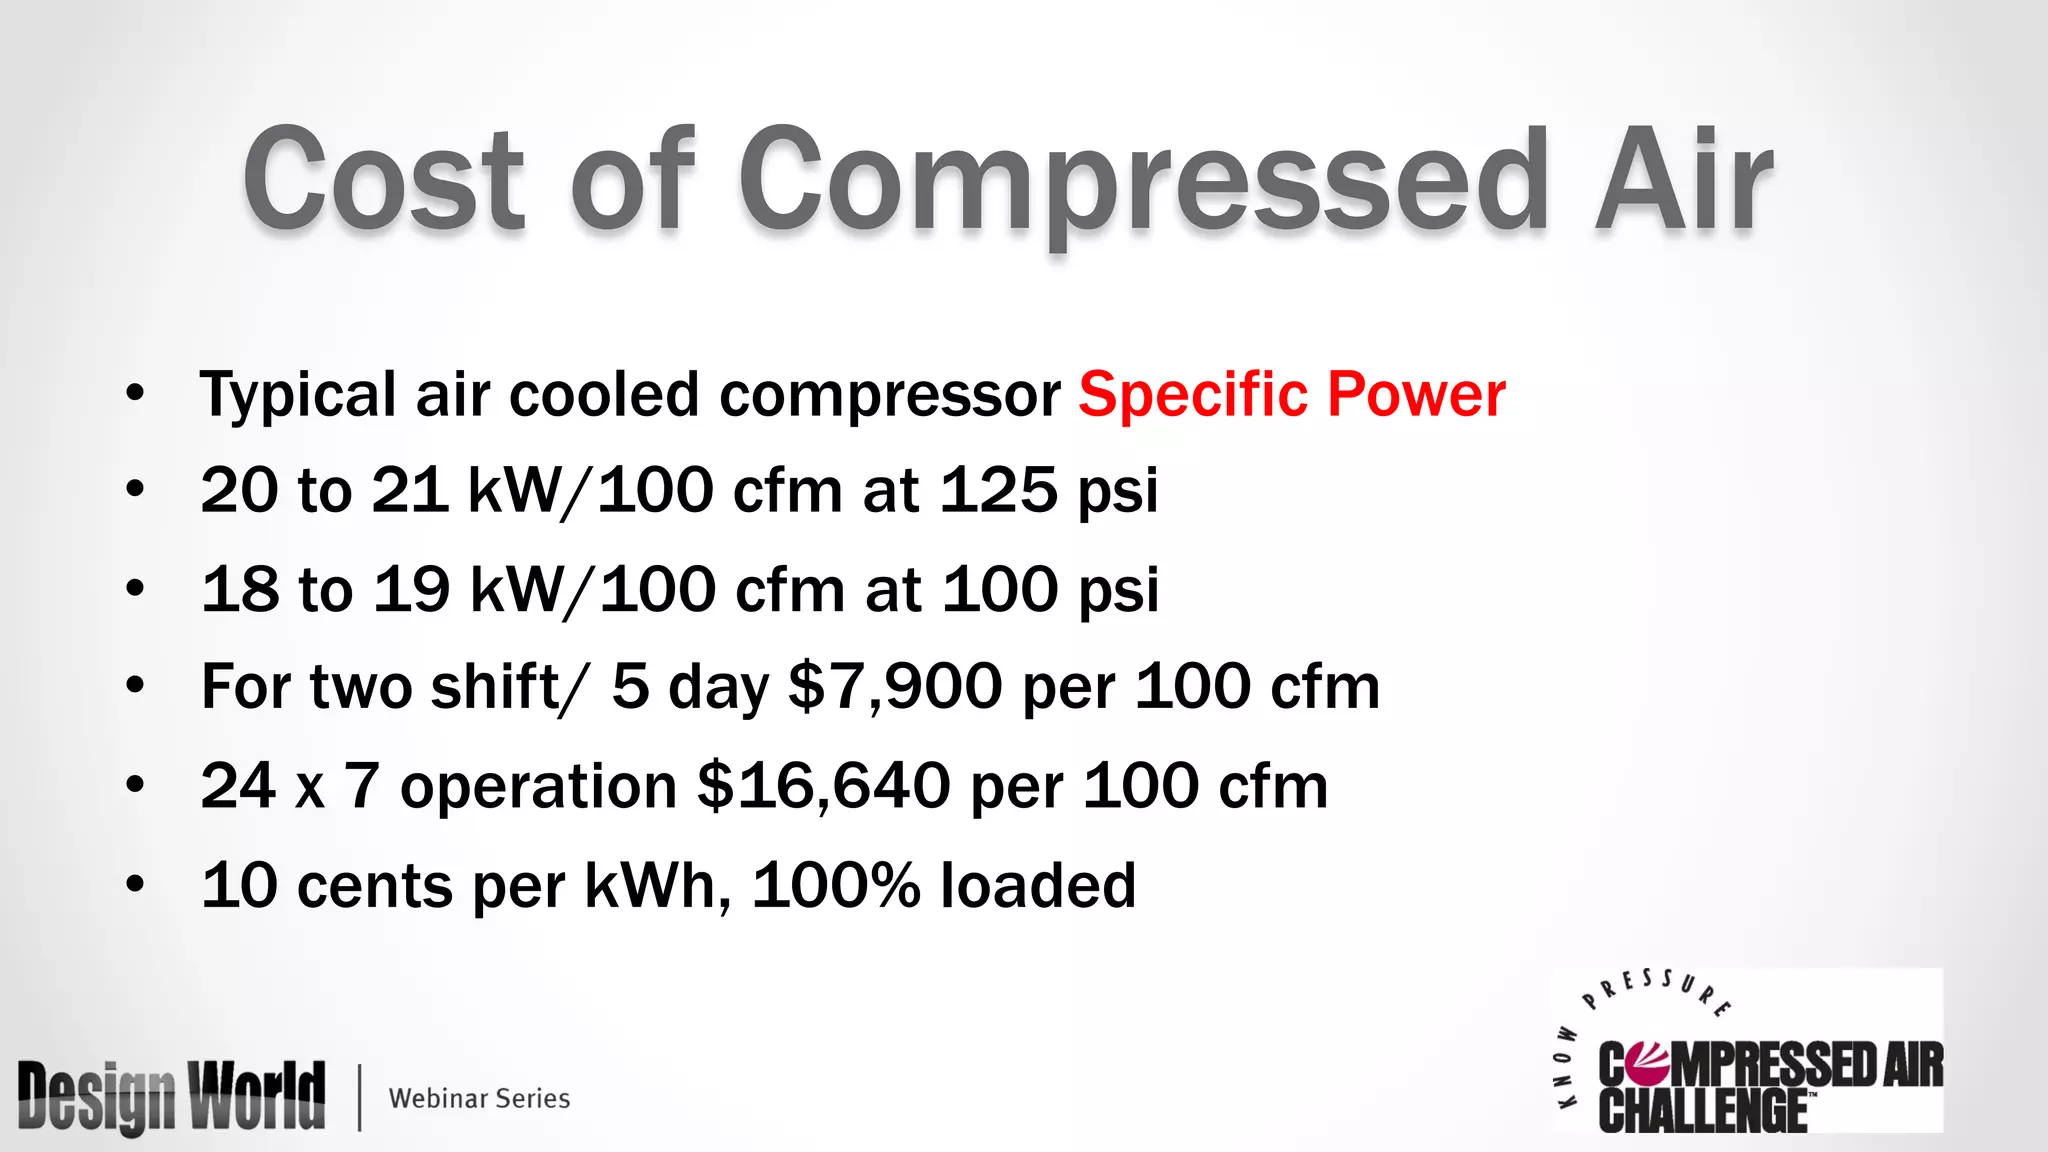
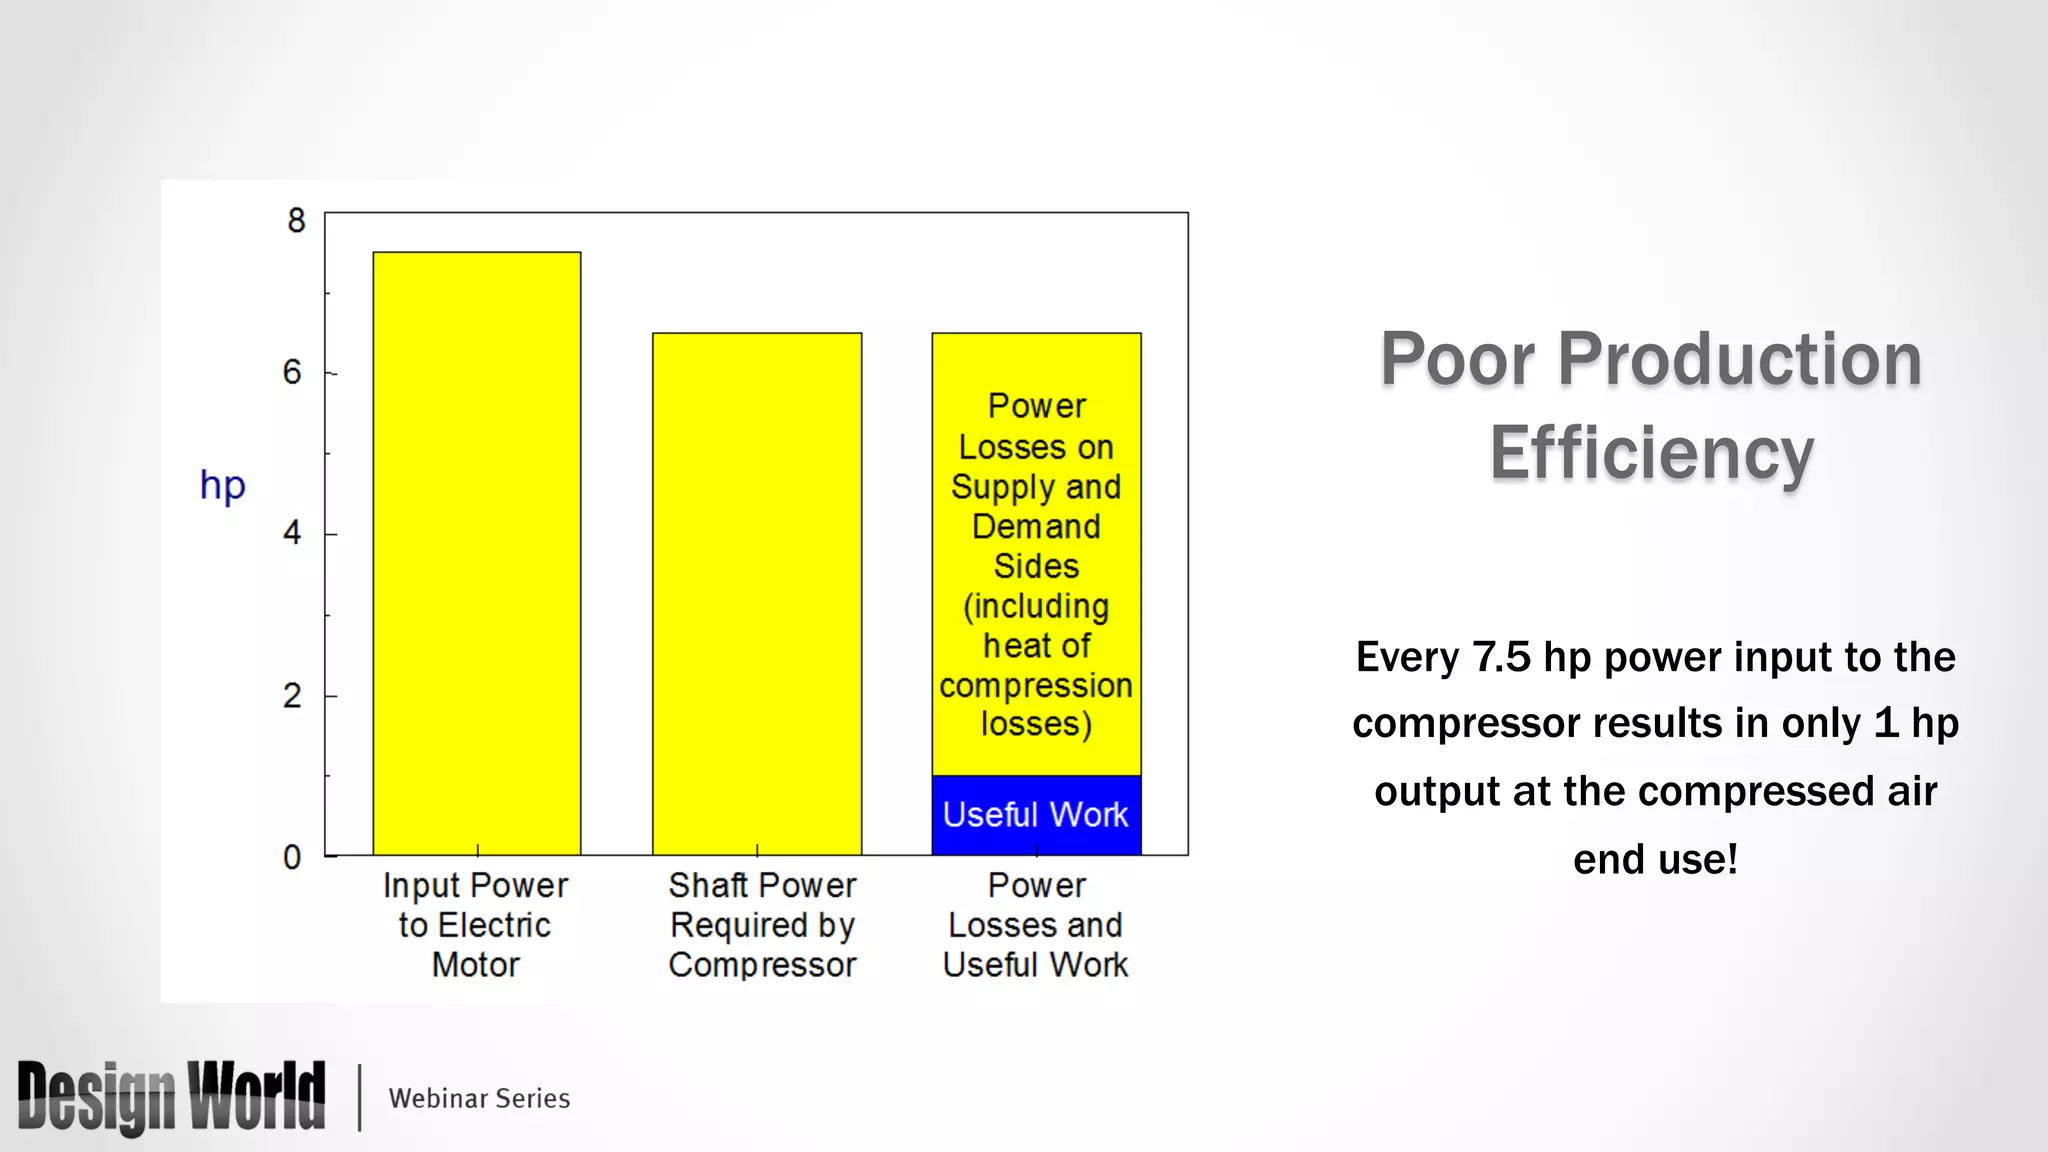
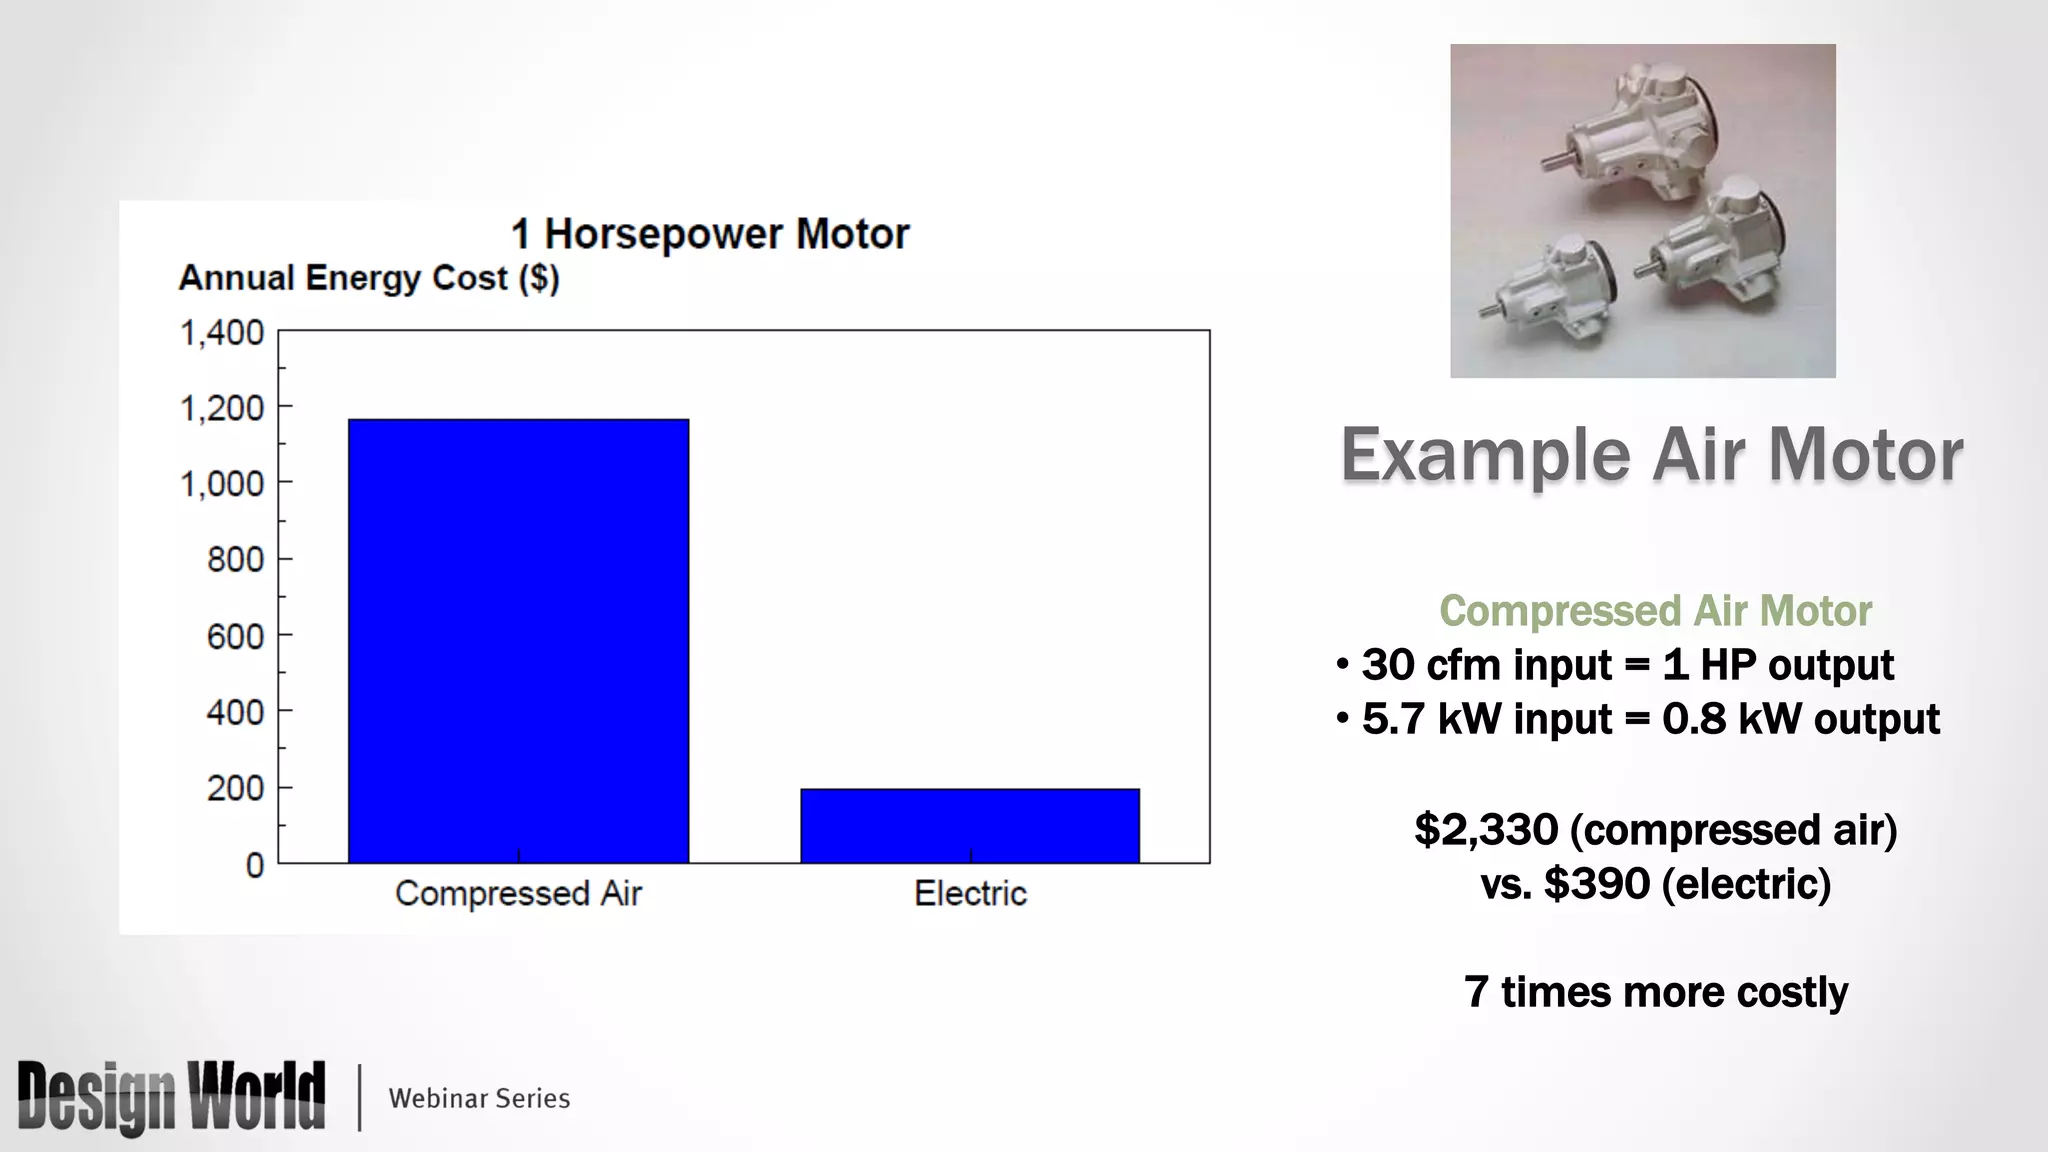
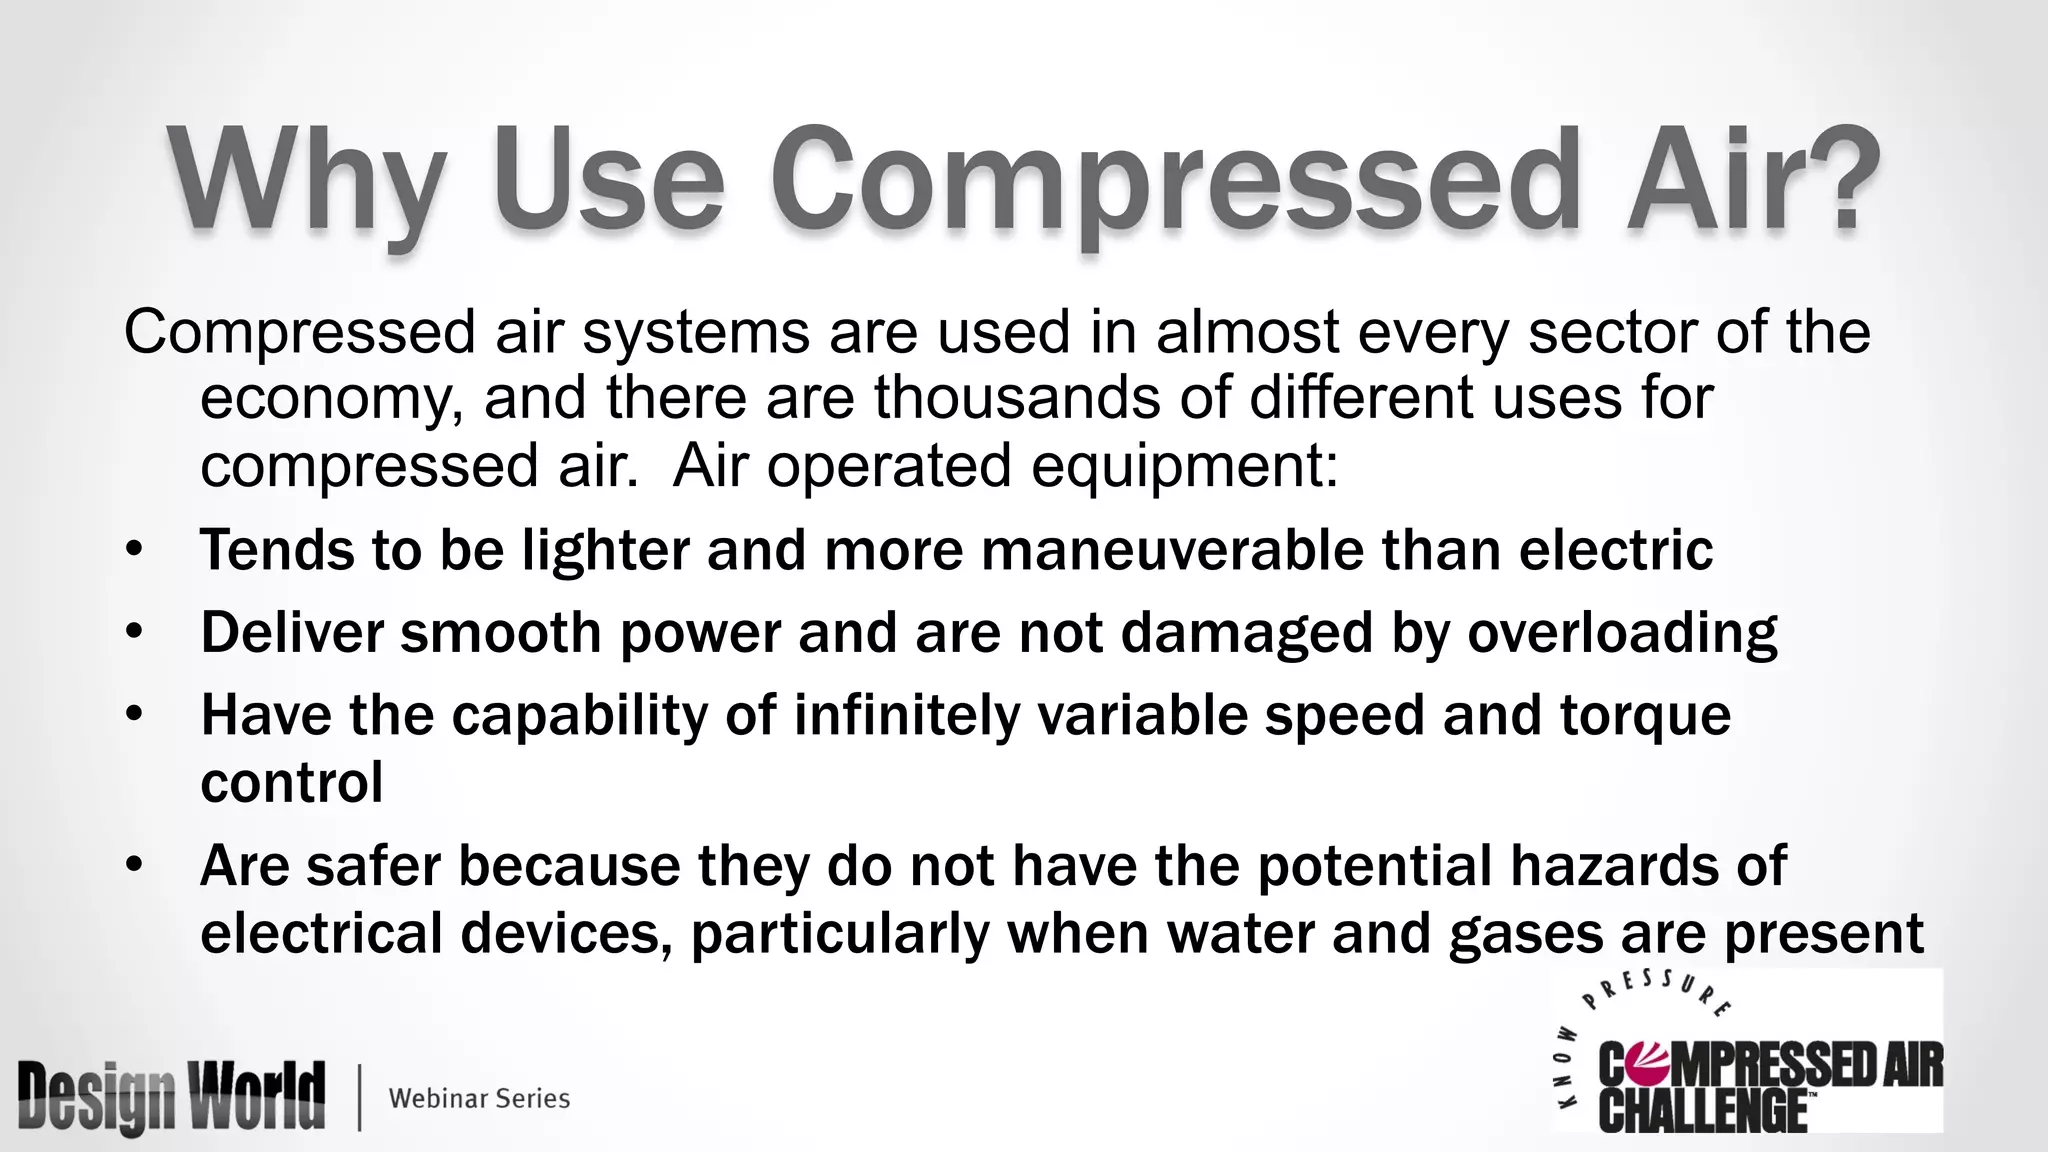
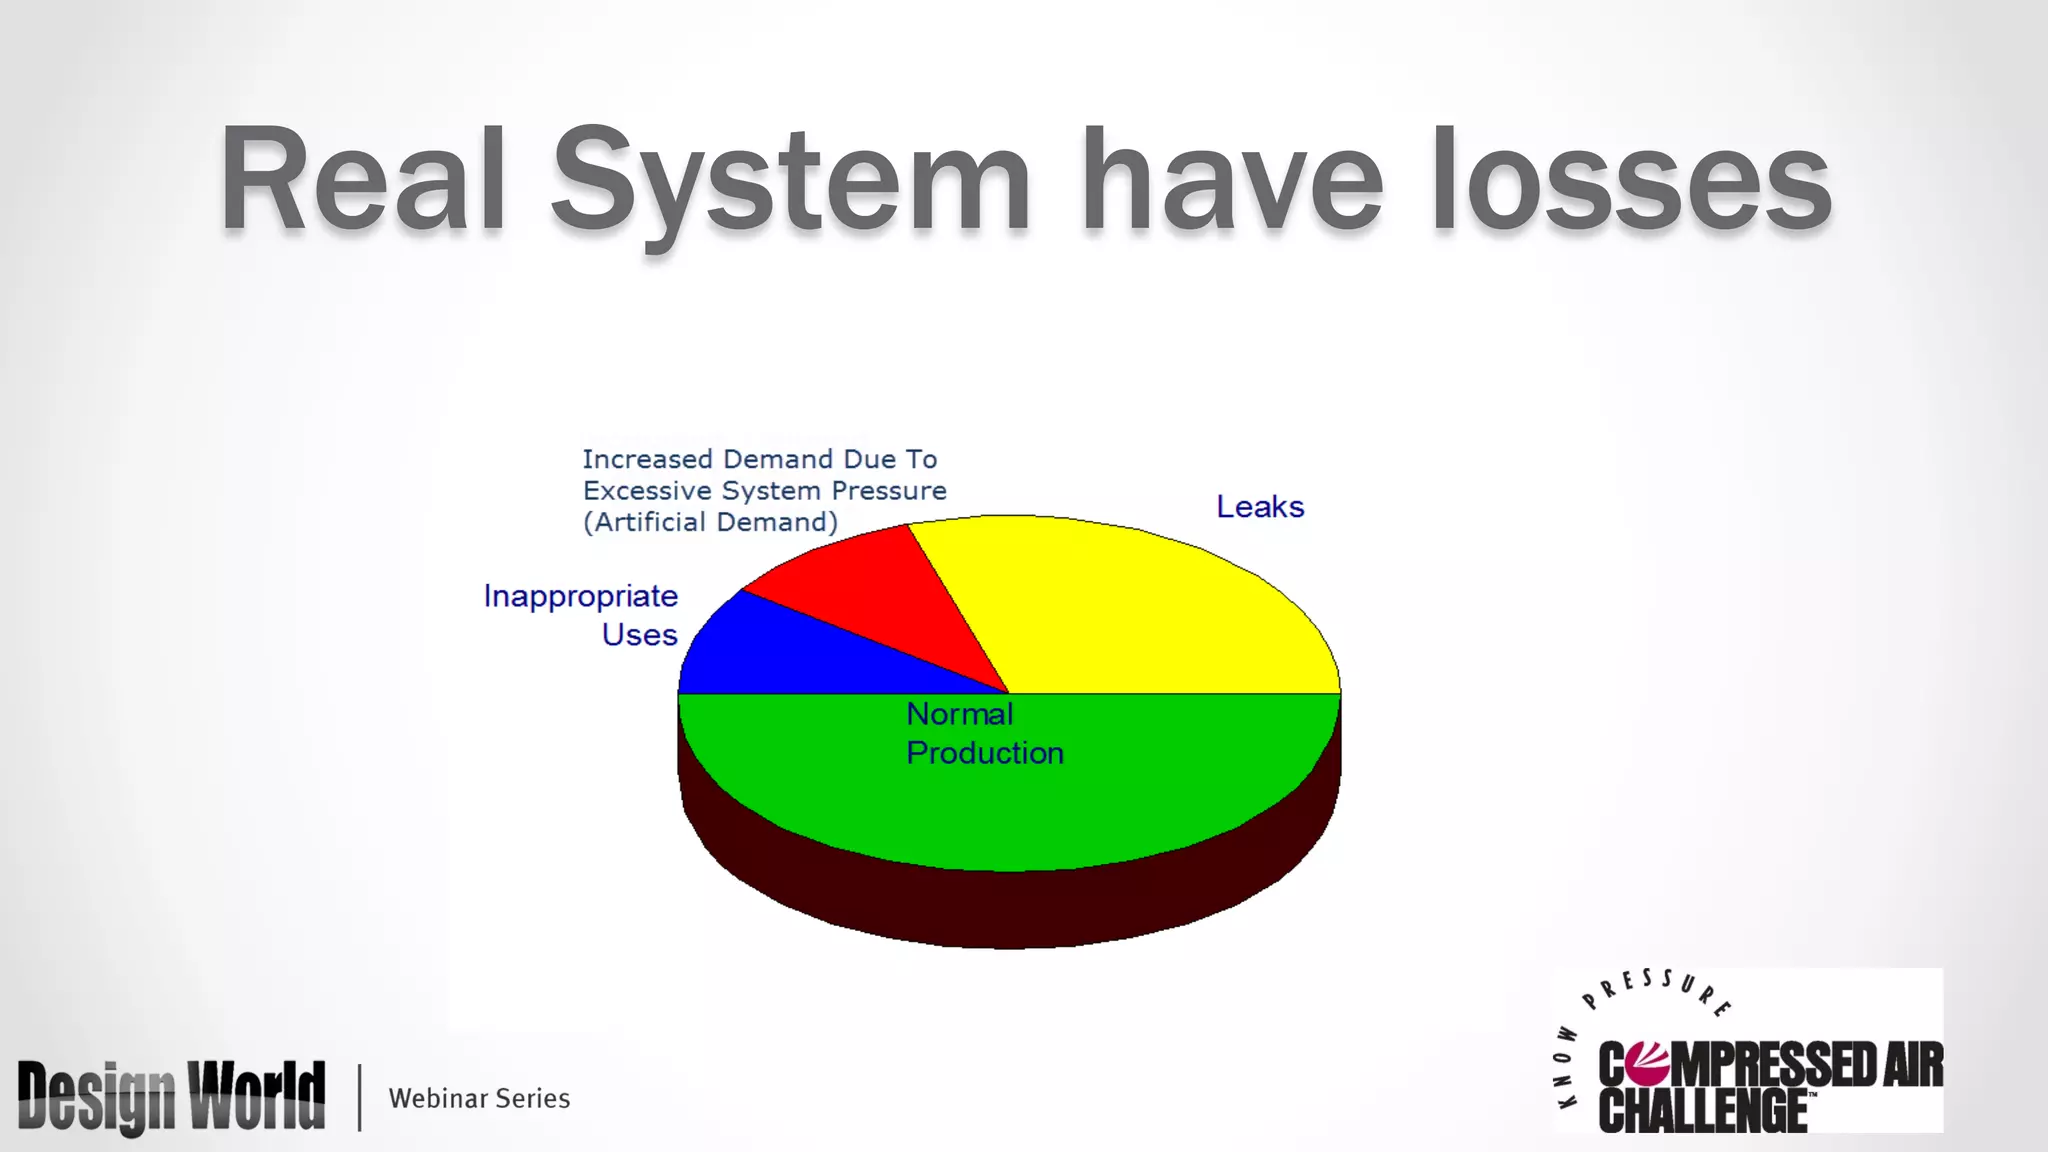
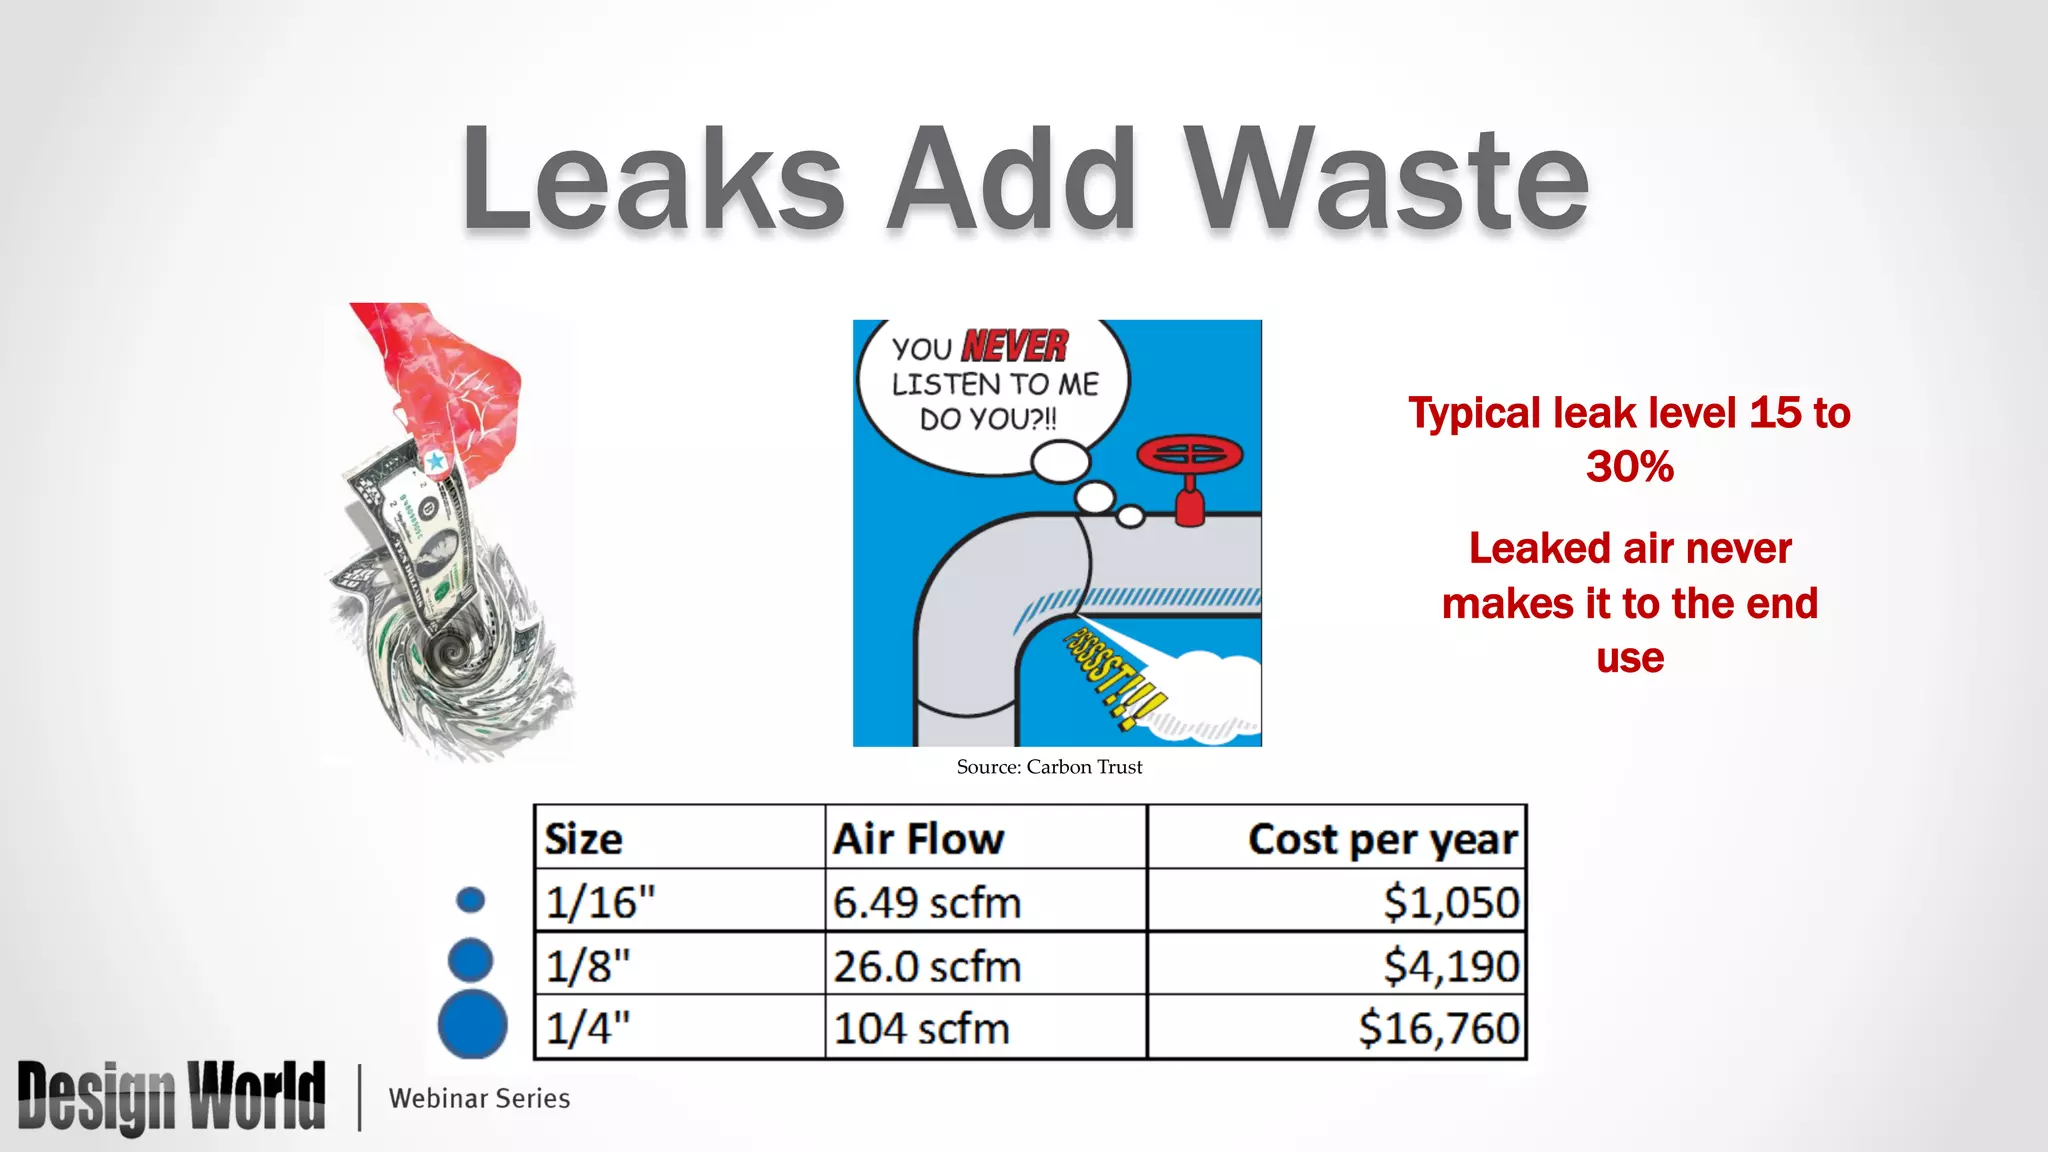
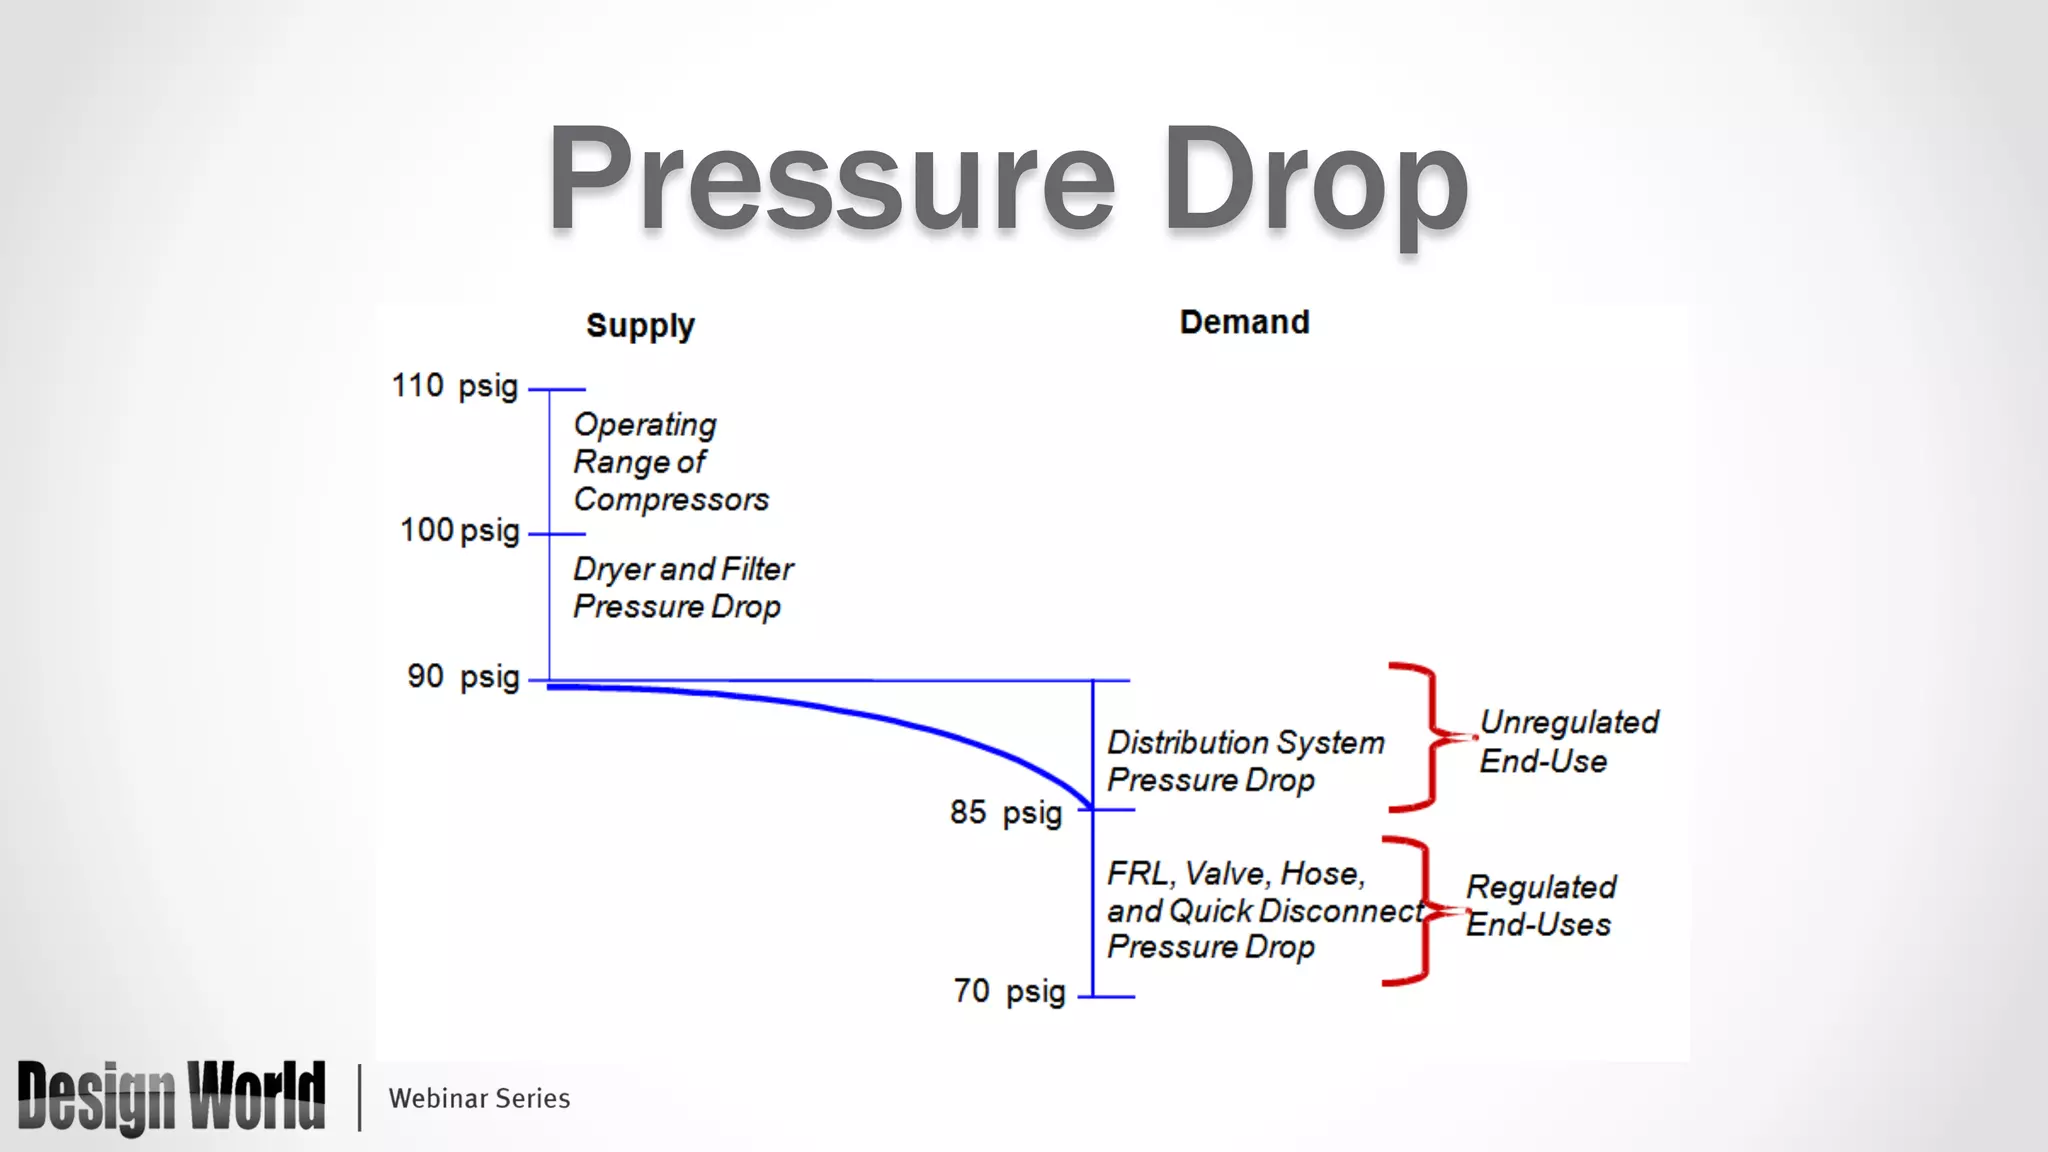
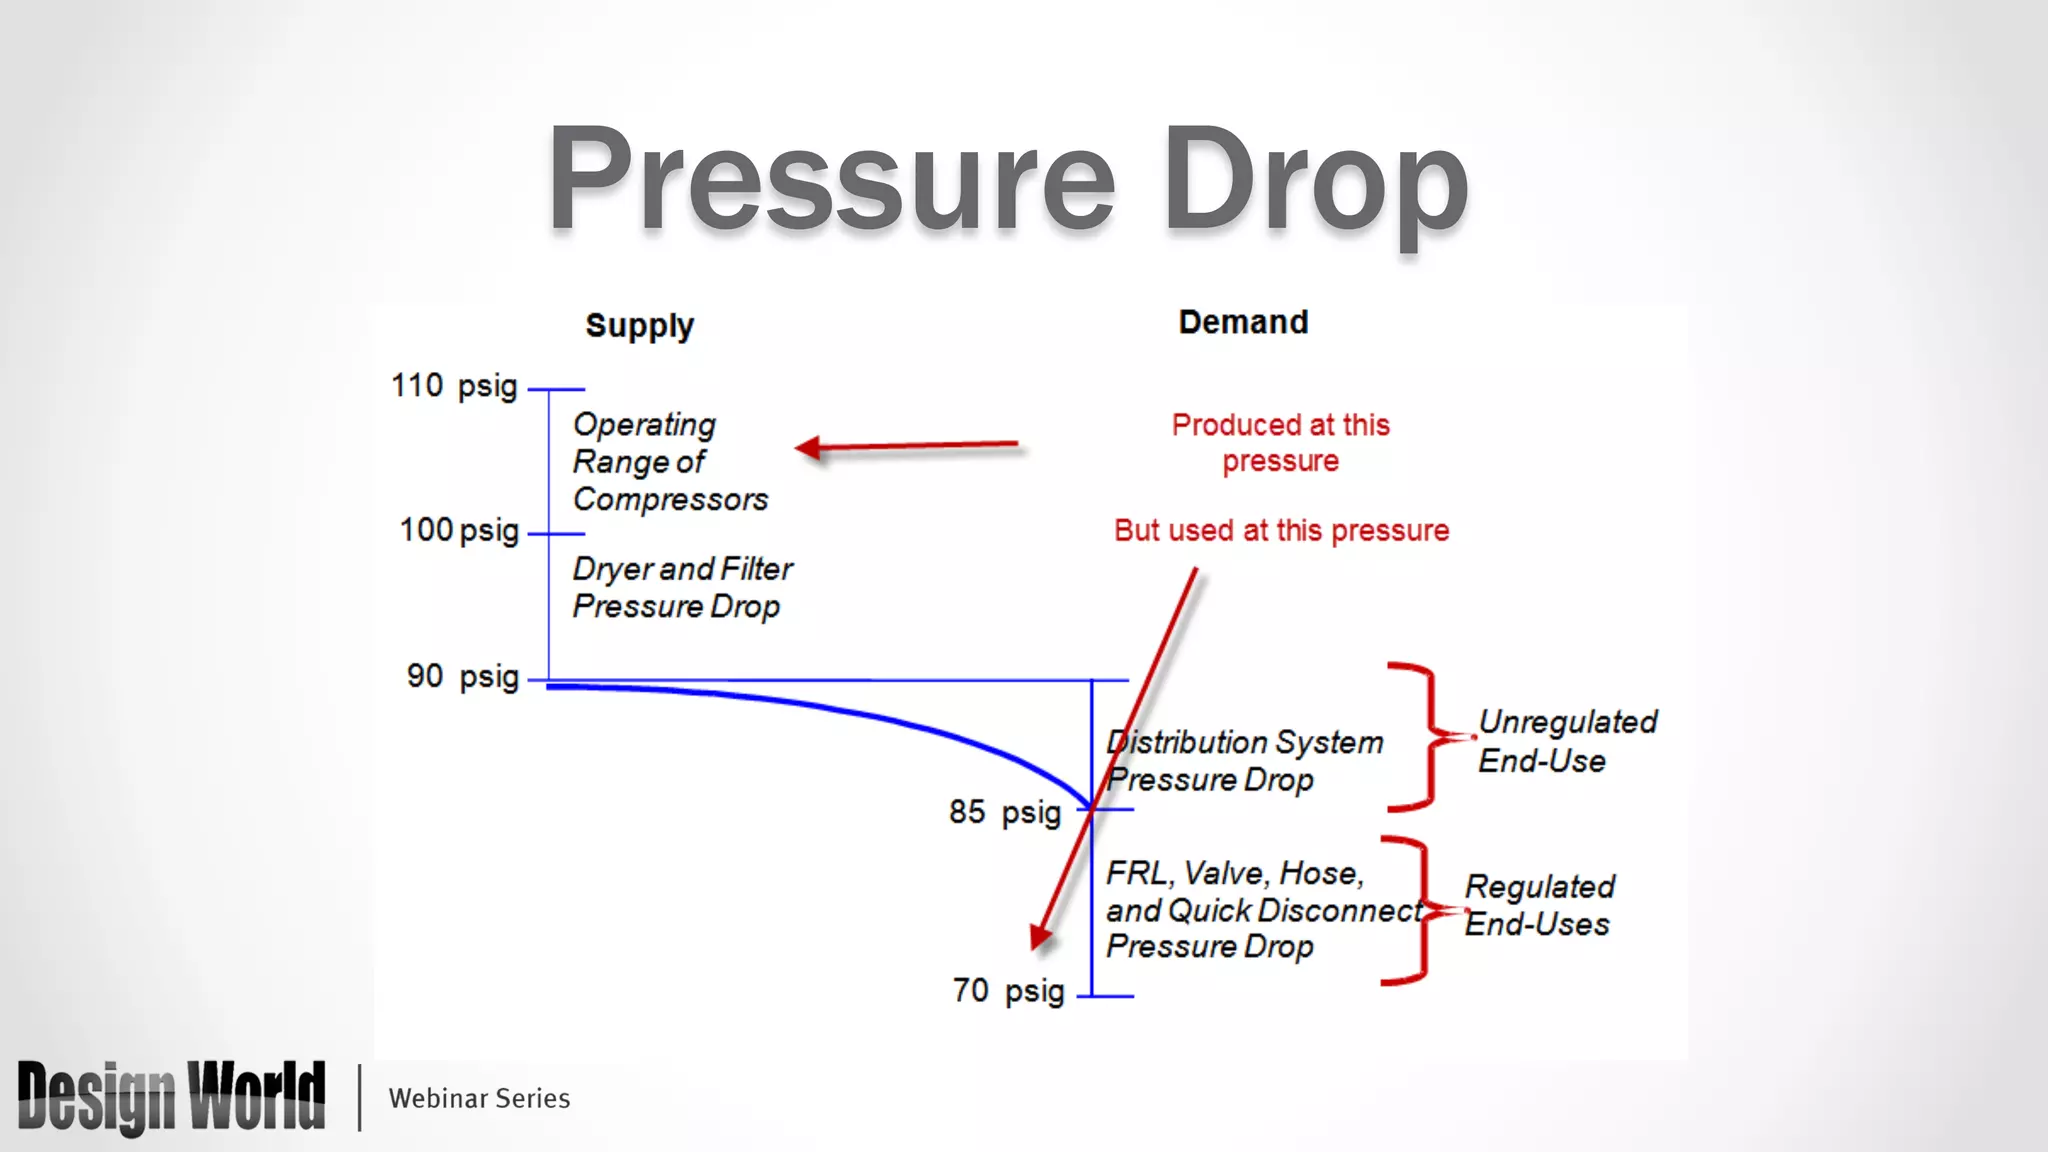
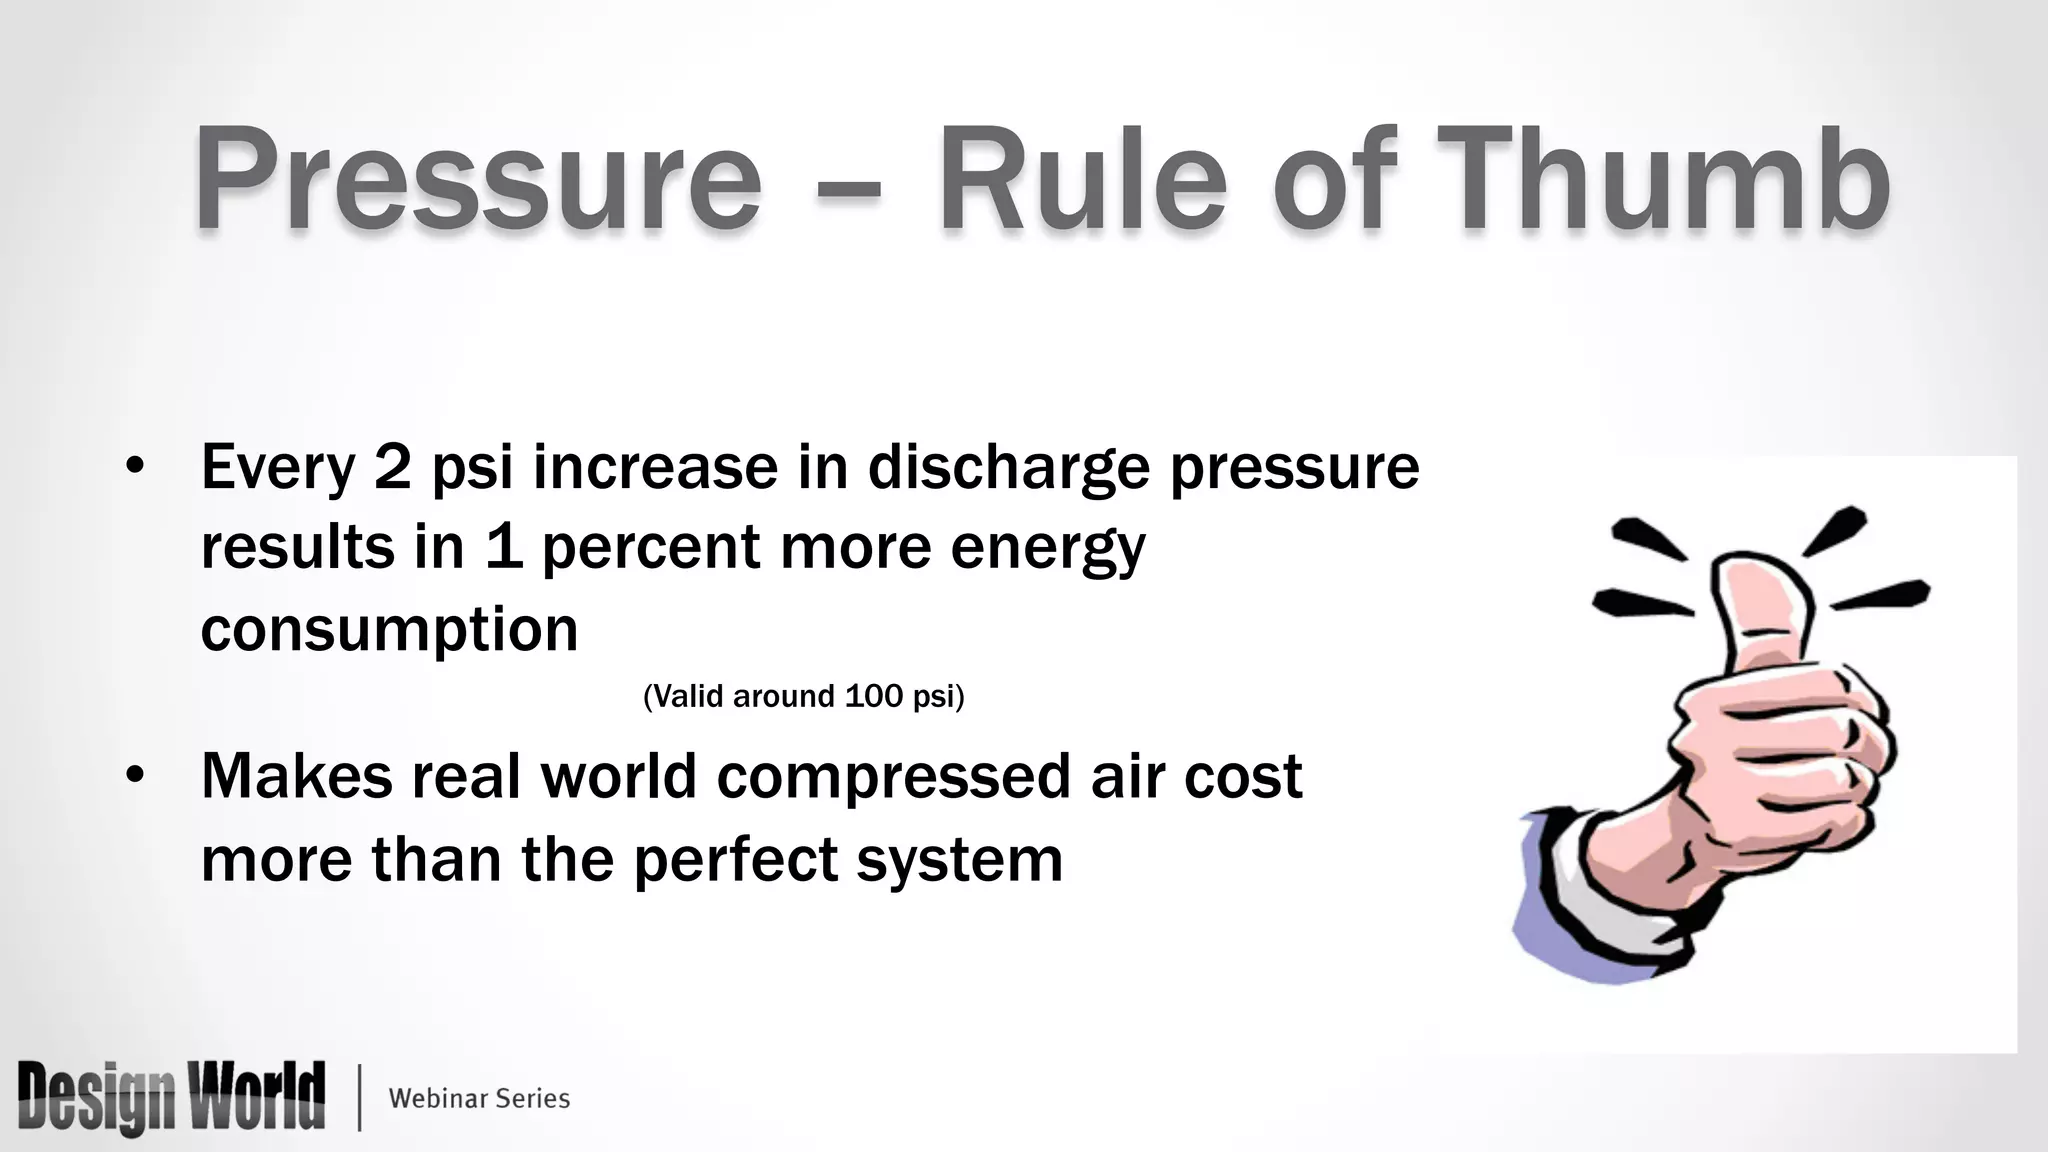
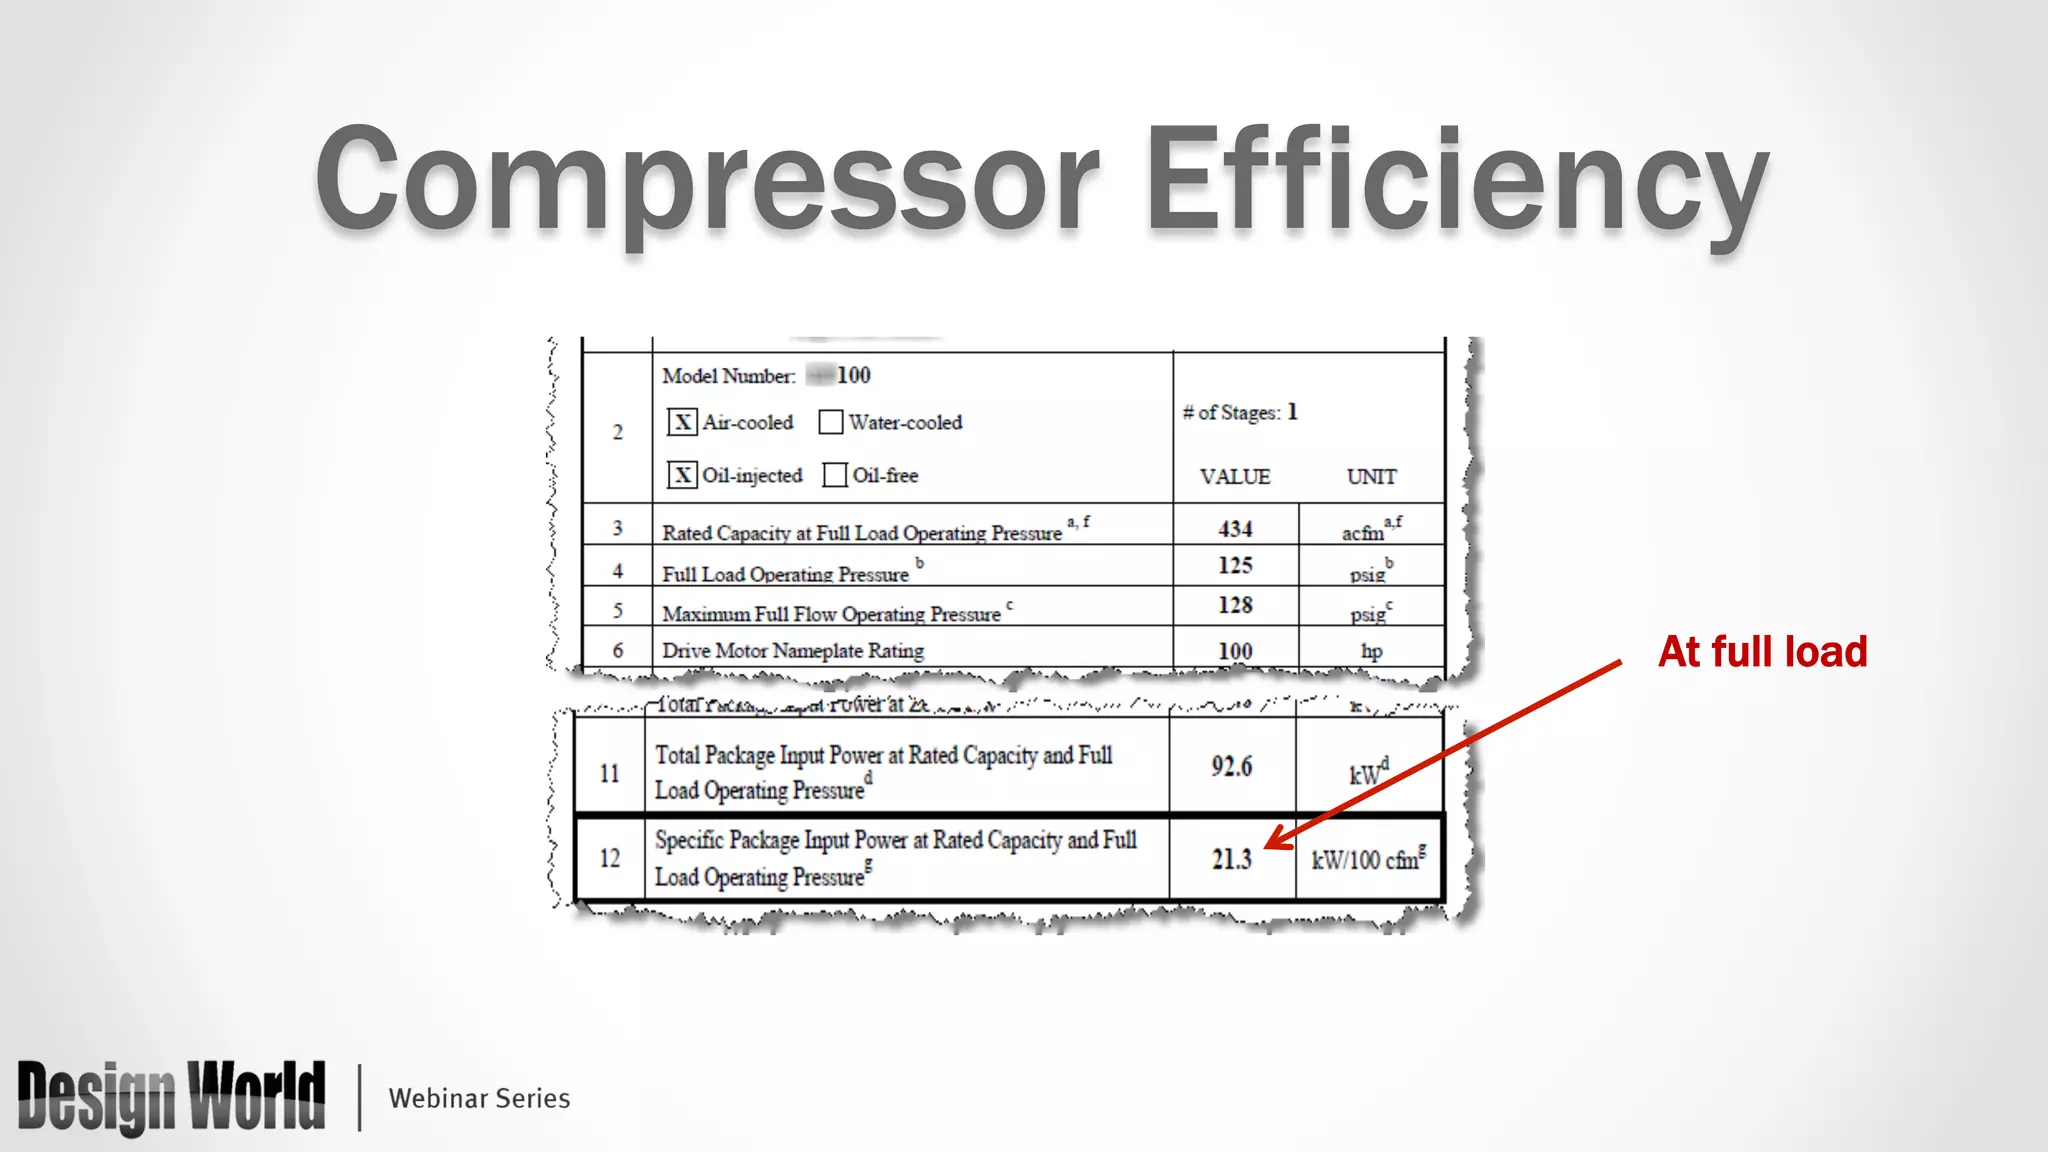
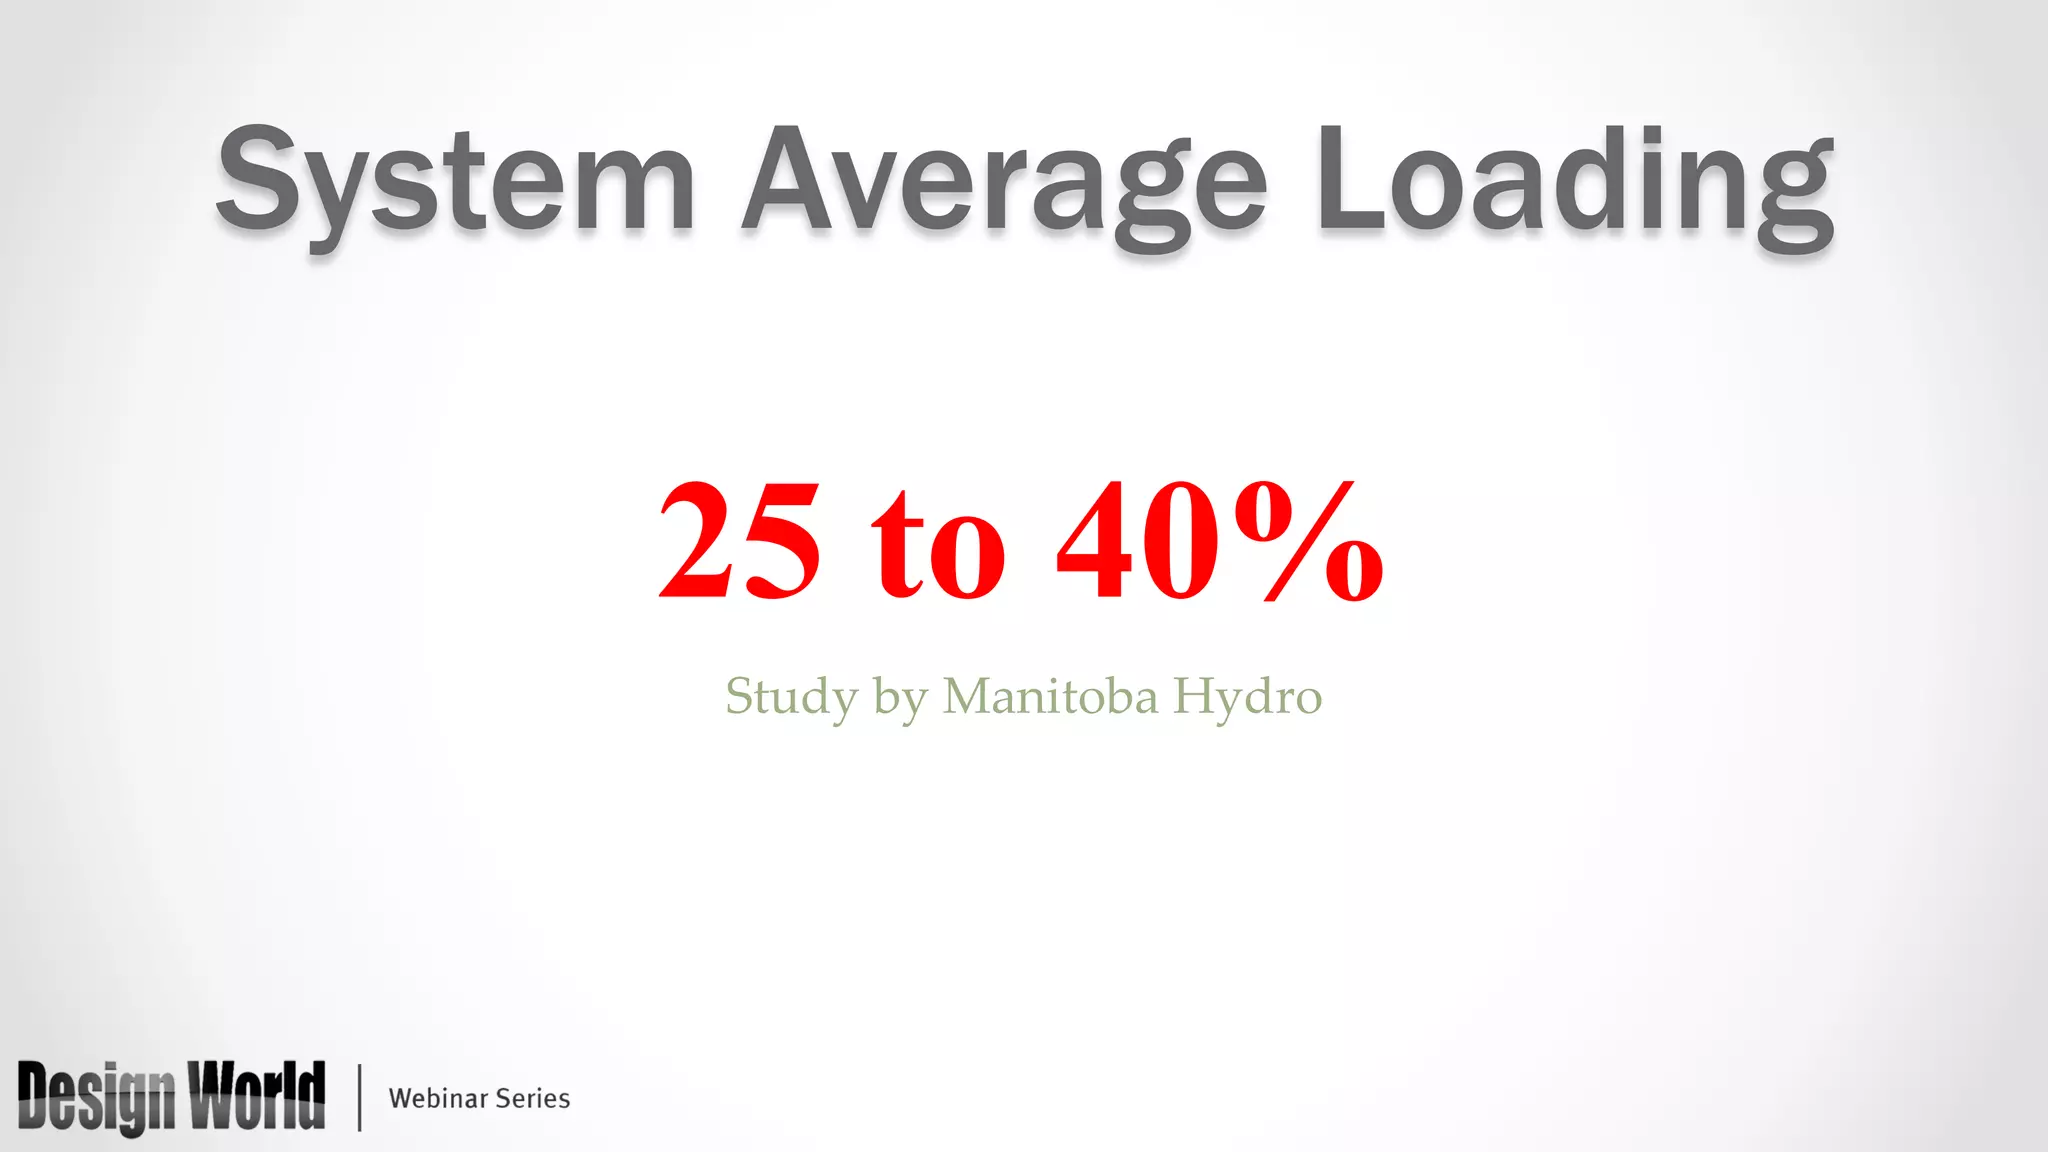
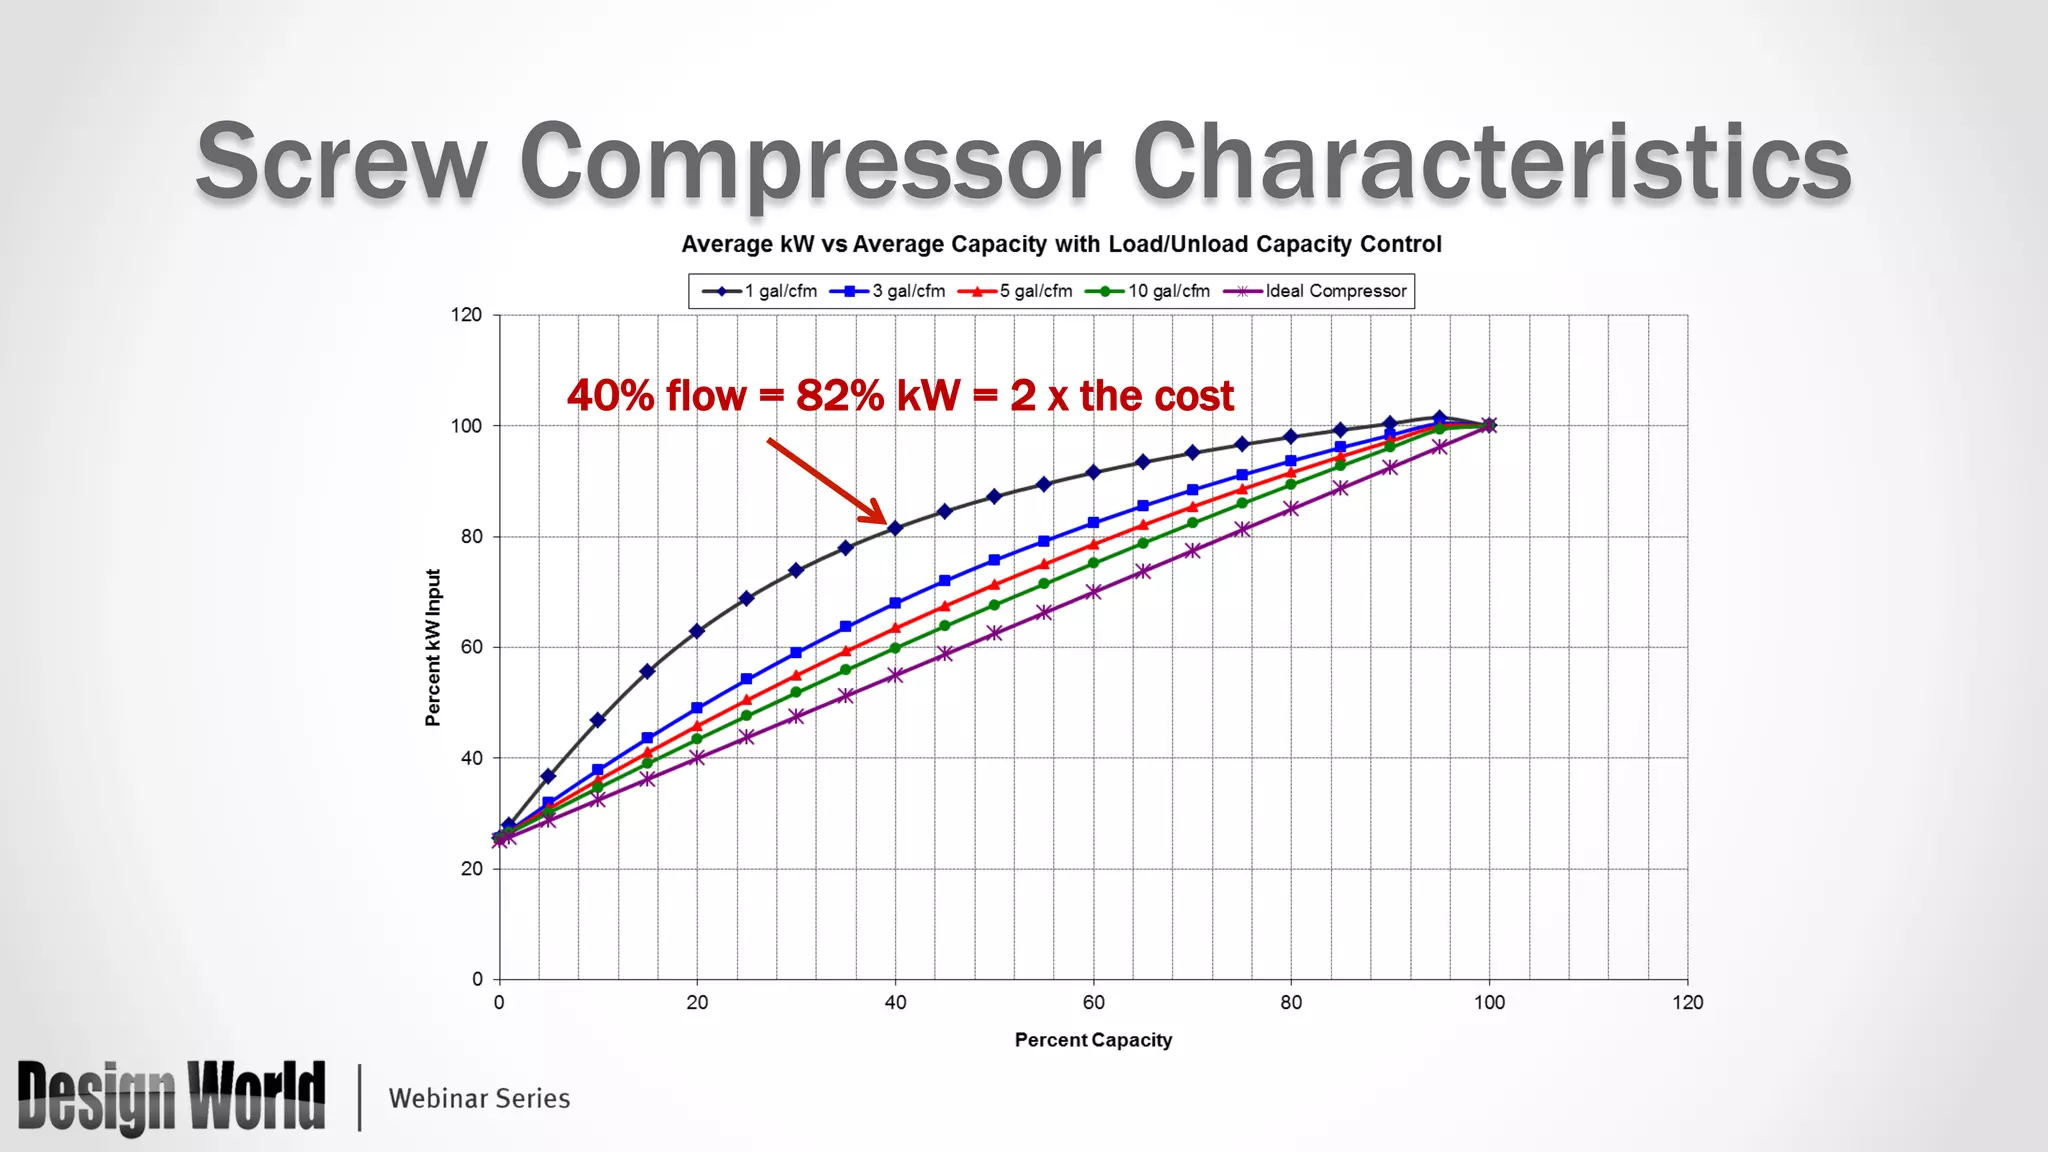
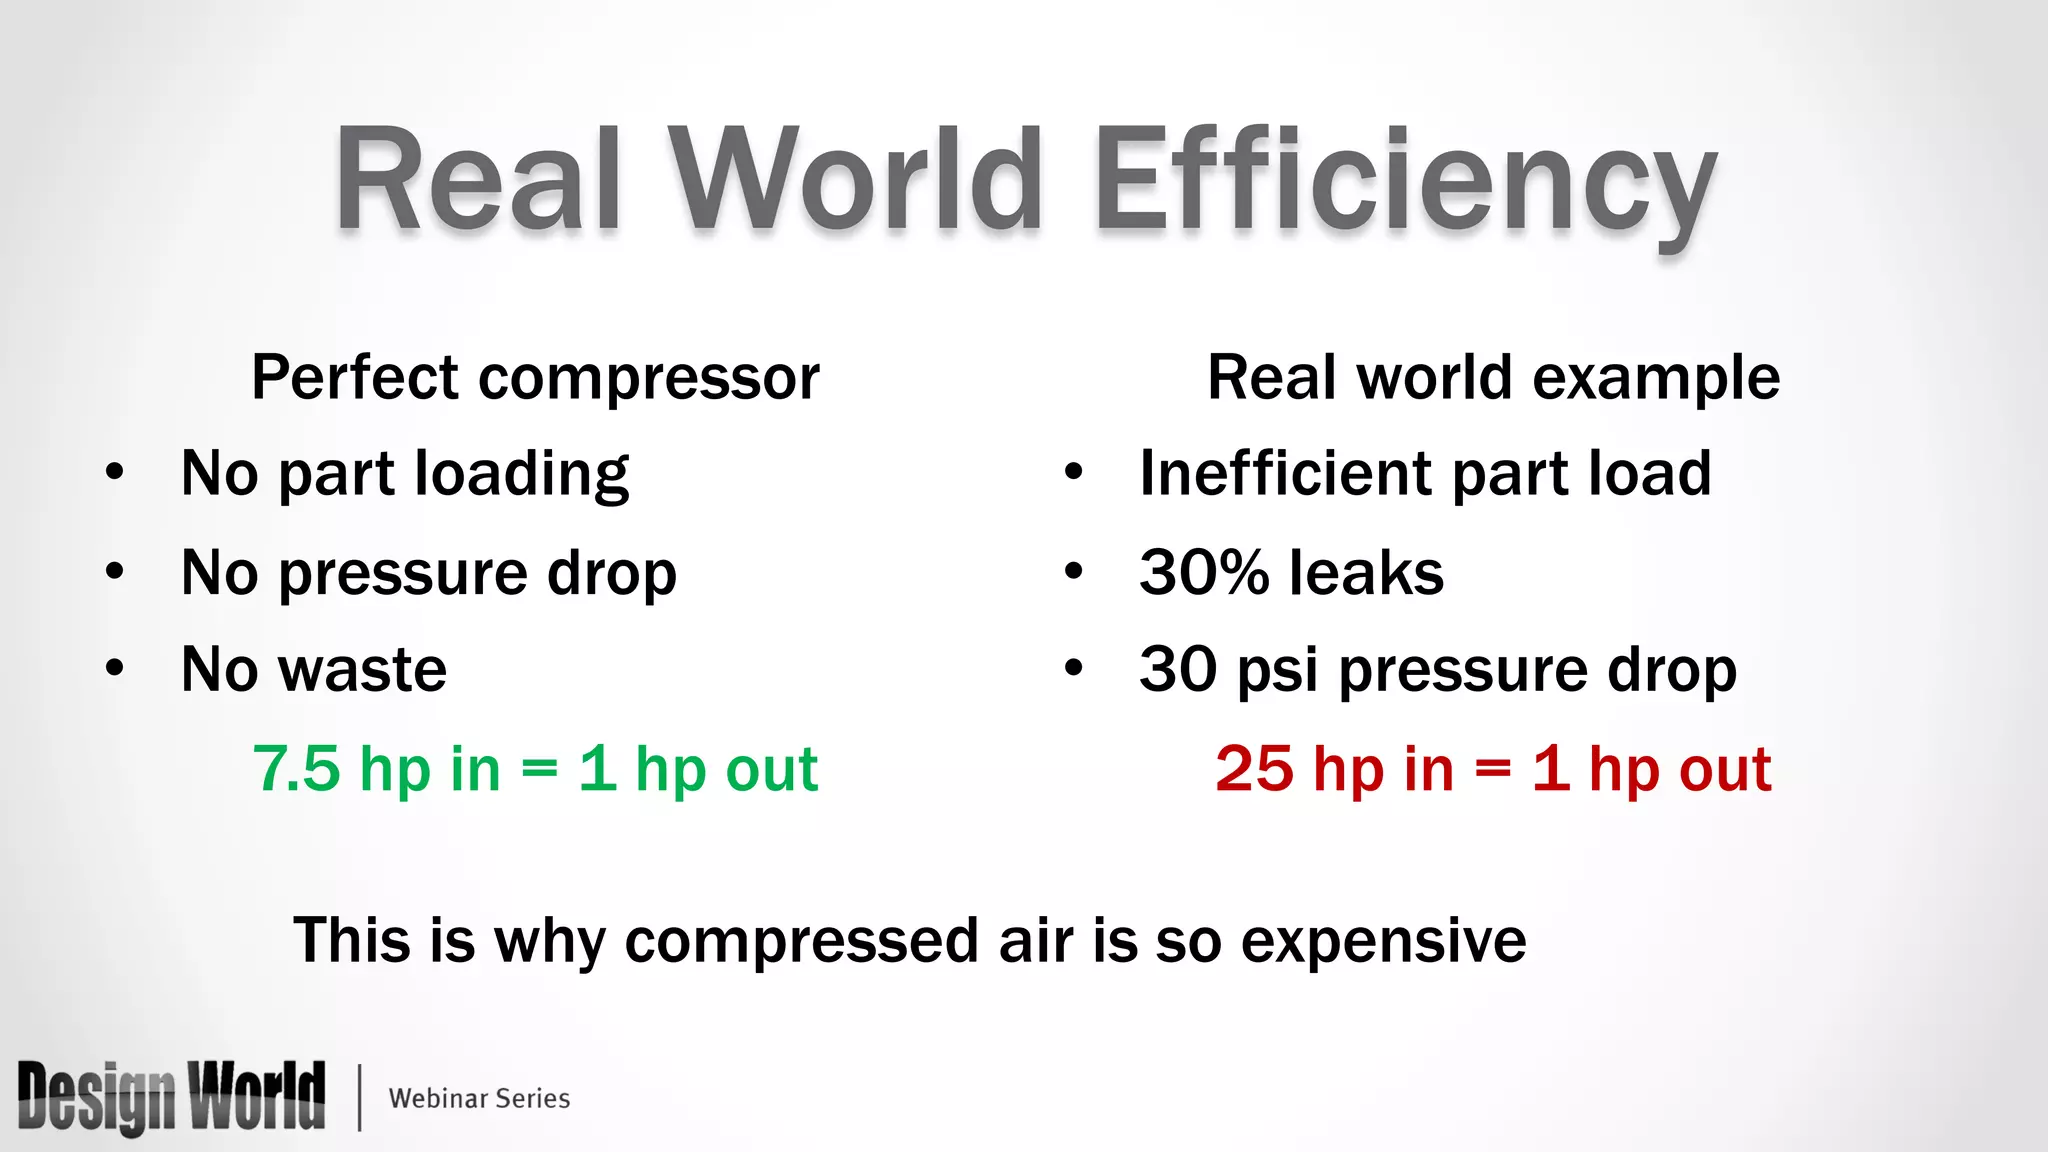
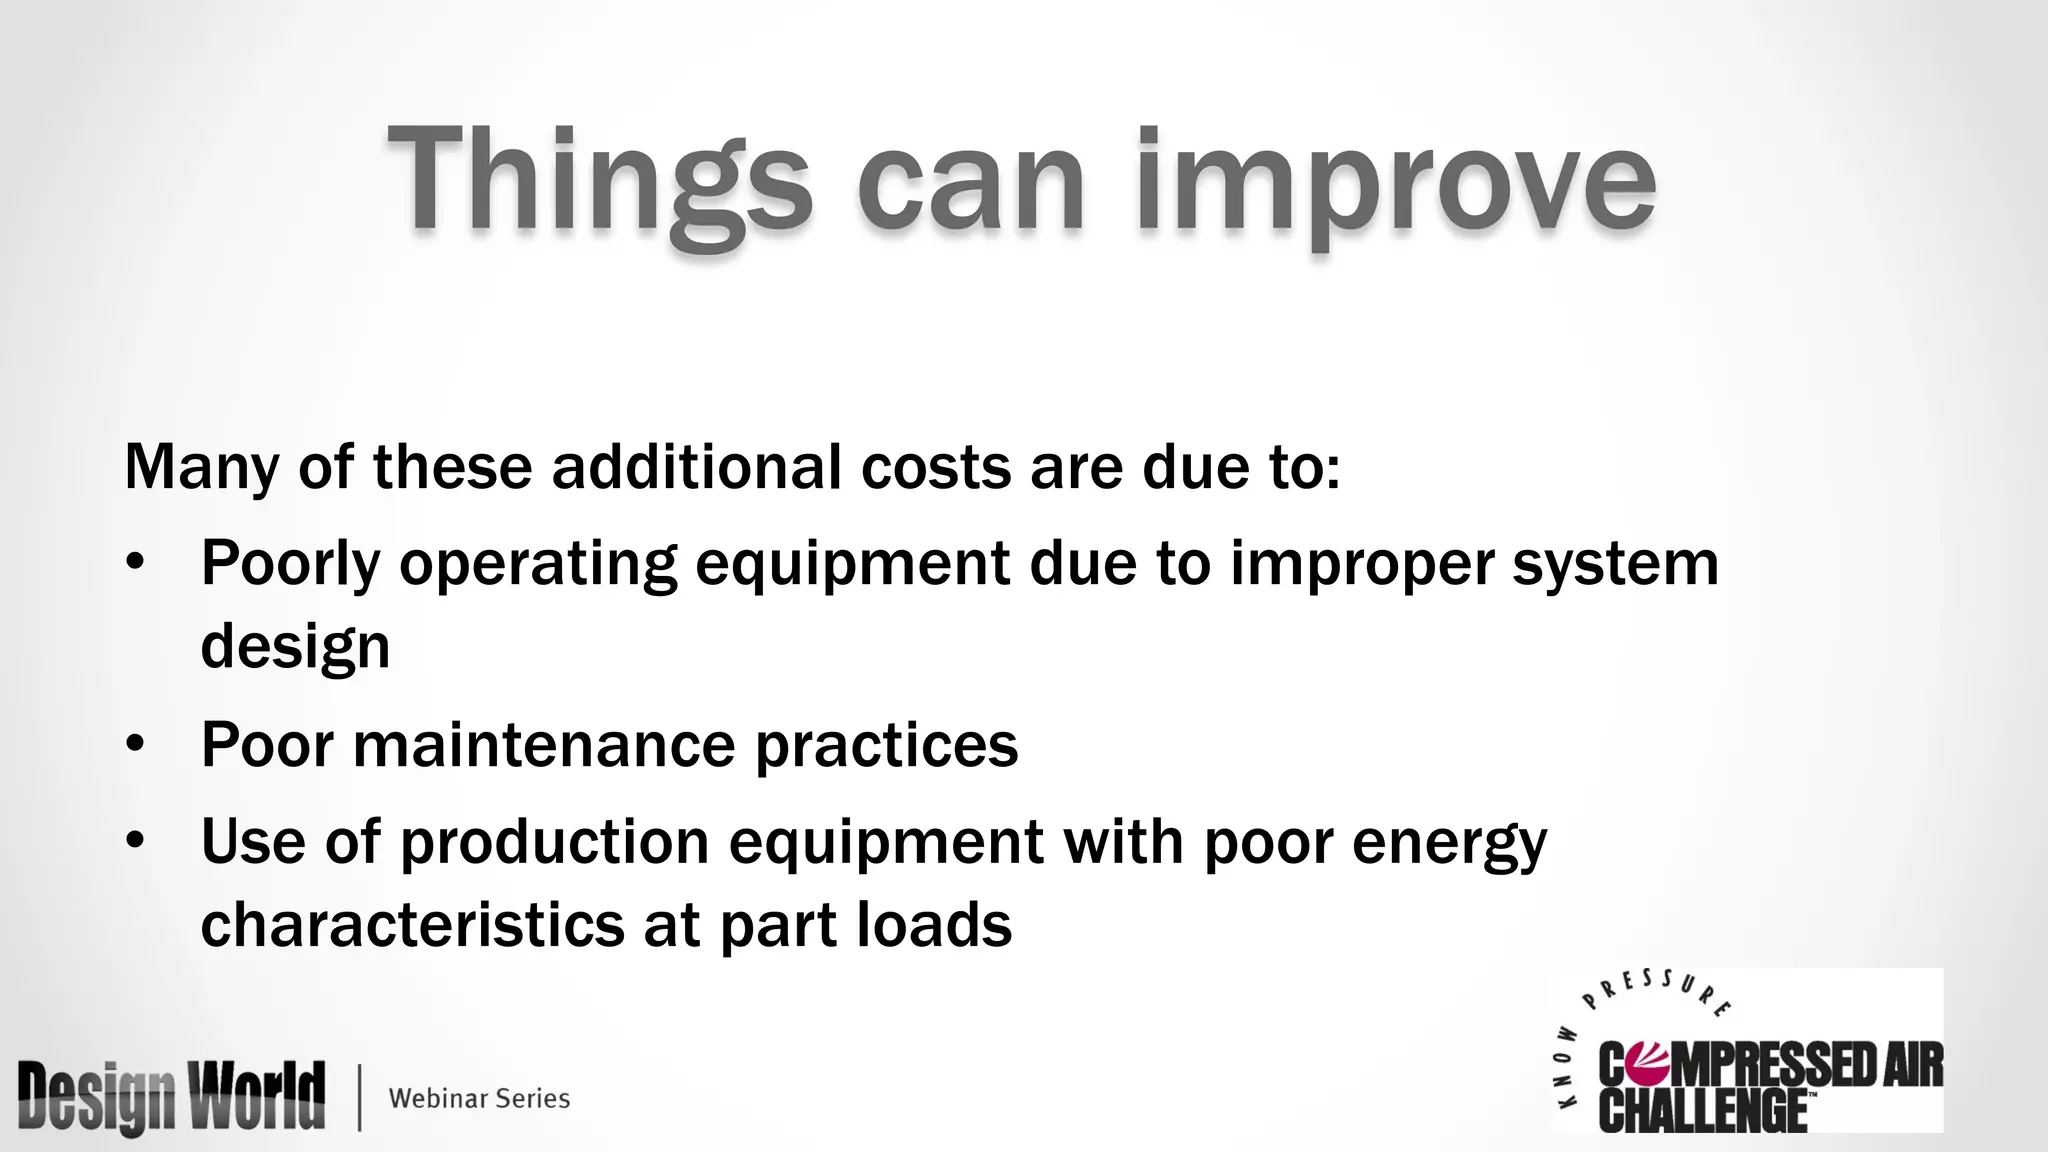
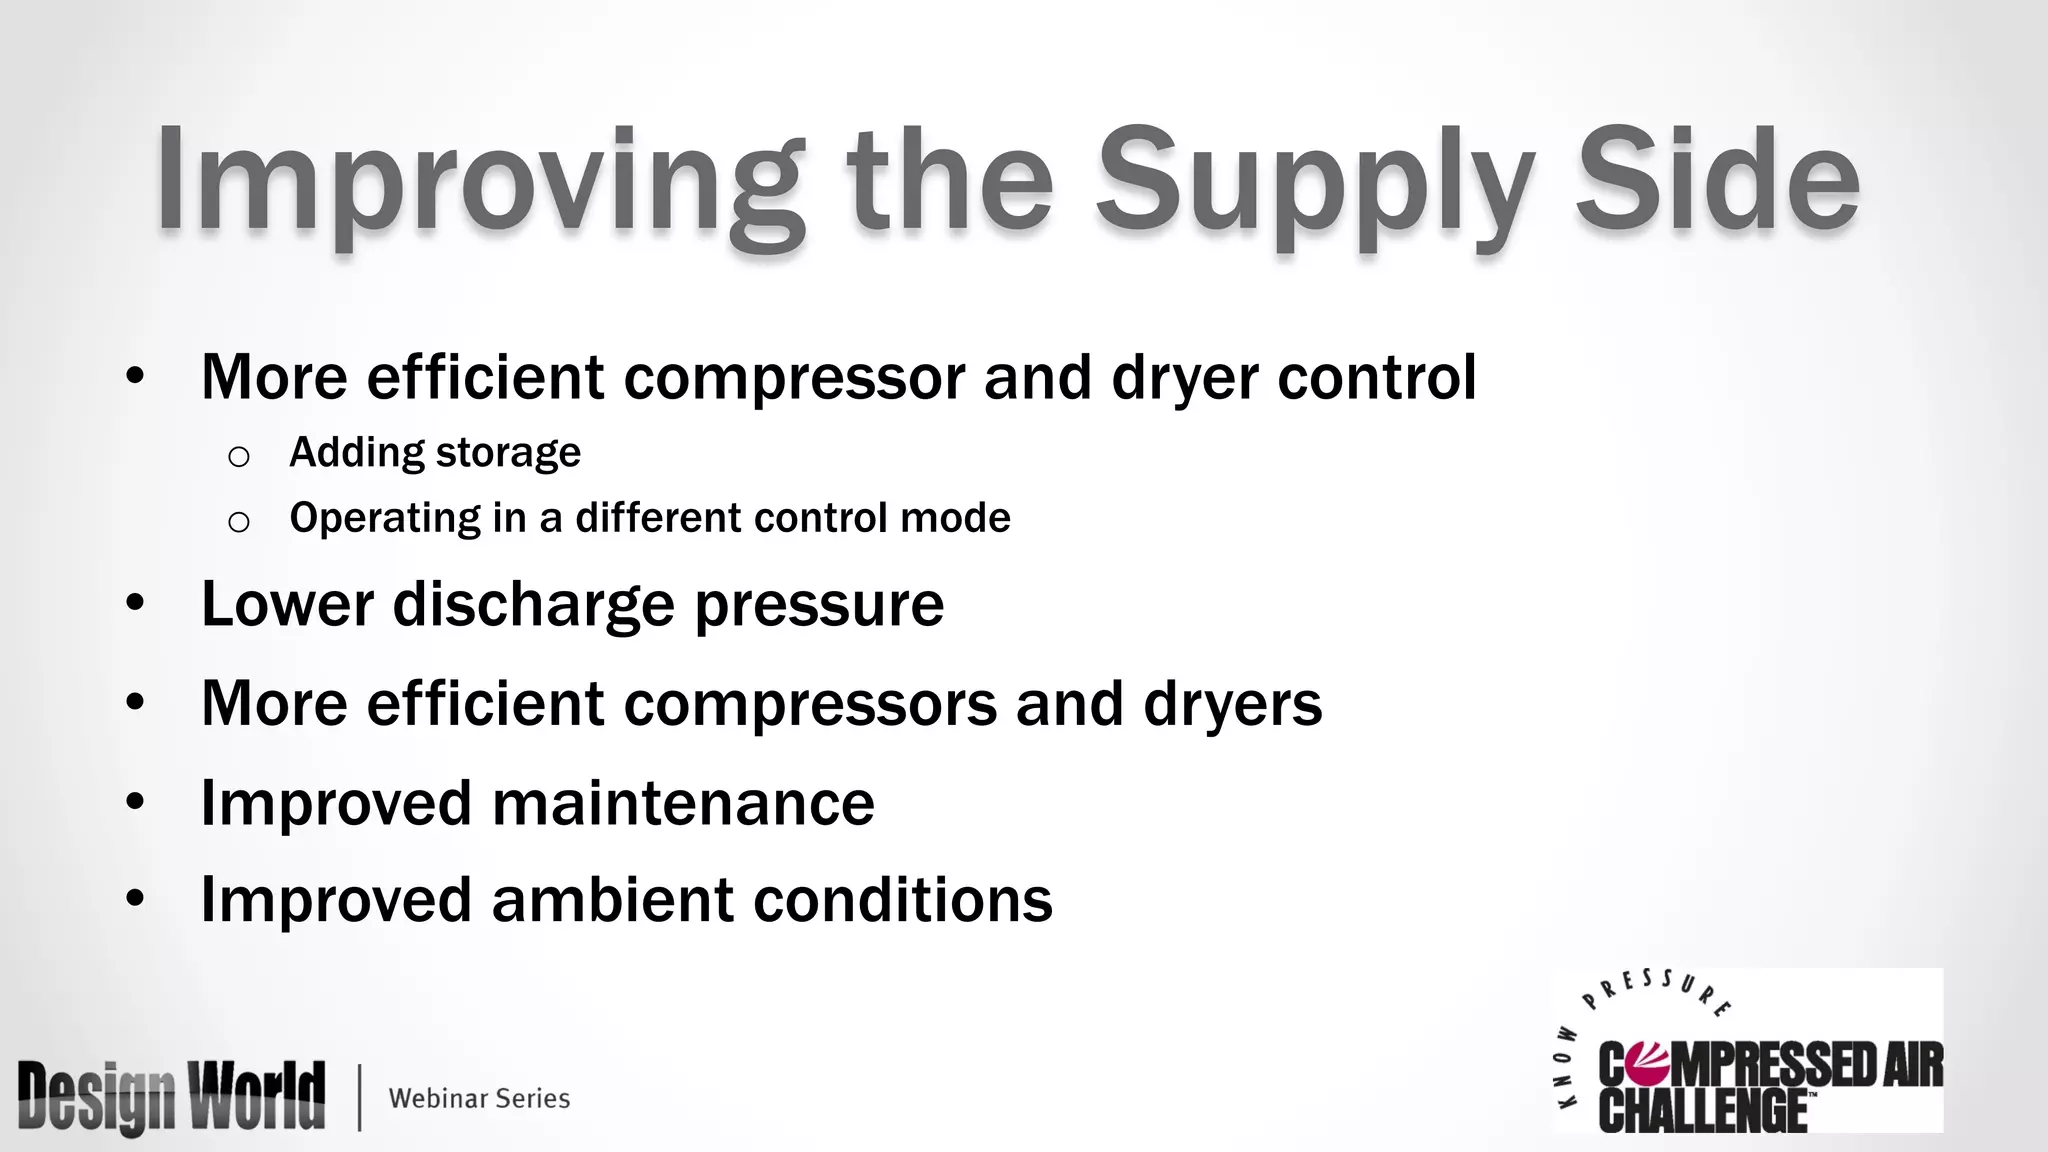
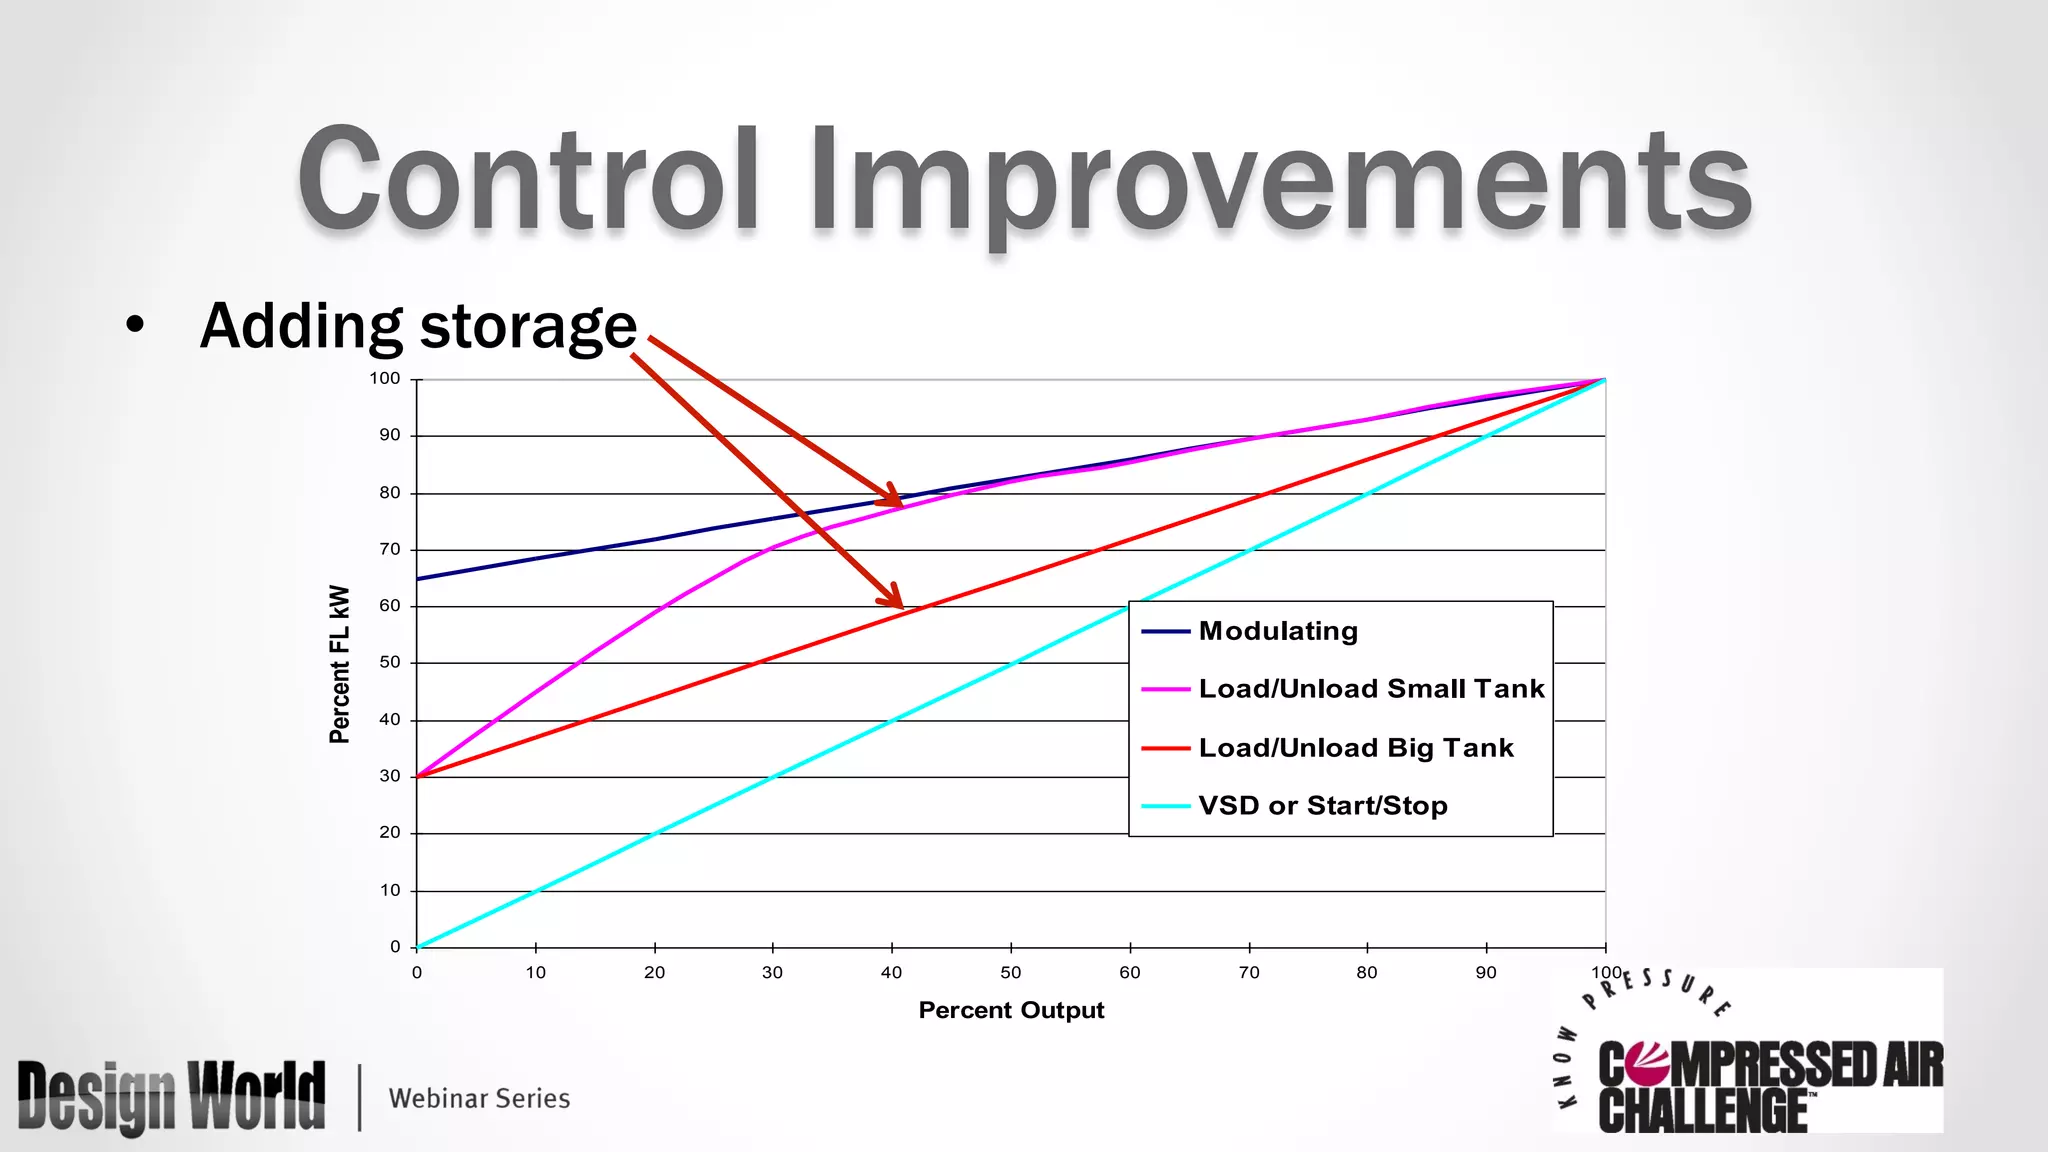
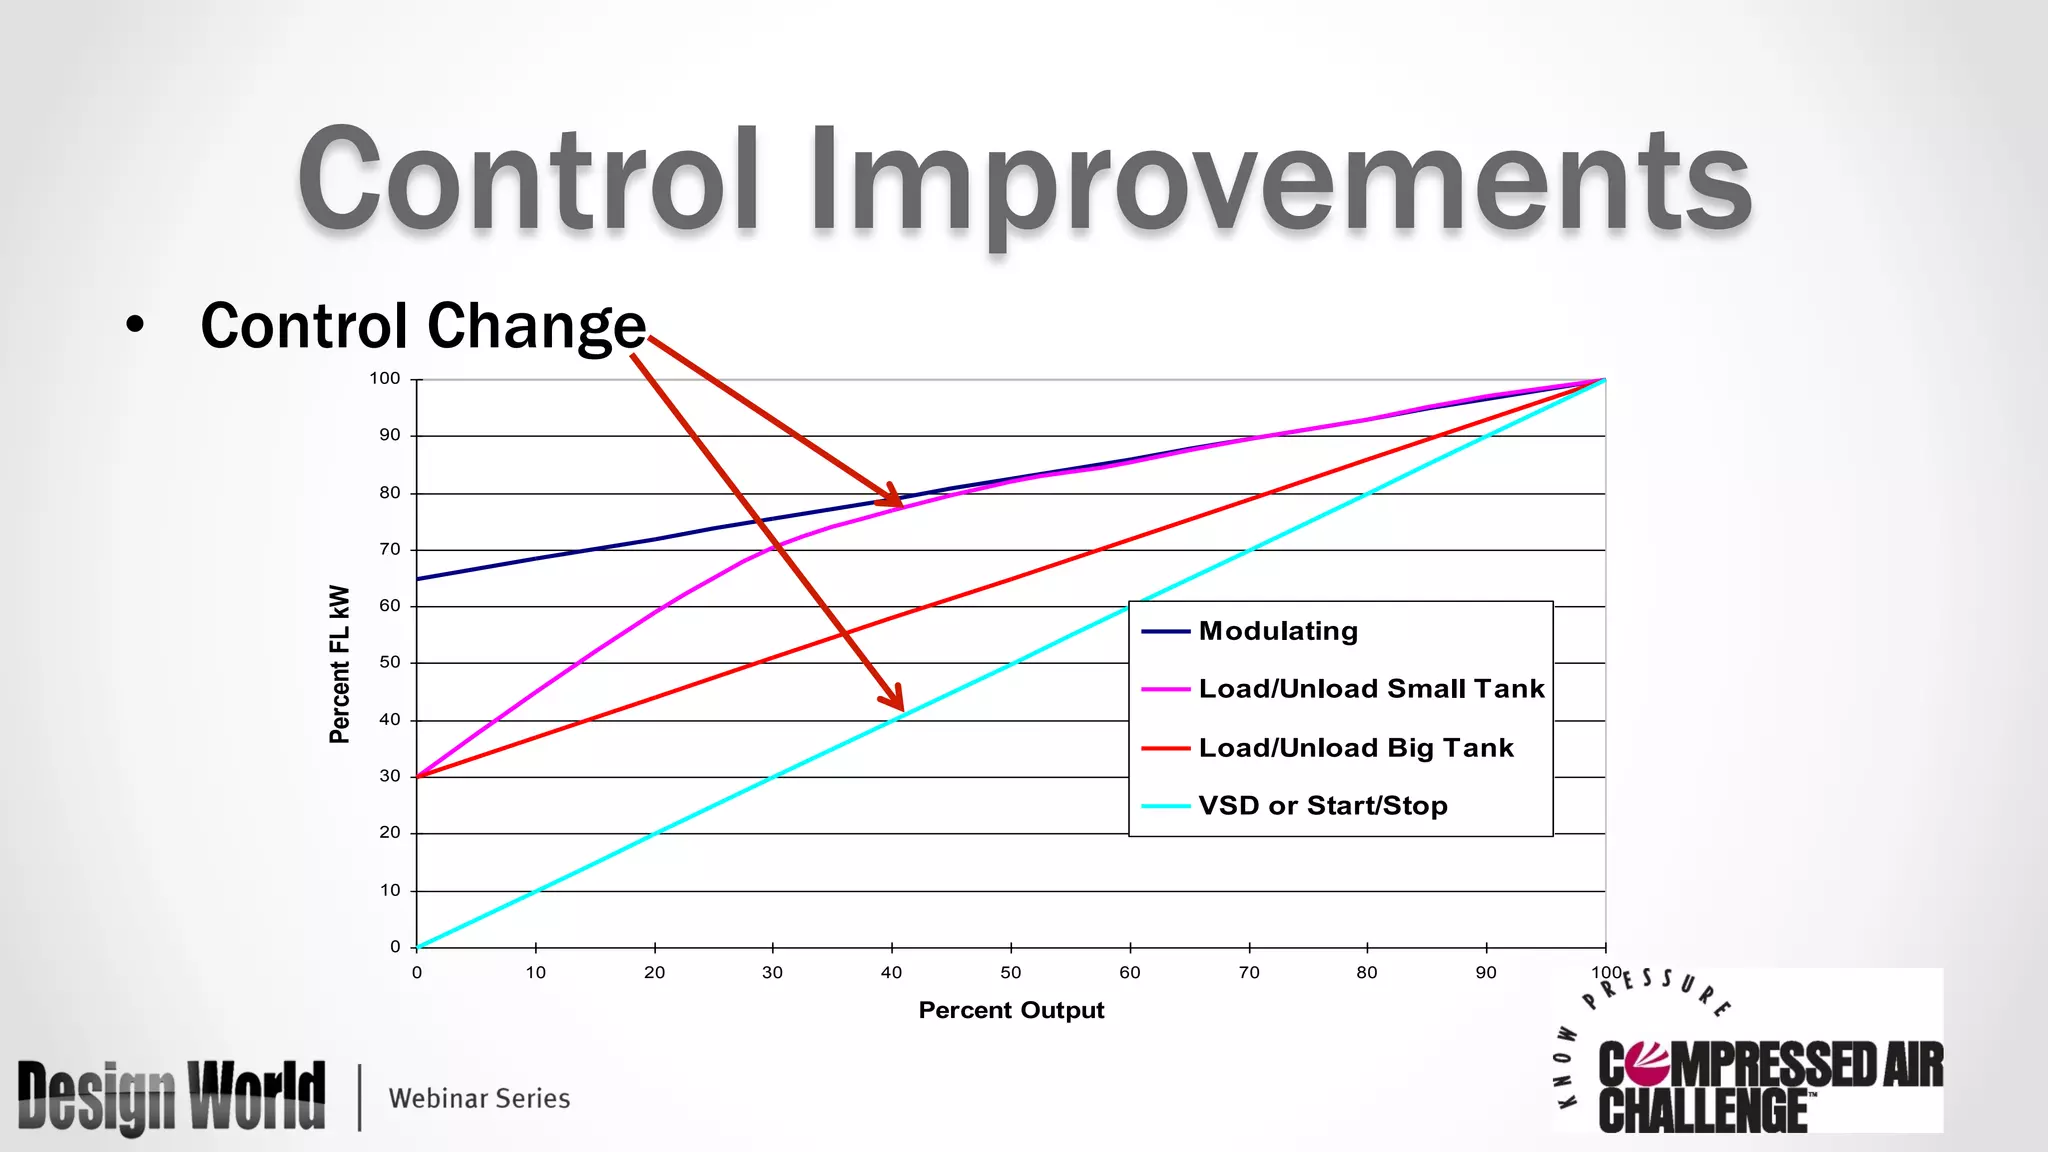
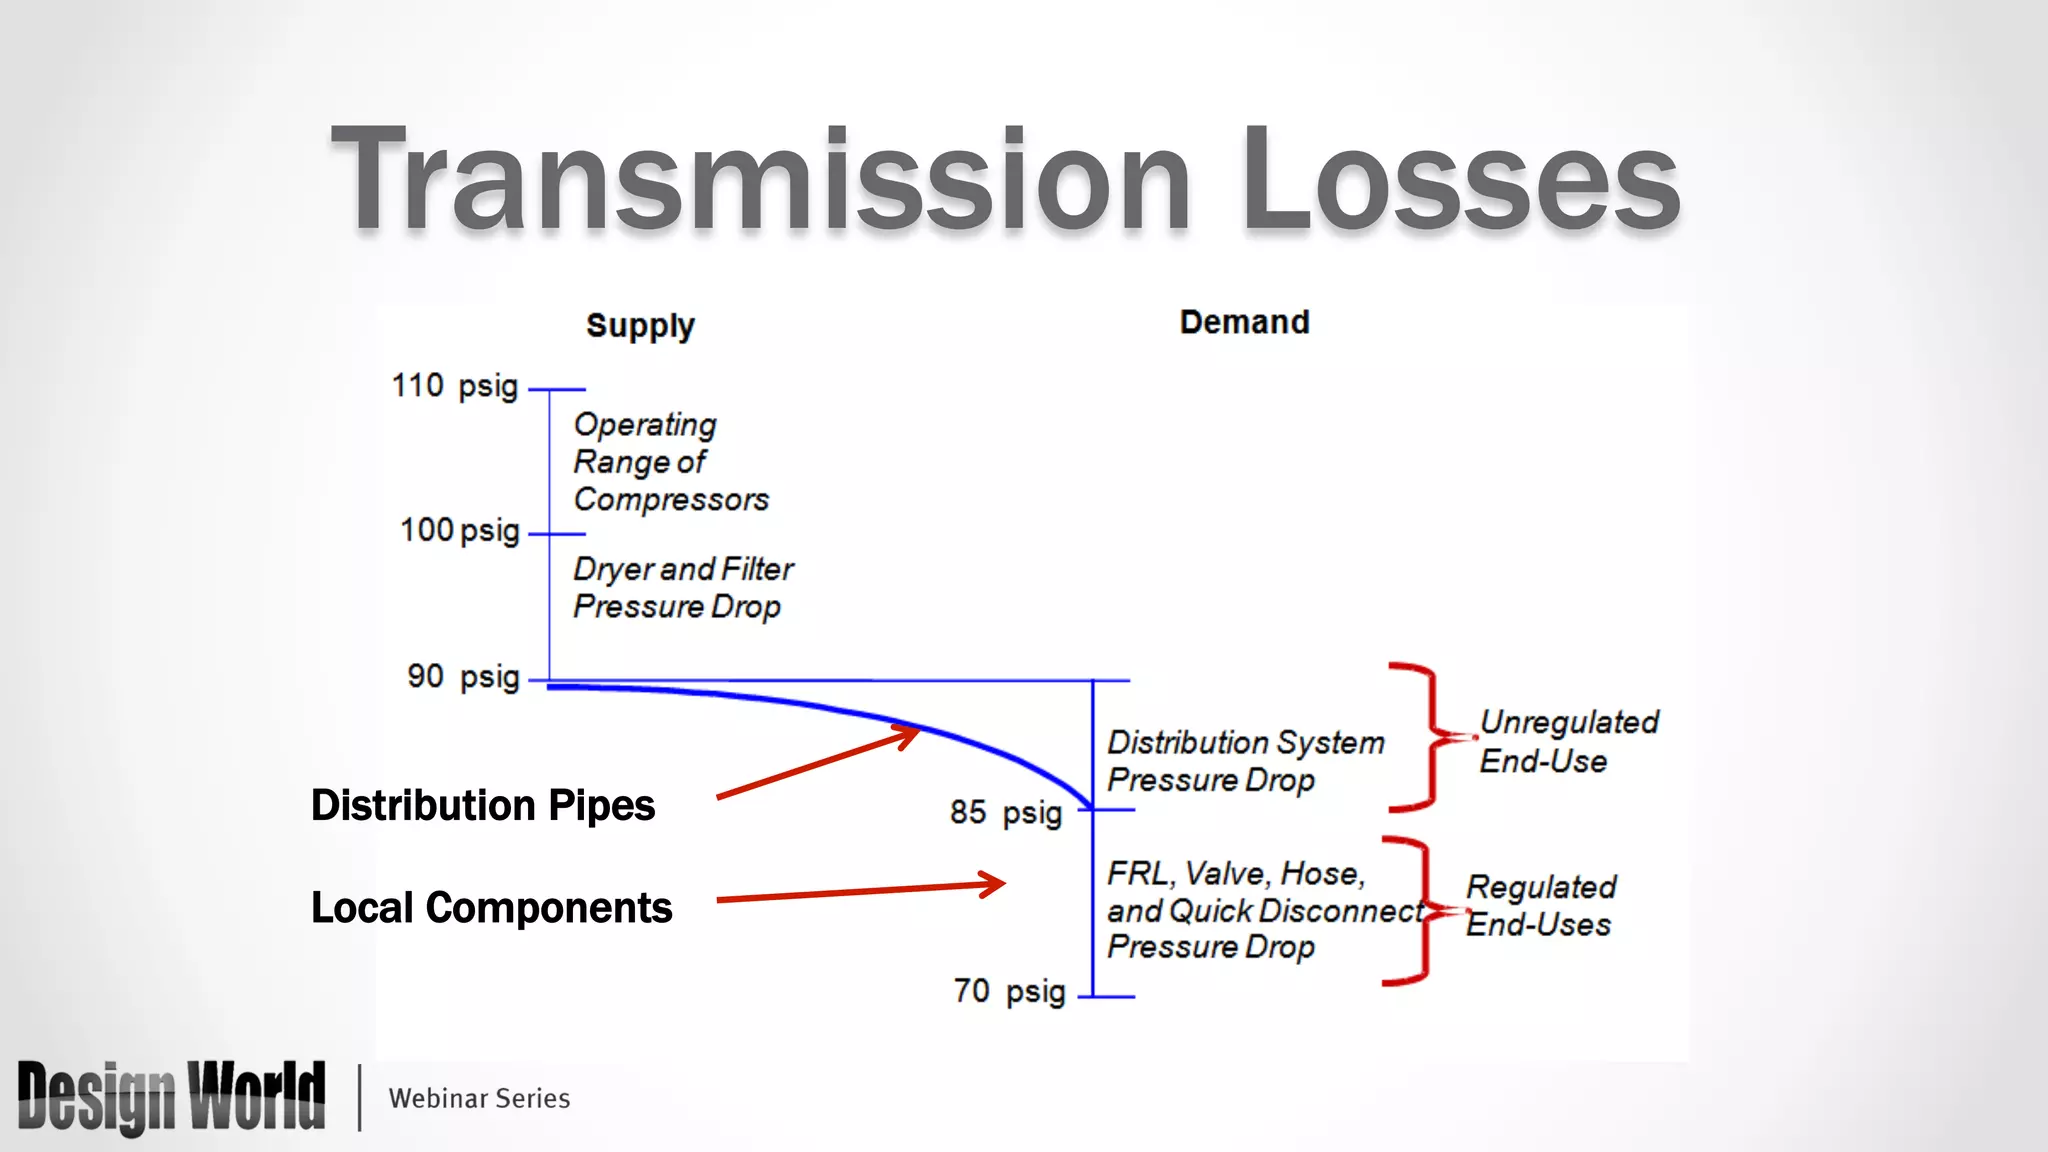
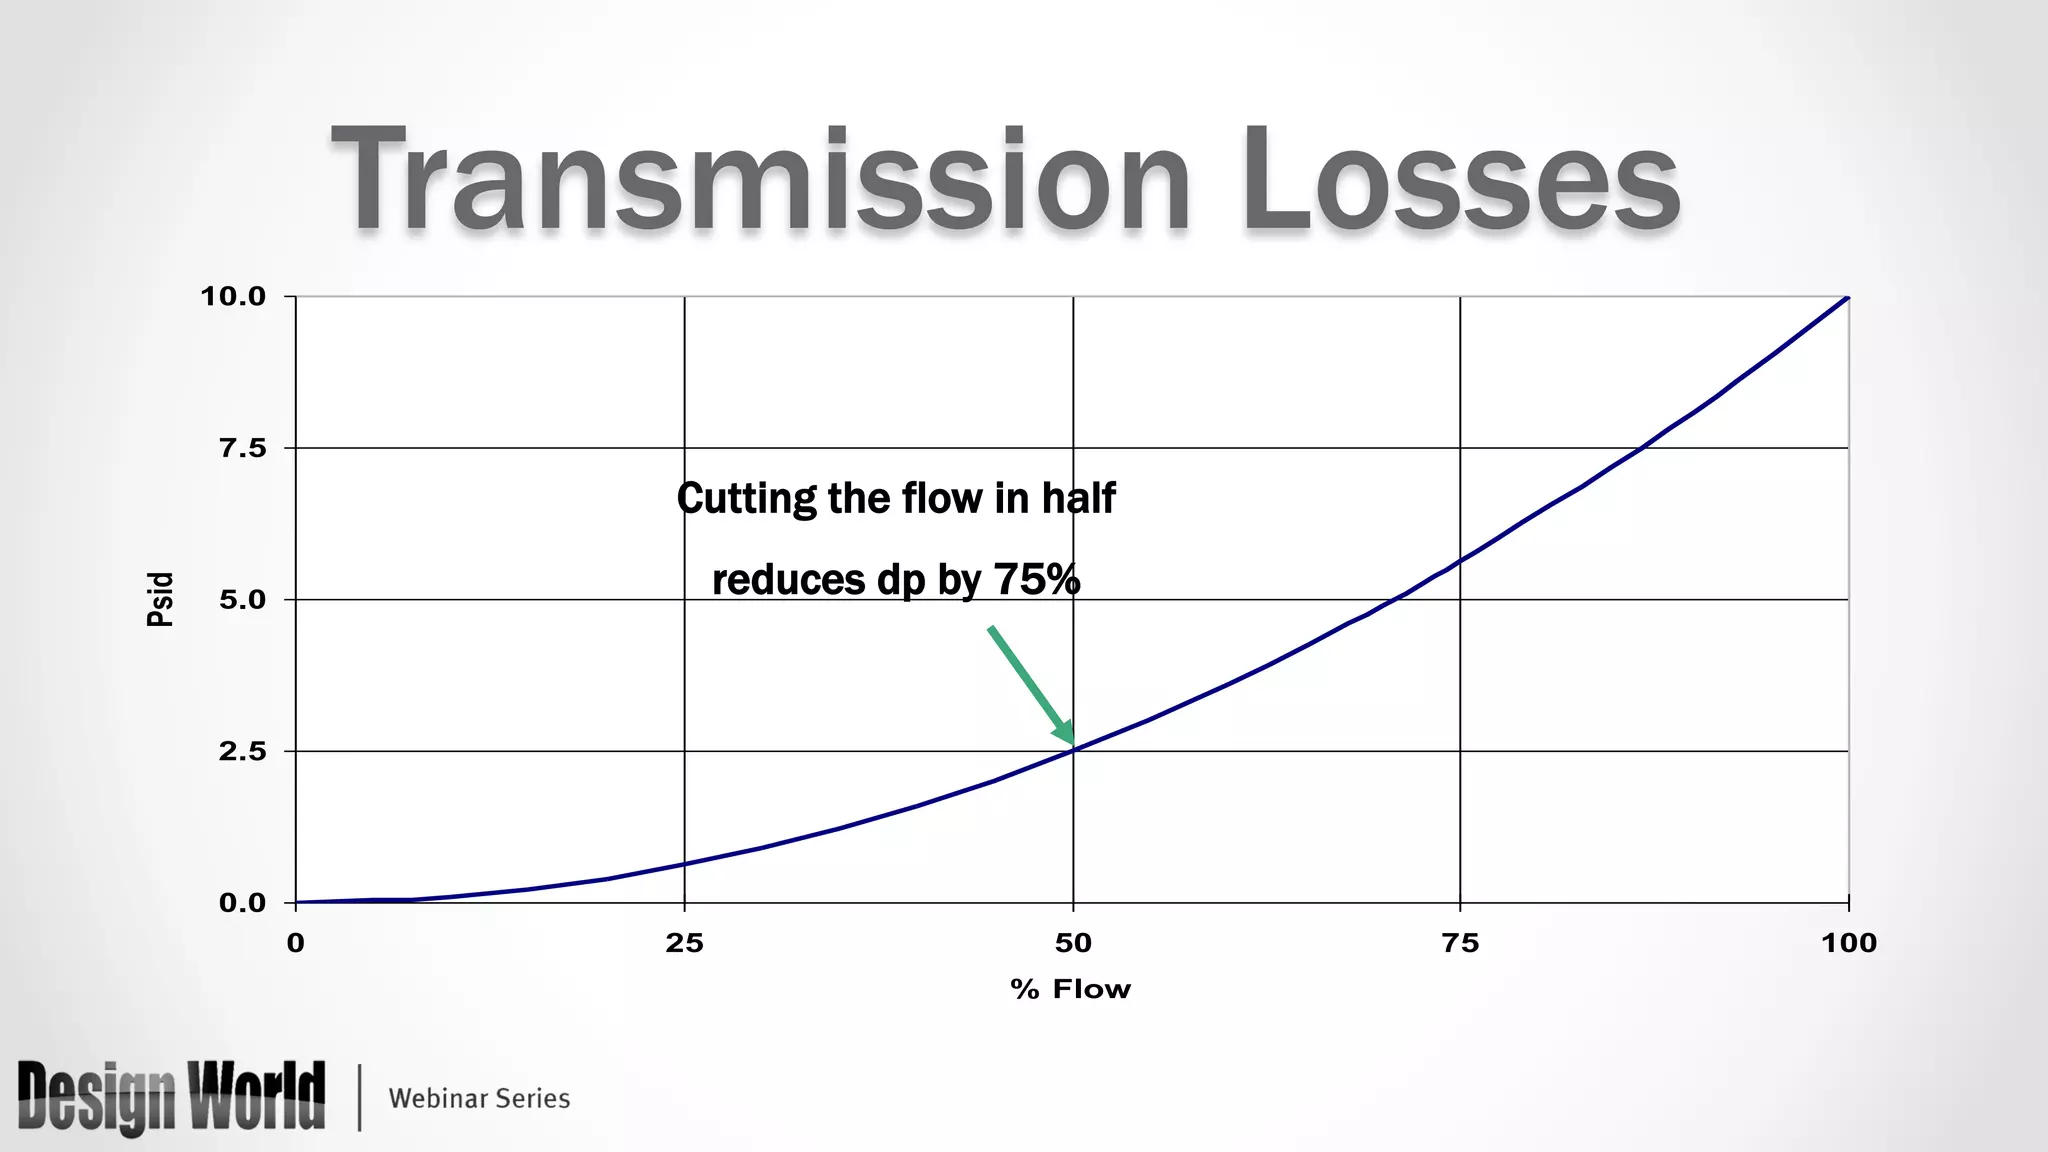
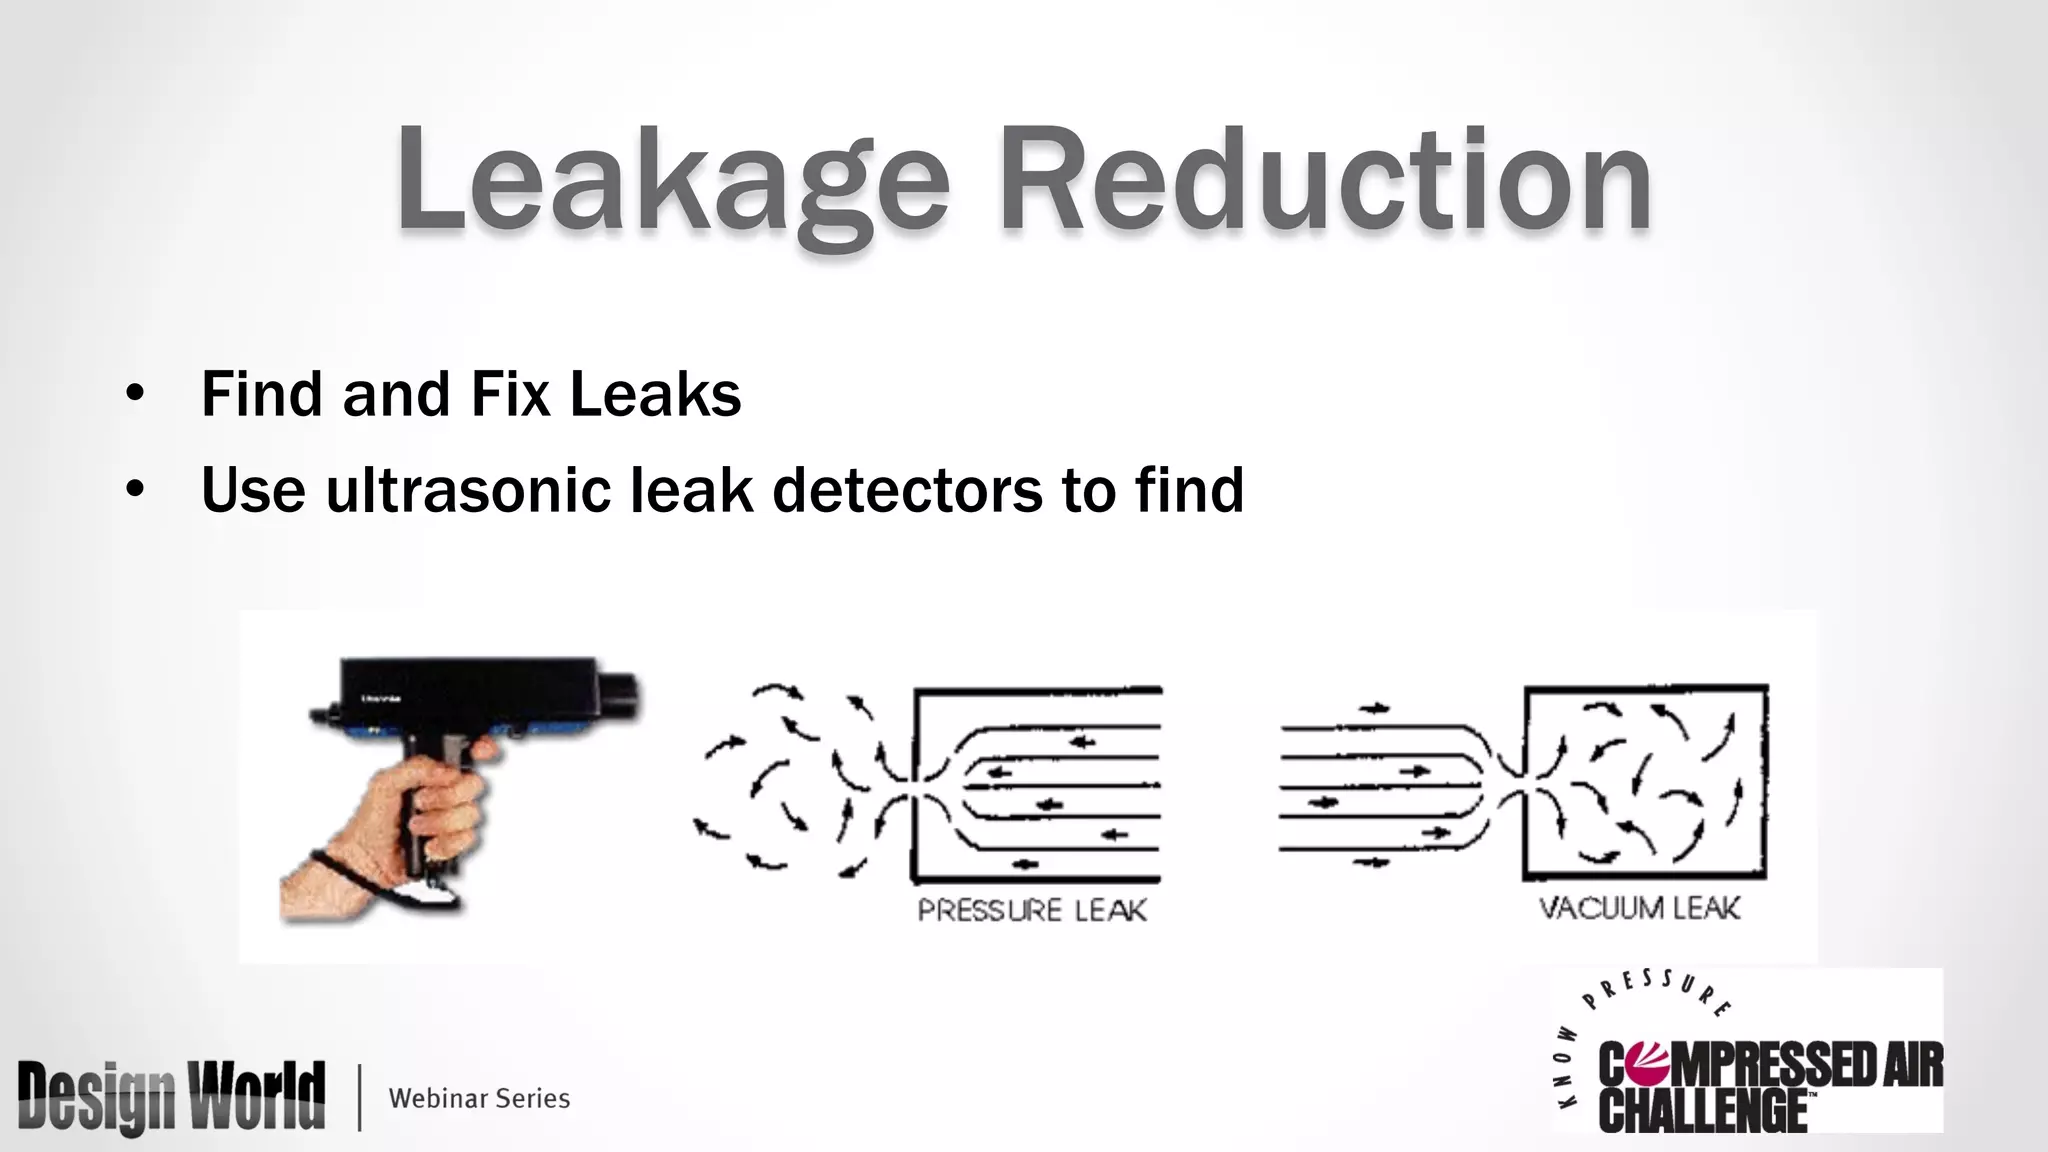
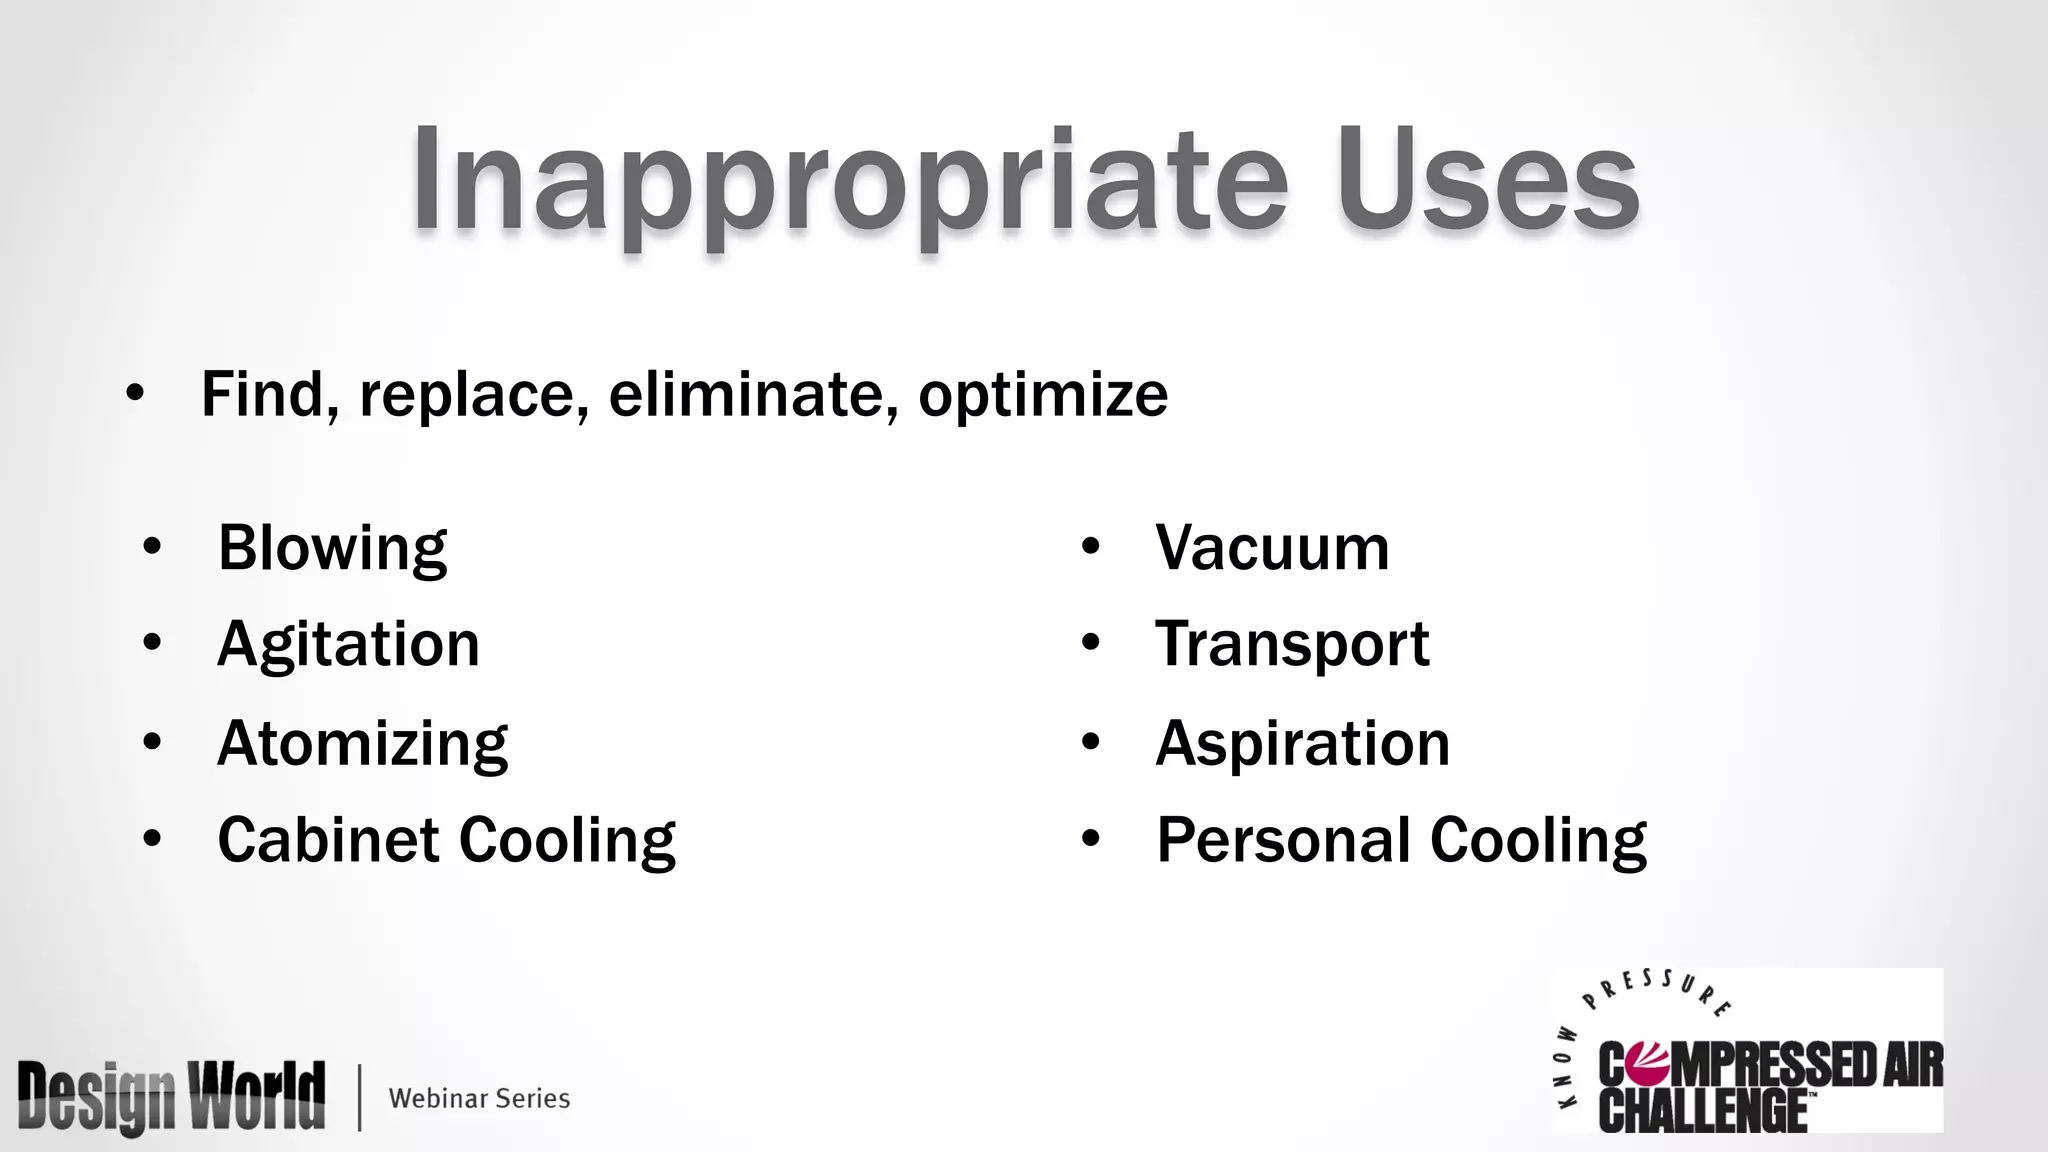
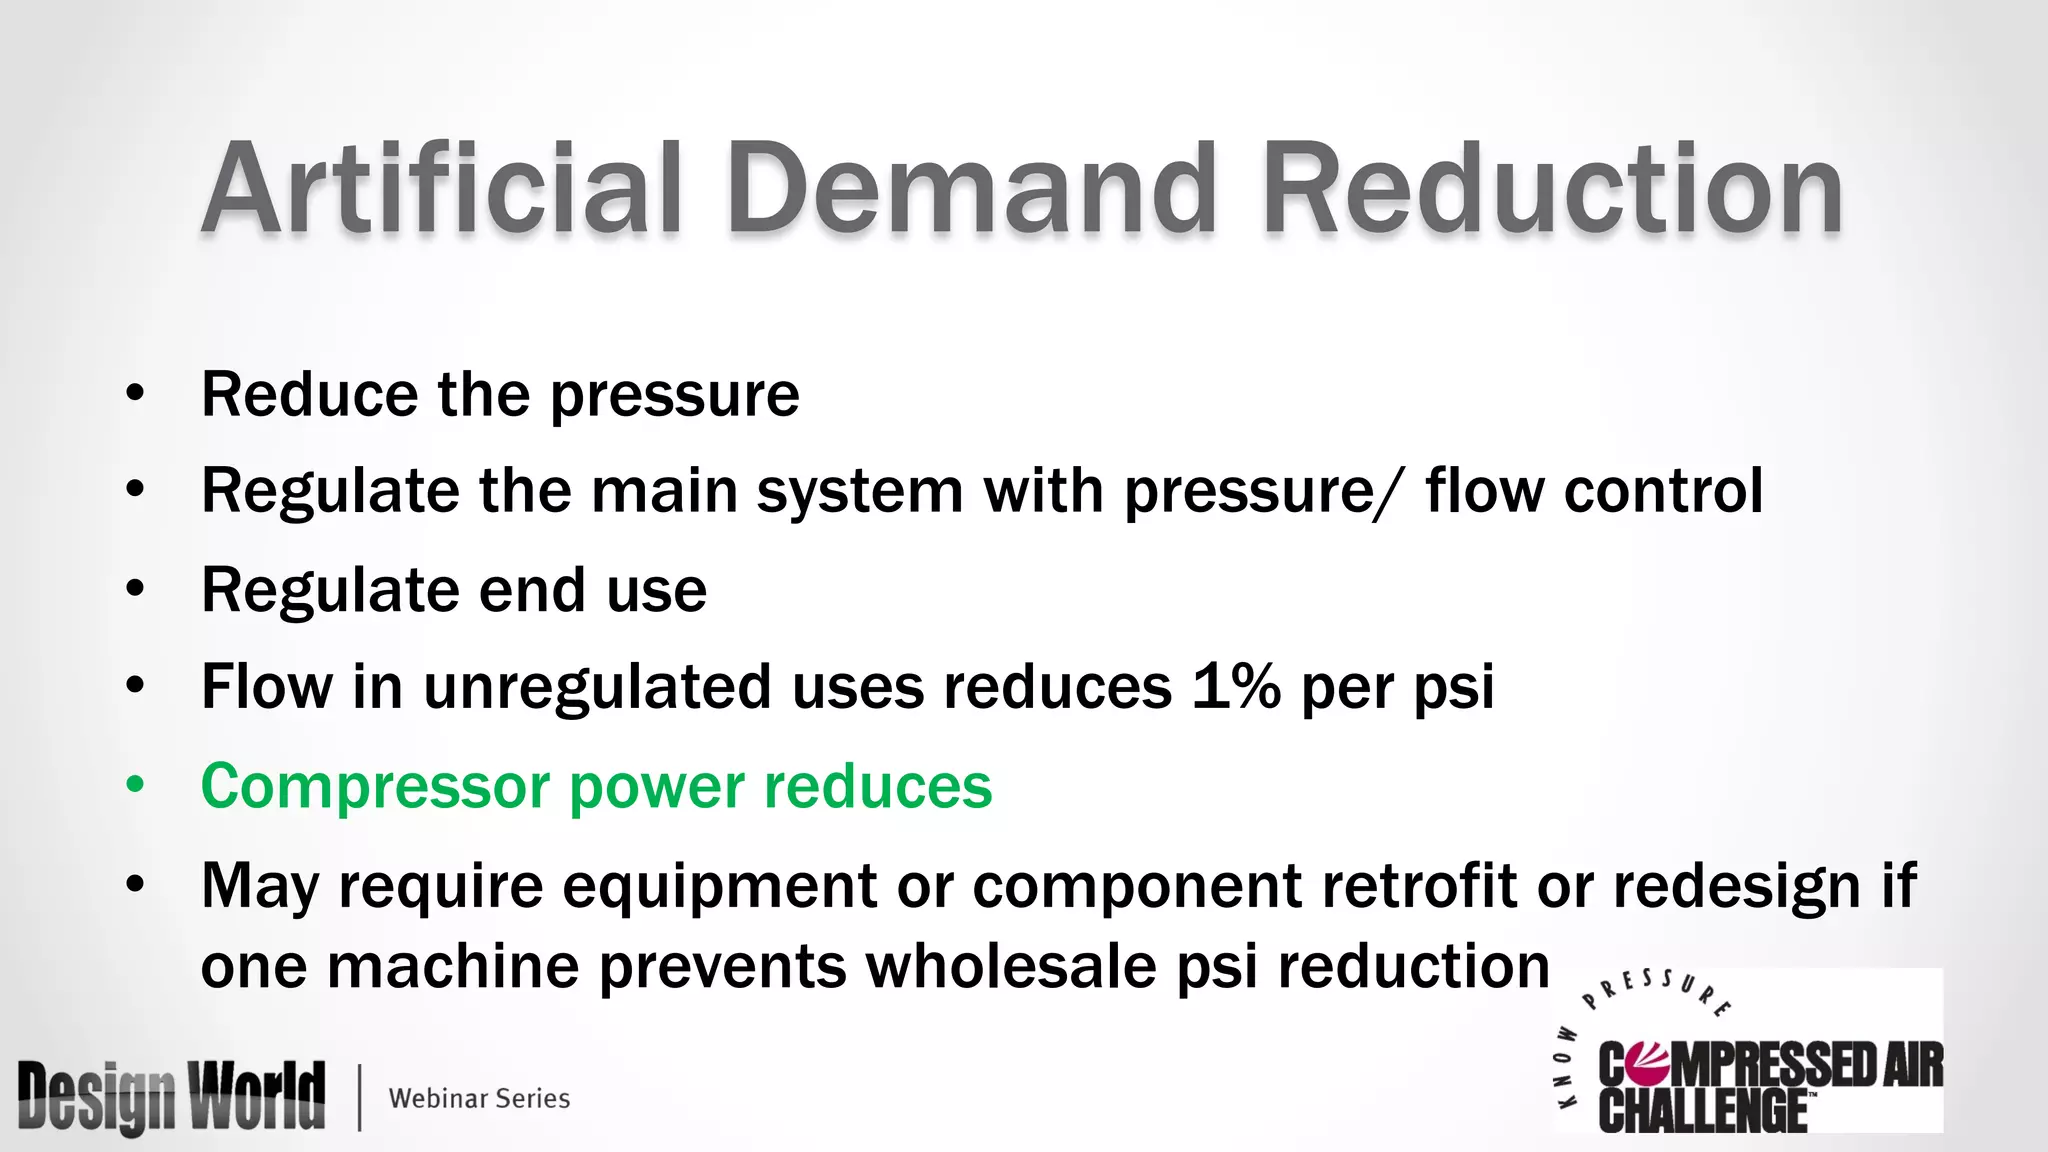
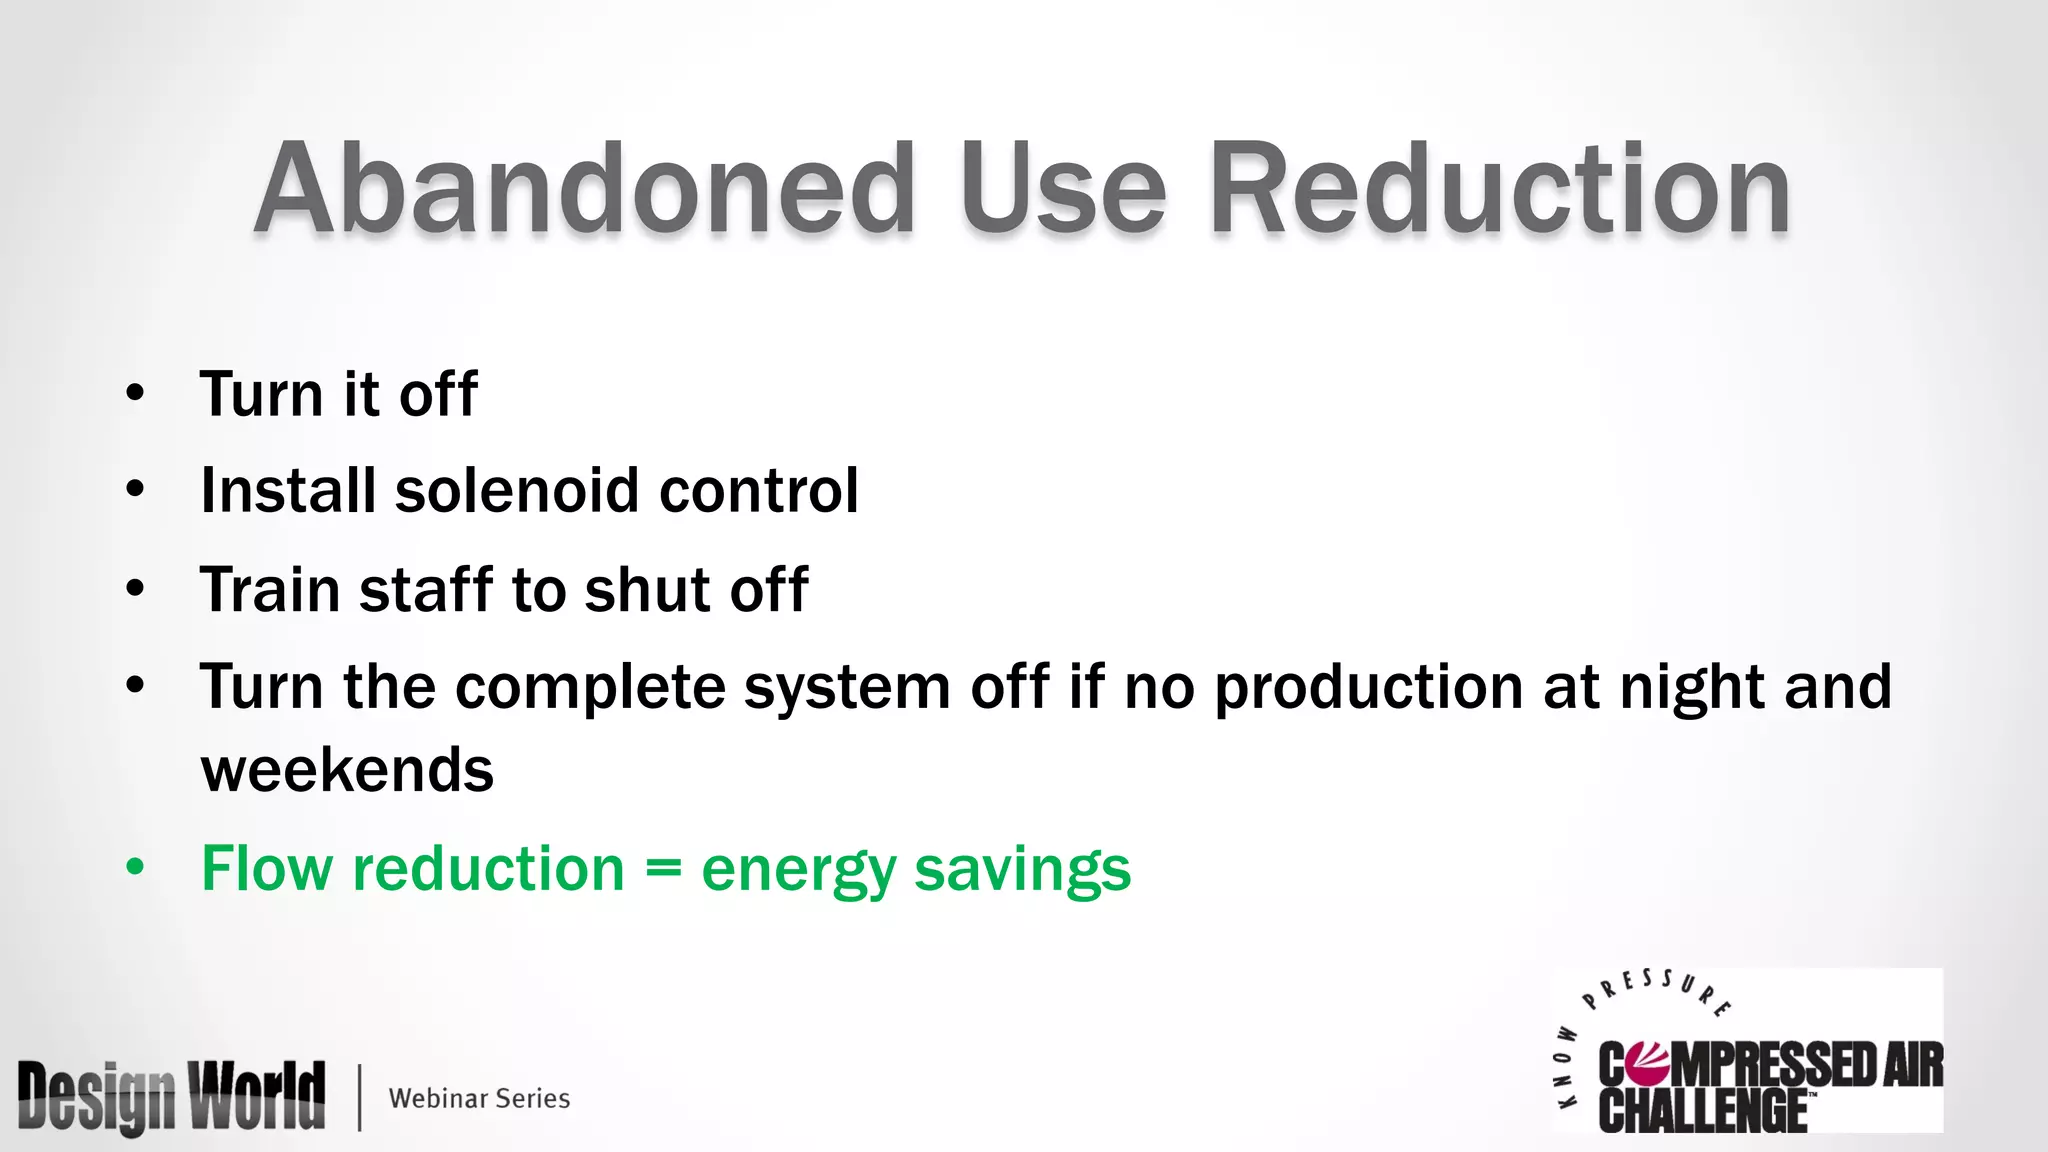
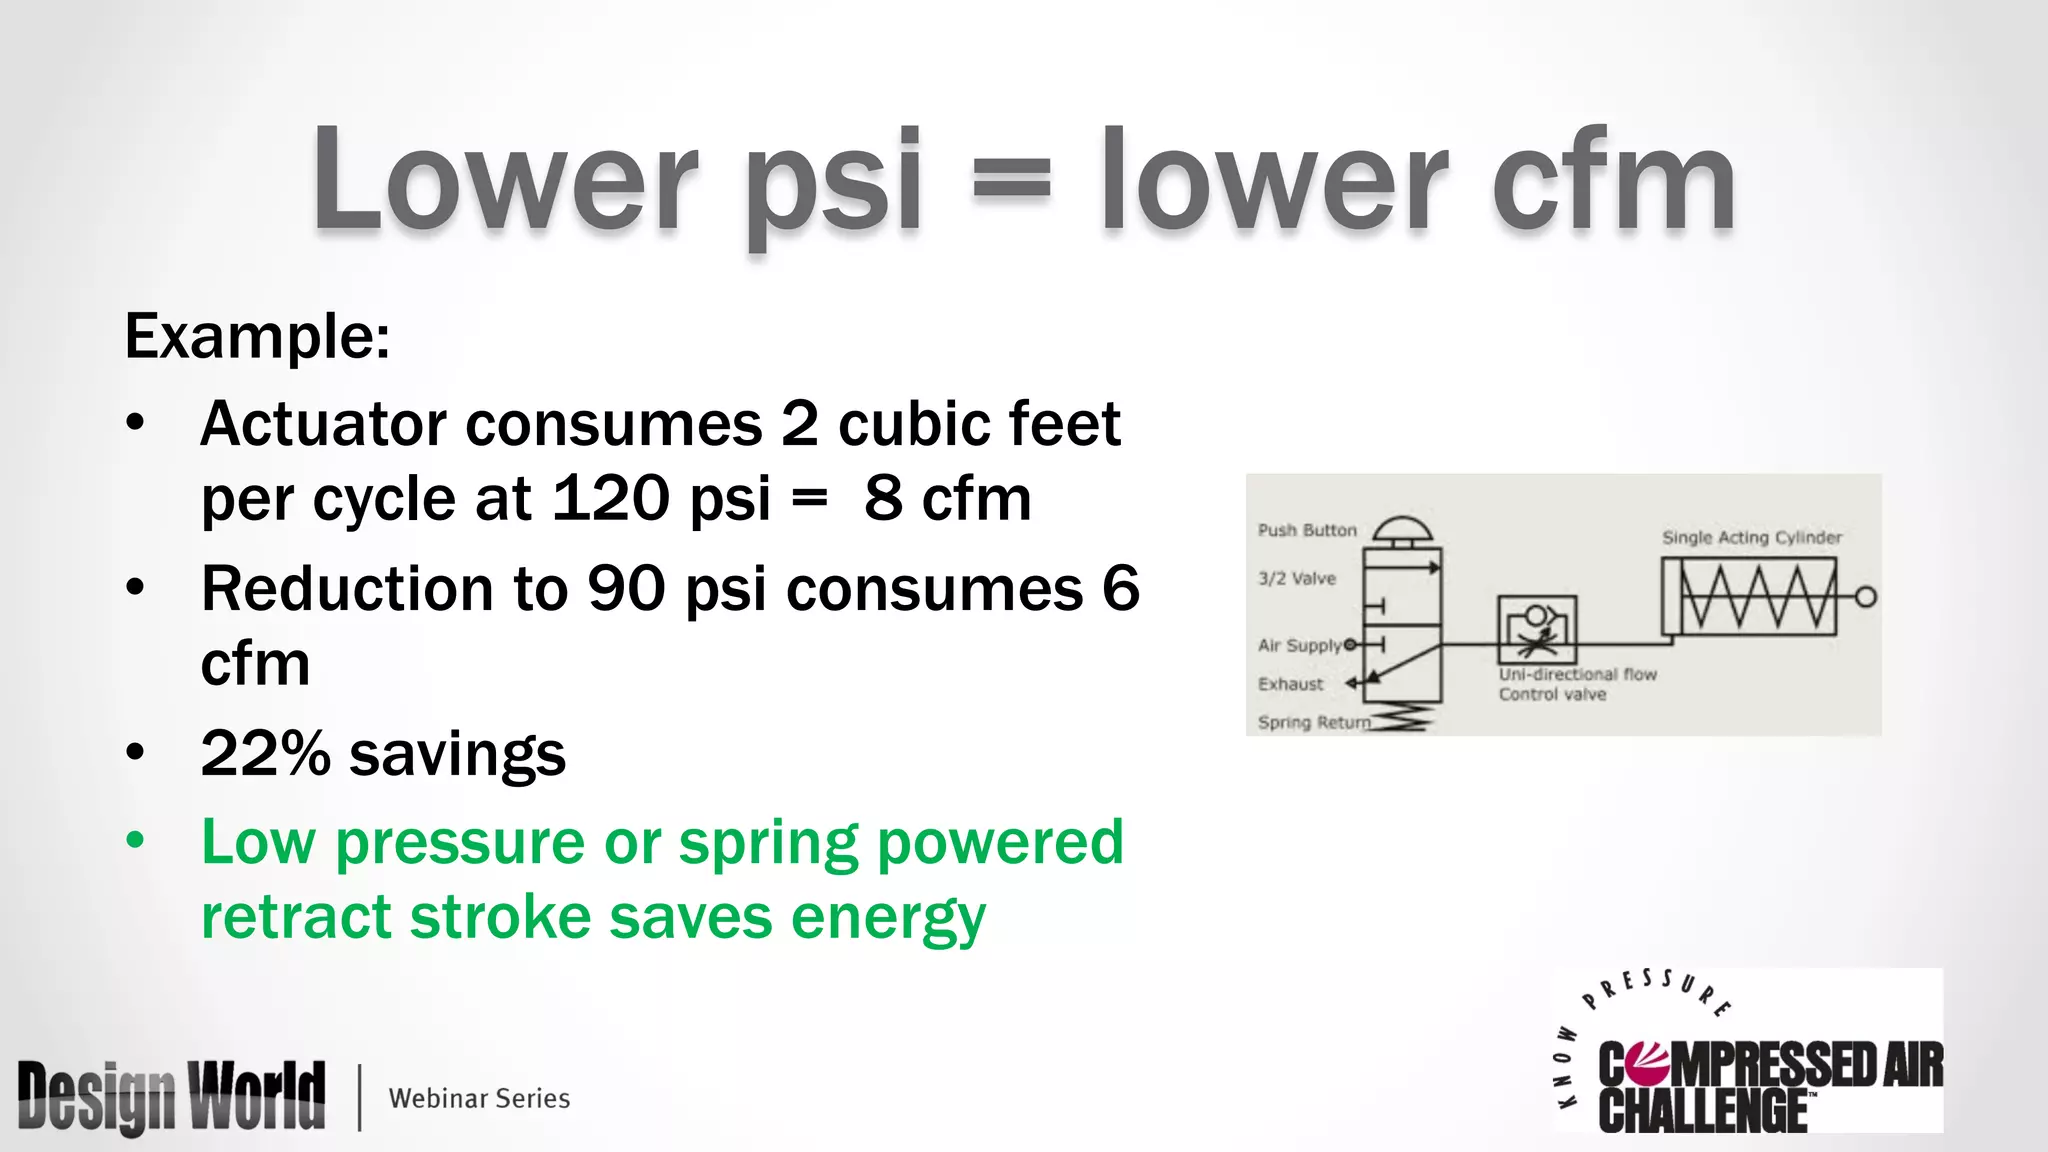
Why Compressed Air Is 
So Expensive and What 
to Do About It
Before We Start 
q This webinar will be available afterwards at 
www.designworldonline.com & via email 
q Q&A at the end of the presentation 
q Hashtag for this webinar: #DWwebinar
Moderator Presenter 
Mary Gannon 
Design World 
Ron Marshall 
Manitoba Hydro
Why Compressed Air Is So Expensive 
and 
What To Do About It
Presenter 
Ron Marshall 
• Technical Officer – Manitoba Hydro 
• 37 year Employee 
• 19 years Technical CA Support – POP 
• CAC Instructor 
• CAC Marketing Chairman
Coming Up 
• Why compressed air is so expensive 
• Three secrets of compressed air efficiency 
• The effects of system pressure 
• Improving how CA is produced 
• Transmitting CA more efficiently 
• Reducing waste and misuse
Cost of Compressed Air 
• Typical air cooled compressor Specific Power 
• 20 to 21 kW/100 cfm at 125 psi 
• 18 to 19 kW/100 cfm at 100 psi 
• For two shift/ 5 day $7,900 per 100 cfm 
• 24 x 7 operation $16,640 per 100 cfm 
• 10 cents per kWh, 100% loaded
Poor Production 
Efficiency 
Every 7.5 hp power input to the 
compressor results in only 1 hp 
output at the compressed air 
end use!
Example Air Motor 
Compressed Air Motor 
• 30 cfm input = 1 HP output 
• 5.7 kW input = 0.8 kW output 
$2,330 (compressed air) 
vs. $390 (electric) 
7 times more costly
Why Use Compressed Air? 
Compressed air systems are used in almost every sector of the 
economy, and there are thousands of different uses for 
compressed air. Air operated equipment: 
• Tends to be lighter and more maneuverable than electric 
• Deliver smooth power and are not damaged by overloading 
• Have the capability of infinitely variable speed and torque 
control 
• Are safer because they do not have the potential hazards of 
electrical devices, particularly when water and gases are present
Why Use Compressed Air? 
There are many applications where compressed air is the 
best overall solution 
• Whether its pneumatic tools, packaging, automation 
equipment, conveyors, controls systems, and others 
• When compressed air is needed to make a product, it 
should be used wisely due to the high cost of making the 
compressed air
Not real world conditions 
Previous calculation assumes lossless system 
Real systems have: 
• Leaks, artificial demand 
• Pressure losses 
• Inefficient compressed air production
Real System have losses
Leaks Add Waste 
Source: Carbon Trust 
Typical leak level 15 to 
30% 
Leaked air never 
makes it to the end 
use
Pressure Drop
Pressure Drop
Pressure – Rule of Thumb 
• Every 2 psi increase in discharge pressure 
results in 1 percent more energy 
consumption 
(Valid around 100 psi) 
• Makes real world compressed air cost 
more than the perfect system
Compressor Efficiency 
At full load
System Average Loading 
25 to 40% 
Study by Manitoba Hydro
Screw Compressor Characteristics 
40% flow = 82% kW = 2 x the cost
Additional Costs 
• Air dryers 
• Drains and condensate disposal 
• Cooling costs (fans, water, water treatment) 
• Maintenance 
• Equipment replacement
Real World Efficiency 
Real world example 
• Inefficient part load 
• 30% leaks 
• 30 psi pressure drop 
25 hp in = 1 hp out 
Perfect compressor 
• No part loading 
• No pressure drop 
• No waste 
7.5 hp in = 1 hp out 
This is why compressed air is so expensive
Things can improve 
Many of these additional costs are due to: 
• Poorly operating equipment due to improper system 
design 
• Poor maintenance practices 
• Use of production equipment with poor energy 
characteristics at part loads
Secrets to CA Efficiency
Secrets to CA Efficiency 
• Produce compressed air more efficiently 
• Use less compressed air 
• Use the heat of compression for something useful 
Source: ASME EA-4
Pressure Effects 
1/64’’ 1/32’’ 1/16’’ 1/8’’ 1/4’’ 3/8’’ 
70 psi .300 1.20 4.79 19.2 76.7 173 
80 psi .335 1.34 5.36 21.4 85.7 193 
90 psi .370 1.48 5.92 23.8 94.8 213 
100 psi .406 1.62 6.49 26.0 104 234 
125 psi .494 1.98 7.90 31.6 126 284
Pressure Effects 
1/64’’ 1/32’’ 1/16’’ 1/8’’ 1/4’’ 3/8’’ 
70 psi .300 1.20 4.79 19.2 76.7 173 
80 psi .335 1.34 5.36 21.4 85.7 193 
90 psi .370 1.48 5.92 23.8 94.8 213 
100 psi .406 1.62 6.49 26.0 104 234 
125 psi .494 1.98 7.90 31.6 126 284 
10 psi = 10% more flow
Pressure Effects 
• Every 2 psi increase in discharge psi 
increases power by 1% 
• Every 1 psi in pressure increases 
unregulated flow by 1% 
• This increased flow further increases the 
compressor power 
• Power increase depends on control mode
Improving the Supply Side 
• More efficient compressor and dryer control 
o Adding storage 
o Operating in a different control mode 
• Lower discharge pressure 
• More efficient compressors and dryers 
• Improved maintenance 
• Improved ambient conditions
Improving the Supply Side 
Automobile analogy 
• Modulation 
• Load/Unload 
• Start/Stop 
• VSD
Control Improvements 
• Adding storage 
100 
90 
80 
70 
60 
50 
40 
30 
20 
10 
0 
0 10 20 30 40 50 60 70 80 90 100 
Percent Output 
Percent FL kW 
Modulating 
Load/Unload Small Tank 
Load/Unload Big Tank 
VSD or Start/Stop
Control Improvements 
• Control Change 
100 
90 
80 
70 
60 
50 
40 
30 
20 
10 
0 
0 10 20 30 40 50 60 70 80 90 100 
Percent Output 
Percent FL kW 
Modulating 
Load/Unload Small Tank 
Load/Unload Big Tank 
VSD or Start/Stop
Control Improvements 
• Sequencing compressor controls 
• Cycling refrigerated air dryers 
• Dew point controlled desiccant dryers 
• Reduced purge desiccant dryers (externally heated or 
blower purge) 
• Controls that turn off production equipment when not 
required (nights, weekends)
Maintenance and Ambient 
• Clogged filters decreases compressor efficiency 
• Clogged coolers causes high temperatures and water 
problems forcing more compressed air drainage 
• Cooler compressors produce more efficiently 
• Negative room pressures reduce efficiency 
• Heat from compressor rooms can be directed where 
needed
Transmission Losses 
Distribution Pipes 
Local Components
Transmission Losses 
10.0 
7.5 
Cutting the flow in half 
reduces dp by 75% 
Psid 
5.0 
2.5 
0.0 
% Flow 0 25 50 75 100
Reducing Transmission Loss 
• Pressure drop reduction reduces to the square of the flow 
reduction 
• Loop piping rather than radial feeds 
• Increase piping size 
• Filters, regulators, lubricators sized for peak 
• Hoses, connectors, fittings sized for peak
Peak vs Average 
Example: 
• Actuator consumes 2 cubic feet per 1 
second cycle, 4 times per minute 
= 8 cfm average 
• 2 cubic feet in one second is a peak flow 
rate of 120 cfm 
• Components and supply lines sized for 
average would be grossly undersized 
• Resulting pressure drop increases 
required compressor discharge pressure
Reducing Transmission Loss 
Piping system and hoses DP reduction (almost like magic) 
• Upgrade from 1 ½ to 2 inch pipe reduces dp by 73% 
• Increase 1/4 inch hose to 3/8 reduces by 88% 
• Decreased pressure drop allows lower compressor 
discharge pressure
Reducing the Demand Side 
• Leakage reduction 
• Inappropriate use optimization 
• Artificial demand elimination 
• Abandoned use reduction 
• Regulated end use pressure 
• Proper component design
Leakage Reduction 
• Find and Fix Leaks 
• Use ultrasonic leak detectors to find
Inappropriate Uses 
• Find, replace, eliminate, optimize 
• Blowing 
• Agitation 
• Atomizing 
• Cabinet Cooling 
• Vacuum 
• Transport 
• Aspiration 
• Personal Cooling
Artificial Demand Reduction 
• Reduce the pressure 
• Regulate the main system with pressure/ flow control 
• Regulate end use 
• Flow in unregulated uses reduces 1% per psi 
• Compressor power reduces 
• May require equipment or component retrofit or redesign if 
one machine prevents wholesale psi reduction
Abandoned Use Reduction 
• Turn it off 
• Install solenoid control 
• Train staff to shut off 
• Turn the complete system off if no production at night and 
weekends 
• Flow reduction = energy savings
Lower psi = lower cfm 
Example: 
• Actuator consumes 2 cubic feet 
per cycle at 120 psi = 8 cfm 
• Reduction to 90 psi consumes 6 
cfm 
• 22% savings 
• Low pressure or spring powered 
retract stroke saves energy
Low psi drop = lower cfm 
• Poorly designed 
components cause 
discharge pressure increase 
• Pressure increase causes 
artificial demand and higher 
compressor power 
• Properly size components 
for savings
Summary 
• Compressed air is expensive, more expensive if wasted 
and produced by inefficient equipment 
• Secret to produce efficiently and use less. Keep the heat. 
• High pressure costs money 
• Production of compressed air can be made more efficent 
• Reducing pressure loss in transmission saves energy 
• Reducing waste and misuse lowers costs
Where to Get Help 
• Additional training from CAC 
• Compressed Air Best 
Practices Manual 
• Visit CAC website: 
www.compressedairchallenge.org 
o Tools 
o Articles 
o Training Links 
o LinkedIn Discussion
Questions? 
Mary Gannon 
Design World 
mgannon@wtwhmedia.com 
Twitter: @DW_MaryGannon 
Ron Marshall 
Manitoba Hydro 
rcmarshall@hydro.mb.ca 
Phone: 204.360.3658
Thank You 
q This webinar will be available at 
designworldonline.com & email 
q Tweet with hashtag #DWwebinar 
q Connect with Design World 
q Discuss this on EngineeringExchange.com

Why compressed air is so expensive and what to do about it

  • 1.
    Why Compressed AirIs So Expensive and What to Do About It
  • 2.
    Before We Start q This webinar will be available afterwards at www.designworldonline.com & via email q Q&A at the end of the presentation q Hashtag for this webinar: #DWwebinar
  • 3.
    Moderator Presenter MaryGannon Design World Ron Marshall Manitoba Hydro
  • 4.
    Why Compressed AirIs So Expensive and What To Do About It
  • 5.
    Presenter Ron Marshall • Technical Officer – Manitoba Hydro • 37 year Employee • 19 years Technical CA Support – POP • CAC Instructor • CAC Marketing Chairman
  • 6.
    Coming Up •Why compressed air is so expensive • Three secrets of compressed air efficiency • The effects of system pressure • Improving how CA is produced • Transmitting CA more efficiently • Reducing waste and misuse
  • 7.
    Cost of CompressedAir • Typical air cooled compressor Specific Power • 20 to 21 kW/100 cfm at 125 psi • 18 to 19 kW/100 cfm at 100 psi • For two shift/ 5 day $7,900 per 100 cfm • 24 x 7 operation $16,640 per 100 cfm • 10 cents per kWh, 100% loaded
  • 8.
    Poor Production Efficiency Every 7.5 hp power input to the compressor results in only 1 hp output at the compressed air end use!
  • 9.
    Example Air Motor Compressed Air Motor • 30 cfm input = 1 HP output • 5.7 kW input = 0.8 kW output $2,330 (compressed air) vs. $390 (electric) 7 times more costly
  • 10.
    Why Use CompressedAir? Compressed air systems are used in almost every sector of the economy, and there are thousands of different uses for compressed air. Air operated equipment: • Tends to be lighter and more maneuverable than electric • Deliver smooth power and are not damaged by overloading • Have the capability of infinitely variable speed and torque control • Are safer because they do not have the potential hazards of electrical devices, particularly when water and gases are present
  • 11.
    Why Use CompressedAir? There are many applications where compressed air is the best overall solution • Whether its pneumatic tools, packaging, automation equipment, conveyors, controls systems, and others • When compressed air is needed to make a product, it should be used wisely due to the high cost of making the compressed air
  • 12.
    Not real worldconditions Previous calculation assumes lossless system Real systems have: • Leaks, artificial demand • Pressure losses • Inefficient compressed air production
  • 13.
  • 14.
    Leaks Add Waste Source: Carbon Trust Typical leak level 15 to 30% Leaked air never makes it to the end use
  • 15.
  • 16.
  • 17.
    Pressure – Ruleof Thumb • Every 2 psi increase in discharge pressure results in 1 percent more energy consumption (Valid around 100 psi) • Makes real world compressed air cost more than the perfect system
  • 18.
  • 19.
    System Average Loading 25 to 40% Study by Manitoba Hydro
  • 20.
    Screw Compressor Characteristics 40% flow = 82% kW = 2 x the cost
  • 21.
    Additional Costs •Air dryers • Drains and condensate disposal • Cooling costs (fans, water, water treatment) • Maintenance • Equipment replacement
  • 22.
    Real World Efficiency Real world example • Inefficient part load • 30% leaks • 30 psi pressure drop 25 hp in = 1 hp out Perfect compressor • No part loading • No pressure drop • No waste 7.5 hp in = 1 hp out This is why compressed air is so expensive
  • 23.
    Things can improve Many of these additional costs are due to: • Poorly operating equipment due to improper system design • Poor maintenance practices • Use of production equipment with poor energy characteristics at part loads
  • 24.
    Secrets to CAEfficiency
  • 25.
    Secrets to CAEfficiency • Produce compressed air more efficiently • Use less compressed air • Use the heat of compression for something useful Source: ASME EA-4
  • 26.
    Pressure Effects 1/64’’1/32’’ 1/16’’ 1/8’’ 1/4’’ 3/8’’ 70 psi .300 1.20 4.79 19.2 76.7 173 80 psi .335 1.34 5.36 21.4 85.7 193 90 psi .370 1.48 5.92 23.8 94.8 213 100 psi .406 1.62 6.49 26.0 104 234 125 psi .494 1.98 7.90 31.6 126 284
  • 27.
    Pressure Effects 1/64’’1/32’’ 1/16’’ 1/8’’ 1/4’’ 3/8’’ 70 psi .300 1.20 4.79 19.2 76.7 173 80 psi .335 1.34 5.36 21.4 85.7 193 90 psi .370 1.48 5.92 23.8 94.8 213 100 psi .406 1.62 6.49 26.0 104 234 125 psi .494 1.98 7.90 31.6 126 284 10 psi = 10% more flow
  • 28.
    Pressure Effects •Every 2 psi increase in discharge psi increases power by 1% • Every 1 psi in pressure increases unregulated flow by 1% • This increased flow further increases the compressor power • Power increase depends on control mode
  • 29.
    Improving the SupplySide • More efficient compressor and dryer control o Adding storage o Operating in a different control mode • Lower discharge pressure • More efficient compressors and dryers • Improved maintenance • Improved ambient conditions
  • 30.
    Improving the SupplySide Automobile analogy • Modulation • Load/Unload • Start/Stop • VSD
  • 31.
    Control Improvements •Adding storage 100 90 80 70 60 50 40 30 20 10 0 0 10 20 30 40 50 60 70 80 90 100 Percent Output Percent FL kW Modulating Load/Unload Small Tank Load/Unload Big Tank VSD or Start/Stop
  • 32.
    Control Improvements •Control Change 100 90 80 70 60 50 40 30 20 10 0 0 10 20 30 40 50 60 70 80 90 100 Percent Output Percent FL kW Modulating Load/Unload Small Tank Load/Unload Big Tank VSD or Start/Stop
  • 33.
    Control Improvements •Sequencing compressor controls • Cycling refrigerated air dryers • Dew point controlled desiccant dryers • Reduced purge desiccant dryers (externally heated or blower purge) • Controls that turn off production equipment when not required (nights, weekends)
  • 34.
    Maintenance and Ambient • Clogged filters decreases compressor efficiency • Clogged coolers causes high temperatures and water problems forcing more compressed air drainage • Cooler compressors produce more efficiently • Negative room pressures reduce efficiency • Heat from compressor rooms can be directed where needed
  • 35.
    Transmission Losses DistributionPipes Local Components
  • 36.
    Transmission Losses 10.0 7.5 Cutting the flow in half reduces dp by 75% Psid 5.0 2.5 0.0 % Flow 0 25 50 75 100
  • 37.
    Reducing Transmission Loss • Pressure drop reduction reduces to the square of the flow reduction • Loop piping rather than radial feeds • Increase piping size • Filters, regulators, lubricators sized for peak • Hoses, connectors, fittings sized for peak
  • 38.
    Peak vs Average Example: • Actuator consumes 2 cubic feet per 1 second cycle, 4 times per minute = 8 cfm average • 2 cubic feet in one second is a peak flow rate of 120 cfm • Components and supply lines sized for average would be grossly undersized • Resulting pressure drop increases required compressor discharge pressure
  • 39.
    Reducing Transmission Loss Piping system and hoses DP reduction (almost like magic) • Upgrade from 1 ½ to 2 inch pipe reduces dp by 73% • Increase 1/4 inch hose to 3/8 reduces by 88% • Decreased pressure drop allows lower compressor discharge pressure
  • 40.
    Reducing the DemandSide • Leakage reduction • Inappropriate use optimization • Artificial demand elimination • Abandoned use reduction • Regulated end use pressure • Proper component design
  • 41.
    Leakage Reduction •Find and Fix Leaks • Use ultrasonic leak detectors to find
  • 42.
    Inappropriate Uses •Find, replace, eliminate, optimize • Blowing • Agitation • Atomizing • Cabinet Cooling • Vacuum • Transport • Aspiration • Personal Cooling
  • 43.
    Artificial Demand Reduction • Reduce the pressure • Regulate the main system with pressure/ flow control • Regulate end use • Flow in unregulated uses reduces 1% per psi • Compressor power reduces • May require equipment or component retrofit or redesign if one machine prevents wholesale psi reduction
  • 44.
    Abandoned Use Reduction • Turn it off • Install solenoid control • Train staff to shut off • Turn the complete system off if no production at night and weekends • Flow reduction = energy savings
  • 45.
    Lower psi =lower cfm Example: • Actuator consumes 2 cubic feet per cycle at 120 psi = 8 cfm • Reduction to 90 psi consumes 6 cfm • 22% savings • Low pressure or spring powered retract stroke saves energy
  • 46.
    Low psi drop= lower cfm • Poorly designed components cause discharge pressure increase • Pressure increase causes artificial demand and higher compressor power • Properly size components for savings
  • 47.
    Summary • Compressedair is expensive, more expensive if wasted and produced by inefficient equipment • Secret to produce efficiently and use less. Keep the heat. • High pressure costs money • Production of compressed air can be made more efficent • Reducing pressure loss in transmission saves energy • Reducing waste and misuse lowers costs
  • 48.
    Where to GetHelp • Additional training from CAC • Compressed Air Best Practices Manual • Visit CAC website: www.compressedairchallenge.org o Tools o Articles o Training Links o LinkedIn Discussion
  • 49.
    Questions? Mary Gannon Design World mgannon@wtwhmedia.com Twitter: @DW_MaryGannon Ron Marshall Manitoba Hydro rcmarshall@hydro.mb.ca Phone: 204.360.3658
  • 50.
    Thank You qThis webinar will be available at designworldonline.com & email q Tweet with hashtag #DWwebinar q Connect with Design World q Discuss this on EngineeringExchange.com