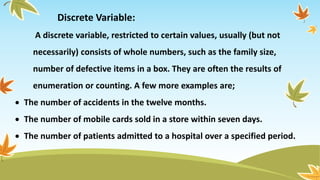
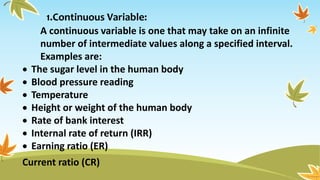
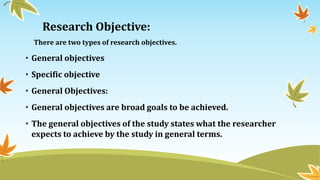
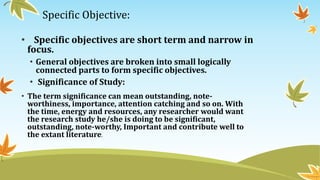
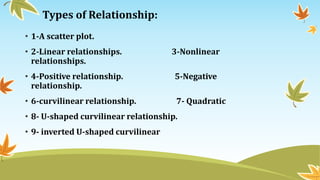
This document discusses the key concepts of research including:
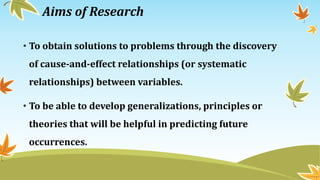
- Research aims to establish facts or principles through careful, systematic study.
- The main aims of research are to solve problems and develop theories to predict future occurrences.
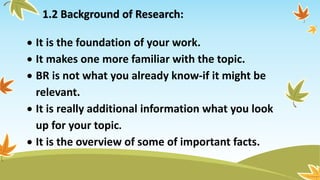
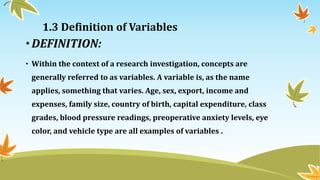
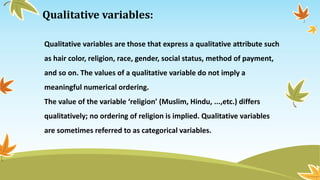
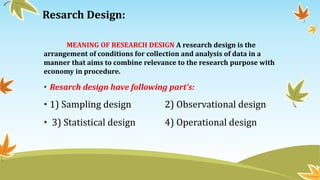
- Research methodology refers to the systematic approach used to study a research problem, including steps like defining variables, sampling, and data analysis.
- Key parts of research design include the sampling method, observational design, statistical analysis, and operational aspects.